validation of laboratory cracking tests for field top-down
TRANSCRIPT

Validation of Laboratory Cracking Tests for Field Top-down Cracking Performance
by
Chen Chen
A dissertation submitted to the Graduate Faculty of
Auburn University
in partial fulfillment of the
requirements for the Degree of
Doctor of Philosophy
Auburn, Alabama
May 2, 2020
Keywords: Top-down Cracking, Laboratory Cracking Tests, Field Cracking Performance,
Critical Loose Mixture Aging, Correlation
Copyright 2020 by Chen Chen
Approved by
Randy West, Chair, Director, National Center for Asphalt Technology
Nam Tran, Assistant Director, National Center for Asphalt Technology
Fan Yin, Assistant Research Professor, National Center for Asphalt Technology
Benjamin Bowers, Assistant Professor, Civil Engineering
Maria Auad, Director and Professor, Chemical Engineering

2
ABSTRACT
Top-down cracking (TDC) has been widely reported as a primary mode of distress in
asphalt pavements. Currently there is no consensus on a practical laboratory cracking test that
can reliably predict an asphalt mixture’s resistance to TDC. Age hardening of asphalt binder has
been identified as a critical factor that contributes to the development of TDC. Thus, laboratory
specimens should be conditioned prior to testing to simulate the aging of pavements in-service.
However, there is insufficient guidance on an appropriate aging protocol to simulate the critical
field aging condition when TDC starts to develop. To address these needs regarding TDC, this
study had two objectives: 1) identify the field aging condition when TDC starts to develop, then
determine a laboratory aging protocol to condition asphalt mixtures for TDC evaluations; 2)
evaluate the ability of laboratory cracking tests to identify mixtures resistant to TDC based on
measured cracking performance in the real pavements using real loading conditions.
In 2015, National Center for Asphalt Technology (NCAT) initiated an experiment on the
NCAT Test Track (hereinafter referred to as the NCAT TDC experiment). Seven surface
mixtures with a range of cracking susceptibilities were designed and constructed as a 1.5-inch
surface layer on top of highly modified base and binder layers. After construction, truck traffic
was applied to the test sections. Field cracking has been monitored weekly throughout the
experiment. Six laboratory cracking tests were selected by the experiment sponsors: Energy
Ratio (ER), the Texas Overlay Test (TX-OT), the NCAT Modified Overlay Test (NCAT-OT),
the Semi-Circular Bend test (SCB), the Illinois Flexibility Index Test (I-FIT), and the indirect
tensile asphalt cracking test (IDEAL-CT).
A literature review was first conducted to determine the field aging condition for
evaluating TDC. Data from a number of existing pavements showed that TDC typically initiated

3
after approximately 70,000 cumulative degree-days (CDD). Both plant loose mixtures and field
cores from five field projects in three states were used to determine an aging protocol that was
representative of this critical CDD. The loose mixtures from each project were conditioned using
four loose mixture aging protocols, including a 6-hour, 135°C protocol, a 12-hour, 135°C
protocol, a 24-hour, 135°C protocol, and a 5-day, 95°C protocol. Asphalt binder extracted from
conditioned loose mixtures and field cores were tested using a dynamic shear rheometer (DSR),
a bending beam rheometer (BBR), and Fourier Transform Infrared Spectroscopy (FT-IR). Test
results showed that the 5-day, 95°C protocol was most representative of 70,000 CDD of field
aging, and an 8-hour, 135°C and 5-day, 95°C protocol was likely to achieve an equivalent aging
level. Thus, the more practical 8-hour, 135°C protocol was selected for the remaining study to
simulate 70,000 CDD of field aging.
Two candidate critical aging (CA) protocols for loose mixture aging, 5 days at 95°C and
8 hours at 135°C, were further evaluated using four NCAT TDC experimental mixtures. For
each mixture, the plant loose mixtures were conditioned using both protocols. Field cores were
also collected annually after construction. Mixture and binder properties of the conditioned loose
mixtures and field cores were tested and compared using I-FIT, IDEAL-CT, small-specimen
Asphalt Mixture Performance Tester (AMPT) cyclic fatigue, linear amplitude (LAS), double-
edge-notched tension (DENT), DSR, BBR, and FT-IR tests. Test results showed inconsistent
trends when comparing two candidate CA protocols. Only I-FIT results indicated no significant
difference between two protocols. Most of the asphalt binder and mixture properties indicated
that two candidate CA protocols yielded a more severe aging level than 4 years field aging in
Alabama.

4
Seven NCAT TDC mixtures, including both plant-produced and laboratory-prepared
mixtures, were conditioned and tested using the six selected cracking tests. Test results were
utilized to conduct comparison, sensitivity, and correlation analyses. No significant differences
were identified between plant mixture and laboratory mixture results after critical aging for all
the mixture cracking test parameters. In addition, all the cracking test parameters of I-FIT,
IDEAL-CT, and both OT tests were sensitive to aging for plant and laboratory mixtures. ER and
Jc were not sensitive to aging for both plant mixtures and laboratory mixtures. Some cracking
test parameters were found to be sensitive to air voids, recycled asphalt mixture, and modified
binder for certain conditions, but not in every case considering combinations of plant- and lab-
produces mixtures with short-term and critically aged conditioning. Based on mean value
analysis, only NCAT-β was sensitive to all the influence factors for plant mixture at both aging
conditions. The cracking test parameters of both OT tests were sensitive to all the influence
factors for laboratory mixtures. Strong positive linear correlations exist among NCAT-Nf, TX-
Nf, FI, and CTIndex results, and there are strong power relationships between the Nf and β
parameters for both OT tests.
The field cracking performance of seven test sections were utilized to evaluate the
laboratory cracking test results. After approximately 15 million ESALs and 73,728 CDD,
sections N1, N2, N5, and N8 exhibited a range of cracking severity and extent. Section N8 with
5% RAS had the highest cracking percentage of 70.7% of the lane area. No measurable cracks
were found in sections S5, S6 or S13. The Pearson’s correlation coefficient (rp) results indicated
that NCAT-β and TX-β generally have a very strong linear correlation with the field cracking
performance for both plant mixtures and laboratory mixtures at both aging conditions. DCSEMin,
TX-Nf, TX-β, NCAT-Nf, NCAT-β, FI, and CTIndex correctly identified mixture N8 as the most

5
susceptible to TDC for both plant mixtures and laboratory mixtures at both aging conditions. ER
did not identify mixture N8 as the most susceptible to TDC. No cracking test parameter
discriminated uncracked sections from cracked sections for both plant mixture and laboratory
mixture at both aging conditions.
The test sections will remain in place for additional trafficking and environmental aging
on the NCAT Test Track. This ongoing work will help further validate the aging protocols and
identify the best test for determining the TDC susceptibility of asphalt mixtures for possible use
in mix design and quality assurance.

6
ACKNOWLEDGMENTS
I would like to sincerely thank my advisor and committee chair, Dr. Randy West, for his
guidance and support during my Ph.D. period. I really appreciated the opportunity he provided to
study at NCAT and have a great life experience at Auburn. I still remembered that he spent few
hours to introducing the cracking group project and my courses schedule in detail when we first
met. His diligent and well-organized working style deeply impress and influence me throughout
my research and study. He always gave me meticulous guidance for my academical writing and
career planning, and provided thoughtful assistance during the research and study. I am very
grateful and honored to have been his student.
Secondly, I would like to thank Dr. Nam Tran, Dr. Fan Yin, Dr. Benjamin Bowers, and
Dr. Maria Auad for serving as my committee members. I greatly appreciated their patience and
assistance for giving me valuable comments to improve my dissertation and research ability.
Special acknowledgements should go to Dr. Fan Yin for his guidance and suggestion regarding
analyzing data, academical writing and presentation, and experimental planning throughout my
research.
Thirdly, I would like to thank Adam Taylor for his assistance with laboratory tests, he
was always patient to give me training and provide great suggestions for my research. I would
also like to thank Jason Moore and Nathan Moore for their assistance during my laboratory
work. The completion of my dissertation would not have been possible without the assistance of
Pamela Turner and Tina Ferguson, and I acknowledged their incredible work for conducting
binder and mixture tests. Additionally, I would also like to thank Jason Nelson, Matt Sasser, and
many other lab technicians and co-op students for assisting me with data collection and
laboratory work.

7
Next, I would like to express my sincere appreciation to the NCAT family, and I am very
honored and grateful to be a member of NCAT family. NCAT family not only provided
professional knowledge and guidance throughout my study, but also made me feel at home
because the tremendous support and care they gave. I would also like to thank Dr. Fan Gu for his
assistance and suggestion regarding academic writing and professional skills throughout my
study. Special thanks to Vickie Adams and her family for sharing their wonderful southern life
experience, including rodeo competition, wagon train, horse adventure, and lots of family
activities.
I wish to thank all my friends for their continuous and unconditional care and support
during these years. It was impossible for me to have such a wonderful research and life
experience without their accompany, and it was their encouragement and recognition that kept
me working hard and being a better person.
Finally, I want to thank my parents, brother, sister-in-law, and little niece for their
priceless support and love, and I could not have completed this dissertation without them.

8
TABLE OF CONTENTS
ABSTRACT ...............................................................................................................................2
ACKNOWLEDGMENTS ...........................................................................................................6
LIST OF TABLES .................................................................................................................... 14
LIST OF FIGURES .................................................................................................................. 16
CHAPTER 1 INTRODUCTION ............................................................................................... 21
1.1 Problem Statement ........................................................................................................... 21
1.2 Objectives ........................................................................................................................ 23
1.3 Scope ............................................................................................................................... 23
1.4 Organization of this Dissertation ...................................................................................... 24
CHAPTER 2 LITERATURE REVIEW .................................................................................... 26
2.1 Mechanisms of Top-down Cracking ................................................................................. 26
2.2 Influence Factors for Top-down Cracking ........................................................................ 28
2.3 Long Term Oven Aging ................................................................................................... 30
2.4 Laboratory Mixture Cracking Tests .................................................................................. 34
2.4.1 Energy Ratio ............................................................................................................. 34
2.4.2 Texas Overlay Test .................................................................................................... 35
2.4.3 NCAT Modified Overlay Test ................................................................................... 38
2.4.4 Semi-circular Bend Test ............................................................................................ 40
2.4.5 Illinois Flexibility Index Test..................................................................................... 42
2.4.6 Indirect Tensile Asphalt Cracking Test (a.k.a, IDEAL-Cracking Test) ....................... 44

9
CHAPTER 3 RESEARCH METHODOLOGY ......................................................................... 46
3.1 Experimental Plan ............................................................................................................ 46
3.1.1 Construction of NCAT TDC Experimental Test Sections ........................................... 46
3.1.2 Determination of the Critical Aging Protocol for NCAT TDC Experiment ................. 47
3.1.3 Laboratory Cracking Tests of NCAT TDC Experiment .............................................. 48
3.2 Materials .......................................................................................................................... 50
3.2.1 Materials used to Select the Preliminary Critical Aging Protocol ............................... 50
3.2.2 NCAT TDC Experimental Mixtures ........................................................................... 50
3.3 Laboratory Binder Tests ................................................................................................... 53
3.3.1 Dynamic Shear Rheometer ........................................................................................ 53
3.3.2 Bending Beam Rheometer ......................................................................................... 55
3.3.3 Double-Edge-Notched Tension (DENT) Test ............................................................ 57
3.3.4 Fourier Transform Infrared Spectroscopy .................................................................. 59
3.4 Laboratory Mixture Cracking Tests .................................................................................. 61
3.4.1 Energy Ratio ............................................................................................................. 61
3.4.2 Texas Overlay Test .................................................................................................... 63
3.4.3 NCAT Modified Overlay Test .................................................................................... 66
3.4.4 Semi-Circular Bend Test ............................................................................................ 67
3.4.5 Illinois Flexibility Index Test ..................................................................................... 70
3.4.6 Indirect Tensile Asphalt Cracking Test ....................................................................... 72
10
3.4.7 Small-Specimen AMPT Cyclic Fatigue Test .............................................................. 74
3.4.8 Summary ................................................................................................................... 76
CHAPTER 4 SELECTING A PRELIMINARY CRITICAL AGING PROTOCOL ................... 78
4.1 Identification of Critical Field Aging for TDC ................................................................. 78
4.2 Experimental Design ........................................................................................................ 81
4.3 Tests Results and Data analysis ........................................................................................ 84
4.3.1 Comparisons of Laboratory Aging Protocols ............................................................. 84
4.3.2 Correlation of Field Aging with Laboratory Aging Protocols ..................................... 94
4.3.3 Selection of Alternative Aging Protocol at 135°C ...................................................... 96
4.4 Summary ......................................................................................................................... 98
CHAPTER 5 PRELIMINARY VALIDATION OF THE CRITICAL AGING PROTOCOL ... 100
5.1 Experimental Design ...................................................................................................... 100
5.2 Comparison of Two Candidate Critical Aging Protocols ................................................ 102
5.2.1 I-FIT Results ........................................................................................................... 103
5.2.2 IDEAL-CT Results .................................................................................................. 104
5.2.3 Small-Specimen AMPT Cyclic Fatigue Test Results ............................................... 105
5.2.4 Glover-Rowe Parameter Results .............................................................................. 106
5.2.5 LAS Test Results ..................................................................................................... 107
5.2.6 ΔTc Results ............................................................................................................. 108
5.2.7 DENT Test Results .................................................................................................. 109

11
5.3 Evolution of Asphalt Binder and Mixtures Properties with Field Aging ......................... 110
5.3.1 I-FIT Results ........................................................................................................... 111
5.3.2 Continuous PG Results ............................................................................................ 112
5.3.3 Glover-Rowe Parameter Results .............................................................................. 113
5.3.4 ΔTc Results ............................................................................................................. 114
5.3.5 LAS Results ............................................................................................................ 115
5.3.6 FT-IR Results .......................................................................................................... 116
5.4 Correlation between Laboratory Critical Aging Protocols and Field Aging .................... 117
5.5. Summary ...................................................................................................................... 120
CHAPTER 6 LABORATORY MIXTURE CRACKING TEST RESULTS............................. 123
6.1 Experimental Design ...................................................................................................... 123
6.1.1 Sensitivity Groups ................................................................................................... 124
6.1.2 Sample Preparation.................................................................................................. 125
6.1.3 Statistical Analysis .................................................................................................. 126
6.2 Comparison Analysis between Plant Mixtures and Laboratory Mixtures ........................ 127
6.2.1 Energy Ratio ........................................................................................................... 128
6.2.2 Texas Overlay Test .................................................................................................. 132
6.2.3 NCAT Modified Overlay Test ................................................................................. 135
6.2.4 Semi-Circular Bend Test ......................................................................................... 137
6.2.5 Illinois Flexibility Index Test................................................................................... 139
12
6.2.6 Indirect Tensile Asphalt Cracking Test .................................................................... 140
6.2.7 Summary of Comparison Analysis between Plant mixtures and Laboratory Mixtures
........................................................................................................................................ 142
6.3 Sensitivity Analyses ....................................................................................................... 144
6.3.1 Aging Sensitivity ..................................................................................................... 144
6.3.2 Air Voids Sensitivity ............................................................................................... 158
6.3.3 Recycled Asphalt Materials Sensitivity .................................................................... 162
6.3.4 Modified Binder Sensitivity ..................................................................................... 166
6.4 Correlations between Different Laboratory Cracking Tests ............................................ 170
6.5 Summary ....................................................................................................................... 173
CHAPTER 7 PRELIMINARY VALIDATION OF LABORATORY CRACKING TESTS..... 176
7.1 Preliminary Field Cracking Performance........................................................................ 176
7.2 Correlations between Field Cracking Performance and Laboratory Cracking Test Results
............................................................................................................................................ 178
7.2.1 Analysis of Pearson’s Correlation Coefficient .......................................................... 178
7.2.2 Identification of the most Susceptible Mixture to TDC ............................................ 179
7.2.3 Discrimination between Cracked Sections and Uncracked Sections ......................... 181
7.3 Summary ....................................................................................................................... 182
CHAPTER 8 CONCLUSIONS AND RECOMMENDATIONS .............................................. 185
8.1 Determination of a Critical Aging Protocol .................................................................... 185
8.2 Preliminary Evaluation of Laboratory Cracking Tests .................................................... 186

13
8.3 Recommendations for Future Research .......................................................................... 188
REFERENCES ....................................................................................................................... 190
14
LIST OF TABLES
Table 1. 1 Summary of Laboratory Load-related Cracking Tests ............................................... 22
Table 3. 1 Summary of Field Projects ........................................................................................ 50
Table 3. 2 Mix Design and Quality Control Properties of the NCAT TDC Experimental Test
Sections .................................................................................................................................... 52
Table 3. 3 Summary of Laboratory Cracking Tests .................................................................... 77
Table 4. 1 Summary of Construction and Coring Dates ............................................................. 82
Table 5. 1 Summary of Representative CDD (x 1,000) Values for CA1 Protocol of Loose
Mixture Aging for 5 days at 95°C............................................................................................ 119
Table 5. 2 Summary of Representative CDD (x 1,000) Values for CA2 Protocol of Loose
Mixture Aging for 8 hours at 135°C ........................................................................................ 120
Table 6. 1 p-value Summary of Comparison Analysis ............................................................. 143
Table 6. 2 Summary of Mixtures showing Statistical Difference during t-test .......................... 143
Table 6. 3 Summary of Aging Sensitivity Analysis ................................................................. 158
Table 6. 4 Summary of Air Voids Sensitivity Analysis for Plant Mixtures ............................... 161
Table 6. 5 Summary of Air Voids Sensitivity Analysis for Laboratory Mixtures...................... 162
Table 6. 6 Summary of Recycled Asphalt Materials Sensitivity Analysis for Plant Mixtures ... 165
Table 6. 7 Summary of Recycled Materials Sensitivity Analysis for Laboratory Mixtures ....... 166
Table 6. 8 Summary of Modified Binder Sensitivity Analysis for Plant Mixtures .................... 169
Table 6. 9 Summary of Modified Binder Sensitivity Analysis for Laboratory Mixtures ........... 170
Table 6. 10 Summary of Pearson Correlation Coefficients ....................................................... 171
Table 7. 1 Preliminary Field Cracking Performance Summary ................................................ 177
Table 7. 2 Summary of rp between Cracking test parameter and Field Cracking Performance .. 179

15
Table 7. 3 Identification Results of the Most Susceptible Mixture to TDC ............................... 180
Table 7. 4 Discrimination Results between Cracked and Uncracked Sections .......................... 182

16
LIST OF FIGURES
Figure 1. 1 Typical TDC and a Corresponding Field Core ......................................................... 21
Figure 2. 1 Mechanisms of TDC Initiation Process; (a) Bending Mechanism, (b) Near-tire
Mechanism................................................................................................................................ 27
Figure 3. 1 Pavement Structure of NCAT TDC Experimental Test Sections .............................. 47
Figure 3. 2 Experimental Plan ................................................................................................... 49
Figure 3. 3 DSR Test; (a) DSR Equipment, (b) Sample Preparation .......................................... 53
Figure 3. 4 BBR Test; (a) Test Equipment, (b) Loading Frame .................................................. 56
Figure 3. 5 BBR Sample Preparation ......................................................................................... 56
Figure 3. 6 Nicolet 6700 FT-IR Spectrometer and Mechanism of ATR ..................................... 59
Figure 3. 7 Illustration of FT-IR Analysis; (a) Full Spectrum, (b) FT-IR Carbonyl Area ............ 60
Figure 3. 8 Energy Ratio Test Specimen Setup .......................................................................... 62
Figure 3. 9 Energy Ratio Concept; ............................................................................................ 63
Figure 3. 10 TX-OT Specimen Setup ........................................................................................ 64
Figure 3. 11 Illustration of the New Analysis Methodology of TX-OT; (a) Wc, (b) β ................ 66
Figure 3. 12 Determination of the failure point for NCAT-OT vs. TX-OT ................................. 67
Figure 3. 13 SCB Specimen and Test Setup; (a) Notched Specimens, (b) Test Setup ................. 68
Figure 3. 14 Methodology of SCB Analysis; ............................................................................. 69
Figure 3. 15 I-FIT Test Setup and Specimen; (a) Test Setup, (b) I-FIT Specimen ...................... 70
Figure 3. 16 Illustration of I-FIT Analysis ................................................................................. 71
Figure 3. 17 IDEAL-CT Test Setup ........................................................................................... 73
Figure 3. 18 Illustration of IDEAL-CT Analysis ........................................................................ 74
Figure 4. 1 Wheel-path Longitudinal Crack Survey Results; ...................................................... 80
17
Figure 4. 2 A Map showing the Number of Years to Reach 70,000 CDD................................... 81
Figure 4. 3 Research Methodology for Laboratory Aging .......................................................... 82
Figure 4. 4 HPG Results of Plant Production Mixtures; (a) HPG Results before and after Storage,
(b) Correlation between Change in HPG with the Storage Time ................................................ 83
Figure 4. 5 Continuous PG Results of Extracted Asphalt Binders with Various Loose Mixture
Aging Protocols; (a) High-Temperature, (b) Low-Temperature ................................................. 86
Figure 4. 6 G-R Parameter Results in Black Space Diagram; (a) Mix 1, (b) Mix 2, (c) Mix 3, (d)
Mix 4, (e) Mix 5 ........................................................................................................................ 89
Figure 4. 7 BBR ΔTc Results of Extracted Asphalt Binders with Various Loose Mixture Aging
Protocols ................................................................................................................................... 90
Figure 4. 8 FT-IR CA Results of Extracted Asphalt Binders with Various Loose Mixture Aging
Protocols ................................................................................................................................... 91
Figure 4. 9 G-R HS Results; (a) Mix 1, (b) Mix 2, (c) Mix 3, (d) Mix 4, (e) Mix 5 .................... 93
Figure 4. 10 Comparison of Field Aging and Laboratory Loose Mixture Aging Protocols; (a) 5-
day, 95°C, (b) 6-hour, 135°C, (c) 12-hour, 135°C, (d) 24-hour, 135°C ...................................... 95
Figure 4. 11 Determination of Equivalent Aging Time at 135°C; (a) Example of Mix 2 FT-IR
CA Results, (b) Summary of All Results ................................................................................... 98
Figure 5. 1 Aging Validation Experimental Design ................................................................. 102
Figure 5. 2 I-FIT Results of PMLC Specimens with Different Aging Conditions ..................... 104
Figure 5. 3 IDEAL-CT Test Results of PMLC Specimens with Different Aging Conditions .... 105
Figure 5. 4 AMPT Cyclic Fatigue Test Results of PMLC Specimens with Different Aging
Conditions ............................................................................................................................... 106

18
Figure 5. 5 G-R Parameter Results of Extracted Binders from PMLC Specimens with Different
Aging Conditions .................................................................................................................... 107
Figure 5. 6 LAS-Nf (5.0%) Parameter Results of Extracted Binders from PMLC Specimens with
Different Aging Conditions ..................................................................................................... 108
Figure 5. 7 ΔTc Results of Extracted Binders from PMLC Specimens with Different Aging
Conditions ............................................................................................................................... 109
Figure 5. 8 DENT Test Results of Extracted Binders from PMLC Specimens with Different
Aging Conditions .................................................................................................................... 110
Figure 5. 9 I-FIT Results of Reheated PMLC Specimen and Post-Construction Field Cores .... 111
Figure 5. 10 Continuous PG Results of Extracted Binders from Reheated Plant Mixture and Post-
Construction Field Cores; (a) High-Temperature, (b) Low-Temperature.................................. 113
Figure 5. 11 Glover-Rowe Parameter Results of Extracted Binders from Reheated Plant Mixture
and Post-Construction Field Cores .......................................................................................... 114
Figure 5. 12 ΔTc Results of Extracted Binders from Reheated Plant Mixture and Post-
Construction Field Cores ......................................................................................................... 115
Figure 5. 13 LAS-Nf Results of Extracted Binders from Reheated Plant Mixture and Post-
Construction Field Cores ......................................................................................................... 116
Figure 5. 14 FT-IR Carbonyl Area Results of Extracted Binders from Reheated Plant Mixture
and Post-Construction Field Cores .......................................................................................... 117
Figure 5. 15 An Example to Illustrate the Determination of the Representative CDD for the Two
Candidate CA Protocols using the I-FIT Results of Mix S6 ..................................................... 118
Figure 6. 1 Research Methodology for Laboratory Cracking Tests .......................................... 124

19
Figure 6. 2 ER Test Results of PMLC-RH and LMLC-STOA; (a) DCSEHMA Results, (b)
DCSEMin Results, (c) ER Results ............................................................................................. 130
Figure 6. 3 ER Test Results of PMLC-CA and LMLC-CA; (a) DCSEHMA Results, (b) DCSEMin
Results, (c) ER Results ............................................................................................................ 132
Figure 6. 4 TX-OT Test Results of PMLC-RH and LMLC-STOA; (a) TX-Nf Results, (b) TX-β
............................................................................................................................................... 134
Figure 6. 5 TX-OT Test Results of PMLC-CA and LMLC-CA; (a) TX-Nf Results, (b) TX-β .. 135
Figure 6. 6 NCAT-OT Test Results of PMLC-RH and LMLC-STOA; (a) NCAT-Nf Results, (b)
NCAT-β .................................................................................................................................. 136
Figure 6. 7 NCAT-OT Test Results of PMLC-CA and LMLC-CA; (a) NCAT-Nf Results, (b)
NCAT-β .................................................................................................................................. 137
Figure 6. 8 SCB Test Results of PMLC-RH and LMLC-STOA ............................................... 138
Figure 6. 9 SCB Test Results of PMLC-CA and LMLC-CA .................................................... 138
Figure 6. 10 I-FIT Test Results of PMLC-RH and LMLC-STOA ............................................ 140
Figure 6. 11 I-FIT Test Results of PMLC-CA and LMLC-CA ................................................. 140
Figure 6. 12 IDEAL-CT Test Results of PMLC-RH and LMLC-STOA................................... 141
Figure 6. 13 IDEAL-CT Test Results of PMLC-CA and LMLC-CA ....................................... 142
Figure 6. 14 Aging Sensitivity Results of ER Test to Laboratory Mixtures; (a) DCSEHMA Results,
(b) DCSEMin Results, (c) ER Results ....................................................................................... 146
Figure 6. 15 Aging Sensitivity Results of ER Test to Plant Mixtures; (a) DCSEHMA Results, (b)
DCSEMin Results, (c) ER Results ............................................................................................. 148
Figure 6. 16 Aging Sensitivity Results of TX-OT Test to Laboratory Mixtures; (a) TX-Nf
Results, (b) TX-β Results ........................................................................................................ 149

20
Figure 6. 17 Aging Sensitivity Results of TX-OT Test to Plant Mixtures; (a) TX-Nf Results, (b)
TX-β Results ........................................................................................................................... 151
Figure 6. 18 Aging Sensitivity Results of NCAT-OT Test to Laboratory Mixtures; (a) NCAT-Nf
Results, (b) NCAT-β Results ................................................................................................... 152
Figure 6. 19 Aging Sensitivity Results of NCAT-OT Test to Plant Mixtures; (a) NCAT-Nf
Results, (b) NCAT-β Results ................................................................................................... 153
Figure 6. 20 Aging Sensitivity of SCB Test to Laboratory Mixtures ........................................ 154
Figure 6. 21 Aging Sensitivity of SCB Test to Plant Mixtures ................................................. 155
Figure 6. 22 Aging Sensitivity of I-FIT Test to Laboratory Mixtures ....................................... 156
Figure 6. 23 Aging Sensitivity of I-FIT Test to Plant Mixtures ................................................ 156
Figure 6. 24 Aging Sensitivity of IDEAL-CT Test to Laboratory Mixtures.............................. 157
Figure 6. 25 Aging Sensitivity of IDEAL-CT Test to Plant Mixtures ....................................... 157
Figure 6. 26 Examples of Air Voids Sensitivity; (a) ER Results, (b) CTIndex Results ................ 160
Figure 6. 27 Examples of Recycled Asphalt Materials Sensitivity; .......................................... 164
Figure 6. 28 Examples of Modified Binder Sensitivity; ........................................................... 168
Figure 6. 29 OT Nf versus β Correlations; (a) NCAT-OT Results, (b) TX-OT Results ............. 172
Figure 7. 1 Cracks on Section N8 and Field Core .................................................................... 177
Figure 7. 2 Example of Discrimination between Cracked and Uncracked Sections .................. 181

21
CHAPTER 1 INTRODUCTION
1.1 Problem Statement
Top-down cracking (TDC) has been widely reported as a common mode of distress in asphalt
pavements (Hugo and Kennedy, 1985; Gerritsen et al., 1987; Myers et al., 1998). Different from
traditional bottom-up fatigue cracking, TDC initiates at the surface of an asphalt pavement in or
near the wheel-path and propagates downward through the asphalt layers (Myer et al., 1998).
Figure 1.1 shows typical TDC in the wheel-path and a corresponding field core.
Figure 1. 1 Typical TDC and a Corresponding Field Core
Several mechanisms of TDC development have been proposed, including high bending-
induced surface tension, shear-induced near-surface tension due to tire-pavement interactions
(Hugo and Kennedy, 1985; Gerritsen et al., 1987; Zou and Roque, 2011). Factors that have been
identified that contribute to the development of TDC include traffic loading, pavement structure,
and mixture properties (Myers et al., 1998; Myers and Roque, 2002; Roque et al., 2004).
Additionally, aging of asphalt binder in the surface layer has also been identified as a critical

22
factor (Myers et al., 1998; Matsuno and Nishizawa, 1992; Hugo and Kennedy, 1985). Age
hardening of asphalt binder stiffens and embrittles surface mixtures resulting in greater thermal
stresses and higher potential of cracking initiation on the pavement surface (Myers and Roque,
2002; Roque et al., 2004). TDC results in the need for pavement rehabilitation, such as milling
and placing a new surface layer. If mixtures susceptible to TDC can be identified during the
mixture design process, the occurrence of premature surface distress would be avoided or
mitigated. Therefore, there is an urgent need to select a suitable laboratory cracking test for TDC
as part of mixture design and quality assurance. Over the last few decades, several cracking tests
have been developed by various researchers, although only a few of the tests have been
implemented for projects by a small number of highway agencies. Load-related cracking tests,
such as those listed in Table 1.1, have been used by researchers to evaluate the cracking
resistance of asphalt mixtures. However, there is no consensus regarding the most appropriate
cracking test to predict TDC.
Table 1. 1 Summary of Laboratory Load-related Cracking Tests
Test Name References
Energy Ratio (ER) Roque et al., 2004
Texas Overlay Test (TX-OT) Tex-248-F
NCAT Modified OT (NCAT-OT) Ma, 2014
Semi-circular Bend Test (SCB) Mull et al., 2002
Illinois Flexibility Index Test (I-FIT) AASHTO TP 124
Indirect Tensile Asphalt Cracking Test (IDEAL-CT) ASTM D 8255-19
Bending Beam Fatigue Test (BBFT) AASHTO T 321
Simplified Viscoelastic Continuum Damage Test (S-VECD) AASHTO TP 107
Considering the importance of aging in the development of TDC in asphalt pavement
surface layers, it is logical to include appropriate short-term and long-term laboratory aging prior

23
to testing to simulate the aging that occurs during mixture production and the first few years of
service, respectively.
According to AASHTO R 30, the standard method for laboratory short-term oven aging
(STOA) is to condition loose mixtures for four hours at 135°C. For long-term oven aging
(LTOA), AASHTO R 30 calls for conditioning of compacted specimens for five days at 85°C.
Instead of conditioning compacted specimens, a number of loose mixture oven aging protocols
have been used to simulate field aging using different times and oven temperatures (Braham et
al., 2009; Reinke et al., 2015; Elwardany et al., 2017). However, these aging protocols have not
been adequately related to in-service field aging. In addition, the traditional expectation of LTOA
to simulate seven to ten years of field aging may not be appropriate to evaluate TDC, since most
of these cracks have been reported to develop within a significantly shorter period (i.e., three to
five years) (Myers et al., 1998; Uhlmeyer et al., 2000; Dauzats and Rampal, 1987).
1.2 Objectives
Based on the problems described above, the objectives of this study were set to:
(1) Identify the critical field aging condition when TDC starts to develop, then determine
a critical aging (CA) protocol to condition asphalt mixtures for TDC evaluation.
(2) Validate laboratory cracking tests by establishing correlations between the test results
and measured cracking performance of test sections on the NCAT Test Track.
1.3 Scope
In 2015, the National Center for Asphalt Technology (NCAT) initiated a study to gain more
understanding about TDC and to evaluate laboratory cracking tests for their suitability in
identifying mixtures susceptible to TDC (hereinafter referred to as the NCAT TDC experiment).

24
Seven surface mixtures with a range of expected cracking potential were designed and
constructed on the NCAT Test Track. Each mixture was constructed as a 1.5-inch surface layer
on top of highly polymer modified base and binder layers. Six laboratory cracking tests were
selected by the experiment sponsors: ER, TX-OT, NCAT-OT, SCB, I-FIT, and IDEAL-CT.
Prior to laboratory testing of the mixtures in the NCAT TDC experiment, materials from
five projects were utilized to determine a preliminary critical aging protocol. The NCAT TDC
experimental materials were subsequently used to validate the preliminary critical aging protocol
by comparing the mixture and binder properties between critically aged plant mixtures and field
cores. Furthermore, six laboratory cracking tests were conducted to evaluate the cracking
resistance of seven NCAT TDC experimental mixtures. Lastly, the laboratory cracking tests can
be validated through examining the correlations between laboratory test results and measured
field cracking performance.
1.4 Organization of this Dissertation
This dissertation consists of eight chapters. Chapter 1 describes the problems related to TDC
evaluation and states the objectives and overall scope of this study. Chapter 2 contains a
literature review of the mechanism and influence factors for the development of TDC, long-term
oven aging methods, and six laboratory mixture cracking tests. Chapter 3 explains the research
methodology and summarizes the materials, laboratory binder tests and mixture cracking tests
used in this study. Chapter 4 presents the process of determining the preliminary critical aging
protocol, and the critical field aging condition is identified in this section. Chapter 5 describes
the validation of the preliminary aging protocol using the NCAT TDC experimental mixtures.
Chapter 6 summarizes the laboratory cracking test results and analyses of seven mixtures,
including comparison, sensitivity, and correlation analyses. Chapter 7 presents the preliminary

25
findings of the correlations between field cracking performance and six laboratory cracking tests.
Chapter 8 presents the conclusions and recommendations of this study.

26
CHAPTER 2 LITERATURE REVIEW
This chapter conducts a literature review regarding the proposed mechanisms and influence
factors of TDC. Meanwhile, the studies of long-term oven aging methods and six laboratory
cracking tests were also reviewed and summarized in this section.
2.1 Mechanisms of Top-down Cracking
TDC is commonly longitudinal or transverse crack that initiates at the pavement surface and
propagates downward (Baladi et al., 2003). The formation of TDC consists of two phases:
initiation and propagation. The most widely accepted hypothesis for cracking initiation proposes
that cracks are generated by micro-fracture damage (Lytton et al., 1993; Li, 1999), then the
cracks propagate through the whole asphalt layer (Little et al., 2001). Over the last decades, two
mechanisms have been proposed to explain the initiation of longitudinal TDC (Roque et al.,
2010; Zou and Roque, 2011), which included: 1) bending mechanism: bending-induced surface
tension away from the tire; and 2) near-tire mechanism: shear-induced surface tension at the edge
of the tire, as shown in Figure 2.1. The study of Zou and Roque (2011) implied that the bending
mechanism was primarily used to explain the TDC initiation in pavements with thin to medium
(2.5 to 5.0 inches) asphalt layers, and the near-tire mechanism was appropriate for the pavements
with thick (7.5 to 10.0 inches) asphalt layers. However, the studies about the initiation of
transverse TDC were limited (Baladi et al., 2003; Gu et al., 2018). Gu et al. (2018) developed a
three-dimensional finite element model to simulate the critical responses of asphalt pavement.
The simulation results indicated that the near tire-front surface in longitudinal direction was
compressed, and the maximum longitudinal tensile stress near the load center (around 0.6 m)
could induce the transverse TDC. In addition, the study of Baladi et al. (2003) indicated that the

27
short transverse TDC might be caused by the thermal stress and asphalt aging based on the field
investigation.
(a)
(b)
Figure 2. 1 Mechanisms of TDC Initiation Process; (a) Bending Mechanism, (b) Near-tire
Mechanism
After crack initiation, the cracks propagate downward into the pavement. The
mechanisms of crack propagation are different than crack initiation and are highly dependent on
load magnitudes and positions, stiffness gradients in asphalt layers (induced by temperature
gradients and aging), and pavement structure (Myers, 2000). Based on the study of Myers
(2000), the TDC propagation mechanism was primarily a Mode I tensile mechanism, and the
propagation speed depends on the crack length, pavement thickness, and mixture gradation. In
general, thinner pavements and coarser gradations are expected to have faster propagation speeds

28
(Myers, 2000; Zou and Roque, 2011). In contrast, Nesnas and Nunn (2004) indicated that the
TDC propagation mechanism was mainly in shear mode for composite pavements, which was
significantly affected by binder aging and pavement structure.
2.2 Influence Factors for Top-down Cracking
TDC has received increasing attention in recent years. Some research has been devoted to
explaining the cause of TDC and the critical factors that contribute to it (Myers, 2000; Roque et
al., 2004; Min Baek, 2010; Zou and Roque, 2011; Wu and Muhunthan, 2018). Critical factors
include:
• Age hardening of asphalt binder
• Climate conditions (e.g., temperature)
• Pavement structure (e.g., layer thickness)
• Mixture properties (e.g., air voids, binder type, and aggregate gradation)
• Traffic loading (e.g., traffic volume, loading magnitude and position)
• Construction quality (e.g., mixture segregation and compaction)
Age hardening stiffens and embrittles asphalt binder in mixtures resulting in greater
thermal stresses and higher potential of cracking initiation on the pavement surface (Myers and
Roque, 2002; Roque et al., 2004). Additionally, stiffness gradients induced by aging also
significantly increased the chance of TDC initiation and propagation (Myers, 2000; Zou and
Roque, 2011). The effects of aging on TDC development was confirmed by several field projects
where excessive aging was observed in cracked areas (Dauzats and Linder, 1982; Gerritsen et al.,
1987; Matsuno and Nishizawa, 1992).
29
TDC has been reported in different climates, and temperature was identified as a critical
factor for the development of TDC. Stiffness gradients induced by temperature gradients with
depth affected propagation of TDC (Myers, 2000; Myers and Roque, 2002). Other studies
indicated that pavements in higher temperature climates are more susceptible to TDC due to high
tensile strains in the pavement surface at the tire edge (Matsuno and Nishizawa, 1992; Freitas et
al., 2005; Wang et al., 2003). However, Zou and Roque (2011) argued that the effects of
temperature on TDC were not significant because its effects on thermal-induced damage and
load-induced damaged appeared to offset.
Pavement structure is also believed to have a strong influence on the development of
TDC. Myers (2000) implied that pavements with lower stiffness base layers were more
susceptible to TDC. In addition, Zou and Roque (2011) also demonstrated that pavements with
thick asphalt structures had better cracking resistance, and the crack propagation speed was faster
in a thinner asphalt layer. Similar results were also obtained by Nesnas and Nunn (2004).
Mixture properties also play an important role in cracking performance, including air
voids, binder type, aggregate gradation, and mixture strength. Several laboratory and field
studies indicated that asphalt layers with higher in-place density have better cracking resistance
by increasing stiffness and possibly reducing the rate of aging (Harvey et al., 1996; Fisher et al.,
2010; Tran et al., 2016). In addition, the use of polymer-modified binder was shown to improve
the cracking performance (Bahia et al., 2001; Kim et al., 2003; Yildirim, 2007; Kӧk and Çolak,
2011). Myers (2000) indicated that mixtures with coarser gradations yielded faster cracking
propagation speed than mixtures with finer gradations. Meanwhile, several studies implied that
TDC would more likely initiate on pavements with low strength surface mixtures (Gerritsen et
al., 1987; Malan et al., 1989; Wang et al., 2003).
30
Traffic loading is also recognized as a primary factor for TDC. Myers (2000) indicated
that both load magnitude and tire position dramatically affected the initiation and propagation of
TDC. A similar result was also found by Myers and Roque (2002). Zou and Roque (2011) also
presented that worse cracking performance was observed on pavements with higher traffic levels.
In addition to factors associated with mixture properties and traffic loading, the
construction quality of pavement also affects cracking performance. Freitas et al. (2003)
investigated the causes of TDC and found that in addition to traffic loading and mixture
properties affecting TDC, construction quality as evident with segregation and in-place density
were also important. A field project in Colorado found that segregation was the primary cause of
TDC (Harmelink and Aschenbrener, 2003).
2.3 Long Term Oven Aging
Long-term oven aging (LTOA) of asphalt mixtures is used to simulate the oxidative aging that
occur throughout pavement’s service life (Petersen, 2009). In general, there are two commonly
used laboratory LTOA protocols: (1) conditioning of compacted specimens in an oven, and (2)
conditioning of loose mixtures in an oven prior to compaction (Airey, 2003; Kim et al., 2018).
The NCHRP 9-6(1) project was one of the first studies that recommended conditioning
compacted specimens in a forced-draft oven at 60°C for 2 days, followed by 3 days at 107°C
(Von Quintus et al., 1991). Since then, several similar aging protocols have been developed,
requiring the conditioning of compacted specimens at a wide range of temperatures (i.e. 60°C to
100°C) for varying durations (i.e. days to months) (Bell et al., 1994a; Bell et al., 1994b; Brown
and Scholz, 2000; Morian et al., 2011; Safaei et al., 2014). The SHRP-A-003A project found that
conditioning of compacted specimens for 5 days at 85°C simulated 15 years of field aging in a
Wet-No-Freeze climate and 7 years of field aging in a Dry-Freeze climate (Harrigan et al., 1994;

31
Bell et al., 1994a). This finding was later verified by Brown and Scholz (2000) based on mixture
stiffness results. More recently, Harrigan (2007) tested the dynamic modulus of compacted
specimens conditioned for 5 days at 80°C, 85°C, and 90°C, and concluded that the 5-day, 95°C
protocol was representative of seven to ten years of field aging. This aging protocol was adopted
as the standard LTOA procedure for mixture performance testing in AASHTO R 30.
The NCHRP 9-52 project evaluated the validity of this LTOA protocol using over 40
different asphalt mixtures with a wide variety of material components and production
parameters. The resilient modulus and Hamburg wheel-tracking test (HWTT) results indicated
that conditioning of compacted specimens for 5 days at 85°C was representative of
approximately one year of field aging in warmer climates and two years of field aging in colder
climates (Newcomb et al., 2015). Similar findings were also reported by Islam et al. (2015)
based on bending beam fatigue tests and Howard and Doyle (2015) based on Cantabro tests.
Sirin et al. (2018) compared the dynamic modulus of laboratory-produced specimens aged at
85°C for a wide range of durations (i.e. 5 days to 120 days) versus 7-year old field cores, and
found that the AASHTO standard LTOA protocol was not severe enough to represent long-term
field aging in the hot climate of Qatar. To address this issue, Sirin et al. (2018) recommended
extending the aging duration from 5 days to 45 days for base mixtures and 75 days for surface
mixtures. In addition to these disparities in aging between the standard LTOA procedure and the
field, there are two other concerns regarding specimen integrity due to the use of compacted
specimens for LTOA: (1) changes in air voids and geometry caused by specimen softening and
slumping and (2) presence of both radial and vertical oxidation gradients within the specimen
volume (Houston et al., 2005; Reed, 2010; Elwardany et al., 2017).

32
Compared to conditioning compacted specimens, loose mixture aging typically yields a
more severe level of asphalt aging due to the increased exposure to oxygen and elevated
temperature. Additionally, the loose mixture aging process can be accelerated using higher
temperatures without concerns of the aforementioned specimen integrity issues. Thus, loose
mixture aging has recently been recognized as a more user-friendly alternative for simulating the
long-term field aging of asphalt pavements in terms of time efficiency and cost (Sirin et al.,
2018). Over the last decade, several loose mixture aging protocols had been used by different
researchers with a wide range of temperatures and durations (Roche et al., 2009; Arega et al.,
2013; Reinke et al., 2015; Elwardany et al., 2017). Some of these aging protocols, however, were
mainly used to prepare artificial reclaimed asphalt pavement (RAP) materials in the laboratory
rather than to simulate the long-term field aging of asphalt pavements (Van den Bergh, 2011;
Partl et al., 2012). Braham et al. (2009) conditioned the loose mixture at 135°C for 6 to 48 hours
and evaluated its effect on mixture fracture energy measured in the Disk-shaped Compact
Tension (DCT) test. Meanwhile, the six-year field cores were also collected and used to
characterize the effects of field aging on mixture fracture energy. Test results indicated that 24
hours loose mixture aging protocol was representative of approximately 6 years of field aging in
Minnesota through interpolation. In a study conducted by Reinke et al. (2015), loose mixtures
collected from three test sections on the Minnesota Department of Transportation’s Road
Research facility (MnROAD) were conditioned at 135°C for 12 and 24 hours. Based on the
binder delta Tc results, the aging protocol of 18 hours at 135°C was found equivalent to 8 years
of field aging in Minnesota.
Mensching et al. (2017) explored the impact of short-term aging and two loose mixture
aging protocols (i.e., 5 days at 85°C and 24 hours at 135°C) on mixtures with varying levels of

33
re-refined engine oil bottoms. Cracking resistance indicators for the mixture and binder indicated
that the 24-hour, 135°C protocol yielded higher stiffness and lower relaxation properties than the
5-day, 85°C aging protocol. Rahbar-Rastegar et al. (2018) investigated the effect of aging on the
viscoelastic and fracture properties of asphalt mixtures using three loose mixture aging protocols:
5 days at 95°C, 12 days at 95°C, and 24 hours at 135°C. Test results indicated that the 135°C
aging protocol yielded reduced mixture fracture properties compared to the two 95°C aging
protocols. Chen et al. (2018) conditioned loose mixtures with four aging protocols, including 5
days at 95°C, 6 hours at 135°C, 12 hours at 135°C, and 24 hours at 135°C. Based on the binder
rheological and chemical test results, the aging temperature did not show a significant effect on
the oxidation kinetics of the five asphalt binders tested. Furthermore, the two loose mixture aging
protocols of 5 days at 95°C and 8 hours at 135°C were found equivalent and expected to simulate
approximately 4 to 5 years of field aging in Alabama. Considering the non-uniform aging of
asphalt mixtures with depth (Turner, 2008; Yin et al., 2017a; Elwardany et al., 2017), only the
top one inch of the field cores was tested.
In the NCHRP 9-54 project, materials collected from 18 projects with a wide range of
material components and characteristics were evaluated in order to develop a mixture LTOA
protocol for performance testing and prediction (Kim et al., 2018). The logarithm of the binder
complex shear modulus (log |G*|) and total absorbance area under the carbonyl and sulfoxide
peaks in the Fourier transform infrared (FT-IR) spectrum were used to quantify the aging level of
laboratory-aged mixtures and field cores. The project evaluated both compacted specimen and
loose mixture aging approaches with or without pressure and finally recommended using loose
mixture aging without pressure as the most appropriate aging procedure with the consideration of
specimen integrity, efficiency, and versatility. The project also compared loose mixture aging at

34
95°C and 135°C and found that the 135°C aging protocol significantly reduced the dynamic
modulus and fatigue resistance of asphalt mixtures. Thus, loose mixture aging at 95°C was
recommended as the LTOA procedure for laboratory performance evaluation. Finally, a
rheology-based kinetics model was developed to predict the field aging of asphalt pavements,
which was also used to determine the loose mixture aging durations for projects with different
climates, depths, and pavement in-service times.
2.4 Laboratory Mixture Cracking Tests
2.4.1 Energy Ratio
The Energy Ratio (ER) method was developed by researchers at the University of Florida to
assess the TDC resistance of asphalt mixtures (Roque et al., 2004). The ER approach uses an
HMA Fracture Mechanics Model that was also developed at the University of Florida (Zhang et
al., 2001). Recognizing that no single mixture property was able to accurately and consistently
correlate to TDC, Roque et al. (2004) combined the results of three tests used in the HMA
Fracture Mechanics Model to form a more comprehensive measurement of TDC susceptibility.
ER results accurately distinguished between cracked and uncracked sections in 19 of the 22
pavements studied in Florida and led to the development of ER criteria. In subsequent studies,
the ER method has been used to evaluate and predict the cracking resistance of mixtures using
field cores, laboratory testing, and mechanistic-empirical (M-E) design (Wang et al., 2007; Shu
et al., 2008; Wills et al., 2009; Moore, 2016; Song et al., 2018). Wang et al. (2007) incorporated
the Florida cracking model into M-E design using ER concept to develop a new M-E pavement
design tool for TDC. The new design tool could be used to conduct pavement thickness design
and pavement life prediction regarding to TDC in Florida. The Florida Department of
Transportation (FDOT) sponsored two research sections at the NCAT Test Track during the

35
summer of 2006 to validate the ER design concept. The same aggregate source and pavement
structure were used for these two sections, but two different binder types were selected (PG 67-
22 versus PG 76-22) to provide different ER values. As expected, the section designed with
higher ER proved to be more resistant to TDC (Willis et al., 2009). Shu et al. (2008) evaluated
the fatigue properties of mixtures using ER and beam fatigue tests. The plant mixtures used in
this study included RAP contents ranging from 0 % to 30 %. The results indicated that both ER
and beam fatigue tests agreed with each other in ranking the fatigue resistance of mixtures. A
similar laboratory study was conducted by Zhao et al. (2012) using warm-mix asphalt (WMA)
with high RAP contents. Though ER and beam fatigue tests yielded similar ranking results, the
cracking resistance of WMA increased with the higher RAP content. The suitability of ER test to
predict cracking resistance was evaluated using four NCAT Test Track sections by correlating the
laboratory test results with actual field cracking performance (Willis et al., 2016). The test results
indicated that the ER parameter didn’t correlate with the field cracking performance well, but the
dissipated creep strain energy measured during ER test had a good correlation with field cracking
performance. A similar study was conducted by West et al. (2016) using seven NCAT Test Track
sections constructed in 2006. All sections included similar pavement structure and the surface-
layer mixtures with various RAP contents and virgin binder grades. The virgin binder PG was
found to affect the field cracking performance significantly, and the creep strain rate measured as
part of ER method matched the field performance of the test sections.
2.4.2 Texas Overlay Test
The Texas Overlay Test (TX-OT) method was developed by the Texas A&M Transportation
Institute (TTI) in the late 1970’s to simulate reflective cracking of asphalt overlays on concrete
pavements. The original TTI small overlay tester was upgraded to a fully computer-controlled

36
system by Zhou and Scullion (2003), and four field projects on US 175 in Dallas were used to
validate the upgraded tester. The results indicated that the upgraded tester was able to effectively
identify asphalt mixtures with different cracking resistance. The method was refined in the early
2000’s by Zhou and Scullion (2005) who demonstrated that the test was sensitive to testing
temperature, maximum opening displacement (MOD), and asphalt binder content and type. The
test’s sensitivity to the mixture components was also investigated by Zhou et al. (2017a) using
five mixtures with a wide range of material characterizations. The results indicated that TX-OT
was sensitive to the RAP, reclaimed asphalt shingles (RAS), and binder content and type. A more
in-depth sensitivity study was performed by Walubita et al. (2012) that reviewed the current state
of the TX-OT in a number of laboratories in the United States. High variability (coefficient of
variation (COV) > 30%) was reported by many of the laboratories participating in the study.
Walubita et al. (2012) indicated that a significant proportion of the variability could be caused by
the sample drying method, glue quantity, number of replicates, air voids, aging condition of
samples, and temperature variation. Garcia and Miramontes (2015) also demonstrated that the
amount of torque applied to attach OT specimens, the amount of glue, the curing time of glue,
and the elapsed time between preparation and testing could also result in higher variability. In
addition, OT specimens with more uniform air void distributions had less variability compared
with specimens with greater air void distributions (Kassem et al., 2011).
Numerous studies have used the TX-OT to evaluate the cracking resistance of asphalt
mixtures. Estakhri et al. (2009) used the TX-OT to compare cracking resistance between WMA
and HMA using both field cores and plant mixtures. The results showed WMA and HMA were
comparable, which was also confirmed by the field performance. The effects of recycled
materials (RAP or RAS), modified binders, and rejuvenators on the mixture cracking resistance

37
were investigated by many researchers (Mogawer et al., 2011; Mogawer et al., 2013; Im et al.,
2014; Luo et al., 2015; Tran et al., 2016; Xie et al., 2017). In general, the use of modified binders
and rejuvenators to mitigate the negative impacts of recycled mixtures could increase the mixture
cracking resistance. Zhou et al. (2005) utilized TX-OT as part of a mixture design process to
characterize the reflective cracking resistance of mixture. A new mixture design method for
asphalt mixtures containing RAP and rejuvenators was developed by Im et al. (2016), and the
TX-OT was used to address the potential cracking issues caused by RAP and further to
determine the optimum asphalt content and rejuvenator content. The correlation between TX-OT
and field cracking performance was investigated using actual pavements and full-scale test
pavement sections. The study of Zhou and Scullion (2003) indicated that TX-OT test results
matched the field reflective cracking performance using four Texas projects. TX-OT results also
had good correlations with field fatigue cracking and low temperature cracking performance
(Zhou and Scullion, 2005; Zhou et al., 2005; Zhou et al., 2007). Similar conclusions were also
obtained using experimental sections at NCAT Test Track (West et al., 2016; Willis et al., 2016;
Xie et al., 2017). Zhou and Scullion (2005) recommended a TX-OT pass/fail criterion of number
of cycles to failure (Nf) greater than 300 for reflective cracking, and Nf >750 for reflective
cracking with the presence of a rich bottom layer. The Nf > 300 criterion was initially intended to
address reflective cracking, but it also worked well for predicting fatigue cracking (Zhou et al.,
2007). The TX-OT is also used in New Jersey since 45% of the New Jersey Department of
Transportation (NJDOT) roads are asphalt overlays on Portland cement concrete (Bennert and
Maher, 2008). In 2013, the NJDOT specified Nf >150 for surface mixtures with high RAP
contents (> 20%) and a performance grade (PG) 64-22 binder, and Nf >175 for surface mixtures
with high RAP contents (> 20%) and a PG 76-22 binder (Sheehy, 2013).

38
To address the high variability issue of the original TX-OT analysis method (Nf
parameter), new analysis methodologies were developed to characterize the healing and fracture
properties of asphalt mixtures (Koohi et al., 2013; Gu et al., 2015; Garcia et al., 2017; Cao et al.,
2019). Koohi et al. (2013) proposed a novel analysis method to predict the actual crack growth
rate in asphalt mixtures based on viscoelastic fracture mechanics and finite-element modeling,
which was further used to characterize the fracture and healing properties. The study indicated
that new test method provided more repeatable results than the previous method. Gu et al. (2015)
also developed a new methodology for the TX-OT using viscoelastic force equilibrium and
finite-element simulations to determine the crack growth function of asphalt mixtures.
Furthermore, a modified Paris law was employed to evaluate the fracture behavior of asphalt
mixtures, and two new parameters (A and n) was defined based on the theoretical equations.
Garcia et al. (2017) utilized a power equation to fit the normalized load-displacement curve, and
the fitting coefficient (β) was defined as cracking resistance index. In addition, the area under the
hysteresis loop at the maximum peak load in the first loading cycled was defined as critical
fracture energy (Gc), which indicated the energy required to initiate a crack. These two new
parameters were proven to satisfactorily discriminate the cracking resistance of mixtures and also
had much lower variabilities than the previous Nf parameter. Cao et al. (2019) further modified
the analysis method proposed by Garcia et al. (2017) through incorporating the viscoelastic
relaxation effects. The test results indicated that the adjusted analysis method had a good
correlation with the field cracking performance and comparable variability with Gc and β.
2.4.3 NCAT Modified Overlay Test
The NCAT-OT method was developed in 2014 (Ma, 2014). Specimen preparation and test setup
are the same as the TX-OT method described in Tex-248-F with two exceptions: 1) maximum

39
opening displacement and 2) loading frequency. Originally, TTI researchers selected the MOD at
0.635 mm to simulate the thermal expansion and contraction of concrete pavement joints in
Texas. Tran et al. (2012) and Ma (2014) proposed smaller MOD values to better simulate
reflection cracking in flexible pavements. Therefore, a MOD of 0.381 mm was selected for the
NCAT-OT method. Ma (2014) also found that at the lower MOD, the resulting Nf values at a
loading frequency of 0.1 Hz were very similar to the results obtained at 1 Hz. Therefore, the
faster loading frequency of 1 Hz was adopted in the NCAT-OT method to reduce testing time. It
is also important to note that the NCAT-OT method uses a different method to determine cycles
to failure than the TX-OT method. The NCAT-OT was further evaluated using the field
performance of five base-layer mixtures of NCAT Test Track (Ma et al., 2015). The test results
showed that NCAT-OT yielded similar ranking of these five mixtures with the four-point bending
beam fatigue test, and a good correlation between NCAT-OT and field fatigue performance was
also observed. Castro (2017) utilized both NCAT-OT and TX-OT methods to evaluate the effects
of a bio-based rejuvenator on the laboratory properties and field cracking performance of asphalt
mixtures. The test results indicated that NCAT-OT method showed a same statistical group
ranking of mixture properties with TX-OT method, but with a lower variability. Meanwhile, both
OT tests showed a good correlation with the field cracking performance. West et al. (2017) also
utilized NCAT-OT method to evaluate the relationship between laboratory results and fatigue
cracking of ten Federal Highway Administration’s (FHWA) Accelerated Loading Facility (ALF)
test lanes. NCAT-OT results showed a weak correlation with field fatigue performance and failed
to discriminate good and poor field fatigue performance.

40
2.4.4 Semi-circular Bend Test
The SCB test, although originally used to characterize fracture mechanisms of rocks (Chong and
Kuruppu, 1988), has been used by researchers to measure fracture properties of asphalt mixtures
for over a decade. The SCB test has been used to evaluate low-temperature fracture resistance,
and load-related cracking resistance at intermediate temperatures of asphalt mixtures (Li and
Marasteanu, 2004; Arabani and Ferdowsi, 2009; Huang et al., 2009; Kim et al., 2012). Each of
these studies used slightly different specimen geometries to determine the fracture properties.
Intermediate temperature cracking potential has been estimated by calculating the critical strain
energy release rate, or the J-integral (Jc). The Jc concept was first used to evaluate asphalt
mixtures containing with crumb rubber by Mull et al. (2002). Since then, the J-integral has been
used extensively in Louisiana to assess fatigue resistance of asphalt mixtures (Kim et al., 2012).
Kim et al. (2012) evaluated asphalt mixtures using both SCB and indirect tensile (IDT) tests and
found a good correlation between the SCB Jc and IDT Toughness Index for lab produced
mixtures. The field cracking performance was collected from nine field projects, which were
trafficked with 1-12 million ESALs during various in-service time of 7-11 years. Four types of
cracking pattern were collected using the automated road analyzer system, including transverse,
longitudinal, alligator, and random cracking. Note that only the fracture-related cracking patterns
of transverse and alligator cracking were used to correlate with the laboratory results (Kim et al.,
2012). The study determined that Jc correlated well with field cracking data despite an average
COV of 20% from 86 test mixtures. Mohammad et al. (2012) utilized asphalt mixtures from nine
rehabilitation field projects throughout Louisiana state to further validate SCB test. These field
projects have been trafficked for approximately ten years when the field cracking measurements
were performed. Analysis of the results indicated that there was a good correlation with Jc results

41
and the field cracking rate. Zhou et al. (2017a) also demonstrated that the SCB Jc ranking
matched the measured field fatigue and reflective cracking performance using six accelerated
pavement test (APT) sections in Texas. However, a poor or fair correlation between SCB test
results and field cracking performance was also observed by other researchers (West et al., 2016;
Willis et al., 2016; Castro, 2017; West et al., 2017; Xie et al., 2017; Cao et al., 2018; Cao et al.,
2019). The SCB test was used to evaluate the cracking resistance of four surface mixtures
containing various contents of recycled materials and rejuvenator at NCAT Test Track. The SCB-
Jc results were poorly correlated with the field cracking performance (Castro, 2017). Similar
conclusions were also obtained by other researchers using the measured field cracking
performance from NCAT Test Track (Willis et al., 2016; Xie et al., 2017). The cracking
resistance of ten mixtures from 2013 FHWA ALF experiment was assessed using SCB test, and
the results indicated that there was essentially no relationship between Jc results and measured
field cracking (West et al., 2017). Similar conclusions were also obtained by other studies (Cao
et al., 2018; Cao et al., 2019). Wu et al. (2005) analyzed the sensitivity of Jc to a wide variety of
mixture variables and found significant effects due to nominal maximum aggregate size
(NMAS), binder type, and the number of gyrations (Ndesign). Many studies have also
demonstrated that the SCB test is sensitive to mixture aging, binder content, binder type (PG
grade and polymer modification), and additives (e.g., rejuvenator and emulsifier) (Mohammad et
al., 2004; Elseifi et al., 2012; Kim et al., 2012; Zhou et al., 2017a; Song et al., 2018; Chen et al.,
2018; Jahanbakhsh et al., 2019). In addition, SCB test was proved to successfully discriminate
mixtures with temperature segregation, which indicated that samples with temperature
segregation generally yielded lower cracking resistance than control samples (Kim et al., 2017).
However, some researchers found that SCB test was not sensitive to recycled asphalt materials

42
(RAP or RAS), which indicated that the cracking resistance of asphalt mixtures increased with
the higher content of recycled asphalt materials (Kim et al., 2012; Chitragar and Singh, 2016;
Willis et al., 2016; Singh et al., 2017; Castro, 2017; Zhou et al., 2017a). This unexpected trend
might be caused by the absence of relaxation time, materials variability, and unaccountability of
post-peak behavior (Singh et al., 2017). Seven asphalt mixtures from three projects were utilized
to assess the effects of mix reheating and loading rate on the Jc results (Yin et al., 2017b). The
test results indicated an insignificant effect of mix reheating on the Jc results, and mixtures with a
higher loading rate showed higher Jc results than those mixtures tested with a lower rate.
2.4.5 Illinois Flexibility Index Test
Researchers at the University of Illinois developed another SCB test to screen out potentially
poor performing mixtures with high amounts of RAP and RAS. The Illinois Flexibility Index
Test (I-FIT) was found to be repeatable, and had a good field correlation and a significant spread
of test results, and correlated well to other current cracking tests (Ozer et al., 2016). The
sensitivity of I-FIT to different mixture design variables were investigated by many researchers
(Ling et al., 2017; Zhou et al., 2017a; Kim et al., 2018; Zhu et al., 2019; Mohammed-Ali et al.,
2019). The sensitivity of I-FIT to key asphalt mixture components was investigated using five
different mixtures by Zhou et al. (2017a), the results indicated that the I-FIT was sensitive to
asphalt content, recycled materials content (RAP and RAS), and softer binder. The cracking
resistance of eight plant-produced mixtures in Georgia was evaluated using I-FIT test, and the
results indicated that mixture design parameters had significant effects on the Flexibility Index
(FI), including RAP contents, NMAS, binder types and contents (Kim et al., 2018). In addition,
the I-FIT was also proven to be sensitive to mixture additives, including fiber filler, rejuvenator,
and sulfur (Castro, 2017; Ling et al., 2017; Espinoza-Luque et al., 2018; Mohammed-Ali et al.,
43
2019). Additionally, the effects of specimen configuration were explored in many studies,
including specimen thickness, air voids, notch length, and notch width. In general, the FI
decreased with the increasing specimen thickness and notch width, and the specimens with the
higher air voids and notch length were expected to yield greater FI value width (Barry, 2016;
Kim et al., 2018; Rivera-Perez et al., 2018; Batioja-Alvarez et al., 2019). Ozer et al. (2017) and
Barber et al. (2018) examined the effects of testing configuration (spring or bearing rollers) and
loading system (hydraulic or screw-driven) on the I-FIT, which were proved to be insignificant.
Nsengiyumva and Kim (2019) investigated the effect of I-FIT testing configuration on the test
results and their variability using six different load-support fixtures. Generally, the test results
measured with six load-support fixtures were comparable, but the roller springs could increase
the testing variability. Furthermore, the effects of loading rate and testing temperature were
inspected by some researchers, the I-FIT results generally decreased with the loading rate and
increased with the test temperature (Haslett, 2018; Son et al., 2019; Chen and Solaimanian,
2019). The correlation between I-FIT with field performance was validated using FHWA’s ALF,
NCAT Test Track, and in-service roads in Illinois, and the results indicated that I-FIT results had
a good correlation with field cracking performance (Castro, 2017; Xie et al., 2017; Al-Qadi et al.,
2017; Safi et al., 2019; Al-Qadi et al., 2019). Kaseer et al. (2018) developed a new cracking test
parameter, called the cracking resistance index (CRI), which was derived from the load-
displacement curve of I-FIT. The calculation of CRI was similar with FI by replacing the slope at
the inflection point with peak load. In general, the CRI had lower variability and showed greater
distinction between different asphalt mixtures, which was validated using Indian asphalt
mixtures by Batioja-Alvarez et al. (2019). Meanwhile, the CRI was also sensitive to the binder
PG, recycled materials content, and the presence of recycling agents (Kaseer et al., 2018).

44
2.4.6 Indirect Tensile Asphalt Cracking Test (a.k.a, IDEAL-Cracking Test)
The indirect tensile asphalt cracking test, more commonly known as the IDEAL-CT, was
developed by Zhou et al. (2017b) to evaluate the cracking resistance of asphalt mixtures for use
in mix design and quality assurance testing. The IDEAL-CT was found to be sensitive to
materials and volumetric parameters including RAP and RAS contents, binder grade, binder
content, air voids, and aging condition (Zhou et al., 2017b; Im and Zhou, 2017). NJDOT
conducted a comprehensive comparison study among different cracking tests to identify a
suitable test for fatigue cracking during mixture design and quality control, and the results
indicated that the IDEAL-CT test was sensitive to asphalt mixture volumetrics, composition,
binder grade and aging condition (Bennert et al., 2018). Lee et al. (2019) utilized IDEAL-CT to
evaluate the cracking resistance of mixtures with rejuvenators, and the results indicated that the
cracking test index (CTIndex) was sensitive to rejuvenator additive. The cracking resistance of
cold recycling mixtures with varying emulsion and cement contents was evaluated using IDEAL-
CT, and the results indicated that IDEAL-CT was sensitive to the varying emulsion and cement
contents (Dong and Charmot, 2018). Meanwhile, a ruggedness experiment found that the
IDEAL-CT was considered as rugged with the specified ranges of specimen thickness, loading
rate, test temperature, and air voids (Zhout et al., 2017b). The IDEAL-CT can be performed with
common IDT strength test equipment without the need for specimen trimming or notching. Many
studies showed that IDEAL-CT was simple and practical with respect to equipment, sample
preparation, and analysis, and it was also efficient with time and cost investment on equipment
(Zhou et al., 2017b; Im and Zhou, 2017; Bennert et al., 2018; Diefenderfer and Bowers, 2019).
In addition, the IDEAL-CT was observed to have a lower variability than other cracking tests
(Zhou et al., 2017b; Im and Zhou, 2017; Bennert et al., 2018; Diefenderfer and Bowers, 2019).

45
The correlations between IDEAL-CT and other cracking tests were investigated using ten
mixtures with different binder contents, binder PG, and recycled materials contents (RAP and
RAS) (Zhou et al., 2019). The test results presented that the CTIndex had a similar trend with TX-
OT and I-FIT results, and there was a good linear relationship existing among the results of these
three tests. Bowers et al. (2019) and Diefenderfer et al. (2019) also observed a good correlation
between IDEAL-CT and the Nflex Factor test using both plant-produced and laboratory-prepared
cold recycled mixtures, and IDEAL-CT provided greater discrimination than the Nflex Factor test
(Diefenderfer et al., 2019). In addition, NJDOT found a strong relationship between IDEAL-CT
and TX-OT, and the corresponding criteria of IDEAL-CT were established based on the previous
TX-OT criteria (Bennert et al., 2018). The correlation between IDEAL-CT with field
performance was further validated using FHWA’s ALF, full-scale test sections at MnROAD, and
in-service roads in Texas, and the results indicated that IDEAL-CT results had a good correlation
with fatigue cracking, reflective cracking, and thermal cracking (Zhou et al., 2019).

46
CHAPTER 3 RESEARCH METHODOLOGY
This chapter describes the experimental plan for this study, which includes: 1) determining the
critical aging (CA) protocol for TDC evaluation, and 2) validating the laboratory cracking tests
with the field cracking performance using real loading conditions. The materials and laboratory
tests used in this study are also summarized. For the critical aging protocol, materials from five
projects were used to select a preliminary aging protocol which was then validated with NCAT
TDC experimental mixtures. For the cracking test validation experiment, seven mixtures with a
wide range of cracking susceptibilities were designed and constructed on 2015 NCAT Test Track.
The field cracking performance of the seven test sections have been monitored weekly during
traffic loading. Six laboratory cracking tests were selected to evaluate the cracking resistance of
the seven mixtures.
3.1 Experimental Plan
3.1.1 Construction of NCAT TDC Experimental Test Sections
In 2015, seven experimental mixtures were designed and constructed on the NCAT Test Track
for the TDC experiment. Figure 3.1 illustrates the pavement structure of the seven test sections.
As can be seen, each mixture was constructed as a 1.5-inch surface layer on top of highly
polymer-modified asphalt base layer designed to be highly elastic to mitigate the occurrence of
bottom-up cracking (Moore, 2016; West et al., 2019). After construction, traffic was applied on
the test sections using the Test Track’s fleet of five heavily loaded trucks. Field cracking
performance was monitored weekly throughout the traffic cycle.
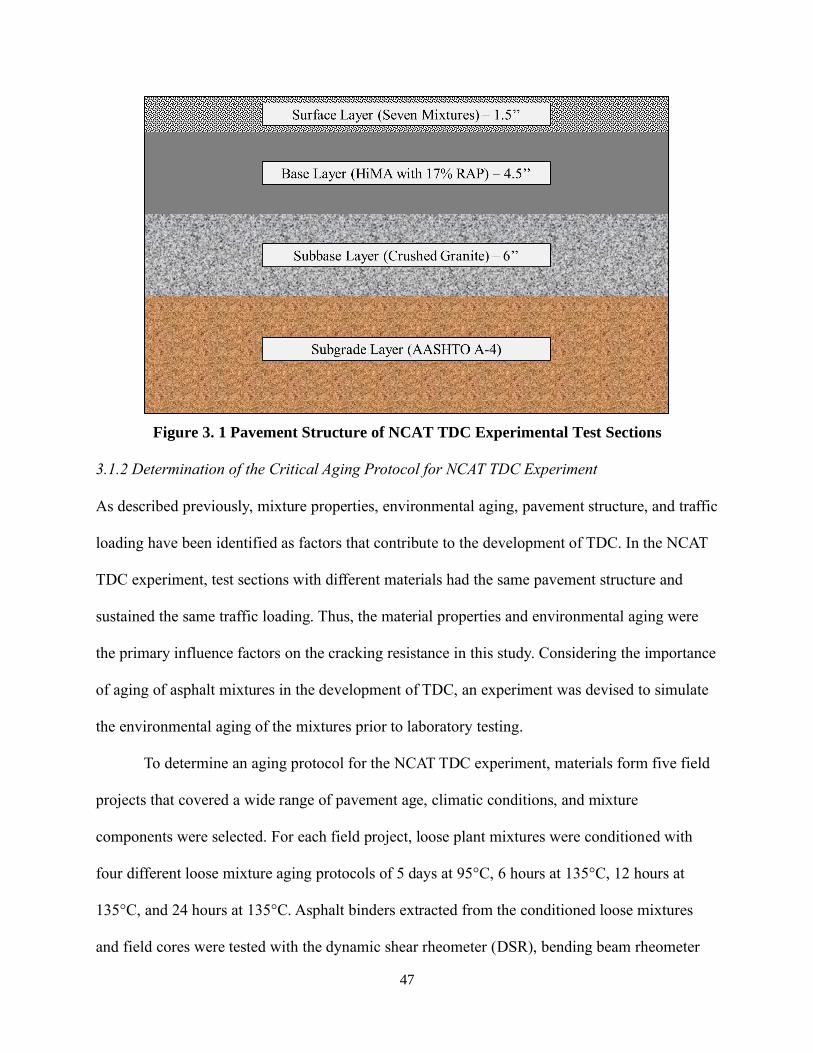
47
Figure 3. 1 Pavement Structure of NCAT TDC Experimental Test Sections
3.1.2 Determination of the Critical Aging Protocol for NCAT TDC Experiment
As described previously, mixture properties, environmental aging, pavement structure, and traffic
loading have been identified as factors that contribute to the development of TDC. In the NCAT
TDC experiment, test sections with different materials had the same pavement structure and
sustained the same traffic loading. Thus, the material properties and environmental aging were
the primary influence factors on the cracking resistance in this study. Considering the importance
of aging of asphalt mixtures in the development of TDC, an experiment was devised to simulate
the environmental aging of the mixtures prior to laboratory testing.
To determine an aging protocol for the NCAT TDC experiment, materials form five field
projects that covered a wide range of pavement age, climatic conditions, and mixture
components were selected. For each field project, loose plant mixtures were conditioned with
four different loose mixture aging protocols of 5 days at 95°C, 6 hours at 135°C, 12 hours at
135°C, and 24 hours at 135°C. Asphalt binders extracted from the conditioned loose mixtures
and field cores were tested with the dynamic shear rheometer (DSR), bending beam rheometer

48
(BBR), and Fourier transform infrared spectroscopy (FT-IR). The preliminary aging protocol was
determined by comparing the binder properties from the conditioned loose mixtures and field
cores. For validation of the aging protocol, the plant mixtures from the NCAT TDC experiment
were conditioned using this preliminary aging protocol, and field cores from each section were
collected annually after 2016. Several mixture and binder tests were used to compare mixture
and binder properties of the laboratory-aged plant mixtures and field cores.
3.1.3 Laboratory Cracking Tests of NCAT TDC Experiment
In this study, six laboratory cracking tests were selected by the experiment sponsors to evaluate
the cracking resistance of seven NCAT TDC experimental mixtures, including ER, TX-OT,
NCAT-OT, SCB, I-FIT, and IDEAL-CT. During the construction of 2015 NCAT Test Track, the
plant-produced mixtures of each section were sampled and stored in five-gallon buckets.
Laboratory-prepared mixtures of each section were also prepared based on the corresponding
mixture designs. For each mixture, both plant-produced samples and laboratory-prepared
samples were aged at 135 °C for 8 hours prior to compaction. After aging, the loose mixtures
were compacted with an SGC and then fabricated in accordance with the requirements of
different cracking tests. Analyses of the laboratory cracking test results included:
• Comparisons of corresponding plant mixtures and laboratory mixtures.
• Sensitivity of six cracking test results to aging, air voids, recycled asphalt materials, and
modified binder.
• Correlations among the cracking test parameters of six laboratory cracking tests.
• Assessment of how well the laboratory cracking test results correlate to measured
cracking in the test sections.

49
Figure 3. 2 Experimental Plan
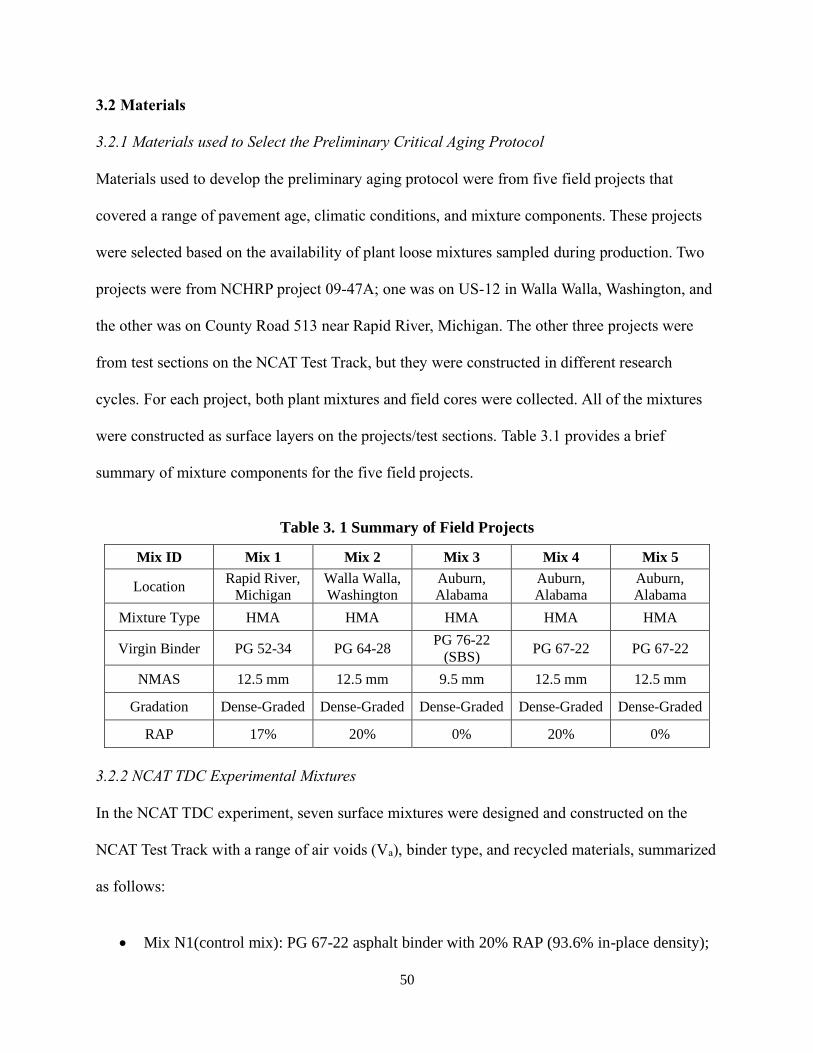
50
3.2 Materials
3.2.1 Materials used to Select the Preliminary Critical Aging Protocol
Materials used to develop the preliminary aging protocol were from five field projects that
covered a range of pavement age, climatic conditions, and mixture components. These projects
were selected based on the availability of plant loose mixtures sampled during production. Two
projects were from NCHRP project 09-47A; one was on US-12 in Walla Walla, Washington, and
the other was on County Road 513 near Rapid River, Michigan. The other three projects were
from test sections on the NCAT Test Track, but they were constructed in different research
cycles. For each project, both plant mixtures and field cores were collected. All of the mixtures
were constructed as surface layers on the projects/test sections. Table 3.1 provides a brief
summary of mixture components for the five field projects.
Table 3. 1 Summary of Field Projects
Mix ID Mix 1 Mix 2 Mix 3 Mix 4 Mix 5
Location Rapid River,
Michigan Walla Walla, Washington
Auburn, Alabama
Auburn, Alabama
Auburn, Alabama
Mixture Type HMA HMA HMA HMA HMA
Virgin Binder PG 52-34 PG 64-28 PG 76-22
(SBS) PG 67-22 PG 67-22
NMAS 12.5 mm 12.5 mm 9.5 mm 12.5 mm 12.5 mm
Gradation Dense-Graded Dense-Graded Dense-Graded Dense-Graded Dense-Graded
RAP 17% 20% 0% 20% 0%
3.2.2 NCAT TDC Experimental Mixtures
In the NCAT TDC experiment, seven surface mixtures were designed and constructed on the
NCAT Test Track with a range of air voids (Va), binder type, and recycled materials, summarized
as follows:
• Mix N1(control mix): PG 67-22 asphalt binder with 20% RAP (93.6% in-place density);

51
• Mix N2: the same mix as N1 with a higher density (96.1% in-place density);
• Mix N5: a similar mix as N1 with a lower density (90.3% in-place density) and lower
asphalt content;
• Mix N8: PG 67-22 asphalt binder with 20% RAP and 5% RAS;
• Mix S5: PG 58-28 styrene-butadiene-styrene (SBS)-modified binder with 35% RAP
material;
• Mix S6: a similar mix as N1 with a highly polymer modified asphalt (HiMA) binder.
Note that HiMA refers to the asphalt mix that contains an asphalt binder with 7.5%
styrene-butadiene-styrene polymer;
• Mix S13: a gap-graded 12.5 mm mixture with PG 67-22 modified with 20% ground tire
rubber.
Table 3.2 summarizes mix design and as-produced properties of the seven experimental
mixtures.

52
Table 3. 2 Mix Design and Quality Control Properties of the NCAT TDC Experimental Test Sections
N1
Control
N2
Control w/ High
Density
N5
Control w/ Low
Dens. & AC
N8
Control w/
5% RAS
S5
35% RAP
PG 58-28
S6
Control w/
HiMA
S13
Gap-Graded
Asphalt-Rubber*
Sieve Size Design QC Design QC Design QC Design QC Design QC Design QC Design QC
12.5 mm (1/2") 100 99 100 100 100 100 100 99 100 99 100 100 95 96
9.5 mm (3/8") 99 97 99 98 98 99 99 98 98 96 99 98 77 85
4.75 mm (#4) 74 67 74 70 74 73 70 66 74 73 74 67 38 35
2.36 mm (#8) 51 52 51 54 52 54 45 51 52 56 51 52 23 22
1.18 mm (#16) 39 41 39 43 41 42 35 41 41 44 39 42 18 19
0.60 mm (#30) 26 28 26 28 27 28 23 30 27 29 26 28 12 14
0.30 mm (#50) 15 15 15 15 15 15 14 17 15 16 15 15 7 8
0.15 mm (#100) 9 9 9 9 10 9 9 11 10 10 9 9 5 5
0.075 mm (#200) 6.2 5.4 6.2 5.6 6.3 5.7 6.1 7.1 6.3 6.3 6.2 5.4 3.3 3.6
Tot. Binder Content (Pb) 5.7 5.4 5.7 5.4 5.2 5.1 5.5 5.3 5.7 5.8 5.9 5.8 7.4 7.4
Eff. Binder Content (Pbe) 5.0 4.7 5.0 4.7 5.0 4.4 5.0 4.8 5.0 5.1 5.2 5.0 6.6 6.6
RAP Binder Ratio 0.19 0.20 0.19 0.20 0.21 0.21 0.20 0.20 0.33 0.33 0.18 0.19 0.07 0.07
RAS Binder Ratio -- -- -- -- -- -- 0.14 0.14 -- -- -- -- -- --
Dust/Binder Ratio 1.2 1.1 1.2 1.2 1.4 1.3 1.2 1.5 1.2 1.2 1.2 1.1 0.6 0.5
Rice Sp. Gravity (Gmm) 2.474 2.469 2.474 2.468 2.493 2.478 2.483 2.492 2.481 2.472 2.470 2.459 2.418 2.402
Bulk Sp. Gravity (Gmb) 2.375 2.375 2.375 2.372 2.355 2.348 2.383 2.415 2.382 2.393 2.371 2.384 2.273 2.319
Air Voids (Va), % 4.0 3.8 4.0 3.9 5.5 5.3 4.0 3.1 4.0 3.2 4.0 3.1 6.0 3.4
Agg. Bulk Gravity (Gsb) 2.654 2.634 2.654 2.631 2.665 2.633 2.668 2.672 2.665 2.656 2.654 2.634 2.647 2.631
Avg. VMA, % 15.6 14.7 15.6 14.7 15.9 15.4 15.5 14.4 15.7 15.1 16.0 14.7 19.9 18.4
Avg. VFA, % 75 74 75 73 65 66 74 79 75 79 75 79 71 81
Layer thickness (in.) 1.5 1.6 1.5 1.5 1.5 1.3 1.5 1.5 1.5 1.6 1.5 1.5 1.5 1.6
Mat Density (%Gmm) 94.0 93.6 97.0 96.1 91.0 90.3 94.0 91.5 94.0 92.2 94.0 91.8 94.0 92.7
Virgin Binder Grade PG 67 -22 PG 67 -22 PG 67 -22 PG 67 -22 PG 58 -28 PG 94 -22 67-22 +20% CR
Rec. Binder True Grade
(Plant Mixtures) 88.6 -16.6 89.9 -15.9 88.0 -18.5 107.3 -5.4 82.8 -23.0 101.4 -21.5 Not. Avail.
*50-blow Marshall Hammer compaction used for mix design and QC

53
3.3 Laboratory Binder Tests
3.3.1 Dynamic Shear Rheometer
A DSR was used to characterize the rheological properties of asphalt binders by measuring the
complex shear modulus (G*) and phase angle (δ) at a specific temperature and frequency. Figure
3.3 shows the DSR equipment and the sample preparation.
(a) (b)
Figure 3. 3 DSR Test; (a) DSR Equipment, (b) Sample Preparation
Extracted asphalt binders were first tested to determine the continuous high-temperature
performance grade (HPG) per AASHTO R 29 and M 320. In addition, the limited DSR
frequency sweep test was conducted at 20, 30, and 40°C and with an angular frequency range of
0.1 to 10 rad/s. The maximum oscillation strain was controlled at one percent to ensure the
asphalt binder was in the linear viscoelastic range. For data analysis, G* and δ master curves
were constructed by fitting the individual G* and δ results at each temperature and frequency to
the Christensen-Anderson-Marasteanu (CAM) model (Santagata et al., 1996), as expressed in
Equation (3.1). The master curves were then utilized to calculate the Glover-Rowe (G-R)
parameter using Equation (3.2) (Glover et al., 2005; Rowe, 2011). The G-R parameter considers

54
both binder stiffness and embrittlement and offers an indication of the cracking potential at
intermediate temperatures. Asphalt binders with higher G-R parameters are expected to have
experienced a greater level of aging than those with lower G-R parameters. A damage zone
between 180 kPa and 600 kPa was proposed for G-R parameter to evaluate the block cracking
susceptibility of asphalt binder, and the threshold values of this damage zone indicated the onset
damage and visible damage in pavements (Rowe, 2011). However, this damage zone was
developed using limited unmodified binder sources in one climate zone (Rowe, 2011). Thus, this
damage zone may not be appropriate for TDC evaluation.
* 1 ( )c
w
v vgG G
−
= +
90
1 ( )c
v
w
= +
(3.1)
Where:
Gg = glass modulus, assumed equal to 1 GPa;
ωc = crossover frequency;
ω = reduced frequency;
ν and w = model coefficients.
2
15 , 0.005 /
* cos( )
sin( )T C f rad s
GG R Parameter
= =
− =
(3.2)
The DSR linear amplitude sweep (LAS) test was conducted to evaluate the fatigue
resistance of extracted binders per AASHTO TP 101. The test consisted of two steps: a frequency
sweep test and an amplitude sweep test. In the first part of the LAS procedure, an initial 100
cycles were applied at small strain (0.1%) to determine undamaged linear viscoelastic properties.

55
The second part of the procedure consisted of ramping up the strain amplitude, beginning at
0.1% and ending at 30% applied strain, over 3,100 cycles of loading at 10 Hz. Once the strain
sweep was applied to the sample, damage accumulation was then determined using Viscoelastic
Continuum Damage (VECD) analysis, resulting in the fatigue power law damage model
(Equation 3.3), and the corresponding coefficients, A and B.
max( ) B
fN A −= (3.3)
Nf is the traffic volume failure criteria and defines the number of cycles to fatigue failure
at a user-defined damage level. γmax is the maximum tensile strain expected in the binder phase
under traffic loading, which will be a function of pavement structure. A is the LAS power-law
parameter representing the intercept at 1% strain. B is the LAS power-law parameter
representing the slope of the Nf-strain curve. The logarithmic slope of the storage modulus
[G’(ω)] as a function of angular frequency is used to calculate the damage accumulation,
quantified as the B-parameter. Safaei et al. (2014) recommended that the LAS test temperatures
be selected such that linear dynamic shear moduli corresponding to the test temperature and
frequency were within the range of 12 to 60 MPa to avoid confounding effects of flow or
adhesion loss (Safaei et al., 2014; Safaei et al., 2016). In this study, for all the evaluated asphalt
binders, the LAS test was performed using the 8 mm parallel plate geometry and at a temperature
of 28°C.
3.3.2 Bending Beam Rheometer
A BBR was used to characterize the resistance of asphalt binders to thermal cracking at low
temperatures. Figure 3.4 presents the BBR equipment and the loading frame, and Figure 3.5
shows the sample preparation.

56
(a) (b)
Figure 3. 4 BBR Test; (a) Test Equipment, (b) Loading Frame
Figure 3. 5 BBR Sample Preparation
The test was conducted to determine the low-temperature performance grade (LPG)
based on the creep stiffness (S) and m-value results per AASHTO T 313. The performance grade
determined with S (Tc,S) was reported as the continuous LPG, and the numerical difference
between Tc,S and performance grade determined with m-value (Tc,m) was defined as ΔTc
(Anderson et al., 2011), as shown in Equation 3.4. The ΔTc parameter is indicative of the

57
environmental-related cracking potential of asphalt binders; specifically, binders with a more
negative ΔTc are more likely susceptible to block cracking than those with a less negative ΔTc.
, ,c c S c mT T T = − (3.4)
3.3.3 Double-Edge-Notched Tension (DENT) Test
The DENT test was performed according to AASHTO TP 113, where three specimens with
different ligament lengths (5, 10 and 15 mm) were loaded in monotonic, direct tension mode
with a rate of 100 mm/min. at 25°C until failure. Ductile failure can be assessed by visually
observing failed samples at the end of the test. During the failure process, the load versus
displacement curves were recorded and total energy of failure was calculated. The failure process
consisted in a continuous flow of energy through the plastic deformation region to the failure
region, with energy being partitioned between a plastic “outer” zone and an autonomous “inner”
zone. Therefore, there was a progressive reduction of the energy release rate in the failure zone
as the two new surfaces of material were created. The work performed to create new surfaces of
material in the crack end region was defined by Cotterell and Reddel (1977) as the “essential
work”. Therefore, the total energy of ductile failure was composed of two parts: (I) “the essential
work performed in the end region” and (II) “the non-essential work performed in the screening
plastic region.”
The essential work of fracture (We) is proportional to the failure area [i.e. ligament length
(l) multiplied by sample thickness (B)], while the non-essential work (Wp), or the plastic work, is
proportional to the volume of the plastic zone [i.e. failure area (l x B) multiplied by ligament
length and a β factor]. The β factor depends on the shape of the plastic zone. Because the
ligament length holds significance in determining the extent of plastic deformation it can be
distinctly incorporated as (l x β) and multiplied with the surface area to express the volume

58
dependence of the plastic work of fracture, Wp. The mathematical expression for the total work
of fracture (Wf) is given by Equation 3.5:
2
f e p e pW W W lBw l Bw= + = +
(3.5)
Where:
we and wp are the corresponding specific terms for We and Wp.
This equation represents a thermodynamic approach to the failure process. Written in
specific terms, total work of fracture divided by the failure area (l x B), becomes the total
specific work of fracture (wf) (Equation 3.6):
f e pw w lw= + (3.6)
The plot of the total specific work of fracture (wf) versus the ligament length (l) results in
a straight line, having an intercept equal to the essential work of fracture (we) and a slope equal
to the specific plastic work of fracture multiplied by the shape factor (β x wp). Cotterell and
Reddel (1977) also observed that “the screening plastic zone vanishes for small ligaments” and
defined critical tip opening displacement (CTOD or δ) as the ultimate elongation for zero
ligament length. As a result, they defined the value of essential work per Equation 3.7:
ew = (3.7)
Where:
(σ) represents the yield stress in tension.
A minimum of three specimens with various ligament lengths (e.g. 5 mm, 10 mm and 15
mm) can provide enough information for the approximate calculation of the CTOD or strain
tolerance of the material. The essential work of fracture can be determined as the intercept of the

59
plot of the total specific work of fracture versus the ligament length, while the peak stress of the
sample with the smallest ligament length (5 mm) can be used to approximate the yield stress of
the material. Finally, the CTOD can be calculated as the ratio between the specific work of
fracture and the peak stress for the smallest ligament length sample (in this case, 5 mm). The
capacity of CTOD parameter to predict fatigue failure was validated during the 2002
Accelerating Loading Facility (ALF) experiment at Turner Fairbank Highway Research Center
and on other testing sites in North America.
3.3.4 Fourier Transform Infrared Spectroscopy
An FT-IR measures the infrared light absorbed by the material, and the absorption depends on
the constituents and chemical function groups in the material. In this study, FT-IR was used to
measure the infrared spectrum of asphalt binders extracted and recovered from the laboratory
and field aged mixtures to determine their compositional changes with aging. The test was
conducted using a Nicolet 6700 FT-IR spectrometer with attenuated total reflectance (ATR)
setup, as shown in Figure 3.6.
Figure 3. 6 Nicolet 6700 FT-IR Spectrometer and Mechanism of ATR
As shown in Figure 3.6, the asphalt samples were prepared and placed on the ATR crystal
area to assure the contact with the evanescent wave. During the spectrum collection, the
absorbance value and corresponding frequency were recorded at region of 4000-650 cm-1. The
scanning resolution was set to be 0.5 cm-1, and the measured spectrum was saved after 64 scans

60
for each replicate. The FT-IR carbonyl area (FT-IR CA), defined as the integrated peak area for
the wavelength range from 1820 to 1650 cm-1 (Liu et al., 1998), was used to characterize the
oxidation level of asphalt binders extracted from mixtures with various aging levels. Figure 3.7
shows an example of a full spectrum and the illustration of FT-IR CA. Asphalt binders with
higher FT-IR CA are expected to have experienced a greater level of oxidative aging than those
with lower FT-IR CA.
(a)
(b)
Figure 3. 7 Illustration of FT-IR Analysis; (a) Full Spectrum, (b) FT-IR Carbonyl Area
0.0
0.1
0.2
0.3
0.4
65010501450185022502650305034503850
Ab
sorb
an
ce (
a.u
.)
Frequency (cm-1)
0.00
0.02
0.04
0.06
0.08
0.10
1600170018001900
Ab
sorb
an
ce (
a.u
.)
Frequency (cm-1)

61
The FT-IR test procedure is summarized as follows:
• Prepare the following items: asphalt sample, heat gun, paper tissues, plastic spatula, metal
spatula, towel, thick gloves, and chemical solvent (Big Orange-E, and Acetone).
• Preheat the asphalt sample at 135°C prior to FT-IR testing.
• Use a metal spatula to blend/stir the heated asphalt sample to achieve homogeneity.
• Collect FT-IR background spectrum.
• Apply a thin film of asphalt sample on the ATR crystal with a plastic spatula.
• Collect FT-IR spectrum (two replicates per sample).
• Apply a few drops of chemical solvent (Big Orange-E) and use a plastic spatula to
remove the asphalt sample (Be cautious not to damage the ATR crystal).
• Apply a few drops of Acetone on the ATR crystal between samples.
• Repeat above steps for the next replicate or sample.
3.4 Laboratory Mixture Cracking Tests
3.4.1 Energy Ratio
For each mixture, three specimens, 150 mm in diameter by 38 to 50 mm thick, cut from gyratory
compacted samples, were prepared. The air voids for these samples were the target air void
content ± 0.5%. The specimens were fitted with extensometers both vertically (in the loading
direction) and horizontally (perpendicular to the load) to measure deformation on both faces of
the specimen, as shown in Figure 3.8. The ER is determined from results of the resilient modulus
(MR) (ASTM D7369), creep compliance (AASHTO T322), and IDT strength (ASTM D6931).
All three individual tests were performed at 10°C using a servo-hydraulic testing device.
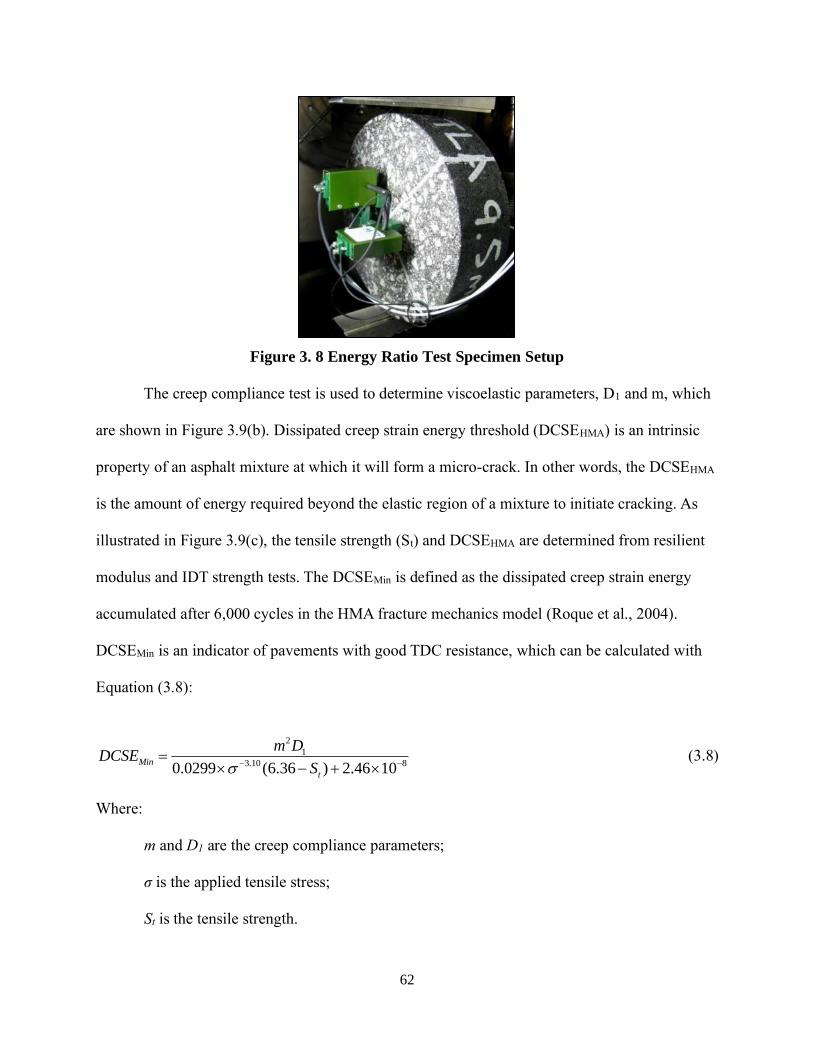
62
Figure 3. 8 Energy Ratio Test Specimen Setup
The creep compliance test is used to determine viscoelastic parameters, D1 and m, which
are shown in Figure 3.9(b). Dissipated creep strain energy threshold (DCSEHMA) is an intrinsic
property of an asphalt mixture at which it will form a micro-crack. In other words, the DCSEHMA
is the amount of energy required beyond the elastic region of a mixture to initiate cracking. As
illustrated in Figure 3.9(c), the tensile strength (St) and DCSEHMA are determined from resilient
modulus and IDT strength tests. The DCSEMin is defined as the dissipated creep strain energy
accumulated after 6,000 cycles in the HMA fracture mechanics model (Roque et al., 2004).
DCSEMin is an indicator of pavements with good TDC resistance, which can be calculated with
Equation (3.8):
2
1
3.10 80.0299 (6.36 ) 2.46 10Min
t
m DDCSE
S − −=
− + (3.8)
Where:
m and D1 are the creep compliance parameters;
σ is the applied tensile stress;
St is the tensile strength.
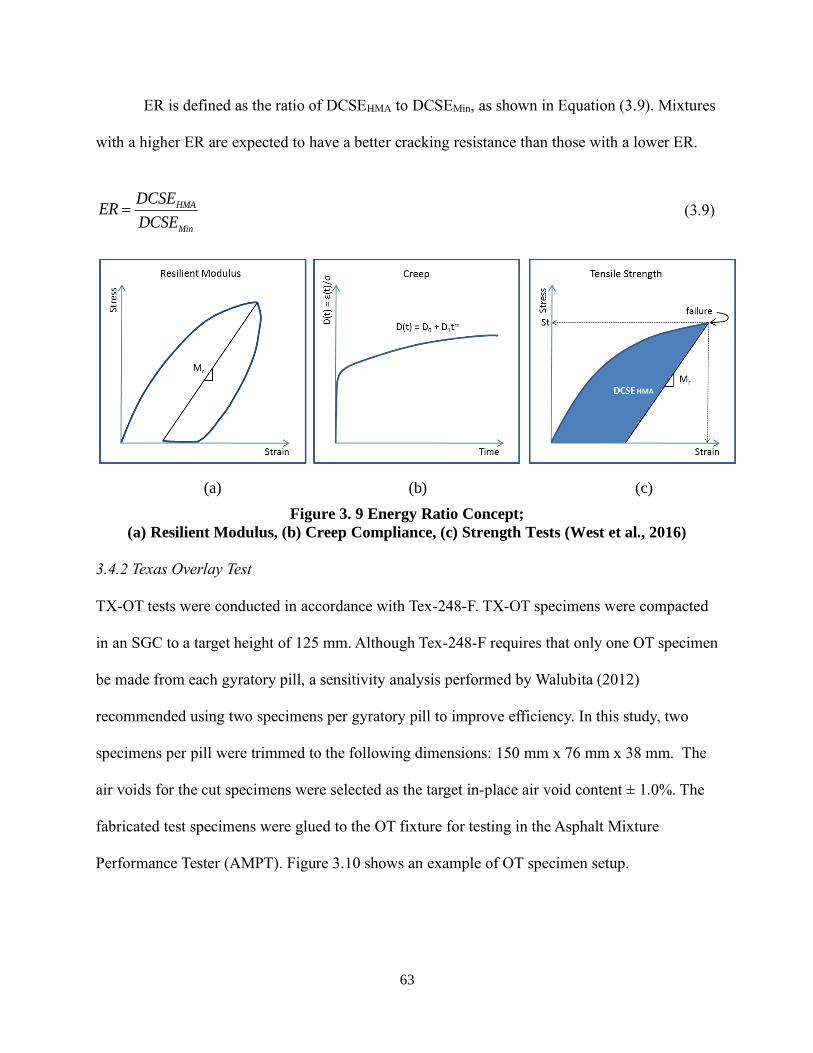
63
ER is defined as the ratio of DCSEHMA to DCSEMin, as shown in Equation (3.9). Mixtures
with a higher ER are expected to have a better cracking resistance than those with a lower ER.
HMA
Min
DCSEER
DCSE= (3.9)
(a) (b) (c)
Figure 3. 9 Energy Ratio Concept;
(a) Resilient Modulus, (b) Creep Compliance, (c) Strength Tests (West et al., 2016)
3.4.2 Texas Overlay Test
TX-OT tests were conducted in accordance with Tex-248-F. TX-OT specimens were compacted
in an SGC to a target height of 125 mm. Although Tex-248-F requires that only one OT specimen
be made from each gyratory pill, a sensitivity analysis performed by Walubita (2012)
recommended using two specimens per gyratory pill to improve efficiency. In this study, two
specimens per pill were trimmed to the following dimensions: 150 mm x 76 mm x 38 mm. The
air voids for the cut specimens were selected as the target in-place air void content ± 1.0%. The
fabricated test specimens were glued to the OT fixture for testing in the Asphalt Mixture
Performance Tester (AMPT). Figure 3.10 shows an example of OT specimen setup.
HMA

64
Figure 3. 10 TX-OT Specimen Setup
During the test, one side of the fixture remains fixed while the other side moves in a
displacement-controlled mode applying a sawtooth wave form once per 10 second cycle (5
seconds of loading, 5 seconds for unloading). Testing was performed at 25°C with a maximum
displacement of 0.635 mm per cycle. The peak load of each cycle was measured, and the test
reached failure when the peak load reached 93% of the initial peak load and the number of cycles
to failure (TX-Nf) was recorded.
Garcia et al. (2017) proposed a new analysis methodology for the TX-OT test that
requires the calculation of two parameters: critical fracture energy (Gc) and crack resistance
index (β). In the first loading cycle, the area under the hysteresis loop at the maximum peak load
is used to determine the Gc, as presented in Figure 3.11(a) and Equation (3.10). Gc indicates the
energy required to initiate a crack at the first loading cycle. Note that Gc is a stiffness indicator,
not cracking test parameter, thus, it is not included in this study.
cc
WG
b h=
(3.10)

65
Where:
Wc is the fracture area (lb.-inch);
b is the specimen width (inch);
h is the specimen height (inch).
In addition, the crack driving force (maximum peak load) of each loading cycle is
measured and utilized to develop the load reduction curve. The load reduction curve is
normalized by the maximum peak load of the first loading cycle in order to compare the results
among different mixtures. The normalized load (NL) reduction curve is fitted with a power
equation, and the power coefficient (absolute value) of the power equation is determined as the
cracking test parameter β, as shown in Figure 3.11(b). The coefficient of regression (i.e., R2) of
the fitted line is usually higher than 0.9. β is indicative of the flexibility and fatigue behavior of
mixtures during the crack propagation phase. Mixtures with lower β values are expected to have
better cracking resistance than those with higher β values.
(a)

66
(b)
Figure 3. 11 Illustration of the New Analysis Methodology of TX-OT; (a) Wc, (b) β
3.4.3 NCAT Modified Overlay Test
As noted previously, the NCAT method differs from the TX-OT in three ways: 1) a smaller
maximum displacement, 2) a faster load frequency, and 3) a different method of determining
specimen failure. The NCAT-OT failure definition uses the concept proposed by Rowe and
Bouldin (2000) for the bending beam fatigue test (Ma, 2014). This approach uses the peak of the
“normalized load x cycle” (NLC) curve to identify the transition from micro-crack formation to
macro-crack formation and thus, failure. A comparison between the failure definitions of the two
OT methods is shown in Figure 3.12.

67
Figure 3. 12 Determination of the failure point for NCAT-OT vs. TX-OT
The cycle that corresponds to the maximum product of the load and the cycle is reported
as the NCAT-Nf for the test. Ma (2014) reported significantly lower coefficient of variation
(COV) values for this method compared to the Tex-248-F method. Furthermore, the NLC failure
definition more closely matched the point at which cracks propagated completely through the
specimen as evidenced in video analysis. The new analysis methodology illustrated in Figure
3.11 can also be used to determine the critical fracture energy (NCAT-Gc) and crack resistance
index (NCAT-β) from results using the NCAT-OT method.
3.4.4 Semi-Circular Bend Test
The SCB test was performed in accordance with a draft specification developed by the Louisiana
Transportation Research Center (LTRC). This procedure uses SCB specimens with three
different notch depths: 25.4, 31.8, and 38.1 mm (Cooper III et al., 2016), as shown in Figure 3.13
(a). For each mixture, six gyratory specimens were prepared and then cut in half to produce 12
semi-circular specimens. The gyratory specimens were compacted to a target height of 57 mm
tall and a target air void content ± 0.5%. A notch was then cut to the specified depth along the
center axis of the semi-circular specimen. The target notch width was 3.0 ± 0.5 mm. Four
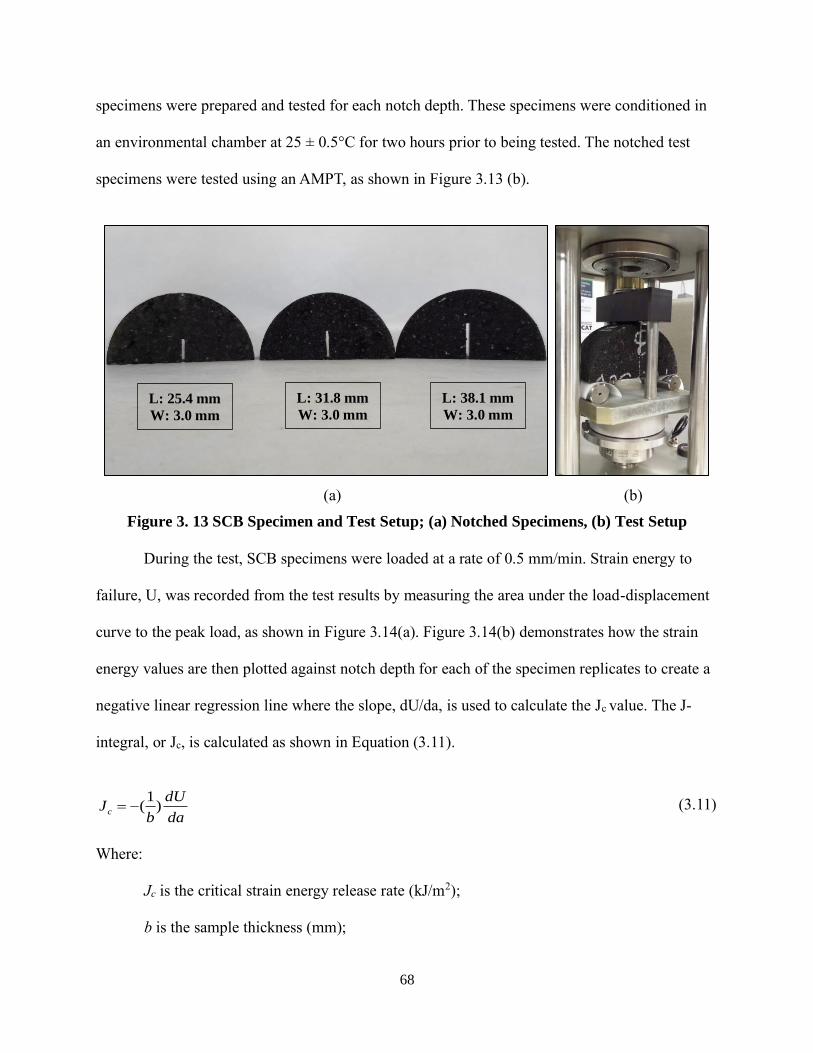
68
specimens were prepared and tested for each notch depth. These specimens were conditioned in
an environmental chamber at 25 ± 0.5°C for two hours prior to being tested. The notched test
specimens were tested using an AMPT, as shown in Figure 3.13 (b).
(a) (b)
Figure 3. 13 SCB Specimen and Test Setup; (a) Notched Specimens, (b) Test Setup
During the test, SCB specimens were loaded at a rate of 0.5 mm/min. Strain energy to
failure, U, was recorded from the test results by measuring the area under the load-displacement
curve to the peak load, as shown in Figure 3.14(a). Figure 3.14(b) demonstrates how the strain
energy values are then plotted against notch depth for each of the specimen replicates to create a
negative linear regression line where the slope, dU/da, is used to calculate the Jc value. The J-
integral, or Jc, is calculated as shown in Equation (3.11).
1
( )c
dUJ
b da= − (3.11)
Where:
Jc is the critical strain energy release rate (kJ/m2);
b is the sample thickness (mm);
L: 25.4 mm
W: 3.0 mm
L: 31.8 mm
W: 3.0 mm
L: 38.1 mm
W: 3.0 mm
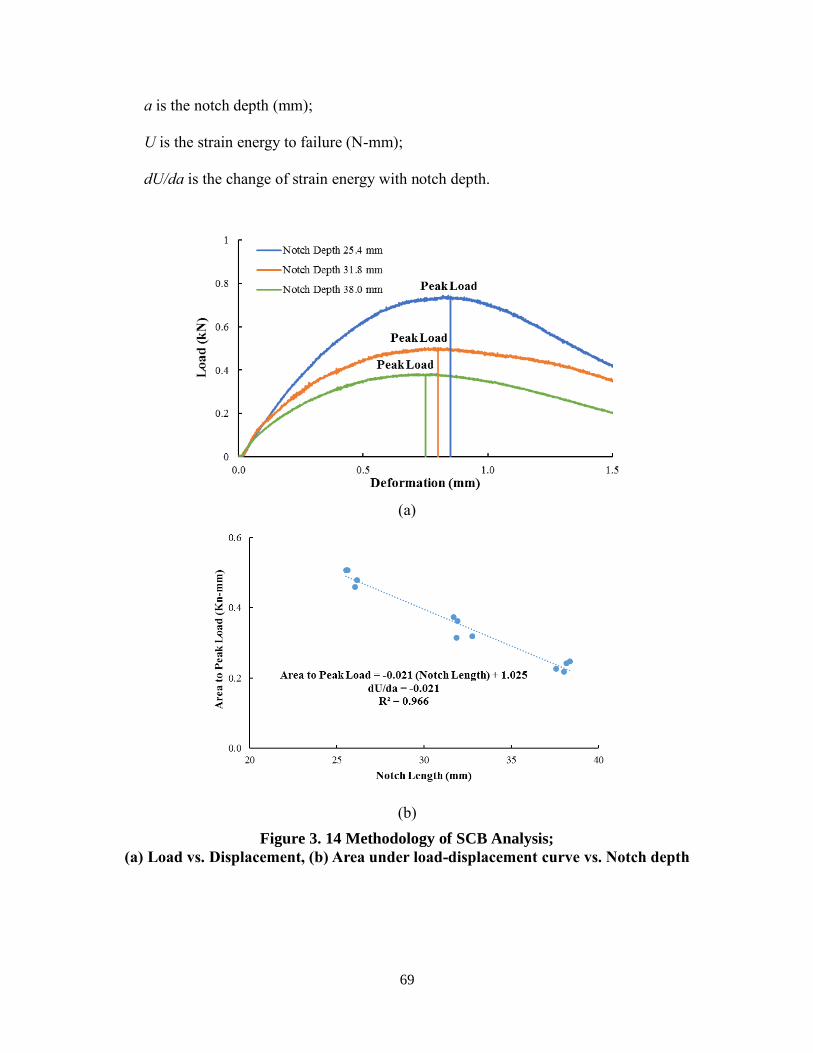
69
a is the notch depth (mm);
U is the strain energy to failure (N-mm);
dU/da is the change of strain energy with notch depth.
(a)
(b)
Figure 3. 14 Methodology of SCB Analysis;
(a) Load vs. Displacement, (b) Area under load-displacement curve vs. Notch depth

70
3.4.5 Illinois Flexibility Index Test
The I-FIT was performed in accordance with AASHTO TP 124 using a standalone, servo-
hydraulic I-FIT test device, as shown in Figure 3.15 (a). I-FIT specimens were prepared to the
target air voids ± 0.5% after trimming. A minimum of six replicates were prepared for this study.
Each specimen was trimmed from a larger 160 mm tall by 150 mm diameter gyratory specimen.
Four replicates were obtained per specimen, and the thickness is required to be 50 ± 1 mm. A
notch was then cut into each specimen at a target depth of 15 mm and width of 1.5 mm along the
center axis of the specimen, as shown in Figure 3.15 (b). Tests were conducted at 25.0 ± 0.5°C
after being conditioned in an environmental chamber for 2 hours.
(a) (b)
Figure 3. 15 I-FIT Test Setup and Specimen; (a) Test Setup, (b) I-FIT Specimen
During the test, specimens were loaded over two rollers at a rate of 50 ±2.0 mm/min, and
the load and corresponding displacement were recorded at a rate of 50 Hz by the computer
system. The load versus displacement curve was plotted and used to determine the slope at
inflection point (m) and the area under the curve, defined as fracture work (Wf), as shown in
L: 15.0 mm
W: 1.5 mm
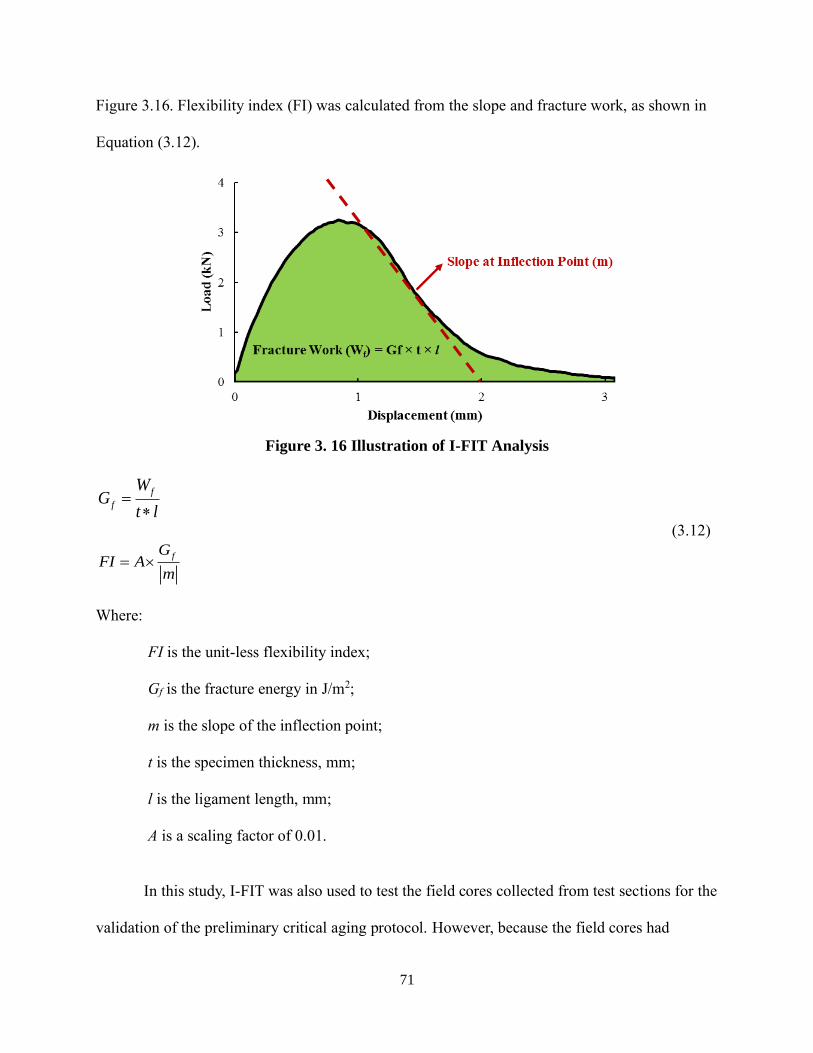
71
Figure 3.16. Flexibility index (FI) was calculated from the slope and fracture work, as shown in
Equation (3.12).
Figure 3. 16 Illustration of I-FIT Analysis
f
f
WG
t l=
(3.12)
fGFI A
m=
Where:
FI is the unit-less flexibility index;
Gf is the fracture energy in J/m2;
m is the slope of the inflection point;
t is the specimen thickness, mm;
l is the ligament length, mm;
A is a scaling factor of 0.01.
In this study, I-FIT was also used to test the field cores collected from test sections for the
validation of the preliminary critical aging protocol. However, because the field cores had

72
inconsistent thickness and air voids, their results were adjusted by applying a thickness
correction factor and a density correction factor to the FI values, as shown in Equation 3.13
(Rivera-Perez, 2017). In this study, post-construction field cores collected from the NCAT Test
Track had thicknesses ranging between 30 and 40 mm and air voids between 7.0 to 10.0 percent.
2
0.0651 = Measured
50
F
a a
tCorrected FI FI
V V
− (3.13)
Where:
tF is the thickness of field cores, mm;
Va is the air voids of field cores (%).
3.4.6 Indirect Tensile Asphalt Cracking Test
The IDEAL-CT test was performed using a stand-alone, servo-hydraulic device and in
accordance with ASTM D 8255-19. IDEAL-CT specimens were compacted to a target height of
57 mm and a target air void content ± 0.5% using an SGC. A minimum of six replicates were
prepared for each mixture. The specimens were tested at 25.0 ± 0.5°C after being conditioned in
an environmental chamber for 2 hours. The IDEAL-CT was performed using a common IDT test
fixture loaded at a rate of 50 mm/min, as presented in Figure 3.17.

73
Figure 3. 17 IDEAL-CT Test Setup
During the test, load and displacement were recorded at a rate of 50 Hz. The load vs.
displacement curve was plotted and used to determine the post-peak slope corresponding to 75%
of the peak load (P75) and the total area under the curve, defined as fracture work (Wf), as shown
in Figure 3.18. The interval slope (m) is the slope between P85 and P65 when the load is reduced
to 85% and 65% of the peak load, respectively. The corresponding loads (P85, P65) and
displacements (l85, l65) were utilized to calculate the absolute value of the interval slope (|m|), as
presented in Figure 3.18. The cracking test index (CTIndex) is computed based on |m| and Gf and
l75, as shown in Equation (3.14).
f
f
WG
t D=
(3.14)
75
62
f
Index
G ltCT
m D=
Where:
CTIndex is the unit-less cracking index;
Gf is the fracture energy in J/m2;
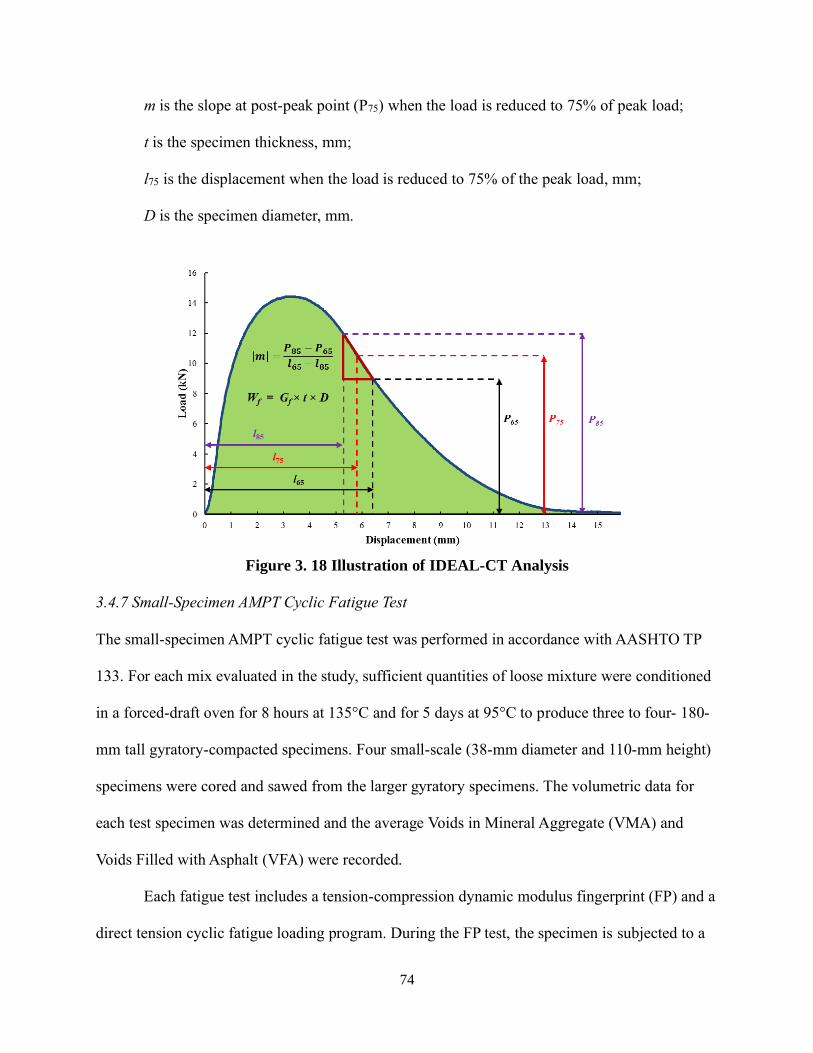
74
m is the slope at post-peak point (P75) when the load is reduced to 75% of peak load;
t is the specimen thickness, mm;
l75 is the displacement when the load is reduced to 75% of the peak load, mm;
D is the specimen diameter, mm.
Figure 3. 18 Illustration of IDEAL-CT Analysis
3.4.7 Small-Specimen AMPT Cyclic Fatigue Test
The small-specimen AMPT cyclic fatigue test was performed in accordance with AASHTO TP
133. For each mix evaluated in the study, sufficient quantities of loose mixture were conditioned
in a forced-draft oven for 8 hours at 135°C and for 5 days at 95°C to produce three to four- 180-
mm tall gyratory-compacted specimens. Four small-scale (38-mm diameter and 110-mm height)
specimens were cored and sawed from the larger gyratory specimens. The volumetric data for
each test specimen was determined and the average Voids in Mineral Aggregate (VMA) and
Voids Filled with Asphalt (VFA) were recorded.
Each fatigue test includes a tension-compression dynamic modulus fingerprint (FP) and a
direct tension cyclic fatigue loading program. During the FP test, the specimen is subjected to a

75
non-damaging strain amplitude that produces a target on-specimen strain ranging between 50 and
75 µm. Strain on the specimen are measured using three LVDTs with a 70-mm gauge length
attached to steel targets that are glued to the specimen with a quick-cure epoxy. The FP is carried
out at a single frequency of 10 Hz and a single temperature. The specimens are then subjected to
a direct tension cyclic fatigue test at 10 Hz, in actuator displacement control mode. The target
on-specimen strain level for the test is determined per the AASHTO TP 133 guidance. After
completing the test, data from three specimens were used to construct a dynamic modulus master
curve and three additional specimens were used for the determination of fatigue characteristics
using continuum damage theory. The on-specimen strain amplitude increases gradually as the
specimen is damaged and the ability of the specimen to resist displacement is diminished. Data
from both dynamic modulus and AMPT cyclic fatigue tests were analyzed using the FlexMATTM
spreadsheet.
The damage capacity index, Sapp, is the latest development for simplified-viscoelastic
continuum damage mixture performance analysis. It is derived from the representative fatigue
damage parameter that corresponds to Cavg (average pseudo stiffness of the material during
fatigue testing) on the damage characteristic curve (Etheridge et al., 2019). The Sapp value is
calculated using Equation 3.15. In this study, the Sapp at 21°C was used to compare the fatigue
resistance of plant-mixed, lab-compacted (PMLC) specimens with different laboratory aging
protocols.
12
11
1
1112
* 4
1000
R C
T
app
Da
CS
E
+
−
=
(3.15)
Where:

76
aT is the time-temperature shift factor computed at the reference temperature;
C11 and C12 are power law coefficients to fit the damage characteristic curve;
α is the damage growth rate in the governing evolution law;
|E*| is the dynamic modulus at 10 Hz and the temperature of interest;
DR is the average reduction in pseudo stiffness up to failure.
3.4.8 Summary
Table 3.3 summarizes the test details of six laboratory cracking tests, including test equipment,
loading condition, test temperature, time to complete steps, and the typical test variability (i.e.,
COV). For each cracking test, the equipment listed in the table were used in the NCAT
laboratory; other agencies might use different equipment. The time to complete each test
consisted of four parts, which included cutting time, preparation time, condition time, and test
time. The cutting time only considered the process of trimming the compacted gyratory samples
to specimens of required configuration using the cutting equipment at the NCAT laboratory. The
preparation work included bulking, drying, measuring dimensions, and instrumentation (e.g.,
gluing samples). The test time only counted the testing process using the test equipment in
NCAT laboratory for the number of specimens representing one test. Note that the all of the
times listed were estimated based on the average NCAT operation speed for one set of
specimens. In addition, the COV value for each cracking test was summarized based on the
limited literature review (Ma, 2014; Moore, 2016; Zhou et al., 2016).

77
Table 3. 3 Summary of Laboratory Cracking Tests
Test Name Test
Equipment
Loading
Condition
Test
Temperature
Time Test
Variability Cutting Preparation Condition Test
ER
MR
MTS
Five cyclic haversine
waveform loading to
horizontal 100-200µɛ (0.1s loading followed by
0.9s relaxing)
10 °C 10-15 min 0.5 days Overnight 1 day Not
Available IDT Monotonic vertical axis
loading at 50 mm/min
Creep
Static loading for 1000s
Controlling horizontal ɛ100s
(100-150 micro-inch) and
ɛ1000s (< 750 micro-inch)
TX-OT AMPT
Displacement-controlled
cyclic loading to 0.635 mm
using sawtooth waveform at 0.1 Hz
25 °C 1-1.5 hours 0.5 days
(overnight
curing)
2 hours Varies
(hours-days)
30-50%
COV
NCAT-OT AMPT
Displacement-controlled
cyclic loading to 0.381 mm
using sawtooth waveform at 1.0 Hz
25 °C 1-1.5 hours 0.5 days
(overnight
curing)
2 hours Varies
(hours-days)
20-30%
COV
SCB AMPT Monotonic three-point
bending at 0.5 mm/min 25 °C 3-4 hours 3-4 hours 2 hours 1.5-2 hours
Not
Available
I-FIT
Stand-alone
servo
hydraulic
Monotonic three-point bending at 50 mm/min
25 °C 1.5-2 hours 1.5-2.5 hours 2 hours 10-15 min 10-20%
COV
IDEAL-CT
Stand-alone
servo
hydraulic
Monotonic vertical axis loading at 50 mm/min
25 °C No Need 1 hour 2 hours 10-15 min 10-20%
COV

78
CHAPTER 4 SELECTING A PRELIMINARY CRITICAL AGING PROTOCOL
Considering the importance of age hardening of asphalt mixtures in the development of TDC,
laboratory specimens should be short-term conditioned and long-term aged prior to testing.
Although some long-term aging protocols have been proposed for use in mixture design and
performance testing, their correlations with field aging have not been identified. In addition, the
traditional expectation of long-term aging has been to simulate seven to ten years of field aging,
but that length of time may not be appropriate to evaluate TDC which more commonly occurs in
the first five years of service. In this chapter, the critical field aging condition was first identified
using cumulative degree-days (CDD) instead of pavement in-service time. Furthermore, a
preliminary critical aging protocol was selected through correlating field aging with four
laboratory loose mixture aging protocols in terms of their effects on the rheological and
oxidation properties of asphalt binders.
4.1 Identification of Critical Field Aging for TDC
Pavement in-service time (e.g. months or years) at the time of coring is commonly used to
quantify field aging of asphalt mixtures. Time, however, fails to differentiate the aging of
pavements in different climates and construction seasons. Generally, for the same amount of
time, field aging is more severe in warmer climates than in colder climates. In NCHRP project
09-52, the CDD parameter was proposed to overcome this shortcoming (Newcomb et al., 2015).
As expressed in Equation (4.1), CDD was defined as the accumulation of the daily high
temperature above freezing for all the days being considered from the time of construction to the
time of coring or field inspection. Compared to in-service time, CDD takes into account both
temperature and time in characterizing the field aging of asphalt pavements.

79
−=
32 T if,0
32 T if,)32(
dmax
dmaxmaxdTCDD
(4.1)
Where:
Tdmax = daily max temperature, oF.
In NCHRP project 09-49A, the long-term field performance of 53 warm mix asphalt
(WMA) and 30 HMA pavement sections were monitored (Shen et al., 2013). Two rounds of
pavement inspections were conducted in 2012/2013 and 2014/2015 to collect field distresses,
including rutting, transverse cracking, and wheel-path longitudinal cracking. Figure 4.1 presents
the wheel-path longitudinal crack length versus the corresponding pavement CDD at the time of
pavement inspections.
(a)

80
(b)
Figure 4. 1 Wheel-path Longitudinal Crack Survey Results;
(a) First Survey in 2012/2013, (b) Second Survey in 2014/2015 (Shen et al., 2017)
For the first survey results shown in Figure 4.1(a), pavements with less than 70,000 CDD
showed no cracking, while some with over 70,000 CDD had measurable cracking (crack length
over 20 feet). A similar trend was also observed for the second survey results, as shown in Figure
4.1(b). Examination of field cores sampled from pavements with wheel-path longitudinal cracks
showed that these cracks initiated from the pavement surface and stopped within the surface
layer, which was indicative of top-down fatigue cracking (Shen et al., 2013). Based on these
results in Figure 4.1, TDC seemed to develop in most of the asphalt pavements with
approximately 70,000 CDD or more of field aging. Thus, 70,000 CDD was proposed as a
preliminary critical field aging condition to evaluate TDC. Figure 4.2 presents a map showing
the number of years required by different states to reach this preliminary CDD value. Note that
the CDD values shown for each state are based on weather data for the state’s capital city. In
general, warm climate states (e.g., Alabama, Florida, Texas, etc.) need approximately 4 years to

81
achieve 70,000 CDD while a significantly longer time of up to 8 years is required for states in
cold climates (e.g., Michigan, Minnesota, Wisconsin, etc.).
Figure 4. 2 A Map showing the Number of Years to Reach 70,000 CDD
4.2 Experimental Design
Figure 4.3 presents the research methodology used to select a laboratory aging protocol to
simulate 70,000 CDD of field aging. Materials used in the experiment were from five field
projects in Washington, Michigan, and Alabama. Specific details about the mixture components
were presented in Table 3.1. For each field project, plant produced mixtures and post-
construction field cores were sampled and tested to characterize field aging, and the dates of
construction and coring were presented in Table 4.1. Based on the construction and coring dates,
the CDD number of each project was calculated using Equation (4.1), which was also
summarized in Table 4.1.

82
Figure 4. 3 Research Methodology for Laboratory Aging
Table 4. 1 Summary of Construction and Coring Dates
Mix ID Mix 1 Mix 2 Mix 3 Mix 4 Mix 5
Location Rapid River,
Michigan
Walla Walla,
Washington
Auburn,
Alabama
Auburn,
Alabama
Auburn,
Alabama
Construction
Date 07/2010 04/2010 07/2009 09/2006 07/2000
Post-
Construction Coring Date
09/2016 10/2016 10/2016 10/2016 01/2015
In-Service
Time
6 years,
2 months
6 years,
6 months
7 years,
3 months
10 years,
1 month
14 years,
6 months
CDD 48,000 80,000 114,000 157,000 235,000
It should be noted that the storage of plant mixtures was not climate-controlled, thus, the
plant mixtures aged during the storage. Figure 4.4 (a) presents the HPG results of the binders
extracted from the plant mixtures before and after storage. It could be seen that, for all five
mixtures, the HPG results increased dramatically after storage. Furthermore, the change in HPG
for five mixtures was plotted against the corresponding storage time, and a linear equation was
used to fit the results, as shown in Figure 4.4 (b). In general, the change in HPG ranged between

83
7.9 to 31.2°C, and it increased with the storage time. Note that the linear relationship between
storage time and the change in HPG is limited for these five mixtures, which might not be
appropriate for other mixtures.
(a)
(b)
Figure 4. 4 HPG Results of Plant Production Mixtures; (a) HPG Results before and after
Storage, (b) Correlation between Change in HPG with the Storage Time
The plant mixtures from each project were conditioned with four loose mixture aging
protocols of 5 days at 95°C, 6 hours at 135°C, 12 hours at 135°C, and 24 hours at 135°C. To

84
prepare loose mixture samples, buckets of each plant mixture were first placed in an oven at
150°C for approximately three hours. Afterwards, the reheated mixture was batched into
individual samples of approximately 2,500 grams, which were then spread out in shallow pans
and placed back in the oven for further aging at the four conditions noted above. Mixture
samples aged for 5 days at 95°C were stirred once every 24 hours to ensure aging uniformity. As
mentioned previously, post-construction field cores were included in the experiment to represent
field aging. Considering the non-uniform aging of asphalt pavements with depth (Elwardany et
al., 2017; Turner, 2008; Yin et al., 2017a), only the top one inch of the field cores was tested.
Asphalt binders were extracted and recovered from reheated plant mixtures, laboratory aged
mixtures, and post-construction field cores in accordance with AASTHO T164 and ASTM D
5404, respectively. The extracted and recovered binders were then subjected to DSR, BBR, and
FT-IR testing without additional aging using the rolling thin-film oven (RTFO) or pressure aging
vessel (PAV).
4.3 Tests Results and Data analysis
This section presents the DSR, BBR, and FT-IR results of asphalt binders extracted from
laboratory aged mixtures and pavement cores. Test results were analyzed to evaluate the effects
of laboratory loose mixture aging on binder rheological and oxidation properties. Additionally,
the correlation of field aging with these aging protocols was explored. Finally, protocols that
were representative of 70,000 CDD of field aging were preliminarily selected for the NCAT TDC
experiment.
4.3.1 Comparisons of Laboratory Aging Protocols
(1) Continuous PG Results
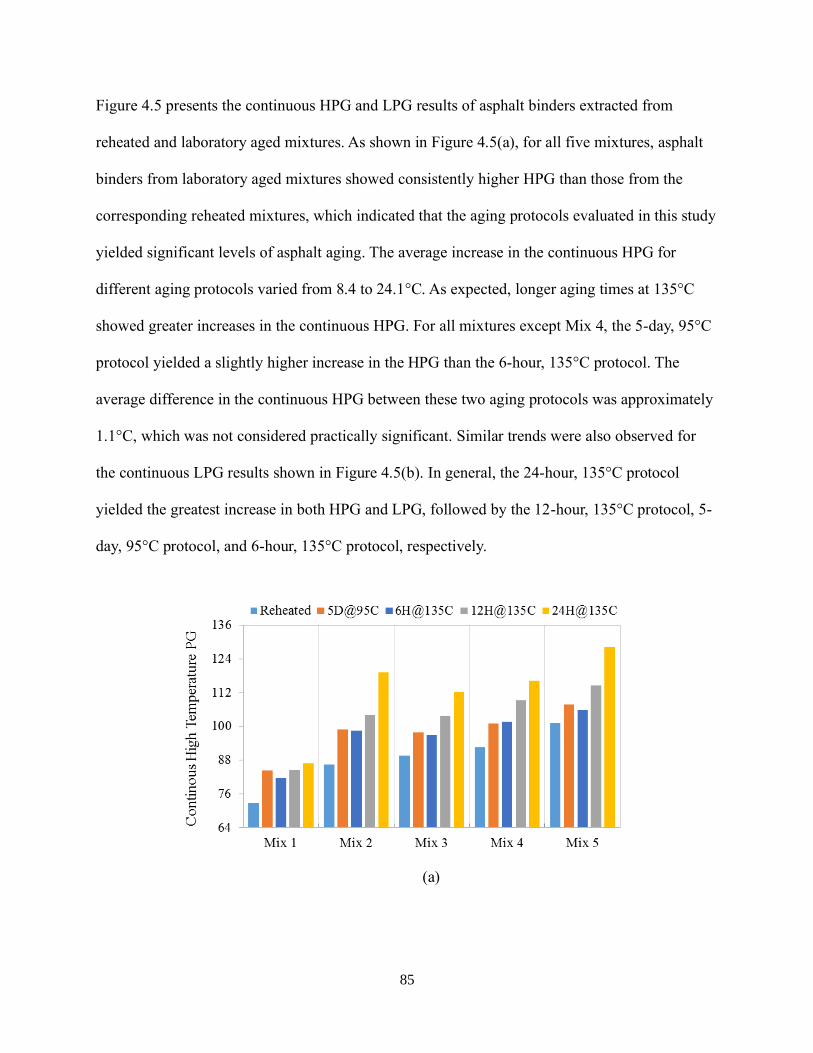
85
Figure 4.5 presents the continuous HPG and LPG results of asphalt binders extracted from
reheated and laboratory aged mixtures. As shown in Figure 4.5(a), for all five mixtures, asphalt
binders from laboratory aged mixtures showed consistently higher HPG than those from the
corresponding reheated mixtures, which indicated that the aging protocols evaluated in this study
yielded significant levels of asphalt aging. The average increase in the continuous HPG for
different aging protocols varied from 8.4 to 24.1°C. As expected, longer aging times at 135°C
showed greater increases in the continuous HPG. For all mixtures except Mix 4, the 5-day, 95°C
protocol yielded a slightly higher increase in the HPG than the 6-hour, 135°C protocol. The
average difference in the continuous HPG between these two aging protocols was approximately
1.1°C, which was not considered practically significant. Similar trends were also observed for
the continuous LPG results shown in Figure 4.5(b). In general, the 24-hour, 135°C protocol
yielded the greatest increase in both HPG and LPG, followed by the 12-hour, 135°C protocol, 5-
day, 95°C protocol, and 6-hour, 135°C protocol, respectively.
(a)
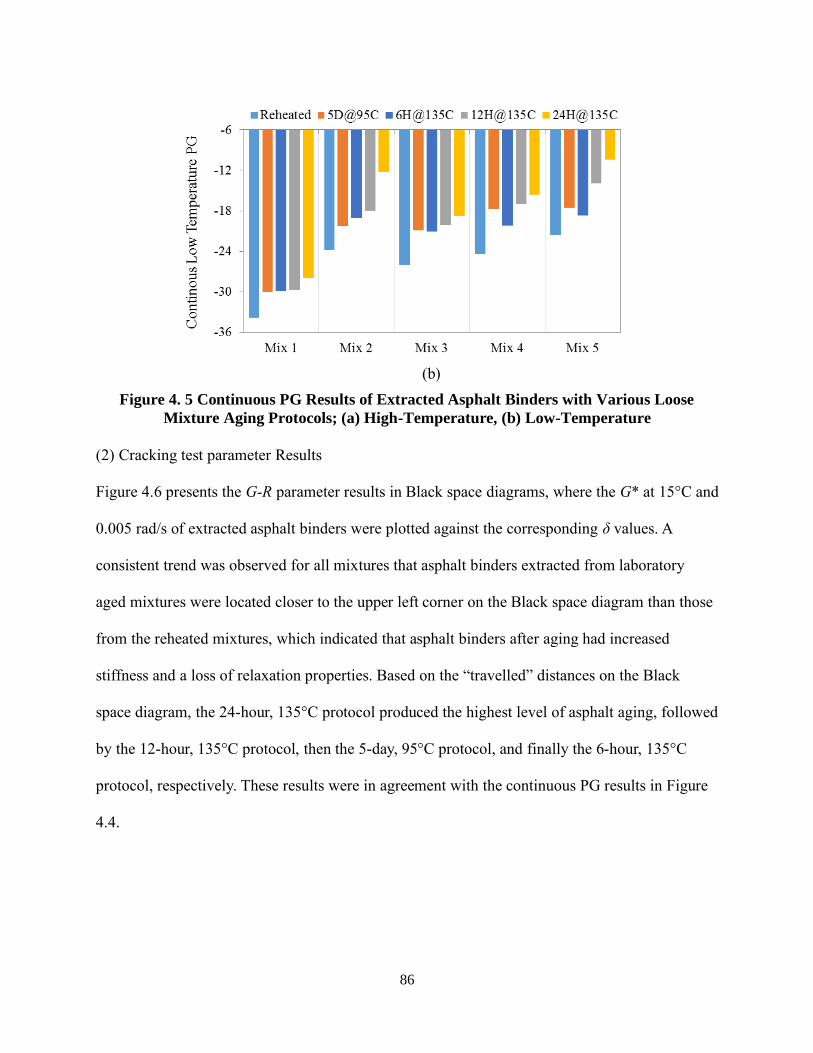
86
(b)
Figure 4. 5 Continuous PG Results of Extracted Asphalt Binders with Various Loose
Mixture Aging Protocols; (a) High-Temperature, (b) Low-Temperature
(2) Cracking test parameter Results
Figure 4.6 presents the G-R parameter results in Black space diagrams, where the G* at 15°C and
0.005 rad/s of extracted asphalt binders were plotted against the corresponding δ values. A
consistent trend was observed for all mixtures that asphalt binders extracted from laboratory
aged mixtures were located closer to the upper left corner on the Black space diagram than those
from the reheated mixtures, which indicated that asphalt binders after aging had increased
stiffness and a loss of relaxation properties. Based on the “travelled” distances on the Black
space diagram, the 24-hour, 135°C protocol produced the highest level of asphalt aging, followed
by the 12-hour, 135°C protocol, then the 5-day, 95°C protocol, and finally the 6-hour, 135°C
protocol, respectively. These results were in agreement with the continuous PG results in Figure
4.4.

87
(a)
(b)

88
(c)
(d)
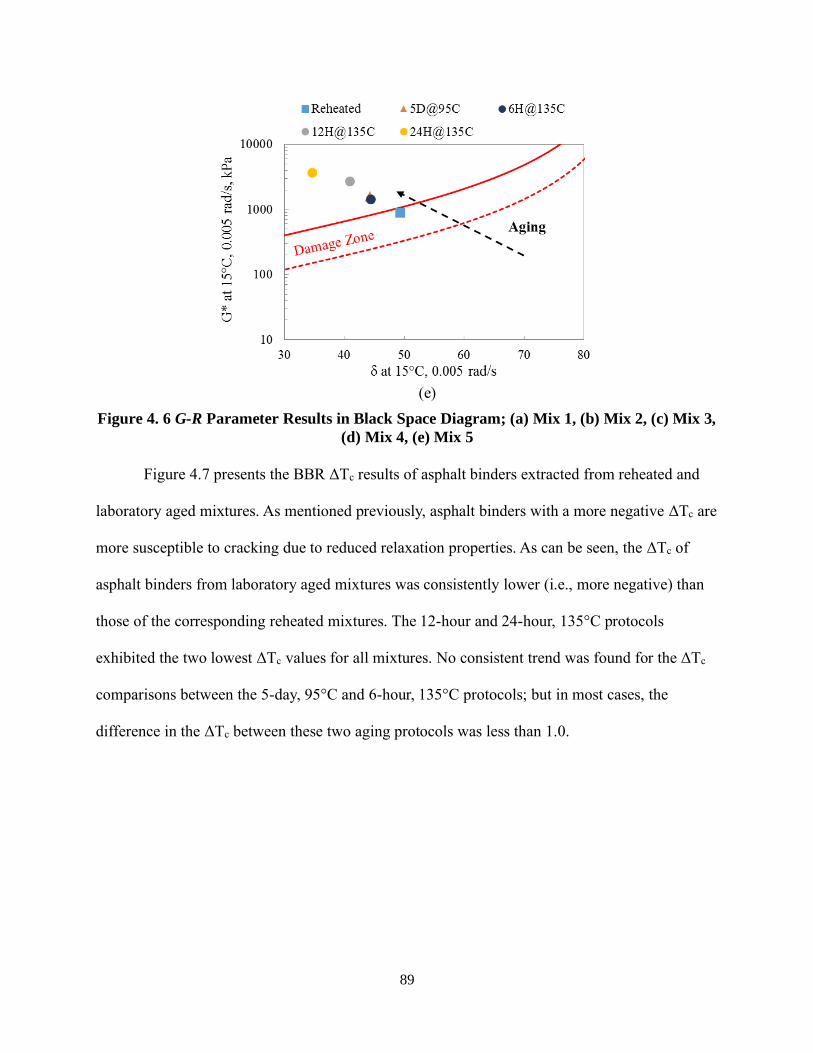
89
(e)
Figure 4. 6 G-R Parameter Results in Black Space Diagram; (a) Mix 1, (b) Mix 2, (c) Mix 3,
(d) Mix 4, (e) Mix 5
Figure 4.7 presents the BBR ΔTc results of asphalt binders extracted from reheated and
laboratory aged mixtures. As mentioned previously, asphalt binders with a more negative ΔTc are
more susceptible to cracking due to reduced relaxation properties. As can be seen, the ΔTc of
asphalt binders from laboratory aged mixtures was consistently lower (i.e., more negative) than
those of the corresponding reheated mixtures. The 12-hour and 24-hour, 135°C protocols
exhibited the two lowest ΔTc values for all mixtures. No consistent trend was found for the ΔTc
comparisons between the 5-day, 95°C and 6-hour, 135°C protocols; but in most cases, the
difference in the ΔTc between these two aging protocols was less than 1.0.

90
Figure 4. 7 BBR ΔTc Results of Extracted Asphalt Binders with Various Loose Mixture
Aging Protocols
(3) FT-IR CA Results
Figure 4.8 presents the FT-IR CA results of asphalt binders extracted from reheated and
laboratory aged mixes. In general, the results were consistent with the continuous PG and G-R
parameter results shown in Figure 4.5 and Figure 4.6, respectively. Asphalt binders extracted
from 135°C mixtures showed a consistent increase in FT-IR CA with longer aging times, which
indicated that more polar oxygen-containing functional groups were formed during the
laboratory aging processes. For all mixtures except Mix 4, extracted binders from the 5-day,
95°C mix had a FT-IR CA that was between those of binders from the 6-hour and 12-hour, 135°C
mixtures. Based on the FT-IR CA results, the four loose mixture aging protocols were ranked in
the following order in terms of the resultant aging level: 6-hour, 135°C < 5-day, 95°C < 12-hour,
135°C < 24-hour, 135°C.
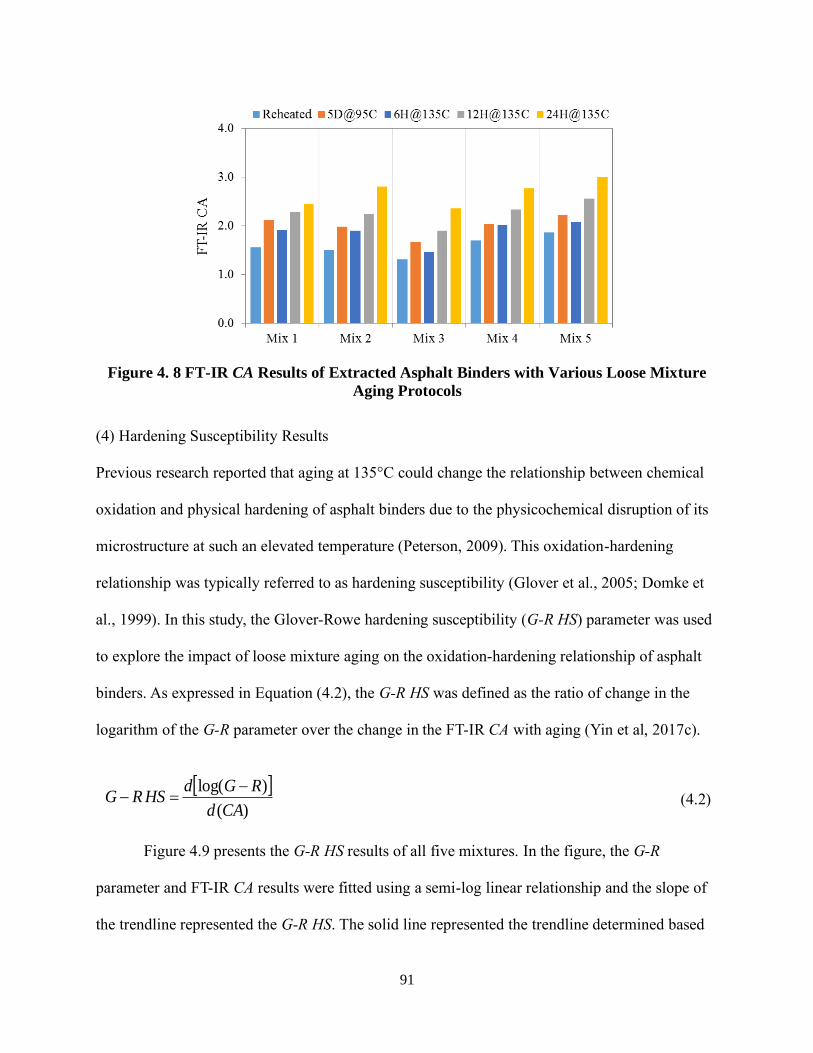
91
Figure 4. 8 FT-IR CA Results of Extracted Asphalt Binders with Various Loose Mixture
Aging Protocols
(4) Hardening Susceptibility Results
Previous research reported that aging at 135°C could change the relationship between chemical
oxidation and physical hardening of asphalt binders due to the physicochemical disruption of its
microstructure at such an elevated temperature (Peterson, 2009). This oxidation-hardening
relationship was typically referred to as hardening susceptibility (Glover et al., 2005; Domke et
al., 1999). In this study, the Glover-Rowe hardening susceptibility (G-R HS) parameter was used
to explore the impact of loose mixture aging on the oxidation-hardening relationship of asphalt
binders. As expressed in Equation (4.2), the G-R HS was defined as the ratio of change in the
logarithm of the G-R parameter over the change in the FT-IR CA with aging (Yin et al, 2017c).
)(
)log(
CAd
RGdHSRG
−=−
(4.2)
Figure 4.9 presents the G-R HS results of all five mixtures. In the figure, the G-R
parameter and FT-IR CA results were fitted using a semi-log linear relationship and the slope of
the trendline represented the G-R HS. The solid line represented the trendline determined based

92
on the aging protocols at 135°C, and the dashed lines represented the 95% confidence interval
for the trendline. For all five mixtures, the coefficient of determination (i.e., R2) of the trendline
was very close to or greater than 0.9, indicating a high goodness of the fit for the relationship. As
shown in the Figure 4.9, for all five mixtures, the results of 95°C aging protocol was always
located within the 95% confidence interval of the trendline determined based on aging protocols
at 135°C, indicating no significant difference in the oxidation-hardening relationship of asphalt
binders aged at 95°C versus 135°C.
(a)
(b)

93
(c)
(d)
(e)
Figure 4. 9 G-R HS Results; (a) Mix 1, (b) Mix 2, (c) Mix 3, (d) Mix 4, (e) Mix 5

94
4.3.2 Correlation of Field Aging with Laboratory Aging Protocols
Figure 4.10 presents the continuous HPG results to determine the correlation of field aging with
laboratory loose mixture aging protocols. The pattern-filled bars represent the difference in the
continuous HPG of asphalt binders extracted from post-construction field cores versus the
corresponding plant mixtures that were tested immediately after sampling. The solid-filled bars
represent the difference between the laboratory aged mixtures and reheated mixtures after
storage.
(a)
(b)

95
(c)
(d)
Figure 4. 10 Comparison of Field Aging and Laboratory Loose Mixture Aging Protocols;
(a) 5-day, 95°C, (b) 6-hour, 135°C, (c) 12-hour, 135°C, (d) 24-hour, 135°C
As shown in Figure 4.10(a), the 5-day, 95°C protocol was more severe than field aging of
approximately 48,000 CDD (Mix 1), as indicated by a greater increase in the continuous HPG.
The opposite trend, however, was shown for the other mixtures with field aging of approximately
80,000, 157,000, and 235,000 CDD, respectively. These results indicated that the 5-day, 95°C
protocol yielded asphalt aging that was representative of field aging between 48,000 and 80,000
CDD. The same approach was applied for the other three loose mixture aging protocols [Figure

96
4.10(b) to Figure 4.10(d)], and their representative CDD ranges are summarized as follows. For
12-hour, 135°C protocol, an expected trend existed where this protocol showed higher aging
level than 157,000 CDD, but lower aging level than 114,000 CDD. This unexpected situation
might be caused by the testing errors or the different aging characteristics of SBS modified
binder used in Mix 3 (Sun et al., 2014; Ruan et al., 2003; Ouyang et al., 2006). Thus, the
representative CDD range of 12-hour, 135°C protocol was identified as 80,000 – 235,000.
• 5-day, 95°C protocol: 48,000 to 80,000 CDD
• 6-hour, 135°C protocol: approximately 48,000 CDD
• 12-hour, 135°C protocol: 80,000 to 235,000 CDD
• 24-hour, 135°C protocol: greater than 235,000 CDD
As discussed previously, 70,000 CDD was identified as a preliminary critical field aging
condition for evaluating TDC. Therefore, based on the data shown in Figure 4.10, loose mixture
aging of 5 days at 95°C was the most representative aging protocol.
4.3.3 Selection of Alternative Aging Protocol at 135°C
Although loose mixture aging of 5 days at 95°C was identified as the most appropriate protocol
to simulate 70,000 CDD of field aging, this protocol is not practical for implementation.
Therefore, test results were further analyzed to determine an alternative aging protocol at 135°C
that yielded an equivalent level of aging as the 5-day, 95°C protocol. Figure 4.11(a) presents an
example of the FT-IR CA results of Mix 2. To determine the alternative aging protocol, the fast-
rate-constant-rate oxidation kinetic model (Jin et al., 2011), described in Equation (4.3), was first
used to fit the FT-IR CA results of laboratory aged mixtures at 135°C. Once the model
coefficients were determined, the equivalent aging time at 135°C was then calculated based on

97
the measured FT-IR CA of the 5-day, 95°C protocol [Figure 4.11(a)]. For the continuous HPG
and G-R results, linear and semi-log linear models were used to determine the equivalent aging
times, respectively. As shown in Figure 4.11(b), for both oxidation and rheological parameters,
similar level of asphalt aging was achieved by loose mixture aging protocols of 5 days at 95°C
and approximately 8 hours at 135°C. Thus, the 8-hour, 135°C protocol was recommended as an
alternative loose mixture aging protocol to simulate 70,000 CDD of field aging. In order to
differentiate this aging protocol from short-term and other long-term aging protocols, NCAT
researchers termed it the “critical aging” protocol to specifically associate it with the point at
which surface cracking typically occurs.
)1(0tfk
c eMtkCACA−
−++= (4.3)
Where:
CA0 = carbonyl area of asphalt binder extracted from the reheated mixture;
t = aging time at 135°C;
kc, kf, and M = model coefficients.
(a)

98
(b)
Figure 4. 11 Determination of Equivalent Aging Time at 135°C; (a) Example of Mix 2 FT-
IR CA Results, (b) Summary of All Results
4.4 Summary
The objective of this chapter was to select a preliminary mixture aging protocol for the NCAT
TDC experiment. Four different loose mix aging protocols were evaluated in terms of their
effects on rheological and oxidation properties of asphalt binders. In addition, their correlations
with field aging were investigated based on the concept of CDD. Based on the results of this
study, the following conclusions were obtained:
(1) TDC was found to develop in asphalt pavements with over approximately 70,000 CDD;
thus, this CDD value was identified as the critical field aging condition for evaluating TDC.
(2) Based on the rheological and oxidation results, the 24-hour, 135°C protocol yielded the
greatest amount of asphalt aging, followed by the 12-hour, 135°C protocol, 5-day, 95°C, protocol,
and 6-hour, 135°C protocol, respectively.
(3) The G-R HS parameter was used to explore the effect of loose mixture aging on the
oxidation-hardening relationship of asphalt binders. For the five mixtures evaluated in this study,

99
no significant difference in the G-R HS results was shown for mixtures aged at 95°C versus 135°C.
(4) Among the four loose mixture aging protocols evaluated in this study, the 5-day, 95°C
protocol was most representative of 70,000 CDD of field aging.
(5) Based on the HPG, G-R parameter, and FT-IR CA results, the loose mixture aging
protocol of 8 hours at 135°C was anticipated to yield an equivalent level of aging as that of 5 days
at 95°C. Therefore, the 8-hour, 135°C loose mix protocol has been termed the “critical aging
protocol” and recommended it as a practical method to simulate 70,000 CDD of field aging.

100
CHAPTER 5 PRELIMINARY VALIDATION OF THE CRITICAL AGING PROTOCOL
Since the preliminary critical aging protocol was based on a limited number of asphalt mixtures,
additional work was conducted to validate it with the NCAT TDC experimental mixtures prior to
conducting the laboratory cracking tests. The overall objective of this chapter was to validate the
two candidate critical aging (CA) protocols with up to 4 years of field aging data that has been
collected for the NCAT TDC experiment. Specifically, this chapter sought to (1) compare the
impacts of two candidate CA protocols on the fatigue and cracking resistance of asphalt binders
and mixtures, (2) characterize the evolution of asphalt binder and mixture properties with field
aging on the NCAT Test Track, and (3) evaluate the correlation between the two laboratory CA
protocols and field aging.
5.1 Experimental Design
Figure 5.1 presents the experimental approach used to validate if the preliminary critical aging
protocol is appropriate for the NCAT TDC experimental mixtures. Both plant mixtures and field
cores of all seven experimental sections were supposed to be included in the validation process.
However, section S13 was excluded because the asphalt-rubber binder of mixture S13 cannot be
extracted and recovered due to the existence of rubber particles. As mentioned previously, the
mixture components of sections N1, N2, and N5 were almost same except that section N5 had a
0.3% lower binder content, and the primary difference among these three sections was the
compacted density. In this study, the field cores of each section were collected from the
pavement shoulder, which were not compacted to a same density level with the testing lane area.
Meanwhile, the density of shoulders was similar among sections N1, N2, and N5, so only section

101
N1 was used from these three test sections. Consequently, sections N1, N8, S5, and S6 were
selected to validate the preliminary critical aging protocol.
For these four sections, plant mixture was sampled during construction of the test
sections on the NCAT Test Track. For each mix, three sets of PMLC specimens with different
aging protocols were prepared. The first set was compacted right after the mixture was reheated
to the field compaction temperature and is referred to RH-PMLC specimens. The other two sets
of specimens were prepared using the two candidate CA protocols of loose mixture aging for 5
days at 95°C and 8 hours at 135°C, which are referred to as CA1-PMLC and CA2-PMLC
specimens, respectively. All PMLC specimens were tested in the I-FIT, the IDEAL-CT test, and
the small-specimen AMPT cyclic fatigue test to determine the mixture cracking and fatigue
resistance. In addition, post-construction field cores after 2 to 4 years in-service were sampled
from the NCAT Test Track. The top 1.5-inch of the field cores was tested in the I-FIT. After the I-
FIT testing was completed, asphalt binders were extracted and recovered from each set of PMLC
specimens and post-construction field cores and tested to characterize their rheological
properties. The asphalt binder tests used include the Superpave performance grading, delta Tc,
DSR linear amplitude sweep (LAS), DSR frequency sweep, DENT, and FT-IR. Finally, data
analyses were conducted to (1) compare the two CA protocols in terms of their impacts on the
fatigue and cracking resistance of asphalt binders and mixtures, (2) characterize the evolution of
asphalt binder and mixture properties with field aging on the NCAT Test Track, and (3)
determine the correlation between the two CA protocols and field aging.
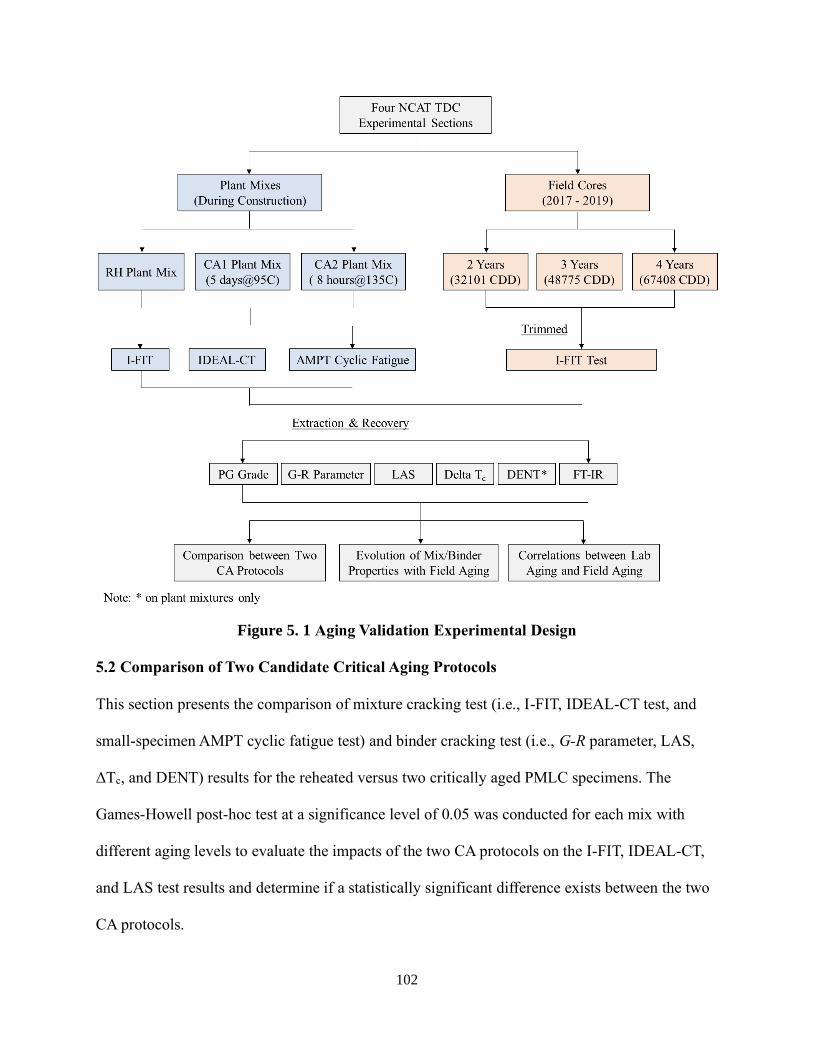
102
Figure 5. 1 Aging Validation Experimental Design
5.2 Comparison of Two Candidate Critical Aging Protocols
This section presents the comparison of mixture cracking test (i.e., I-FIT, IDEAL-CT test, and
small-specimen AMPT cyclic fatigue test) and binder cracking test (i.e., G-R parameter, LAS,
ΔTc, and DENT) results for the reheated versus two critically aged PMLC specimens. The
Games-Howell post-hoc test at a significance level of 0.05 was conducted for each mix with
different aging levels to evaluate the impacts of the two CA protocols on the I-FIT, IDEAL-CT,
and LAS test results and determine if a statistically significant difference exists between the two
CA protocols.
103
5.2.1 I-FIT Results
Figure 5.2 presents the I-FIT results of the four mixes included in the study, where the bars
denote the average FI values and the whiskers represent plus and minus one standard deviation.
The statistical analysis results are also included in the figure using the capital letters located
above the bars; for each mix, the FI results of PMLC specimens sharing a same letter are not
significantly different. As expected, for all four mixes, the two critically aged specimens had
significantly lower FI than the reheated specimens. These results indicate the effect of the two
CA protocols on reducing mixture cracking resistance. Based on the statistical analyses, for all
four mixes, the FI of the two critically aged specimens were categorized into the same group,
which indicates that the two candidate CA protocols have no significant difference in terms of
their impacts on the I-FIT results. In comparing the reheated specimens, mix S5 showed the
highest FI, and thus, had the best cracking resistance, followed by mixes S6, N1, and N8,
respectively. However, a different trend was observed for the results of the two critically aged
specimens, where mix S6 had higher FI than mix S5. For all three aging conditions, mix N8
consistently showed the lowest FI, which is likely due to use of high RAP and RAS contents.
Among the four mixes, S6 had the smallest relative change in FI after CA, which possibly
demonstrates better aging resistance of the HiMA binder relative to the PG 67-22 neat and PG
58-28 SBS binders used in the other three mixes.

104
Figure 5. 2 I-FIT Results of PMLC Specimens with Different Aging Conditions
5.2.2 IDEAL-CT Results
Figure 5.3 presents the IDEAL-CT results of the four mixes for both reheated and two critically
aged PMLC specimens. For all four mixes, the critically aged specimens had significantly lower
CTindex results, indicating reduced cracking resistance, which is consistent with the I-FIT results
in Figure 5. According to the Games-Howell post hoc test, the CTindex of CA1 specimens (aged
for 5 days at 95°C) were statistically higher than CA2 specimens (aged for 8 hours at 135°C) for
mixes N1, N8, and S5. Nevertheless, the difference in average CTindex between the two sets of
CA specimens varied only from 0.9 to 4.1, which may not be practically different. It should be
noted that the IDEAL-CT test is relatively new and its precision and bias statement has not yet
been established. The CA1 specimens of mix S6 had slightly higher CTindex than the
corresponding CA2 specimens, but the difference was not statistically significant considering the
variability of the test results. Among the four mixes, S5 and S6 had the highest CTindex for all
three aging conditions, followed by N1 and then N8. These results indicate the effect of polymer
modification on improving mixture cracking resistance.

105
Figure 5. 3 IDEAL-CT Test Results of PMLC Specimens with Different Aging Conditions
5.2.3 Small-Specimen AMPT Cyclic Fatigue Test Results
Figure 5.4 presents the damage capacity index, Sapp, results of the four mixes. Statistical analysis
was not conducted due to material quantity limitations; thus, the analysis of Sapp results was
based on the mean values. Among these four mixes, the trends are similar for both reheated and
critically aged PMLC specimens, where mix S6 showed the highest Sapp, indicating the best
fatigue resistance, followed by mixes S5, N1 and N8, respectively. This trend is expected and
reflects the impacts on mixture fatigue due to polymer modification and use of RAP and RAS
materials. For mixes N8, S5, and S6, the critically aged specimens had lower Sapp results than
reheated specimens, indicating reduced cracking resistance. However, for mix N1, the reheated
specimens yielded same Sapp results with CA2 specimens, which was unexpected. In comparing
the two aging protocols, the Sapp results showed a different trend from the I-FIT and IDEAL-CT
results. For mixes N1, N8 and S5, CA1 (aged for 5 days at 95°C) resulted in more damage
capacity loss than CA2 (aged for 8 hours at 135°C). However, the opposite trend was observed
for mix S6, where the CA1 specimens had a higher Sapp value, and thus, better fatigue resistance,

106
than the CA2 specimens. This trend was also found when the respective recovered binders were
tested for stain tolerance in the DENT test.
Figure 5. 4 AMPT Cyclic Fatigue Test Results of PMLC Specimens with Different Aging
Conditions
5.2.4 Glover-Rowe Parameter Results
Figure 5.5 presents the G-R parameter results of asphalt binders extracted from the reheated and
critically aged plant mixtures. For all four mixes, extracted binders from the two critically aged
mixtures had significantly higher G-R parameters than the reheated mixture, indicating the effect
of CA protocols on reducing the cracking resistance of asphalt binders. For mixes N1, N8, and
S6, the extracted binder from the CA2 mixture had a higher G-R parameter than the CA1
mixture. These results indicated that the 8-hour, 135°C aging protocol yielded a more severe
level of asphalt aging than the 5-day, 95°C protocol. When compared to the preliminary G-R
parameter threshold of 600 kPa for significant cracking, mix N8 reached the cracking “damage
zone” for all three aging conditions. Mix N1, with a PG 67-22 binder and 20% RAP, reached the
G-R parameter threshold after critical aging, while mixes S5 and S6 containing polymer-

107
modified binders did not reach the cracking “damage zone” for all aging conditions. It should be
noted that the preliminary G-R parameter threshold of 600 kPa was based on a limited number of
unmodified binders and a PG 58-28 climate in Pennsylvania, and thus, its applicability to
polymer-modified binders and other climates remains unknown and needs further investigation.
Figure 5. 5 G-R Parameter Results of Extracted Binders from PMLC Specimens with
Different Aging Conditions
5.2.5 LAS Test Results
Figure 5.6 presents the LAS-Nf (5.0%) results of the extracted binders from reheated and
critically aged specimens, where the bars denote the average LAS-Nf values and the error bars
represent plus and minus one estimated standard deviation. The Games-Howell post-hoc test
analysis results are also included in the figure using the capital letters located above the bars, and
labels A, B, and C represent groupings that have statistically different Nf-parameter values
resulting from the three aging protocols. Based on the statistical analysis, for mixes N1 and N8,
the reheated specimens yielded significantly greater results than two critically aged specimens,
indicating reduced fatigue resistance. However, no significant difference was observed between

108
reheated specimens and CA1 specimens for mixes S5 and S6. LAS-Nf results showed a different
trend from G-R parameter results when comparing two critically aged protocols. For mixes N1
and S6, the 8-hour, 135°C aging protocol yielded lower LAS-Nf values than the 5-day, 95°C
protocol, which indicated higher aging level. However, there was no significant difference
between two aging protocols for mixes N8 and S5.
Figure 5. 6 LAS-Nf (5.0%) Parameter Results of Extracted Binders from PMLC Specimens
with Different Aging Conditions
5.2.6 ΔTc Results
Figure 5.7 presents the ΔTc results of asphalt binders extracted from both reheated and two
critically aged plant mixtures. As mentioned previously, asphalt binders with lower (i.e., more
negative) ΔTc are more susceptible to cracking due to reduced relaxation properties. For all four
mixes, the extracted binders from the two critically aged mixtures had lower ΔTc than the
reheated mixture. Except for N1, the extracted binders from the CA2 had a lower ΔTc than
binders from CA1, which indicated that the 8-hour, 135°C protocol was more severe than the 5-

109
day, 95°C protocol. For mix N1, the extracted binders from the two CA protocols had a
difference in ΔTc of approximately 0.3°C, which was not considered practically different.
Figure 5. 7 ΔTc Results of Extracted Binders from PMLC Specimens with Different Aging
Conditions
5.2.7 DENT Test Results
Figure 5.8 presents the CTOD results (expressed in millimeters) of the recovered binders from
both reheated and critically aged mixtures. Note that statistical analysis using the Games-Howell
post-hoc test was not possible since CTOD is a computed parameter from all tested samples and
that limited quantities of material recovered did not allow repeating the testing multiple times.
The binder recovered from N8 after CA1 experienced brittle failure during the test, so the CTOD
value could not be calculated. Nevertheless, this indicates that this material had the worst
(smallest) CTOD among all the binders tested. For all four mixes, the trends were similar for the
reheated and the two critically aged samples, where mix S6 fared the best, followed by S5, N1
and N8, respectively. This trend is expected and reflects the effects of polymer or RAP and RAS.
In comparing the CA protocols, results for mixes N1 and N8 indicate that CA1 (aged for 5 days

110
at 95°C) was more severe than CA2 (aged for 8 hours at 135°C). Mix S6, however, showed the
opposite trend. The CTOD results of the two critically aged mixtures were almost identical for
mix S5. In general, the DENT test captures the changes in the binders with aging as the
magnitude of the CTOD drop after the CA procedures is higher than the one observed with Sapp
values from the AMPT cyclic fatigue test (Figure 5.4).
Figure 5. 8 DENT Test Results of Extracted Binders from PMLC Specimens with Different
Aging Conditions
5.3 Evolution of Asphalt Binder and Mixtures Properties with Field Aging
This section presents the I-FIT results of post-construction field cores collected from the NCAT
Test Track after 2 years in-service, as well as the DSR (including HPG, G-R parameter, and
LAS), BBR (including LPG and ΔTc), DENT, and FT-IR test results of the extracted binders.
Data analyses were conducted to determine the evolution of asphalt binder and mixture
properties with field aging. In this study, field aging was quantified using the CDD parameter,
which was calculated based on the construction date of the test section and coring date of the
field cores. It should be noted that because field cores at construction were not available, the

111
reheated PMLC specimens were used as the beginning of the field aging curve, which was
assigned with a CDD of zero.
5.3.1 I-FIT Results
Figure 5.9 presents the I-FIT results of the reheated PMLC specimens and post-construction field
cores, where the dots represent the average corrected FI values and the error bars represent plus
and minus one estimated standard deviation. For all mixes except N1, the field cores showed a
gradual decrease in the corrected FI with increasing CDD, which indicated that the cracking
resistance of the mixtures deteriorated with field aging. For mix N1, the 3-year cores had a
slightly higher FI than the 2-year cores, but the difference was not significant considering the
variability of the test results. For all field aging conditions, mix S5 consistently had the highest
FI and thus, the best cracking resistance, followed by mixes S6, N1, and N8, respectively.
Figure 5. 9 I-FIT Results of Reheated PMLC Specimen and Post-Construction Field Cores

112
5.3.2 Continuous PG Results
Figure 5.10 presents the continuous HPG and LPG results of extracted binders from the reheated
plant mixtures and post-construction field cores. As shown in Figure 5.10 (a), the HPG of
extracted binders for mixes N1, N8, and S5 increased with increasing CDD, indicating the binder
stiffening effect as a result of field aging. For mix S6, the extracted binders from all field cores
yielded lower HPG than the extracted binder from reheated plant mixture, which was not
expected and could be due to errors in recovering or testing the binder. In addition, the HPG of
extracted binders from field cores increased with increasing CDD, indicating the binder became
stiffer during field aging.
As presented in Figure 5.10 (b), the continuous LPG of extracted binders for mixes N1
and S5 increased (i.e., became less negative) with CDD, which indicate that the binders were
more susceptible to thermal cracking after field aging. For mix N8, the extracted binders from all
three sets of post-construction field cores had similar LPG (with a maximum difference of 0.8°C)
of around -12.5°C, which was considerably higher than that of the extracted binder from the
reheated plant mixture. For mix S6, the results of the 2.5-year and 4-year field cores showed an
expected trend where the LPG of the extracted binders gradually increased with field aging.
However, the extracted binder from the 3-year field core had a higher LPG than the 4-year field
core, which is possibly due to testing errors and thus, needs to be reverified.

113
(a)
(b)
Figure 5. 10 Continuous PG Results of Extracted Binders from Reheated Plant Mixture
and Post-Construction Field Cores; (a) High-Temperature, (b) Low-Temperature
5.3.3 Glover-Rowe Parameter Results
Figure 5.11 presents the G-R parameter results of extracted binders from the reheated plant
mixture and post-construction field cores. For all mixes except N8, the G-R parameter increased
with increasing CDD, indicating increased binder stiffness and reduced cracking resistance due
to field aging. For mix N8, the G-R parameter increased first and then decreased slightly with

114
field aging where the highest G-R parameter corresponded to the 3-year field core with
approximately 49,000 CDD. When comparing the results to the preliminary G-R parameter
threshold of 600 kPa for significant cracking, mix N8 reached the cracking “damage zone” right
after construction for the reheated plant mixture. The poor cracking resistance of this mix was
likely due to the inclusion of 20% RAP and 5% RAS. Mix N1 with a PG 67-22 binder and 20%
RAP reached the cracking “damage zone” after approximately 2 years of field aging with 32,000
CDD, while the two mixes with polymer-modified binders (i.e., S5 and S6) did not reach the
cracking “damage zone” after 4 years of field aging with 67,000 CDD. These results further
highlight the effect of polymer modification in improving the long-term cracking resistance of
asphalt binders.
Figure 5. 11 Glover-Rowe Parameter Results of Extracted Binders from Reheated Plant
Mixture and Post-Construction Field Cores
5.3.4 ΔTc Results
Figure 5.12 presents the ΔTc results of extracted binders from the reheated plant mixture and
post-construction field cores. The ΔTc results of all mixes showed a general decrease with

115
increasing CDD, which indicate that the binders became more susceptible to cracking with field
aging. However, an unexpected trend was observed for the 3-year field core of mix S6, where the
extracted binder had a more negative ΔTc than the 4-year field core. This abnormality, which is
also observed in the LPG results in Figure 5.10 (b), was possibly caused by the testing errors and
thus, needs to be reverified.
Figure 5. 12 ΔTc Results of Extracted Binders from Reheated Plant Mixture and Post-
Construction Field Cores
5.3.5 LAS Results
Figure 5.13 presents the LAS-Nf results of extracted binders from the reheated plant mixture and
post-construction field cores, and the error bars represent plus and minus one estimated standard
deviation. Note that the LAS-Nf results of 4-year field cores were not available currently. As
shown in Figure 5.13, the LAS-Nf results of all mixes showed a decreasing trend with increasing
CDD, which indicate that the binders became less resistant to fatigue with field aging.

116
Figure 5. 13 LAS-Nf Results of Extracted Binders from Reheated Plant Mixture and Post-
Construction Field Cores
5.3.6 FT-IR Results
Figure 5.14 presents the FT-IR carbonyl area results of extracted binders from the reheated plant
mixture and post-construction field cores, and the error bars represent plus and minus one
estimated standard deviation. Note that the FT-IR results of 4-year field cores were not available
currently. As shown in Figure 5.14, for mixes N8 and S6, the FT-IR carbonyl area results
increased with increasing CDD, which indicate that the binders experience more oxidation aging
with field aging. However, for mixes N1 and S5, the FT-IR carbonyl area results increased first
and then decreased slightly with field aging where the highest carbonyl area results corresponded
to the 2-year field core with approximately 32,000 CDD, which was unexpected and might be
caused by testing errors.

117
Figure 5. 14 FT-IR Carbonyl Area Results of Extracted Binders from Reheated Plant
Mixture and Post-Construction Field Cores
5.4 Correlation between Laboratory Critical Aging Protocols and Field Aging
This section presents the analysis results for evaluating the correlation between the two candidate
CA protocols and field aging on the NCAT Test Track. The representative CDD of the two CA
protocols of loose mixture aging for 5 days at 95°C and 8 hours at 135°C was determined by
comparing the test results of critically aged plant mixtures and the corresponding field cores.
Note that this comparison was conducted separately for all binder and mixture properties
discussed in Section 5.3. Figure 5.15 presents an example of the data analysis for the I-FIT
results of mix S6, where the solid line represents the corrected FI of post-construction field cores
at various field in-service times (expressed in CDD) and the two dashed lines represent the FI of
the two critically aged PMLC specimens. Based on linear interpolation of the FI results, the two
candidate CA protocols of loose mixture aging for 5 days at 95°C and 8 hours at 135°C were
estimated to simulate approximately 46,600 and 56,100 CDD of field aging, respectively.

118
Figure 5. 15 An Example to Illustrate the Determination of the Representative CDD for the
Two Candidate CA Protocols using the I-FIT Results of Mix S6
Table 5.1 and Table 5.2 summarize the representative CDD of the two candidate CA
protocols of loose mixture aging for 5 days at 95°C and 8 hours at 135°C, respectively. Because
of the unexpected trends of the continuous PG and ΔTc results for mix S6 (Figure 5.10 and
Figure 5.12), their representative CDD could not be determined, and thus, are shown as “not
available (N/A)”. It should also be noted that in cases where the CA protocol yielded more
severe asphalt aging than the corresponding 4-year field cores, additional field aging data is
needed to determine the representative CDD without data extrapolation. In such cases, the
projected representative CDD values are greater than 67,400, and thus, are shown as “> 67.4” in
Table 2 and Table 3.
As shown in Table 5.1, for mixes N1, N8, and S5, the representative CDD of the 5-day,
95°C aging protocol was consistently higher than 67,400 for the majority of the binder and
mixture properties evaluated. The binder LPG and G-R parameter of mix N1 and binder ΔTc of
mix S5 had a representative CDD of between 46,000 and 67,400. The LAS-Nf of mixes N1 and
S5 and carbonyl area of mix N8 had a representative CDD ranging between 23,500 to 47,700.
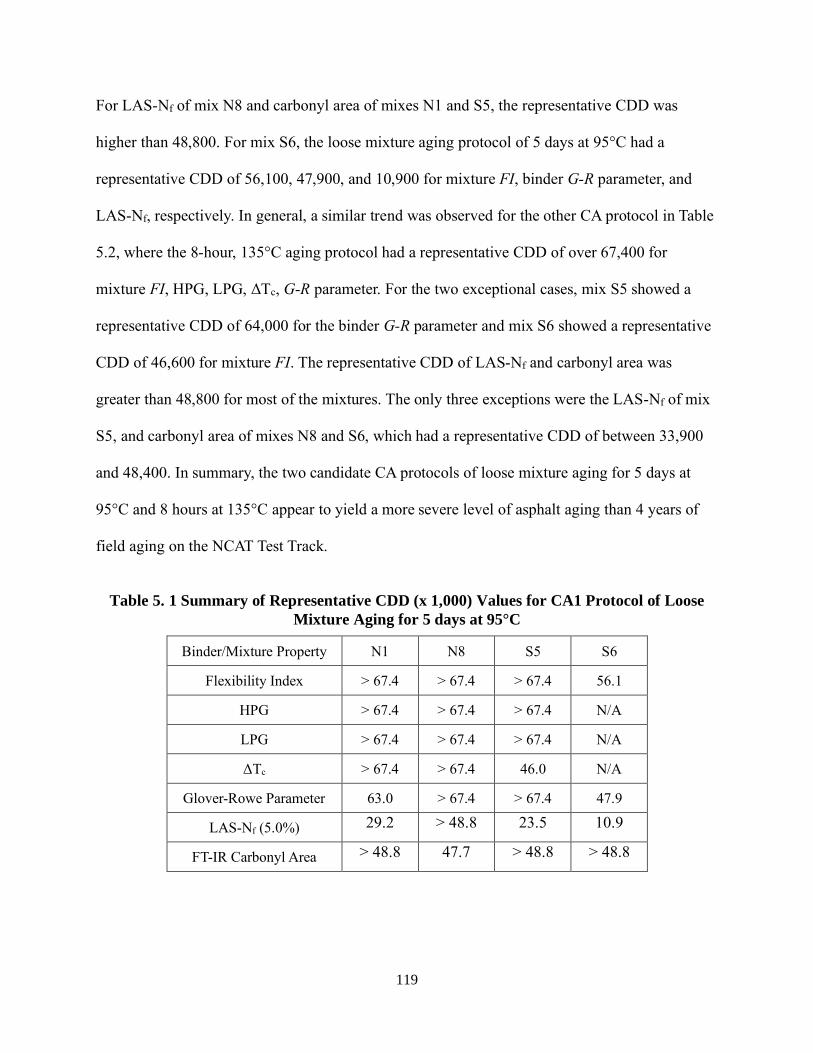
119
For LAS-Nf of mix N8 and carbonyl area of mixes N1 and S5, the representative CDD was
higher than 48,800. For mix S6, the loose mixture aging protocol of 5 days at 95°C had a
representative CDD of 56,100, 47,900, and 10,900 for mixture FI, binder G-R parameter, and
LAS-Nf, respectively. In general, a similar trend was observed for the other CA protocol in Table
5.2, where the 8-hour, 135°C aging protocol had a representative CDD of over 67,400 for
mixture FI, HPG, LPG, ΔTc, G-R parameter. For the two exceptional cases, mix S5 showed a
representative CDD of 64,000 for the binder G-R parameter and mix S6 showed a representative
CDD of 46,600 for mixture FI. The representative CDD of LAS-Nf and carbonyl area was
greater than 48,800 for most of the mixtures. The only three exceptions were the LAS-Nf of mix
S5, and carbonyl area of mixes N8 and S6, which had a representative CDD of between 33,900
and 48,400. In summary, the two candidate CA protocols of loose mixture aging for 5 days at
95°C and 8 hours at 135°C appear to yield a more severe level of asphalt aging than 4 years of
field aging on the NCAT Test Track.
Table 5. 1 Summary of Representative CDD (x 1,000) Values for CA1 Protocol of Loose
Mixture Aging for 5 days at 95°C
Binder/Mixture Property N1 N8 S5 S6
Flexibility Index > 67.4 > 67.4 > 67.4 56.1
HPG > 67.4 > 67.4 > 67.4 N/A
LPG > 67.4 > 67.4 > 67.4 N/A
ΔTc > 67.4 > 67.4 46.0 N/A
Glover-Rowe Parameter 63.0 > 67.4 > 67.4 47.9
LAS-Nf (5.0%) 29.2 > 48.8 23.5 10.9
FT-IR Carbonyl Area > 48.8 47.7 > 48.8 > 48.8

120
Table 5. 2 Summary of Representative CDD (x 1,000) Values for CA2 Protocol of Loose
Mixture Aging for 8 hours at 135°C
Binder/Mixture Property N1 N8 S5 S6
Flexibility Index > 67.4 > 67.4 > 67.4 46.6
HPG > 67.4 > 67.4 > 67.4 N/A
LPG > 67.4 > 67.4 > 67.4 N/A
ΔTc > 67.4 > 67.4 > 67.4 N/A
Glover-Rowe Parameter > 67.4 > 67.4 64.0 > 67.4
LAS-Nf (5.0%) > 48.8 > 48.8 33.9 > 48.8
FT-IR Carbonyl Area > 48.8 48.4 > 48.8 44.5
5.5. Summary
The objective of this chapter was to validate the two candidate CA protocols of loose mixture
aging for 5 days at 95°C and 8 hours at 135°C for the NCAT TDC experiment. Four surface
mixes placed on the NCAT Test Track were evaluated, which were representative of several
levels of binder modification, performance grades, recycled material contents, and field cracking
performance. For each mix, three laboratory aging protocols (i.e., reheating and with the two
proposed CA protocols) were used to prepare specimens for the I-FIT, the IDEAL-CT test, and
the small-specimen AMPT cyclic fatigue test. Cores from the test sections were also obtained at
various points in time through four years of service and tested in following the I-FIT test. In
addition, asphalt binders extracted from each set of the PMLC specimens and field cores were
tested in DSR, BBR, and DENT, and the FT-IR tests to determine their PG, G-R parameter, ΔTc,
LAS-Nf (5.0%) parameter, CTOD strain tolerance, and carbonyl area. Finally, data analyses were
conducted to (1) compare the two candidate CA protocols in terms of their impacts on the fatigue
and cracking resistance of asphalt binders and mixtures, (2) characterize the evolution of asphalt
binder and mixture properties with field aging on the NCAT Test Track, and (3) evaluate the

121
correlation between the two CA protocols and field aging. Based on the analysis results, the
following conclusions are made:
(1) The two candidate CA protocols of loose mixture aging for 5 days at 95°C and 8
hours at 135°C showed a significant impact on reducing the fatigue and cracking resistance of
asphalt binders and mixtures.
(2) Comparisons of the two candidate CA protocols yielded different results depending
on the binder and mixture properties evaluated. The I-FIT results showed no significant
difference between the two CA protocols. The IDEAL-CT test, G-R parameter, LAS test, and
ΔTc results all indicated that the 8-hour, 135°C protocol was more severe than the 5-day, 95°C
protocol. However, the opposite trend was generally observed for small-specimen AMPT cyclic
fatigue test results.
(3) The AMPT cyclic fatigue and DENT test results showed greater deterioration in the
fatigue and cracking resistance of mix S6 (containing the HiMA binder) due to the 8-hour, 135°C
protocol than the 5-day, 95°C protocol. These results support the hypothesis in literature that
SBS polymers are more susceptible to thermal degradation when exposed to higher conditioning
temperatures.
(4) In general, the I-FIT, PG, G-R parameter, ΔTc, LAS-Nf (5.0%), and carbonyl area
results of post-construction field cores showed an expected trend of increased stiffness and
reduced cracking resistance with field aging. Although the LPG and ΔTc results for mix S6
extracted binders indicate that 3-year field cores were aged more than that from the 4-year field
cores, those results are spurious. In addition, the HPG results of extracted binder from mix S6
indicate that reheated specimens yielded higher aging level than all the field cores, which could
be caused by the errors in recovering or testing the binder.
122
(5) The majority of the asphalt binder and mixture properties indicate that the two
candidate CA protocols of loose mixture aging for 5 days at 95°C and 8 hours at 135°C yield a
more severe level of asphalt aging than 4 years of field aging on the NCAT Test Track.
Therefore, additional field aging data is needed to help determine the representative CDD of
these two CA protocols.
(6) Virtually all the binder and mixture results identified mixes S5 and S6 as having the
best fatigue and cracking resistance, followed by N1, and N8, respectively, which agrees with
their field performance on the NCAT Test Track through more than four years of heavy traffic.
These results highlight the effects of polymer modification and recycled materials on the
cracking resistance of asphalt binders and mixtures.

123
CHAPTER 6 LABORATORY MIXTURE CRACKING TEST RESULTS
To evaluate laboratory cracking tests for their suitability in identifying mixtures susceptible to
TDC, seven mixtures were designed and constructed on the NCAT Test Track with a range of
characteristics including air voids, binder type, and recycled materials. For each mixture, both
plant-produced and laboratory-mixed mixtures were tested with six sponsor-selected laboratory
cracking tests, including ER, TX-OT, NCAT-OT, SCB, I-FIT, and IDEAL-CT.
6.1 Experimental Design
The approach of the laboratory mixture cracking tests is illustrated in Figure 6.1. For each
mixture, both plant-produced mixtures and laboratory-mixed mixtures were prepared and
critically aged at 135 °C for 8 hours prior to compaction. The laboratory cracking tests results
were utilized to conduct: (1) comparison analysis between plant and laboratory mixtures; (2)
sensitivity analyses of the test results to aging, air voids, recycled asphalt materials, and modified
binder; (3) correlation analyses among the six laboratory cracking tests.

124
Figure 6. 1 Research Methodology for Laboratory Cracking Tests
6.1.1 Sensitivity Groups
Table 3.2 summarizes the key distinguishing properties of the seven experimental mixtures. N1
mixture was identified as the “control mixture” with 20% RAP and a PG 67-22 binder. N2 was
identical to the control mixture but was compacted in the field to a higher density. Therefore,
mixtures N1 and N2, with lab air void samples of 7.0 and 4.0%, respectively, were grouped to
analyze the sensitivity of air voids on TDC resistance. Similarly, another group of mixtures were
analyzed to determine the sensitivity of recycled asphalt materials, and a third group was
analyzed to evaluate the sensitivity to modified binders on TDC resistance. The three sensitivity
groups are summarized as follows:
• Air Voids Group: N1 (7.0% air voids), N2 (4.0% air voids).
• Recycled Asphalt Materials Group: N1 (20% RAP), N8 (20% RAP + 5% RAS), and S5
(35% RAP + Softer Binder).

125
• Modified Binder Group: N1 (PG 67-22), S6 (highly polymer-modified binder (HiMA)).
Mixture N5 was not categorized in the air voids group due to its lower asphalt content.
Mixture S13 was not grouped with any other mixtures due to its unique properties: it had a lower
RAP content (15%), a larger NMAS, and coarser gradation, and used an asphalt-rubber binder.
Additionally, the total binder content was more than 1.5% higher than any other mixtures in the
experiment.
6.1.2 Sample Preparation
In this study, both plant-produced and laboratory-mixed mixtures were utilized to evaluate six
laboratory cracking tests. During the construction of 2015 NCAT Test Track, the seven plant-
produced mixtures were sampled and placed in five-gallon buckets. The mixtures were later
reheated at 150 °C for two hours to prepare loose mixtures for additional critical aging of 8 hours
at 135 °C. For laboratory mixtures, the seven mixtures were mixed in accordance with the
corresponding mixture designs and then STOA per AASHTO R 30 for 4 hours at 135 ± 3 °C
prior to the following critical aging. For the STOA process, the loose mixtures were stirred every
hour to ensure the uniform conditioning. After critical aging, the loose mixtures were compacted
with a Superpave Gyratory Compactor (SGC); the specifics of this process are summarized as
follows:
• Separate reheated plant mixtures and STOA laboratory mixtures into a loose state as for
Rice specific gravity samples.
• Weight 2500-2700g loose mixtures onto a Rice pan and spread them to an even thickness.
• Critically age the loose mixtures for 8 hours at 135 °C.
126
• After 8 hours, transfer the loose mixtures to small pans and heat them to the
corresponding compaction temperature.
• Compact specimens after the mixture reached the compaction temperature.
The reheated plant-mixed, lab-compacted test specimens are abbreviated as PMLC-RH;
the short-term oven aged laboratory-mixed, lab-compacted test specimens are abbreviated as
LMLC-STOA; the critically-aged plant-mixed lab-compacted test specimens are abbreviated as
PMLC-CA, and the critically-aged lab-mixed, lab-compacted test specimens are abbreviated as
LMLC-CA. Each of the seven mixtures were tested using the six asphalt mixture cracking tests
previously described. The lab compacted specimens were compacted to the target in-place air
void contents of the respective test sections. Thus, all PMLC-CA and LMLC-CA specimens were
compacted to a target of 7.0% air voids, except for mixtures N2 and N5 which had target air
voids of 4.0% and 10.0%, respectively.
6.1.3 Statistical Analysis
All test results except the Energy Ratio were checked for outliers in accordance with ASTM
E178-08. All results that failed ASTM E178-08 at a significance level of 0.10 were eliminated
from further analysis. TX-OT, NCAT-OT, I-FIT, and IDEAL-CT results were analyzed to obtain
the mean value and standard deviation.
Energy Ratio results are a product of a pooled analysis of three tests that have trimmed
means applied to the results of the tests and the average is used to calculate the ER. For each
specimen, the results are calculated for each instrumented specimen face (left and right), giving
two results per specimen. For a set of three specimens, this gives six specimen faces from which
the high and low value are removed to determine the trimmed mean for the individual properties.
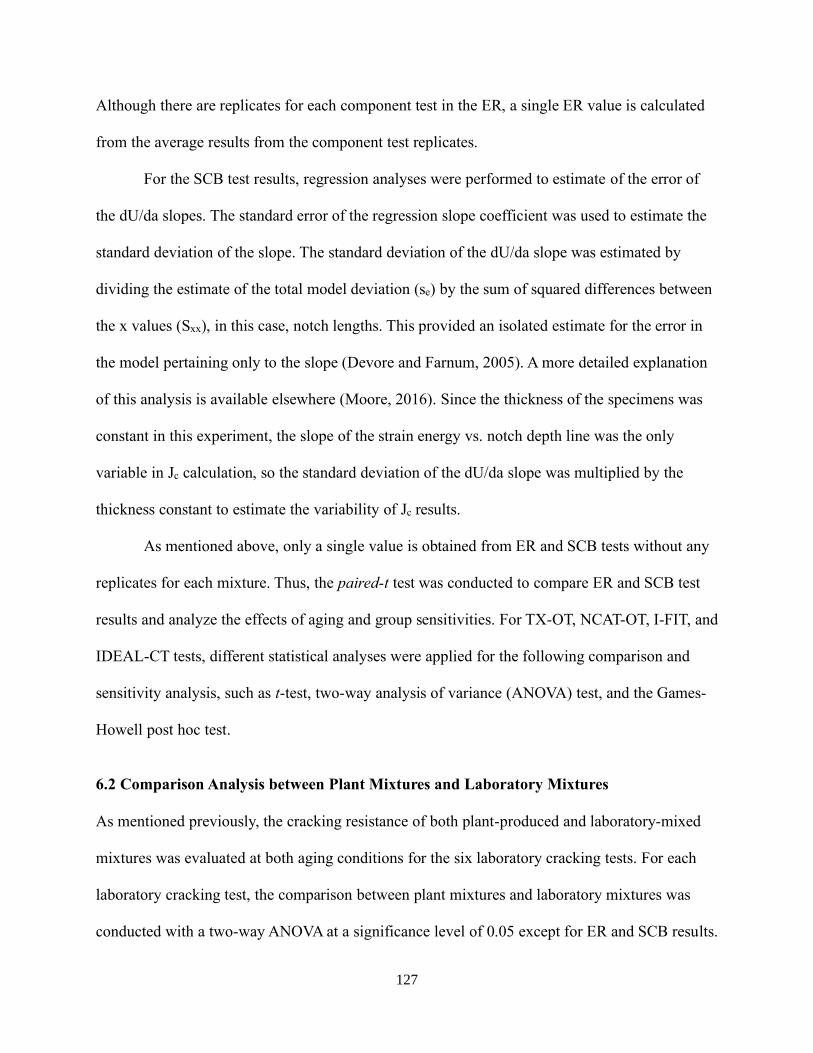
127
Although there are replicates for each component test in the ER, a single ER value is calculated
from the average results from the component test replicates.
For the SCB test results, regression analyses were performed to estimate of the error of
the dU/da slopes. The standard error of the regression slope coefficient was used to estimate the
standard deviation of the slope. The standard deviation of the dU/da slope was estimated by
dividing the estimate of the total model deviation (se) by the sum of squared differences between
the x values (Sxx), in this case, notch lengths. This provided an isolated estimate for the error in
the model pertaining only to the slope (Devore and Farnum, 2005). A more detailed explanation
of this analysis is available elsewhere (Moore, 2016). Since the thickness of the specimens was
constant in this experiment, the slope of the strain energy vs. notch depth line was the only
variable in Jc calculation, so the standard deviation of the dU/da slope was multiplied by the
thickness constant to estimate the variability of Jc results.
As mentioned above, only a single value is obtained from ER and SCB tests without any
replicates for each mixture. Thus, the paired-t test was conducted to compare ER and SCB test
results and analyze the effects of aging and group sensitivities. For TX-OT, NCAT-OT, I-FIT, and
IDEAL-CT tests, different statistical analyses were applied for the following comparison and
sensitivity analysis, such as t-test, two-way analysis of variance (ANOVA) test, and the Games-
Howell post hoc test.
6.2 Comparison Analysis between Plant Mixtures and Laboratory Mixtures
As mentioned previously, the cracking resistance of both plant-produced and laboratory-mixed
mixtures was evaluated at both aging conditions for the six laboratory cracking tests. For each
laboratory cracking test, the comparison between plant mixtures and laboratory mixtures was
conducted with a two-way ANOVA at a significance level of 0.05 except for ER and SCB results.

128
Additionally, for each mixture, t-test was also executed at a significance level of 0.05 to compare
plant mixtures results with the corresponding laboratory mixtures results of each cracking test.
For ER and SCB results, the paired-t test was conducted at a significant level of 0.05 to examine
the difference between plant mixtures and laboratory mixtures at both aging conditions.
6.2.1 Energy Ratio
Figure 6.2 and Figure 6.3 present the comparison results of DCSEHMA, DCSEMin and ER before
and after critical aging, respectively. DCSEHMA is the amount of energy required to initiate
cracking, and a minimum DCSEHMA criteria of 0.75 kJ/m3 was proposed to screen out extremely
stiff mixtures (Roque et al., 2004). In addition, minimum ER criteria were also proposed for
different traffic levels, and the highest criteria was 1.95 for a traffic level of 1 million ESALs per
year. However, seven experimental mixtures were exposed to 5 million ESALs per year, a much
higher traffic level than the validated range.
Figure 6.2 presents the DCSEHMA, DCSEMin and ER results of PMLC-RH and LMLC-
STOA specimens. As shown in Figure 6.2 (a), all the DCSEHMA results exceeded the minimum
criteria of 0.75. In addition, the PMLC-RH specimens consistently yielded higher DCSEHMA
values than the corresponding LMLC-STOA specimens, which indicates that the standard
AASHTO STOA procedure yielded a higher aging level than the actual plant-produced process.
As shown in Figure 6.2 (b), the DCSEMin results displayed the same trend with the DCSEHMA
results for all mixtures except for mixtures N8 and S6. Figure 6.2 (c) shows all the ER results are
greater than the highest ER criteria of 1.95 except for LMLC-STOA specimens of N8.
Meanwhile, the ER results of PMLC-RH are consistently higher than the LMLC-STOA results,
which is in agreement with DCSEHMA results. Additionally, the paired-t test results indicate that
the DCSEHMA and ER results of PMLC-RH specimens are statistically higher than the

129
corresponding LMLC-STOA specimens (p-value < 0.05), but there is no significant difference
between PMLC-RH and LMLC-STOA for DCSEMin results.
(a)
(b)
N1 N2 N5 N8 S5 S6 S13
PMLC-RH 4.52 3.58 3.19 1.57 5.76 5.17 2.52
LMLC-STOA 3.30 3.08 1.31 1.35 2.48 4.67 1.97
0
2
4
6
8D
CS
EH
MA
(kJ/m
3)
Criteria: 0.75 kJ/m3
N1 N2 N5 N8 S5 S6 S13
PMLC-RH 0.82 0.48 0.89 0.12 0.78 0.56 1.13
LMLC-STOA 0.65 0.42 0.71 0.17 0.65 0.68 0.95
0.0
0.4
0.8
1.2
DC
SE
Min
(kJ/m
3)
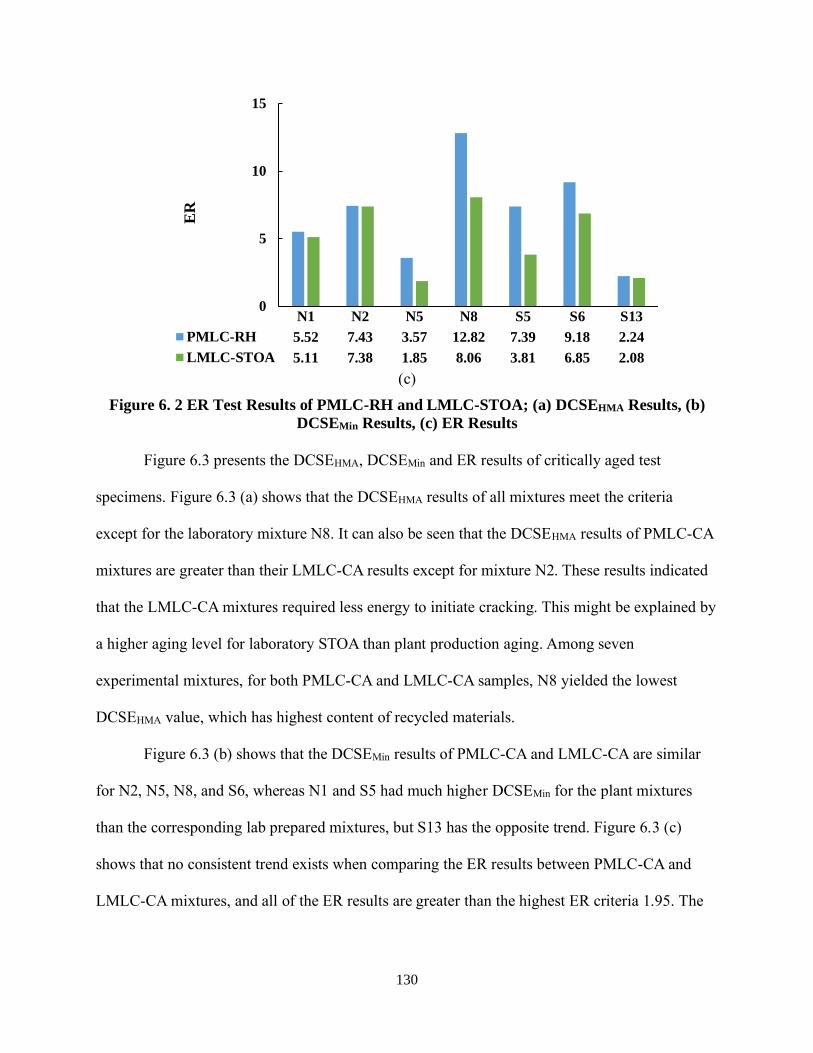
130
(c)
Figure 6. 2 ER Test Results of PMLC-RH and LMLC-STOA; (a) DCSEHMA Results, (b)
DCSEMin Results, (c) ER Results
Figure 6.3 presents the DCSEHMA, DCSEMin and ER results of critically aged test
specimens. Figure 6.3 (a) shows that the DCSEHMA results of all mixtures meet the criteria
except for the laboratory mixture N8. It can also be seen that the DCSEHMA results of PMLC-CA
mixtures are greater than their LMLC-CA results except for mixture N2. These results indicated
that the LMLC-CA mixtures required less energy to initiate cracking. This might be explained by
a higher aging level for laboratory STOA than plant production aging. Among seven
experimental mixtures, for both PMLC-CA and LMLC-CA samples, N8 yielded the lowest
DCSEHMA value, which has highest content of recycled materials.
Figure 6.3 (b) shows that the DCSEMin results of PMLC-CA and LMLC-CA are similar
for N2, N5, N8, and S6, whereas N1 and S5 had much higher DCSEMin for the plant mixtures
than the corresponding lab prepared mixtures, but S13 has the opposite trend. Figure 6.3 (c)
shows that no consistent trend exists when comparing the ER results between PMLC-CA and
LMLC-CA mixtures, and all of the ER results are greater than the highest ER criteria 1.95. The
N1 N2 N5 N8 S5 S6 S13
PMLC-RH 5.52 7.43 3.57 12.82 7.39 9.18 2.24
LMLC-STOA 5.11 7.38 1.85 8.06 3.81 6.85 2.08
0
5
10
15
ER

131
paired-t test results showed there was no significant difference between PMLC-CA and LMLC-
CA among these three cracking test parameters (p-value > 0.05).
(a)
(b)
N1 N2 N5 N8 S5 S6 S13
PMLC-CA 2.43 1.49 1.68 0.79 3.67 6.50 2.98
LMLC-CA 1.90 1.95 1.09 0.58 1.74 3.74 1.97
0
2
4
6
8D
CS
EH
MA
(kJ/m
3)
Criteria: 0.75 kJ/m3
N1 N2 N5 N8 S5 S6 S13
PMLC-CA 0.21 0.06 0.22 0.05 0.30 0.25 0.36
LMLC-CA 0.11 0.07 0.23 0.04 0.11 0.22 0.52
0.0
0.2
0.4
0.6
DC
SE
Min
(kJ/m
3)

132
(c)
Figure 6. 3 ER Test Results of PMLC-CA and LMLC-CA; (a) DCSEHMA Results, (b)
DCSEMin Results, (c) ER Results
6.2.2 Texas Overlay Test
Figure 6.4 presents the comparison results of TX-Nf and TX-β between PMLC-RH and LMLC-
STOA specimens. The error bars in the figure represent plus and minus one standard deviation.
As shown in Figure 6.4 (a), for both PMLC-RH and LMLC-STOA specimens, mixture N8 with
20% RAP and 5% RAS yielded the lowest TX-Nf value, which failed at two and three cycles,
respectively. Mixture S13 containing higher binder content and 20% ground tire rubber obtained
the highest TX-Nf value for both plant-produced and laboratory-prepared mixtures. Two-way
ANOVA results indicated that no significant difference existed between PMLC-RH and LMLC-
STOA specimens. However, t-test results showed that statistical differences existed between
plant mixtures and laboratory mixtures for mixtures S6 and S13. As shown in Figure 6.4 (b),
mixtures N8 and S13 yielded the highest and lowest TX-β value, respectively, which indicated
the worst and best cracking resistance, respectively. Two -way ANOVA results indicated that
N1 N2 N5 N8 S5 S6 S13
PMLC-CA 11.36 26.42 7.60 17.16 12.35 25.55 8.36
LMLC-CA 18.03 28.69 4.77 13.30 15.20 16.69 3.79
0
10
20
30
ER

133
there was a significant difference between PMLC-RH and LMLC-STOA specimens, and
statistical difference was also observed for mixtures N8 and S13 using t-test.
Figure 6.5 presents the comparison results of TX-Nf and TX-β for the critically aged
specimens. The error bars in the figure represent plus and minus one standard deviation. As
shown in Figure 6.5, both TX-Nf and TX-β results indicated that mixture N8 and S13 had the
lowest and highest cracking resistance, respectively, which were attributed to the compositions of
these mixtures. In addition, both two-way ANOVA and t-test results indicated there was no
statistically significant difference between PMLC-CA and LMLC-CA specimens for both TX-OT
cracking test parameters.
(a)
N1 N2 N5 N8 S5 S6 S13
PMLC-RH 25 59 17 2 61 13 1710
LMLC-STOA 16 28 30 3 47 228 538
0
500
1000
TX
-Nf
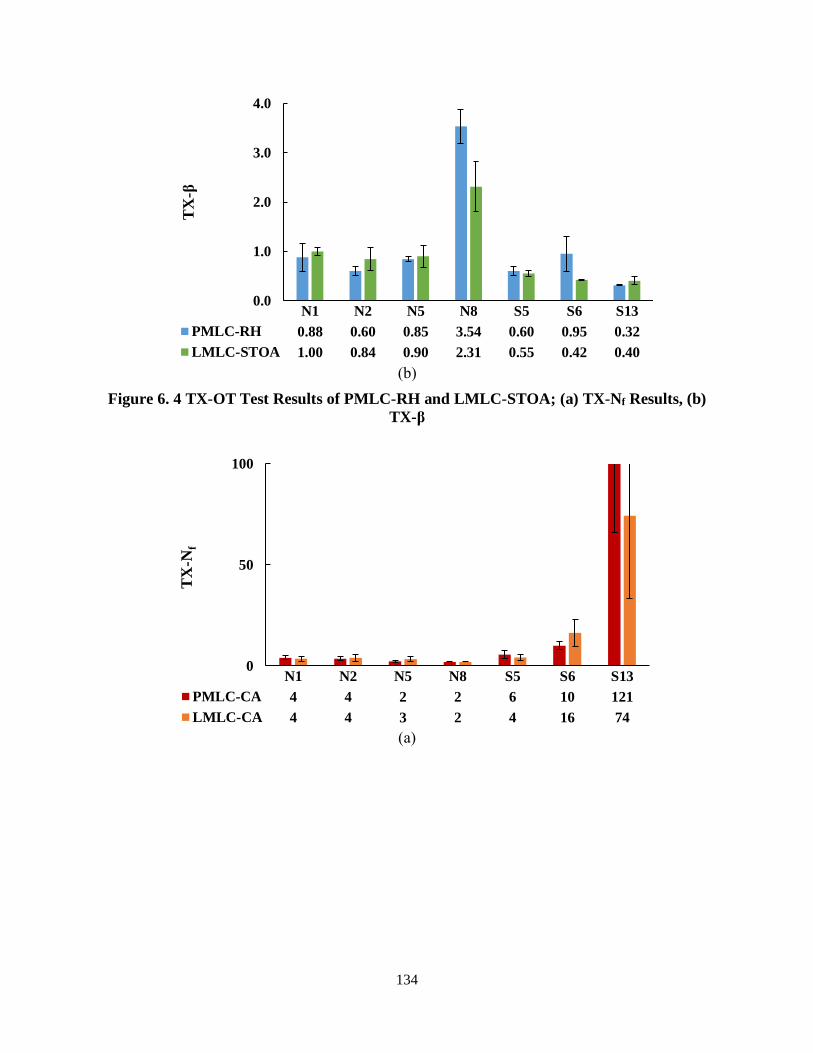
134
(b)
Figure 6. 4 TX-OT Test Results of PMLC-RH and LMLC-STOA; (a) TX-Nf Results, (b)
TX-β
(a)
N1 N2 N5 N8 S5 S6 S13
PMLC-RH 0.88 0.60 0.85 3.54 0.60 0.95 0.32
LMLC-STOA 1.00 0.84 0.90 2.31 0.55 0.42 0.40
0.0
1.0
2.0
3.0
4.0
TX
-β
N1 N2 N5 N8 S5 S6 S13
PMLC-CA 4 4 2 2 6 10 121
LMLC-CA 4 4 3 2 4 16 74
0
50
100
TX
-Nf

135
(b)
Figure 6. 5 TX-OT Test Results of PMLC-CA and LMLC-CA; (a) TX-Nf Results, (b) TX-β
6.2.3 NCAT Modified Overlay Test
Figure 6.6 presents the comparison results of NCAT-Nf and NCAT-β between PMLC-RH and
LMLC-STOA specimens. As shown in the Figure 6.6 (a), mixture N8, which contained 20%
RAP and 5% RAS yielded the lowest NCAT-Nf value for both plant-produced and laboratory-
prepared mixtures. Meanwhile, mixture S13 had the highest NCAT-Nf value for both plant-
produced and laboratory-prepared mixtures, which indicated the best cracking resistance. Two-
way ANOVA results indicated that no significant difference existed between PMLC-RH and
LMLC-STOA for NCAT-Nf results. However, t-test results showed that a statistical difference
existed between PMLC-RH and LMLC-STOA specimens for mixtures N8 and S6. As shown in
Figure 6.6 (b), NCAT-β results showed the similar trend with NCAT-Nf results; mixtures N8 and
S13 yielded the worst and best cracking resistance for both plant mixtures and laboratory
mixtures, respectively. Two-way ANOVA results implied that there was a significant difference
existing between PMLC-RH and LMLC-STOA, and statistical difference was also observed for
mixtures N8 and S5 based on the t-test results.
N1 N2 N5 N8 S5 S6 S13
PMLC-CA 2.08 2.03 2.96 3.43 1.54 1.07 0.48
LMLC-CA 2.34 2.04 2.38 3.25 2.04 0.89 0.57
0.0
1.0
2.0
3.0
4.0
TX
-β

136
(a)
(c)
Figure 6. 6 NCAT-OT Test Results of PMLC-RH and LMLC-STOA; (a) NCAT-Nf Results,
(b) NCAT-β
Figure 6.7 presents the NCAT-Nf and NCAT-β results of critically aged test specimens.
For both plant mixtures and laboratory mixtures, mixtures N8 had the lowest NCAT-Nf result and
the highest NCAT-β result, which indicated the worst cracking resistance. In addition, mixture
S13 yielded the highest NCAT-Nf result and the lowest NCAT-β result, which represented the
best cracking resistance. For both NCAT-Nf and NCAT-β results, two-way ANOVA results
indicated that there was no significant difference between PMLC-CA and LMLC-CA specimens,
N1 N2 N5 N8 S5 S6 S13
PMLC-RH 516 697 189 12 773 411 3054
LMLC-STOA 428 546 155 49 672 2881 3041
0
2000
4000
NC
AT
-Nf
N1 N2 N5 N8 S5 S6 S13
PMLC-RH 0.27 0.24 0.32 0.60 0.29 0.26 0.24
LMLC-STOA 0.27 0.24 0.33 0.41 0.25 0.25 0.24
0.0
0.4
0.8
NC
AT
-β

137
although the t-test indicated a statistical difference between plant mixtures and laboratory
mixtures for mixture S5.
(a)
(b)
Figure 6. 7 NCAT-OT Test Results of PMLC-CA and LMLC-CA; (a) NCAT-Nf Results,
(b) NCAT-β
6.2.4 Semi-Circular Bend Test
Figure 6.8 and Figure 6.9 present the comparison results of SCB-Jc before and after critical
aging, respectively. The error bars in the figures represent plus and minus one estimated standard
deviation. As shown in Figure 6.8, the PMLC-RH specimen showed greater Jc results than the
N1 N2 N5 N8 S5 S6 S13
PMLC-CA 28 55 14 4 144 403 713
LMLC-CA 36 47 6 3 23 400 830
0
500
1000N
CA
T-N
f
N1 N2 N5 N8 S5 S6 S13
PMLC-CA 0.50 0.41 0.60 0.95 0.33 0.27 0.26
LMLC-CA 0.48 0.42 0.66 1.15 0.52 0.29 0.25
0.0
1.0
2.0
NC
AT
-β

138
corresponding LMLC-STOA specimens except for mixture S13. Figure 6.9 shows that the
LMLC-CA specimens yielded greater Jc results for mixtures N1, N2, and N5, whereas mixtures
N8, S5, S6, and S13 had similar Jc results for PMLC-CA and LMLC-CA specimens with an
average difference of 0.015. Paired-t test results indicated there was no significant difference
between plant mixtures and laboratory mixtures at both aging conditions.
Figure 6. 8 SCB Test Results of PMLC-RH and LMLC-STOA
Figure 6. 9 SCB Test Results of PMLC-CA and LMLC-CA
N1 N2 N5 N8 S5 S6 S13
PMLC-RH 0.36 0.61 0.34 0.39 0.34 0.37 0.51
LMLC-STOA 0.29 0.54 0.32 0.22 0.30 0.23 0.61
0.0
0.2
0.4
0.6
0.8
Jc
(kJ/m
2)
N1 N2 N5 N8 S5 S6 S13
PMLC-CA 0.34 0.27 0.22 0.25 0.28 0.32 0.57
LMLC-CA 0.38 0.45 0.26 0.23 0.27 0.34 0.56
0.0
0.2
0.4
0.6
0.8
Jc
(kJ/m
2)

139
6.2.5 Illinois Flexibility Index Test
Figure 6.10 and Figure 6.11 present the comparison results of FI before and after critical aging,
respectively. As shown in Figure 6.10, mixture N8 containing 20% RAP and 5% RAS yielded
the lowest FI value for both PMLC-RH and LMLC-STOA specimens, which indicated the worst
cracking resistance. LMLC-STOA specimens had greater FI results than the corresponding
PMLC-RH specimens except for mixture S5. Two-way ANOVA results indicated that there was a
significant difference in FI between PMLC-RH and LMLC-STOA specimens, implying that a
higher aging level occurred during the plant production compared to the laboratory STOA
protocol. Furthermore, statistical differences in FI were also observed for mixtures N2, N5, and
S6 based on t-test results.
Figure 6.11 shows that plant mixtures had similar FI results with laboratory mixtures
after critical aging; the differences varied from 0.0 to 1.1. In addition, two-way ANOVA results
indicated that no significant difference in FI existed between plant mixtures and laboratory
mixtures after critical aging. Although, t-test results showed that a statistical difference existed in
FI between PMLC-CA and LMLC-CA for mixture S5, a difference of only 1.1 for FI is probably
not practically significant.

140
Figure 6. 10 I-FIT Test Results of PMLC-RH and LMLC-STOA
Figure 6. 11 I-FIT Test Results of PMLC-CA and LMLC-CA
6.2.6 Indirect Tensile Asphalt Cracking Test
Figure 6.12 and Figure 6.13 present the comparison results of CTIndex before and after critical
aging, respectively. As shown in Figure 6.12, LMLC-STOA specimens had higher CTIndex values
than the corresponding PMLC-RH specimens except for mixture S13. Mixture N8 had the lowest
CTIndex value, which indicated the worst cracking resistance. Although there was no significant
N1 N2 N5 N8 S5 S6 S13
PMLC-RH 3.6 2.0 2.4 0.4 6.3 4.4 10.4
LMLC-STOA 4.2 2.7 4.0 0.4 5.2 14.7 15.1
0
5
10
15
20
25
Fle
xib
ilit
y I
nd
ex
N1 N2 N5 N8 S5 S6 S13
PMLC-CA 0.6 0.1 0.7 0.1 1.8 3.8 4.3
LMLC-CA 0.6 0.1 0.7 0.0 0.7 3.4 5.2
0
5
10
Fle
xib
ilit
y I
nd
ex
141
difference in CTIndex between PMLC-RH and LMLC-STOA specimens based on the two-way
ANOVA, statistical differences were observed for mixtures N5, N8, S5, S6, and S13 using the t-
test.
Figure 6.13 presents the IDEAL-CT results after critical aging. The two-way ANOVA
results indicated that there was no significant difference in CTIndex results between PMLC-CA
and LMLC-CA mixtures. However, t-test results showed that a statistical difference existed
between plant mixtures and laboratory mixtures for mixtures N1, N2, N5, and S5 (p-value <
0.05). The differences in CTIndex between PMLC-CA and LMLC-CA specimens for these four
mixtures can be attributed to the low variability of these sets of specimens; the differences are
probably not significant in the practical sense.
Figure 6. 12 IDEAL-CT Test Results of PMLC-RH and LMLC-STOA
N1 N2 N5 N8 S5 S6 S13
PMLC-RH 26.2 13.2 23.8 5.9 32.4 32.9 250.1
LMLC-STOA 30.2 13.9 33.2 10.9 41.6 80.8 133.1
0
100
200
300
CT
Ind
ex

142
Figure 6. 13 IDEAL-CT Test Results of PMLC-CA and LMLC-CA
6.2.7 Summary of Comparison Analysis between Plant mixtures and Laboratory Mixtures
Two-way ANOVA tests and paired-t tests were conducted to compare results for plant mixtures
and laboratory mixtures at both aging conditions for the six laboratory cracking tests. Table 6.1
summarizes the p-values of paired-t test and two-way ANOVA test for the comparison analysis at
both aging conditions. Cells highlighted with yellow indicate that a significant difference exists
between plant mixtures and laboratory mixtures (p-value < 0.05). As shown in Table 6.1, there
was a significant difference between plant mixtures and laboratory mixtures before critical aging
for DCSEHMA, ER, TX-Nf, NCAT-Nf, and FI. After critical aging, no statistical difference was
observed between plant mixtures and laboratory mixtures among all the cracking test parameters.
In addition, t-tests also detected statistical differences between some, but not all plant
mixtures and laboratory mixtures at both aging conditions for TX-OT, NCAT-OT, I-FIT, and
IDEAL-CT tests. The mixtures having statistical differences are summarized in Table 6.2; “NA”
indicated that there was no statistical difference between plant mixtures and laboratory mixtures
for all seven mixtures. As shown in Table 6.2, the t-test statistical differences between plant
N1 N2 N5 N8 S5 S6 S13
PMLC-CA 8.8 5.1 8.6 2.4 16.3 18.7 68.4
LMLC-CA 7.3 6.1 11.8 2.8 10.7 22.2 63.4
0
50
100
CT
In
dex

143
mixtures and laboratory mixtures were observed in different mixtures and different cracking test
parameters. There was no consistent trend regarding the statistical differences before critical
aging. After critical aging, no statistical differences were found for TX-OT test, and only mixture
S5 showed statistical difference for NCAT-OT, I-FIT, and IDEAL-CT tests.
Table 6. 1 p-value Summary of Comparison Analysis
PMLC-RH Vs. LMLC-STOA PMLC-CA Vs. LMLC-CA Statistical Test
DCSEHMA 0.03 0.07 Paired-t test
DCSEMin 0.12 0.60 Paired-t test
ER 0.04 0.58 Paired-t test
TX-Nf 0.06 0.28 Two-way ANOVA
TX-β 0.04 0.92 Two-way ANOVA
NCAT-Nf 0.28 0.99 Two-way ANOVA
NCAT-β 0.02 0.08 Two-way ANOVA
Jc 0.13 0.23 Paired-t test
FI 0.00 0.37 Two-way ANOVA
CTIndex 0.63 0.64 Two-way ANOVA
Table 6. 2 Summary of Mixtures showing Statistical Difference during t-test
PMLC-RH Vs. LMLC-STOA PMLC-CA Vs. LMLC-CA
TX-Nf S6, S13 NA
TX-β N8, S13 NA
NCAT-Nf N8, S6 S5
NCAT-β N8, S5 S5
FI N2, N5, S6 S5
CTIndex N5, N8, S5, S6, S13 N1, N2, N5, S5

144
6.3 Sensitivity Analyses
According to the NCHRP 9-57 project (Zhou et al., 2017), an ideal test for evaluating the
cracking resistance of asphalt mixtures should be sensitive to common mix design factors (e.g.,
aggregate, binder, RAP/RAS), have low variability and a good correlation with field cracking
performance. This section presents a sensitivity analysis of the six selected cracking tests to four
mix design factors: aging, air voids, recycled asphalt materials, and binder type. For ER and SCB
tests, the aging sensitivity analysis was conducted using paired-t test at a significant level of
0.05, and the mean value analysis was used to evaluate their sensitivities to air voids, recycled
asphalt materials, and modified binders. For TX-OT, NCAT-OT, I-FIT, and IDEAL-CT results,
aging sensitivity analyses were conducted using both mean values and a two-way ANOVA at a
significance level of 0.05. The Games-Howell post hoc test at a significance level of 0.05 was
utilized to evaluate sensitivities to air voids, recycled asphalt materials, and modified binders.
6.3.1 Aging Sensitivity
Asphalt aging has a significant effect on the development of TDC; after aging, mixtures are
expected to be more brittle and less resistant to crack initiation (Rahbar-Rastegar et al., 2018).
Each of the six cracking tests were conducted on reheated and critically aged PMLC specimens.
All the cracking test results, except for β, were expected to decrease with aging. If the cracking
test parameter showed the expected trend, this parameter was considered sensitive to aging.
(1) Energy Ratio
Figure 6.14 and Figure 6.15 present the aging sensitivity results of DCSEHMA, DCSEMin, and ER
for laboratory mixtures and plant mixtures, respectively. Based on the study of Roque et al.
(2004), the ER was calibrated and validated over the DCSEHMA range from 0.75 to 2.5 kJ/m3,

145
and a minimum DCSEHMA criterion of 0.75 kJ/m3 was recommended to screen out mixtures with
extremely high stiffness. In addition, minimum ER criteria were also proposed for different
traffic levels, and the highest criteria was 1.95 for a traffic level of 1 million ESALs per year.
However, seven experimental mixtures were exposed to a much higher traffic level than the
validated range.
As shown in the Figure 6.14 (a), the DCSEHMA of laboratory mixtures at both aging
conditions met the minimum criteria of 0.75 kJ/m3 except for the mixture N8 containing 20%
RAP and 5% RAS after critical aging. In addition, the DCSEHMA decreased after critical aging
for all mixtures except for mixture S13, which included ground tire rubber modified binder.
Figure 6.14 (b) shows that the DCSEMin decreased after critical aging for all seven mixtures,
which was expected. However, as shown in Figure 6.14 (c), the ER increased after critical aging
for all seven mixtures, which was not consistent with the expected trend. Furthermore, paired-t
test results indicated that aging had significant effects on all these three parameters. DCSEHMA
and DCSEMin both decreased with aging as expected, but ER displayed the opposite trend.
(a)
N1 N2 N5 N8 S5 S6 S13
LMLC-STOA 3.30 3.08 1.31 1.35 2.48 4.67 1.97
LMLC-CA 1.90 1.95 1.09 0.58 1.74 3.74 1.97
0
2
4
6
DC
SE
HM
A(k
J/m
3)
Criteria: 0.75 kJ/m3

146
(b)
(c)
Figure 6. 14 Aging Sensitivity Results of ER Test to Laboratory Mixtures; (a) DCSEHMA
Results, (b) DCSEMin Results, (c) ER Results
Figure 6.15 (a) shows that all PMLC-RH mixtures except N8 had DCSEHMA results
within the validated range of 0.75 to 2.5 kJ/m3. However, only three PMLC-CA mixtures were
within the validated range, including S5, S6, and S13. As expected, for most mixtures, the
DCSEMin for PMLC-CA mixtures were lower than their PMLC-RH results. The two exceptions
were S6 and S13, which have a HiMA binder and a rubber modified binder, respectively. These
results may indicate that these modified binders require more energy to initiate cracking after
N1 N2 N5 N8 S5 S6 S13
LMLC-STOA 0.65 0.42 0.71 0.17 0.65 0.68 0.95
LMLC-CA 0.11 0.07 0.23 0.04 0.11 0.22 0.52
0.0
0.5
1.0
DC
SE
Min
(kJ/m
3)
N1 N2 N5 N8 S5 S6 S13
LMLC-STOA 5.11 7.38 1.85 8.06 3.81 6.85 2.08
LMLC-CA 18.03 28.69 4.77 13.30 15.20 16.69 3.79
0
10
20
30
ER

147
aging. Figure 6.15 (b) shows that the DCSEMin results of all mixes decreased significantly with
aging. However, in Figure 6.15 (c), all seven mixtures had higher ER values after aging, which is
not consistent with the expected trend. Based on the paired-t test results, DSCEHMA was not
sensitive to aging, DCSEMin was sensitive to aging in the expected direction, and ER was
sensitive to aging but the direction did not follow the expected trend.
(a)
(b)
N1 N2 N5 N8 S5 S6 S13
PMLC-RH 4.52 3.58 3.19 1.57 5.76 5.17 2.52
PMLC-CA 2.43 1.49 1.68 0.79 3.67 6.50 2.98
0
2
4
6
8
DC
SE
HM
A(k
J/m
3)
Criteria: 0.75 kJ/m3
N1 N2 N5 N8 S5 S6 S13
PMLC-RH 0.82 0.48 0.89 0.12 0.78 0.56 1.13
PMLC-CA 0.21 0.06 0.22 0.05 0.30 0.25 0.36
0.0
0.4
0.8
1.2
DC
SE
Min
(kJ/m
3)

148
(c)
Figure 6. 15 Aging Sensitivity Results of ER Test to Plant Mixtures; (a) DCSEHMA Results,
(b) DCSEMin Results, (c) ER Results
(2) Texas Overlay Test
Figure 6.16 presents the TX-OT results of laboratory mixtures at both aging conditions,
including TX-Nf and TX-β. The error bars shown in figures represent plus and minus one
standard deviation of the results for each mixture, and the mean values are shown below each
respective mixture. As shown in Figure 6.16 (a), TX-Nf decreased after critical aging for all
seven mixtures, indicating a lower cracking resistance after aging. Mixtures S6 and S13 had
much higher TX-Nf results than other five mixtures at both aging conditions, which might be
explained by the use of HiMA binder and a rubber modified binder, respectively. Mixture N8,
which contained 20% RAP and 5% RAS, had the lowest TX-Nf values among all the mixtures at
both aging conditions. As shown in Figure 6.16 (b), all LMLC-CA mixtures had greater TX-β
results than the corresponding LMLC-STOA mixtures, which implied that the cracking
resistance of mixtures decreased after aging. In addition, mixtures N8 and S13 yielded the
highest and lowest TX-β results, respectively, which indicated the worst and best cracking
N1 N2 N5 N8 S5 S6 S13
PMLC-RH 5.5 7.4 3.6 12.8 7.4 9.2 2.2
PMLC-CA 11.4 26.4 7.6 17.2 12.4 25.5 8.4
0
10
20
30
ER

149
resistance, respectively. Two-way ANOVA results indicated that both parameters were
significantly affected by aging.
(a)
(b)
Figure 6. 16 Aging Sensitivity Results of TX-OT Test to Laboratory Mixtures; (a) TX-Nf
Results, (b) TX-β Results
Figure 6.17 presents the TX-OT results of plant mixtures, including TX-Nf and TX-β. The
error bars shown in figures represent plus and minus one standard deviation of the results for
each mixture. The mean values are shown below each respective mixture. As shown in Figure
6.17 (a), for all seven mixtures, the mean TX-Nf of tests on critically aged mixtures were
N1 N2 N5 N8 S5 S6 S13
LMLC-STOA 16 28 30 3 47 228 538
LMLC-CA 4 4 3 2 4 16 74
0
50
100
150T
X-N
f
N1 N2 N5 N8 S5 S6 S13
LMLC-STOA 1.00 0.84 0.90 2.31 0.55 0.42 0.40
LMLC-CA 2.34 2.04 2.38 3.25 2.04 0.89 0.57
0.0
1.0
2.0
3.0
4.0
TX
-β

150
substantially lower than those of reheated mixtures, indicating increased susceptibility to
cracking after aging. Mixture N8, which contained 20% RAP and 5% RAS, failed at two cycles
for both reheated and critically aged conditions, which indicated that this mixture had almost no
cracking resistance in this extremely high strain test. The mean Nf of mixture S13 greatly
exceeded the other mixtures, which were more than 28 times and 12 times higher than other
reheated and critically aged mixtures, respectively.
Similar trends were also observed for the TX-β results shown in Figure 6.17 (b). The
RAP/RAS mixture, N8, yielded the highest TX-β values for both reheated and critically aged
conditions, which indicated the worst cracking resistance. The GTR mixture, S13, had the lowest
TX-β values indicating better cracking resistance than the other six mixtures. As expected, for all
mixtures except N8, the TX-β results on critically aged samples were higher than results of
reheated samples. For mixture N8, the difference in TX-β results between reheated and critically
aged samples was only 0.11. For both parameters of the TX-OT test, the p-values of the aging
factor were less than 0.005 based on a two-way ANOVA analysis. The results indicated that the
effect of aging on TX-OT results was significant, with both parameters sensitive to aging.
(a)
N1 N2 N5 N8 S5 S6 S13
PMLC-RH 25 59 17 2 61 13 1710
PMLC-CA 4 4 2 2 6 10 121
0
100
200
TX
-Nf

151
(b)
Figure 6. 17 Aging Sensitivity Results of TX-OT Test to Plant Mixtures; (a) TX-Nf Results,
(b) TX-β Results
(3) NCAT Modified Overlay Test
Figure 6.18 presents the NCAT-Nf and NCAT-β results of laboratory mixtures at both aging
conditions. The error bars represent plus and minus one standard deviation from the mean values.
As shown in Figure 6.18 (a), all LMLC-STOA mixtures had much higher NCAT-Nf results than
the corresponding LMLC-CA mixtures, which indicated a substantial decline in cracking
resistance after aging. A similar trend was also observed in Figure 6.18 (b), the TX-β results
increased after critical aging, indicating a decrease in cracking resistance after aging. However,
the changes after aging were very small for mixtures S6 and S13, which indicated the HiMA
binder and GTR modified binder had good aging resistance. In addition, the two-way ANOVA
results indicated that both NCAT-OT parameters were significantly influenced by aging.
N1 N2 N5 N8 S5 S6 S13
PMLC-RH 0.88 0.60 0.85 3.54 0.60 0.95 0.32
PMLC-CA 2.08 2.03 2.96 3.43 1.54 1.07 0.48
0.0
1.0
2.0
3.0
4.0
TX
-β

152
(a)
(b)
Figure 6. 18 Aging Sensitivity Results of NCAT-OT Test to Laboratory Mixtures; (a)
NCAT-Nf Results, (b) NCAT-β Results
Figure 6.19 presents the NCAT-Nf and NCAT-β results of plant mixtures at both aging
conditions. The error bars represent plus and minus one standard deviation from the mean values.
As shown in Figure 6.19 (a), most mixtures had much lower NCAT-Nf results for critically aged
samples than for reheated samples. The one exception was the mixture with a HiMA binder, S6.
As shown in Figure 6.19 (b), the NCAT-β results increased for all of the critically aged samples
compared to the corresponding reheated samples, however the differences were very small for
N1 N2 N5 N8 S5 S6 S13
LMLC-STOA 428 546 155 49 672 2881 3041
LMLC-CA 36 47 6 3 23 400 830
0
1000
2000
3000
4000
NC
AT
-Nf
N1 N2 N5 N8 S5 S6 S13
LMLC-STOA 0.27 0.24 0.33 0.41 0.25 0.25 0.24
LMLC-CA 0.48 0.42 0.66 1.15 0.52 0.29 0.25
0.0
1.0
2.0
NC
AT
-β
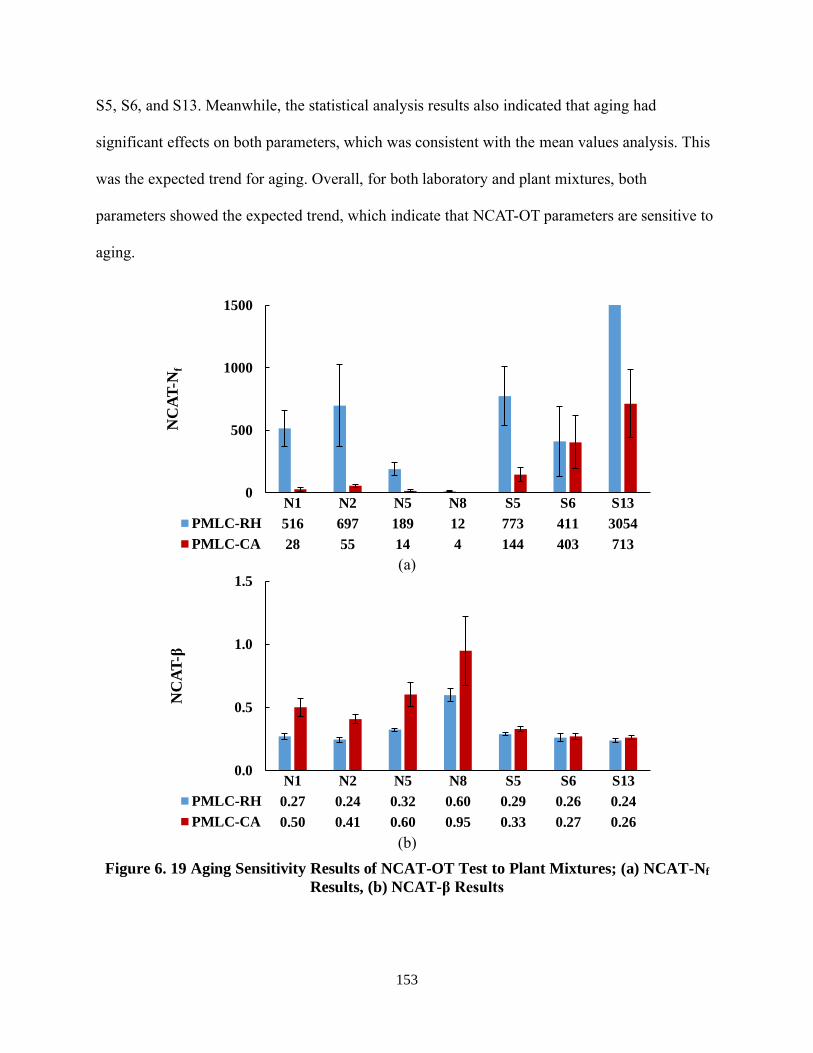
153
S5, S6, and S13. Meanwhile, the statistical analysis results also indicated that aging had
significant effects on both parameters, which was consistent with the mean values analysis. This
was the expected trend for aging. Overall, for both laboratory and plant mixtures, both
parameters showed the expected trend, which indicate that NCAT-OT parameters are sensitive to
aging.
(a)
(b)
Figure 6. 19 Aging Sensitivity Results of NCAT-OT Test to Plant Mixtures; (a) NCAT-Nf
Results, (b) NCAT-β Results
N1 N2 N5 N8 S5 S6 S13
PMLC-RH 516 697 189 12 773 411 3054
PMLC-CA 28 55 14 4 144 403 713
0
500
1000
1500
NC
AT
-Nf
N1 N2 N5 N8 S5 S6 S13
PMLC-RH 0.27 0.24 0.32 0.60 0.29 0.26 0.24
PMLC-CA 0.50 0.41 0.60 0.95 0.33 0.27 0.26
0.0
0.5
1.0
1.5
NC
AT
-β

154
(4) Semi-Circular Bend Test
Figure 6.20 and Figure 6.21 present the Jc results of laboratory mixtures and plant mixtures at
both aging conditions, respectively. The error bars in the figures represent plus and minus one
estimated standard deviation. As shown in Figure 6.20, the Jc results of laboratory mixtures
decreased after aging for four of the seven mixtures, but increased after aging for the other three
mixtures. Figure 6.21 shows, for all plant mixtures except for the GTR modified mixture, S13,
the critically aged Jc results were substantially lower than the corresponding results on reheated
samples. The paired-t test results indicated that aging did not significantly affect the Jc results for
both laboratory and plant mixtures.
Figure 6. 20 Aging Sensitivity of SCB Test to Laboratory Mixtures
N1 N2 N5 N8 S5 S6 S13
LMLC-STOA 0.29 0.54 0.32 0.22 0.30 0.23 0.61
LMLC-CA 0.38 0.45 0.26 0.23 0.27 0.34 0.56
0.0
0.2
0.4
0.6
0.8
Jc
(kJ/m
2)

155
Figure 6. 21 Aging Sensitivity of SCB Test to Plant Mixtures
(5) Illinois Flexibility Index Test
Figure 6.22 and Figure 6.23 present the FI results of laboratory mixtures and plant mixtures at
both aging conditions, respectively. The error bars in the figures represent plus and minus one
estimated standard deviation. As shown in following figures, for both laboratory and plant
mixtures, the FI reduced after aging, which indicated decreasing cracking resistance after aging.
In addition, mixture N8 containing 20% RAP and 5% RAS consistently yielded the lowest FI
value for both laboratory and plant mixtures at both aging conditions. Both the mean value and
two-way ANOVA analyses indicated that FI results were significantly affected by aging for both
laboratory and plant mixtures.
N1 N2 N5 N8 S5 S6 S13
PMLC-RH 0.36 0.61 0.34 0.39 0.34 0.37 0.51
PMLC-CA 0.34 0.27 0.22 0.25 0.28 0.32 0.57
0.0
0.2
0.4
0.6
0.8
Jc
(kJ/m
2)

156
Figure 6. 22 Aging Sensitivity of I-FIT Test to Laboratory Mixtures
Figure 6. 23 Aging Sensitivity of I-FIT Test to Plant Mixtures
(6) Indirect Tensile Asphalt Cracking Test
Figure 6.24 and Figure 6.25 present the CTIndex results of laboratory mixtures and plant mixtures
at both aging conditions, respectively. The error bars in the figures represent plus and minus one
estimated standard deviation. As shown in following figures, mixtures N8 and S13 showed the
worst and the best cracking resistance for both laboratory and plant mixtures at both aging
N1 N2 N5 N8 S5 S6 S13
LMLC-STOA 4.2 2.7 4.0 0.4 5.2 14.7 15.1
LMLC-CA 0.6 0.1 0.7 0.0 0.7 3.4 5.2
0
5
10
15
20
25
Fle
xib
ilit
y I
nd
ex
N1 N2 N5 N8 S5 S6 S13
PMLC-RH 3.6 2.0 2.4 0.4 6.3 4.4 10.4
PMLC-CA 0.6 0.1 0.7 0.1 1.8 3.8 4.3
0
5
10
15
Fle
xib
ilit
y I
nd
ex

157
conditions, respectively, which was consistent with TX-OT, NCAT-OT, and I-FIT results. In
addition, for both laboratory and plant mixtures, the CTIndex results of critically aged samples
were statistically lower than the corresponding STOA or reheated samples, which indicated
decreasing cracking resistance after aging.
Figure 6. 24 Aging Sensitivity of IDEAL-CT Test to Laboratory Mixtures
Figure 6. 25 Aging Sensitivity of IDEAL-CT Test to Plant Mixtures
N1 N2 N5 N8 S5 S6 S13
LMLC-STOA 30.2 13.9 33.2 10.9 41.6 80.8 133.1
LMLC-CA 7.3 6.1 11.8 2.8 10.7 22.2 63.4
0
100
200
CT
Ind
ex
N1 N2 N5 N8 S5 S6 S13
PMLC-RH 26.2 13.2 23.8 6.7 32.4 32.9 208.1
PMLC-CA 8.8 5.1 8.6 2.4 16.3 18.7 68.4
0
100
200
300
CT
Ind
ex

158
(7) Summary of Aging Sensitivity Analysis
The aging sensitivity analysis were conducted using paired-t test and two-way ANOVA for both
plant mixtures and laboratory mixtures, which was summarized in Table 6.3. A “+” indicates that
the parameter is sensitive to aging; a “-” indicates that the parameter is not sensitive to aging. As
it can be seen, most of the cracking test parameters are sensitive to aging for both plant and
laboratory mixtures, including DCSEMin, TX-Nf, TX-β, NCAT-Nf, NCAT-β, FI, and CTIndex. In
addition, ER and Jc are not sensitive to aging for both plant and laboratory mixtures, and
DCSEHMA is only sensitive to aging for laboratory mixtures.
Table 6. 3 Summary of Aging Sensitivity Analysis
PMLC-RH Vs. PMLC-CA LMLC-STOA Vs. LMLC-CA Statistical Test
DCSEHMA - + Paired-t test
DCSEMin + + Paired-t test
ER - - Paired-t test
TX-Nf + + Two-way ANOVA
TX-β + + Two-way ANOVA
NCAT-Nf + + Two-way ANOVA
NCAT-β + + Two-way ANOVA
Jc - - Paired-t test
FI + + Two-way ANOVA
CTIndex + + Two-way ANOVA
6.3.2 Air Voids Sensitivity
Several laboratory and field studies have investigated the effect of air voids (density) on the
fatigue of asphalt mixtures (Harvey et al., 1996; Fisher et al., 2010; Tran et al., 2016). In general,
these studies indicate that lower air voids improve fatigue performance of asphalt mixtures by
increasing stiffness and possibly reducing the rate of aging.

159
In this study, the target in-place air voids of mixtures N1 and N2 were used to evaluate
sensitivities to air voids. Specimens for N1 were compacted to 7.0 ± 0.5% air voids, whereas
specimens for N2 were compacted to 4.0 ± 0.5% air voids. It was expected that the mix
compacted to a lower air void content would have better cracking resistance. For each cracking
test and aging condition, if the results of the two mixtures followed the expected trend, that
cracking test parameter was considered sensitive to air voids.
Figure 6.26 shows two examples of air voids sensitivity results using PMLC-RH ER and
CTIndex results. Both ER and CTIndex values were expected to decrease with the increasing air
void contents, so mixture N2 with the lower air voids was expected to yield the higher ER and
CTIndex values. The arrow in Figure 6.26 (a) showed that ER results decreased with the increasing
air void contents based on the mean value analysis, indicating ER parameter was affected by air
voids in the expected trend. Figure 6.26 (b) shows that mixture N2 with lower air void contents
yielded a lower mean CTIndex value, meaning that CTIndex parameter is not sensitive to air voids
based on mean value analysis. According to the statistical group analysis results, CTIndex value of
mixture N2 was statistically lower than the values of mixtures N1, which also indicated CTIndex
parameter was not sensitive to air voids based on statistical group analysis.

160
(a)
(b)
Figure 6. 26 Examples of Air Voids Sensitivity; (a) ER Results, (b) CTIndex Results
Table 6.4 and 6.5 summarizes the sensitivity of the cracking test parameters to air voids
using both mean value and statistical analyses for plant mixtures and laboratory mixtures,
respectively. A “+” indicates that the parameter matched the expected trend for the two mixtures;
a “-” indicates that the parameter did not match the expected trend for the two mixtures; “N/A”
indicates that the parameter could not be analyzed statistically.
0
3
6
9
N2 (4% Air Voids) N1 (7% Air Voids)
ER
PMLC-RH
0
10
20
30
N2 (4% Air Voids) N1(7% Air Voids)
CT
In
dex
PMLC-RH
B
A
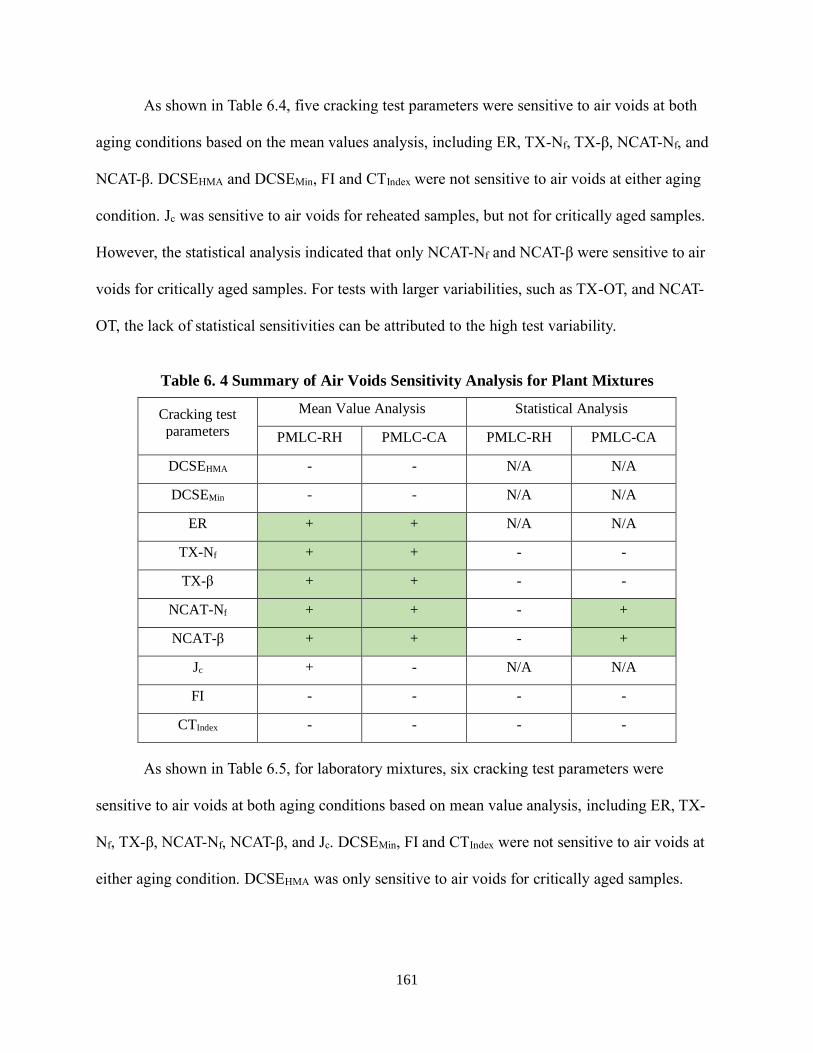
161
As shown in Table 6.4, five cracking test parameters were sensitive to air voids at both
aging conditions based on the mean values analysis, including ER, TX-Nf, TX-β, NCAT-Nf, and
NCAT-β. DCSEHMA and DCSEMin, FI and CTIndex were not sensitive to air voids at either aging
condition. Jc was sensitive to air voids for reheated samples, but not for critically aged samples.
However, the statistical analysis indicated that only NCAT-Nf and NCAT-β were sensitive to air
voids for critically aged samples. For tests with larger variabilities, such as TX-OT, and NCAT-
OT, the lack of statistical sensitivities can be attributed to the high test variability.
Table 6. 4 Summary of Air Voids Sensitivity Analysis for Plant Mixtures
Cracking test
parameters
Mean Value Analysis Statistical Analysis
PMLC-RH PMLC-CA PMLC-RH PMLC-CA
DCSEHMA - - N/A N/A
DCSEMin - - N/A N/A
ER + + N/A N/A
TX-Nf + + - -
TX-β + + - -
NCAT-Nf + + - +
NCAT-β + + - +
Jc + - N/A N/A
FI - - - -
CTIndex - - - -
As shown in Table 6.5, for laboratory mixtures, six cracking test parameters were
sensitive to air voids at both aging conditions based on mean value analysis, including ER, TX-
Nf, TX-β, NCAT-Nf, NCAT-β, and Jc. DCSEMin, FI and CTIndex were not sensitive to air voids at
either aging condition. DCSEHMA was only sensitive to air voids for critically aged samples.

162
However, no parameter was sensitive to air voids based on statistical analysis, which might be
caused by high test variability.
Table 6. 5 Summary of Air Voids Sensitivity Analysis for Laboratory Mixtures
Cracking test
parameters
Mean Value Analysis Statistical Analysis
LMLC-STOA LMLC-CA LMLC-STOA LMLC-CA
DCSEHMA - + N/A N/A
DCSEMin - - N/A N/A
ER + + N/A N/A
TX-Nf + + - -
TX-β + + - -
NCAT-Nf + + - -
NCAT-β + + - -
Jc + + N/A N/A
FI - - - -
CTIndex - - - -
6.3.3 Recycled Asphalt Materials Sensitivity
In general, high RAP contents and the addition of RAS reduce the strain tolerance of asphalt
mixtures, and, in most cases, reduce their cracking resistance (Huang et al., 2011; Mogawer et
al., 2012; West et al., 2016). Although the use of softer virgin binders and rejuvenators is
believed to help counteract the stiffening effects of aged recycled binders, volumetric properties
oftentimes are unable to provide a meaningful indication regarding the net effects of recycled
materials, virgin binders, and additives (Shen et al., 2007; West et al., 2016; Castro, 2017).
In this study, mixtures N1, N8, and S5, designed with different RAP and RAS contents,
provided an opportunity to assess the sensitivity of the cracking tests to these recycled materials.
Mixture N1 containing 20% RAP was set as the control mixture, mixture N8 contained 20%
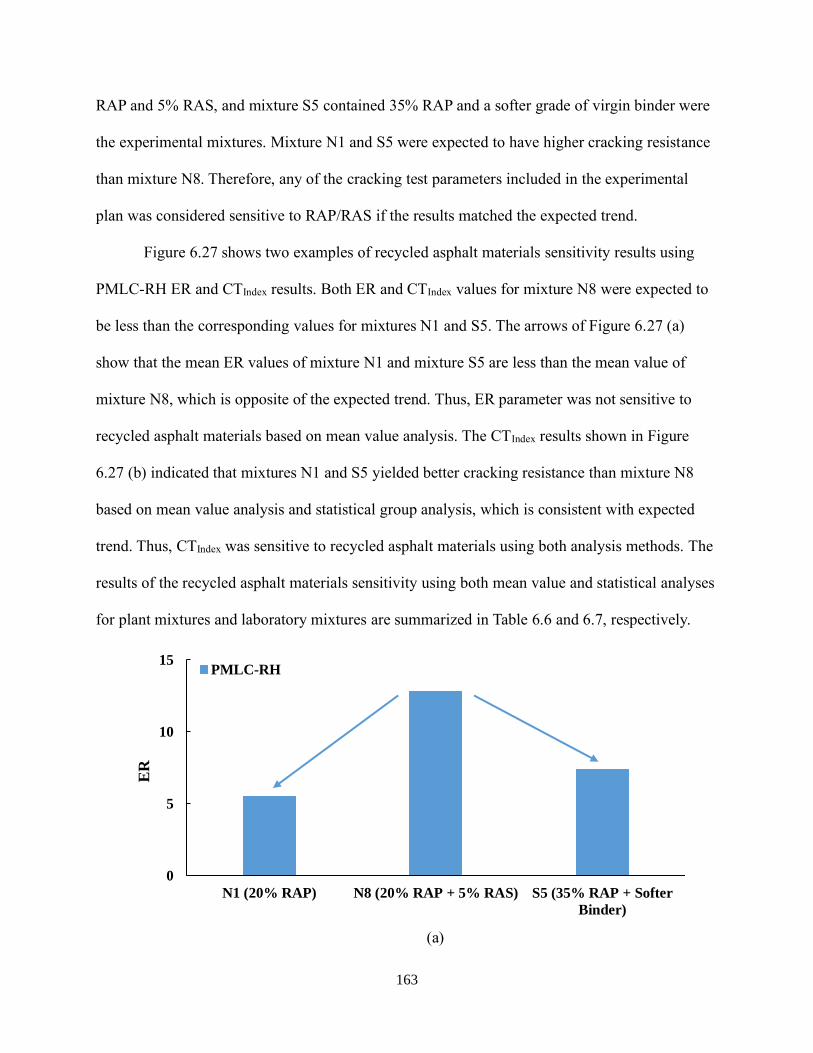
163
RAP and 5% RAS, and mixture S5 contained 35% RAP and a softer grade of virgin binder were
the experimental mixtures. Mixture N1 and S5 were expected to have higher cracking resistance
than mixture N8. Therefore, any of the cracking test parameters included in the experimental
plan was considered sensitive to RAP/RAS if the results matched the expected trend.
Figure 6.27 shows two examples of recycled asphalt materials sensitivity results using
PMLC-RH ER and CTIndex results. Both ER and CTIndex values for mixture N8 were expected to
be less than the corresponding values for mixtures N1 and S5. The arrows of Figure 6.27 (a)
show that the mean ER values of mixture N1 and mixture S5 are less than the mean value of
mixture N8, which is opposite of the expected trend. Thus, ER parameter was not sensitive to
recycled asphalt materials based on mean value analysis. The CTIndex results shown in Figure
6.27 (b) indicated that mixtures N1 and S5 yielded better cracking resistance than mixture N8
based on mean value analysis and statistical group analysis, which is consistent with expected
trend. Thus, CTIndex was sensitive to recycled asphalt materials using both analysis methods. The
results of the recycled asphalt materials sensitivity using both mean value and statistical analyses
for plant mixtures and laboratory mixtures are summarized in Table 6.6 and 6.7, respectively.
(a)
0
5
10
15
N1 (20% RAP) N8 (20% RAP + 5% RAS) S5 (35% RAP + Softer
Binder)
ER
PMLC-RH

164
(b)
Figure 6. 27 Examples of Recycled Asphalt Materials Sensitivity;
(a) ER Results, (b) CTIndex Results
As shown in Table 6.6, for plant mixtures, it can be seen that the following cracking test
parameters were sensitive to recycled asphalt materials at both aging conditions based on mean
value analysis: DCSEHMA, DCSEMin, TX-Nf, TX-β, NCAT-Nf, NCAT-β, FI, and CTIndex.
Furthermore, Jc only showed recycled asphalt materials sensitivity for critically aged samples,
and ER was not sensitive to recycled asphalt materials. Based on statistical analysis results, TX-
β, NCAT-β, FI, and CTIndex were sensitive to recycled asphalt materials at both aging conditions,
while TX-Nf was sensitive to recycled materials for critically aged samples only.
0
10
20
30
40
N1 (20% RAP) N8 (20% RAP + 5% RAS) S5 (35% RAP + Softer
Binder)
CT
In
dex
PMLC-RH
B
A
A

165
Table 6. 6 Summary of Recycled Asphalt Materials Sensitivity Analysis for Plant Mixtures
Cracking test
parameters
Mean Value Analysis Statistical Analysis
PMLC-RH PMLC-CA PMLC-RH PMLC-CA
DCSEHMA + + N/A N/A
DCSEMin + + N/A N/A
ER - - N/A N/A
TX-Nf + + - +
TX-β + + + +
NCAT-Nf + + - -
NCAT-β + + + +
Jc - + N/A N/A
FI + + + +
CTIndex + + + +
As shown in Table 6.7, for laboratory mixtures, all the parameters were sensitive to
recycled asphalt materials based on mean value analysis except for ER. ER was sensitive to
critically aged samples only. According to the statistical analysis results, NCAT-Nf, NCAT-β, FI,
and CTIndex were sensitive to recycled asphalt materials at both aging conditions, while TX-Nf
and TX-β was sensitive to STOA samples only.
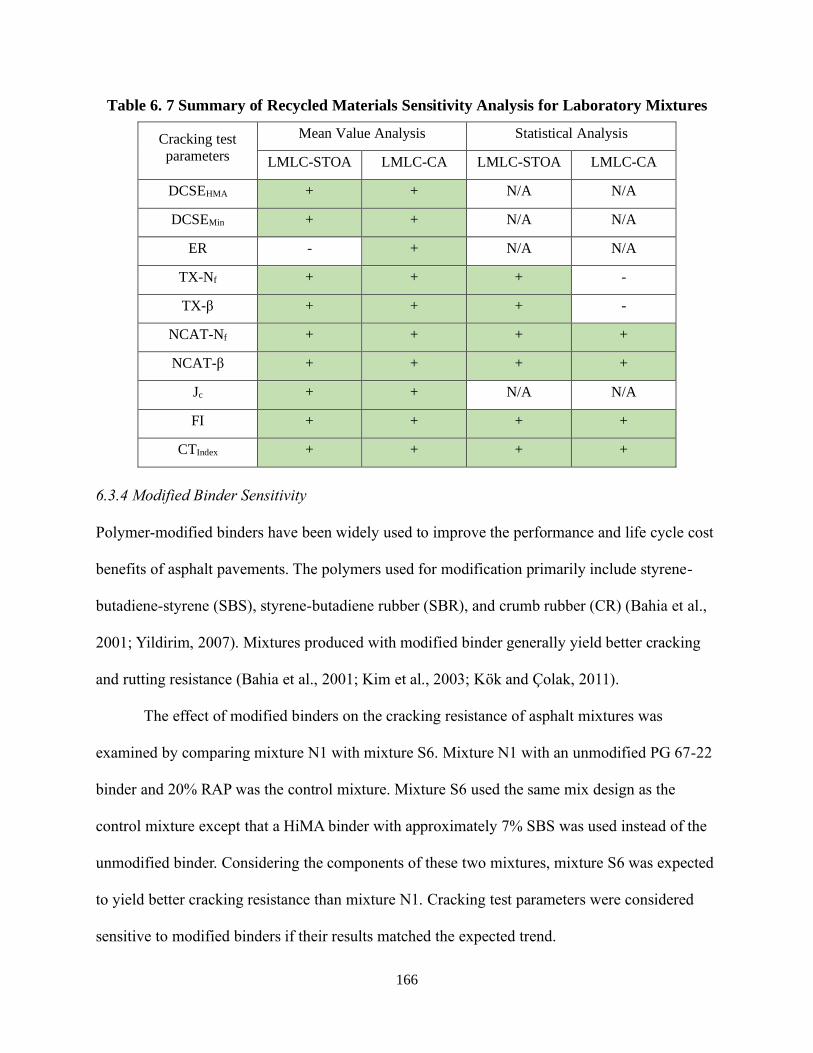
166
Table 6. 7 Summary of Recycled Materials Sensitivity Analysis for Laboratory Mixtures
Cracking test
parameters
Mean Value Analysis Statistical Analysis
LMLC-STOA LMLC-CA LMLC-STOA LMLC-CA
DCSEHMA + + N/A N/A
DCSEMin + + N/A N/A
ER - + N/A N/A
TX-Nf + + + -
TX-β + + + -
NCAT-Nf + + + +
NCAT-β + + + +
Jc + + N/A N/A
FI + + + +
CTIndex + + + +
6.3.4 Modified Binder Sensitivity
Polymer-modified binders have been widely used to improve the performance and life cycle cost
benefits of asphalt pavements. The polymers used for modification primarily include styrene-
butadiene-styrene (SBS), styrene-butadiene rubber (SBR), and crumb rubber (CR) (Bahia et al.,
2001; Yildirim, 2007). Mixtures produced with modified binder generally yield better cracking
and rutting resistance (Bahia et al., 2001; Kim et al., 2003; Kӧk and Çolak, 2011).
The effect of modified binders on the cracking resistance of asphalt mixtures was
examined by comparing mixture N1 with mixture S6. Mixture N1 with an unmodified PG 67-22
binder and 20% RAP was the control mixture. Mixture S6 used the same mix design as the
control mixture except that a HiMA binder with approximately 7% SBS was used instead of the
unmodified binder. Considering the components of these two mixtures, mixture S6 was expected
to yield better cracking resistance than mixture N1. Cracking test parameters were considered
sensitive to modified binders if their results matched the expected trend.
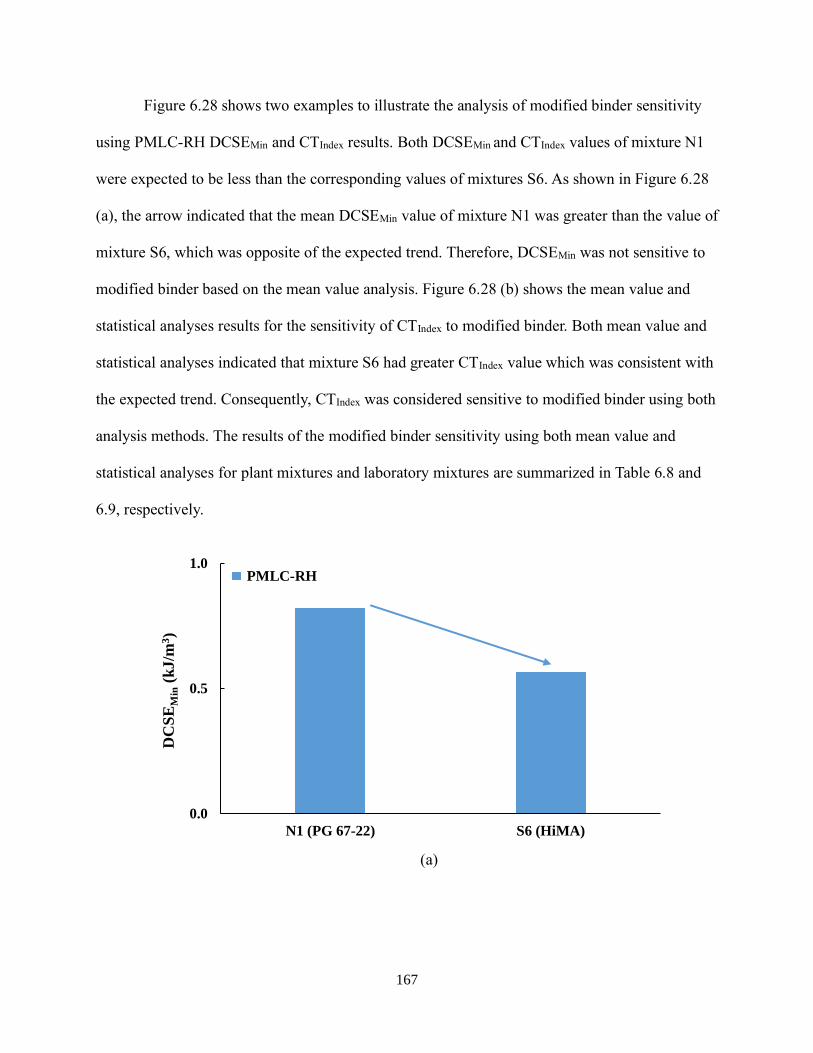
167
Figure 6.28 shows two examples to illustrate the analysis of modified binder sensitivity
using PMLC-RH DCSEMin and CTIndex results. Both DCSEMin and CTIndex values of mixture N1
were expected to be less than the corresponding values of mixtures S6. As shown in Figure 6.28
(a), the arrow indicated that the mean DCSEMin value of mixture N1 was greater than the value of
mixture S6, which was opposite of the expected trend. Therefore, DCSEMin was not sensitive to
modified binder based on the mean value analysis. Figure 6.28 (b) shows the mean value and
statistical analyses results for the sensitivity of CTIndex to modified binder. Both mean value and
statistical analyses indicated that mixture S6 had greater CTIndex value which was consistent with
the expected trend. Consequently, CTIndex was considered sensitive to modified binder using both
analysis methods. The results of the modified binder sensitivity using both mean value and
statistical analyses for plant mixtures and laboratory mixtures are summarized in Table 6.8 and
6.9, respectively.
(a)
0.0
0.5
1.0
N1 (PG 67-22) S6 (HiMA)
DC
SE
Min
(kJ/m
3)
PMLC-RH

168
(b)
Figure 6. 28 Examples of Modified Binder Sensitivity;
(a) DCSEMin Results, (b) CTIndex Results
As shown in Table 6.8, for plant mixtures, the mean value analysis results showed that
ER, DCSEHMA, NCAT-β, FI, and CTIndex were sensitive to polymer modification at both aging
conditions. DCSEMin, TX-Nf, TX-β, and NCAT-Nf were not sensitive to modified binders for
reheated samples, but they were sensitive to modified binders for critically aged samples. Jc was
sensitive to modified binders only for reheated samples. However, based on the statistical
analysis results, only FI and CTIndex were found sensitive to modified binders at both aging
conditions. All four of OT parameters were sensitive to modified binders for critically aged
samples.
0
10
20
30
40
N1 (PG 67-22) S6 (HiMA)
CT
Ind
ex
PMLC-RHA
B

169
Table 6. 8 Summary of Modified Binder Sensitivity Analysis for Plant Mixtures
Cracking test
parameters
Mean Value Analysis Statistical Analysis
PMLC-RH PMLC-CA PMLC-RH PMLC-CA
DCSEHMA + + N/A N/A
DCSEMin - + N/A N/A
ER + + N/A N/A
TX-Nf - + - +
TX-β - + - +
NCAT-Nf - + - +
NCAT-β + + - +
Jc + - N/A N/A
FI + + + +
CTIndex + + + +
As presented in Table 6.9, for laboratory mixtures, the mean value analysis showed that
most of the cracking test parameters were sensitive to modified binder at both aging conditions,
including DCSEHMA, DCSEMin, TX-Nf, TX-β, NCAT-Nf, NCAT-β, FI, and CTIndex. Furthermore,
ER was only sensitive to modified binder before critical aging, and Jc was not sensitive to
modified binder. Based on the statistical analysis, all the parameters of TX-OT, NCAT-OT, I-FIT,
and IDEAL-CT test were sensitive to modified binder at both aging conditions.

170
Table 6. 9 Summary of Modified Binder Sensitivity Analysis for Laboratory Mixtures
Cracking test
parameters
Mean Value Analysis Statistical Analysis
LMLC-STOA LMLC-CA LMLC-STOA LMLC-CA
DCSEHMA + + N/A N/A
DCSEMin + + N/A N/A
ER + - N/A N/A
TX-Nf + + + +
TX-β + + + +
NCAT-Nf + + + +
NCAT-β + + + +
Jc - - N/A N/A
FI + + + +
CTIndex + + + +
6.4 Correlations between Different Laboratory Cracking Tests
Pearson’s correlation coefficients (rp) were calculated using Minitab software to determine the
strength and direction of correlations among the ten cracking test parameters. Technically, rp can
range from -1.0 to + 1.0, and the negative and positive sign of rp indicates the direction of
correlation. The greater absolute value of rp indicates stronger correlation, and |rp | of 0.8 - 1.0
implies very strong correlation (Evans, 1996). Note that rp can only be used to evaluate linear
relationships or correlations, and the calculation of rp are based on the mean values.
Table 6.10 presents the summary of the rp values among ten cracking test parameters,
with |rp| values greater than 0.80 highlighted with shaded cells. As can be seen, the rp values
among NCAT-Nf, TX-Nf, FI, and CTIndex were greater than 0.80 except for the rp between TX-Nf
and NCAT-Nf, and FI. The rp between TX-Nf and NCAT-Nf was 0.76, which was reasonably
close to 0.80. However, the rp between TX-Nf and FI was 0.58, which was caused by the
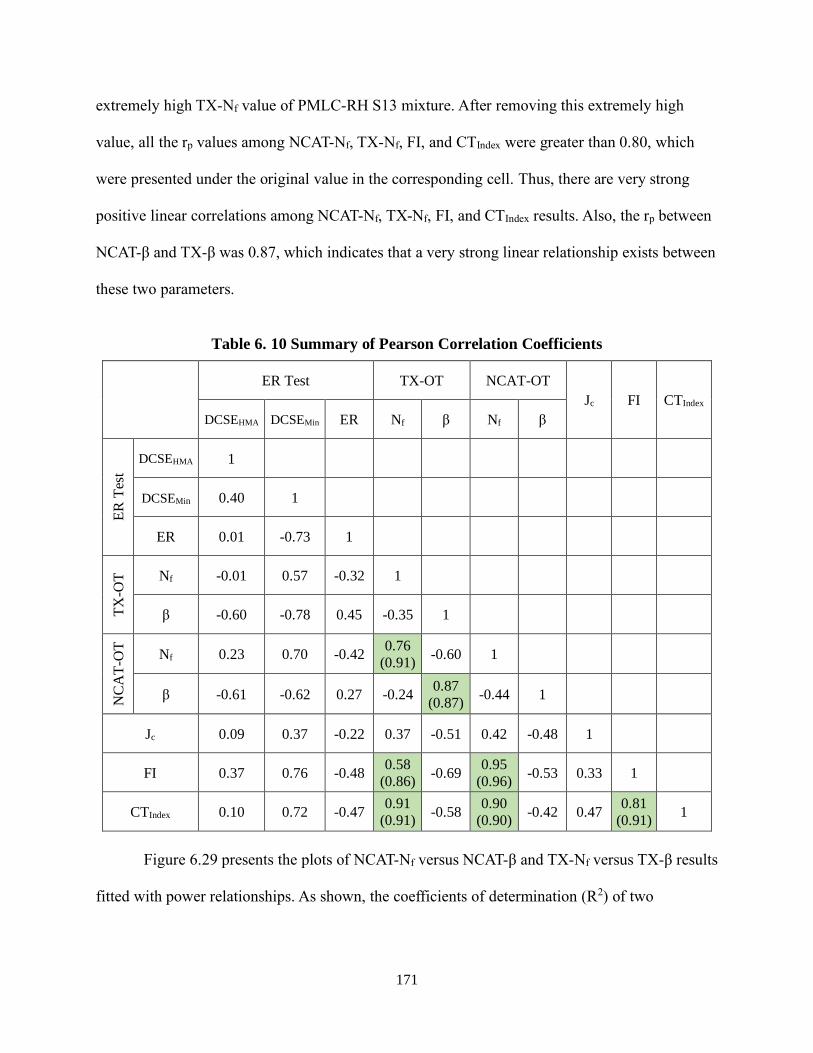
171
extremely high TX-Nf value of PMLC-RH S13 mixture. After removing this extremely high
value, all the rp values among NCAT-Nf, TX-Nf, FI, and CTIndex were greater than 0.80, which
were presented under the original value in the corresponding cell. Thus, there are very strong
positive linear correlations among NCAT-Nf, TX-Nf, FI, and CTIndex results. Also, the rp between
NCAT-β and TX-β was 0.87, which indicates that a very strong linear relationship exists between
these two parameters.
Table 6. 10 Summary of Pearson Correlation Coefficients
ER Test TX-OT NCAT-OT
Jc FI CTIndex
DCSEHMA DCSEMin ER Nf β Nf β
ER
Tes
t
DCSEHMA 1
DCSEMin 0.40 1
ER 0.01 -0.73 1
TX
-OT
Nf -0.01 0.57 -0.32 1
β -0.60 -0.78 0.45 -0.35 1
NC
AT
-OT
Nf 0.23 0.70 -0.42 0.76
(0.91) -0.60 1
β -0.61 -0.62 0.27 -0.24 0.87
(0.87) -0.44 1
Jc 0.09 0.37 -0.22 0.37 -0.51 0.42 -0.48 1
FI 0.37 0.76 -0.48 0.58
(0.86) -0.69
0.95
(0.96) -0.53 0.33 1
CTIndex 0.10 0.72 -0.47 0.91
(0.91) -0.58
0.90
(0.90) -0.42 0.47
0.81
(0.91) 1
Figure 6.29 presents the plots of NCAT-Nf versus NCAT-β and TX-Nf versus TX-β results
fitted with power relationships. As shown, the coefficients of determination (R2) of two

172
regression equations were 0.92, indicating very strong power relationships between the Nf and β
parameters for both TX-OT and NCAT-OT results.
(a)
(b)
Figure 6. 29 OT Nf versus β Correlations; (a) NCAT-OT Results, (b) TX-OT Results
NCAT-Nf = 1.7371(NCAT-β)-4.389
R² = 0.92
0
1000
2000
3000
4000
0 1 2
NC
AT
-Nf
NCAT-β
TX-Nf = 22.397(TX-β)-2.364
R² = 0.92
0
500
1000
1500
2000
0 1 2 3 4
TX
-Nf
TX-β
173
6.5 Summary
In this Chapter, the potential of six laboratory asphalt mixture cracking tests to identify TDC
susceptibilities of seven experimental mixtures was evaluated using plant mixtures and
laboratory mixtures at two aging conditions. The seven mixtures, designed to have a wide range
of cracking susceptibilities, were constructed as the surface layer on the NCAT Test Track. The
cracking test results were first used to conduct the comparison analysis between plant mixtures
and laboratory mixtures. Then, the cracking tests were also evaluated for sensitivity to laboratory
aging, air voids, recycled materials, and binder modification. Correlations among the results for
the six cracking tests were also examined. Based on these analyses, the following conclusions are
made:
(1) No significant differences were identified between PMLC-RH and LMLC-STOA
mixtures for DCSEMin, TX-β, NCAT-β, Jc and CTIndex. After critical aging, no statistical
difference was observed between plant mixtures and laboratory mixtures among all the cracking
test parameters. This indicates that it is possible to produce laboratory mixtures with similar
cracking resistance parameters to plant produced mixtures, especially if the mixtures are
laboratory aged to represent a critical amount of field aging.
(2) The sensitivity of six cracking tests to laboratory aging, air voids, recycled materials,
and binder modification were evaluated using both mean value and statistical analyses, which is
summarized as follows:
• The ER parameter was not sensitive aging and recycled asphalt materials for both
plant mixtures and laboratory mixtures. ER was sensitive to air voids and
modified binder for plant mixtures and laboratory mixtures at both aging
conditions except for the modified binder sensitivity of critically aged laboratory

174
mixtures. The intermediate parameter of the ER method, DCSEMin showed
sensitivity to aging, recycled asphalt materials, and modified binder for plant
mixtures and laboratory mixtures at both aging conditions except for the modified
binder sensitivity of reheated plant mixtures. However, DCSEMin was not
sensitive to air voids for both plant and laboratory mixtures. DCSEHMA was
sensitive to recycled asphalt materials and modified binder for the plant and
laboratory mixtures at both aging conditions, but it only showed sensitivity to
aging and air voids for laboratory mixtures.
• TX-Nf and TX-β were sensitive to aging for both plant mixtures and laboratory
mixtures. Based on mean value analysis, TX-Nf and TX-β were sensitive to air
voids, recycled asphalt materials, and modified binder for plant mixtures and
laboratory mixtures at both aging conditions except for the modified binder
sensitivity of reheated plant mixtures. According to the statistical analysis, TX-Nf
was not sensitive to air voids, and it only showed sensitivity to recycled materials
for critically aged plant mixtures and STOA laboratory mixtures. Meanwhile, TX-
Nf was sensitive to modified binder for plant mixtures and laboratory mixtures at
both aging conditions except for the reheated plant mixtures. TX-β was not
sensitive to air voids, but it was sensitive to recycled asphalt materials and
modified binder for plant mixtures and laboratory mixtures at both aging
conditions except for critically aged laboratory mixtures and reheated plant
mixtures, respectively.
• NCAT-Nf and NCAT-β were sensitive to aging for both plant mixtures and
laboratory mixtures. Based on mean value analysis, NCAT-Nf and NCAT-β were

175
sensitive to air voids, recycled asphalt materials, and modified binder for plant
mixtures and laboratory mixtures at both aging conditions except for the
sensitivity of NCAT-Nf to reheated plant mixtures. Based on statistical analysis,
NCAT-Nf and NCAT-β were only sensitive to air voids for critically aged plant
mixtures, and they were also sensitive to modified binder for plant mixtures and
laboratory mixtures at both aging conditions except for reheated plant mixtures.
Furthermore, NCAT-β was sensitive to recycled materials for both plant mixtures
and laboratory mixtures, but NCAT-Nf was only sensitive to recycled materials
for laboratory mixtures.
• Jc was not sensitive to aging for both plant mixtures and laboratory mixtures, and
it was also not sensitive to modified binder except for reheated plant mixtures.
Furthermore, Jc showed sensitivity to air voids and recycled asphalt materials for
plant mixtures and laboratory mixtures at both aging conditions except for
critically aged plant mixtures and reheated plant mixtures, respectively.
• FI and CTIndex were sensitive to aging for both plant mixtures and laboratory
mixtures. In addition, both mean value and statistical analyses indicated that FI
and CTIndex were sensitive to recycled asphalt materials and modified binder, but
they were not sensitive to air voids.
(3) Strong positive linear correlations exist among NCAT-Nf, TX-Nf, FI, and CTIndex
results. Meanwhile, there were strong power relationships between the Nf and β parameters for
both TX-OT and NCAT-OT results, and a strong linear relationship existed between TX-β and
NCAT-β.

176
CHAPTER 7 PRELIMINARY VALIDATION OF LABORATORY CRACKING TESTS
This chapter summarizes the preliminary field cracking performance of the seven test sections.
The six laboratory cracking tests were validated by establishing correlations between laboratory
test results and the preliminary field cracking performance.
7.1 Preliminary Field Cracking Performance
The seven test sections were monitored weekly during the trafficking cycle from September 2015
to November 2019. Cracks were traced using a vehicle equipped with a high-resolution camera
for pavement scanning. The recorded videos were used to detect and measure the cracking
percentage for each test section, and various severity and extent of cracks were observed for the
seven test sections after approximately 15 million ESALs and 52 months field aging of 73,728
CDD. Hairline cracks appeared on the surfaces of sections N1, N2, and N5 after approximately 9
million ESALs, and the cracking percentages of sections N1, N2, and N5 were 10.6%, 7.5%, and
9.3%, respectively, after approximately 15 million ESALs and 73,728 CDD. Section N2 yielded
the lowest cracking percentage among these three sections, which might be attributed to the
highest density of the surface layer. Section N8, the mixture containing 5% RAS, was the first
section to crack, with observable cracking beginning after approximately 7 million ESALs. In
December 2017, after 10 million ESALs of trafficking, field cores were cut from each of the
sections. The cores taken from section N8 confirmed that the entire surface of section N8 was
cracked, and the cores showed that the cracks had propagated to the bottom of surface layer, as
shown in Figure 7.1. Note that the cracks did not penetrate into the intermediate layer and there
were no signs of debonding between layers. Therefore, section N8 was confirmed as having
significant TDC. Furthermore, the cracks of section N8 continued developing with traffic and

177
environmental aging, and the cracking percentage of section N8 was 70.7% after approximately
15 million ESALs and 73,728 CDD.
Figure 7. 1 Cracks on Section N8 and Field Core
In November 2019, a small crack was observed in section S5, but the crack severity was
too low to be recognized by the high-resolution camera. Therefore, the cracking percentage of
section S5 was recorded as 0.0%. As of November 2019, no cracking was evident in sections S6
and S13. The cracking percentages of all seven sections were summarized in Table 7.1. In
general, sections N1, N2, N5, and N8 have exhibited significant cracking, with section N8
having by far the highest cracking percentage of 70.7%.
Table 7. 1 Preliminary Field Cracking Performance Summary
Experimental Section N1 N2 N5 N8 S5 S6 S13
Cracking Percentage (%) 10.6 7.5 9.9 70.7 0.0 0.0 0.0

178
7.2 Correlations between Field Cracking Performance and Laboratory Cracking Test
Results
In this section, the preliminary field cracking performance was utilized to correlate with the
laboratory cracking test results to help identify the best test for determining the TDC
susceptibility of asphalt mixtures for possible use in the mixture design and quality assurance.
Relationships between each cracking test parameter and field cracking performance were
evaluated through three approaches: 1) analysis of Pearson’s correlation coefficient; 2) whether
or not the cracking test parameter correctly identified mixture N8 as the most susceptible to
TDC; and 3) whether or not the cracking test parameter correctly differentiated uncracked
sections from cracked sections.
7.2.1 Analysis of Pearson’s Correlation Coefficient
Pearson’s correlation coefficient (rp) between each cracking test parameter and field cracking
performance was calculated for both plant mixtures and laboratory mixtures at both aging
conditions. As we mentioned previously, rp ranged from -1.0 to + 1.0, and a greater |rp| value
indicates a stronger linear correlation or relationship. In addition, |rp| of 0.8 - 1.0 implies very
strong correlation (Evans, 1996). Note that the calculation of rp is based on the mean values of
each cracking test parameter. Table 7.2 presents the summary of rp values between each cracking
test parameter and field cracking performance, with |rp| values greater than 0.80 highlighted with
shaded cells. As mentioned previously, for all cracking test parameters, greater value indicates
better cracking resistance except for parameters NCAT-β and TX-β, which means lower cracking
percentage. Thus, all the rp values should be negative except for the two β parameters.
As shown in Table 7.2, the rp values between ER and field cracking performance were
positive for PMLC-RH, PMLC-CA, and LMLC-STOA specimens, which was unexpected. Table
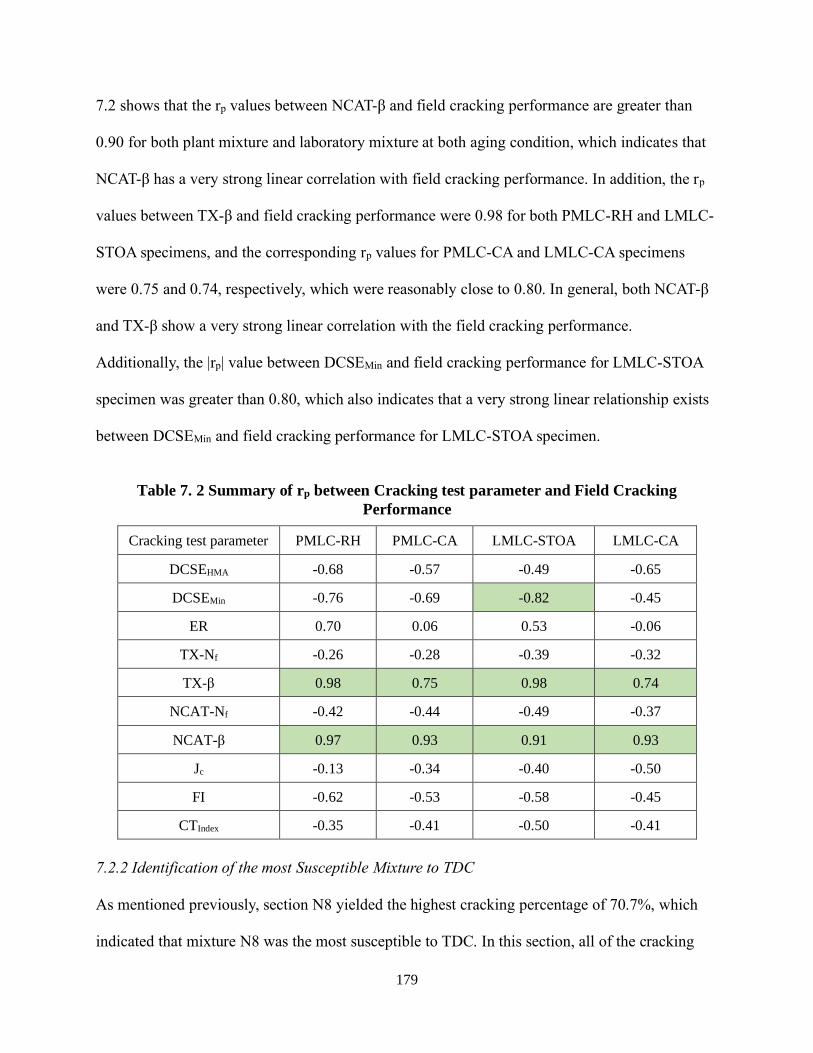
179
7.2 shows that the rp values between NCAT-β and field cracking performance are greater than
0.90 for both plant mixture and laboratory mixture at both aging condition, which indicates that
NCAT-β has a very strong linear correlation with field cracking performance. In addition, the rp
values between TX-β and field cracking performance were 0.98 for both PMLC-RH and LMLC-
STOA specimens, and the corresponding rp values for PMLC-CA and LMLC-CA specimens
were 0.75 and 0.74, respectively, which were reasonably close to 0.80. In general, both NCAT-β
and TX-β show a very strong linear correlation with the field cracking performance.
Additionally, the |rp| value between DCSEMin and field cracking performance for LMLC-STOA
specimen was greater than 0.80, which also indicates that a very strong linear relationship exists
between DCSEMin and field cracking performance for LMLC-STOA specimen.
Table 7. 2 Summary of rp between Cracking test parameter and Field Cracking
Performance
Cracking test parameter PMLC-RH PMLC-CA LMLC-STOA LMLC-CA
DCSEHMA -0.68 -0.57 -0.49 -0.65
DCSEMin -0.76 -0.69 -0.82 -0.45
ER 0.70 0.06 0.53 -0.06
TX-Nf -0.26 -0.28 -0.39 -0.32
TX-β 0.98 0.75 0.98 0.74
NCAT-Nf -0.42 -0.44 -0.49 -0.37
NCAT-β 0.97 0.93 0.91 0.93
Jc -0.13 -0.34 -0.40 -0.50
FI -0.62 -0.53 -0.58 -0.45
CTIndex -0.35 -0.41 -0.50 -0.41
7.2.2 Identification of the most Susceptible Mixture to TDC
As mentioned previously, section N8 yielded the highest cracking percentage of 70.7%, which
indicated that mixture N8 was the most susceptible to TDC. In this section, all of the cracking

180
test parameters were evaluated to determine if they could identify mixture N8 as the most
susceptible to TDC. Note that only the mean values of each cracking test parameter were used.
Table 7.3 summarizes the validation results for plant mixtures and laboratory mixtures at both
aging conditions. A “+” indicates that the parameter identified mixture N8 as the most
susceptible to TDC; a “-” indicates that the parameter did not identify mixture N8 as the most
susceptible to TDC.
As shown in Table 7.3, the following parameters correctly identified mixture N8 as the
most susceptible to TDC for both plant mixtures and laboratory mixtures at both aging
conditions: DCSEMin, TX-Nf, TX-β, NCAT-Nf, NCAT-β, FI, and CTIndex. DCSEHMA identified
mixture N8 as the most susceptible to TDC for PMLC-RH, PMLC-CA, and LMLC-CA
specimens, and Jc only identified mixture N8 as the most susceptible to TDC for laboratory
mixture at both aging conditions. ER did not identify mixture N8 as the most susceptible to TDC.
Table 7. 3 Identification Results of the Most Susceptible Mixture to TDC
Cracking test parameter PMLC-RH PMLC-CA LMLC-STOA LMLC-CA
DCSEHMA + + - +
DCSEMin + + + +
ER - - - -
TX-Nf + + + +
TX-β + + + +
NCAT-Nf + + + +
NCAT-β + + + +
Jc - - + +
FI + + + +
CTIndex + + + +

181
7.2.3 Discrimination between Cracked Sections and Uncracked Sections
Based on the preliminary field cracking performance, the seven experimental sections were
grouped into two categories: 1) cracked sections, including N1, N2, N5, and N8; 2) uncracked
sections, including S5, S6 and S13. In this section, all the cracking test parameters were
evaluated to determine if they could discriminate uncracked sections from cracked sections.
Figure 7.2 shows an example of the evaluation using LMLC-STOA CTIndex results. As presented
in Figure 7.2, the CTIndex values of mixtures S5, S6 and S13 were greater than the corresponding
CTIndex values of the remaining five mixtures, which indicated CTIndex was able to differentiate
uncracked sections from cracked sections for LMLC-STOA specimens. Note that only the mean
values of each cracking test parameter were used in this section.
Figure 7. 2 Example of Discrimination between Cracked and Uncracked Sections
Table 7.4 summarizes the discrimination evaluations for plant mixtures and laboratory
mixtures at both aging conditions. A “+” indicates that the parameter differentiated uncracked
sections from cracked sections; a “-” indicates that the parameter did not differentiate uncracked
sections from cracked sections. As shown in Table 7.4, FI and CTIndex were able to discriminate
N1 N2 N5 N8 S5 S6 S13
LMLC-STOA 30.2 13.9 33.2 10.9 41.6 80.8 133.1
0
50
100
150
200
CT
Ind
ex
UncrackedCracked
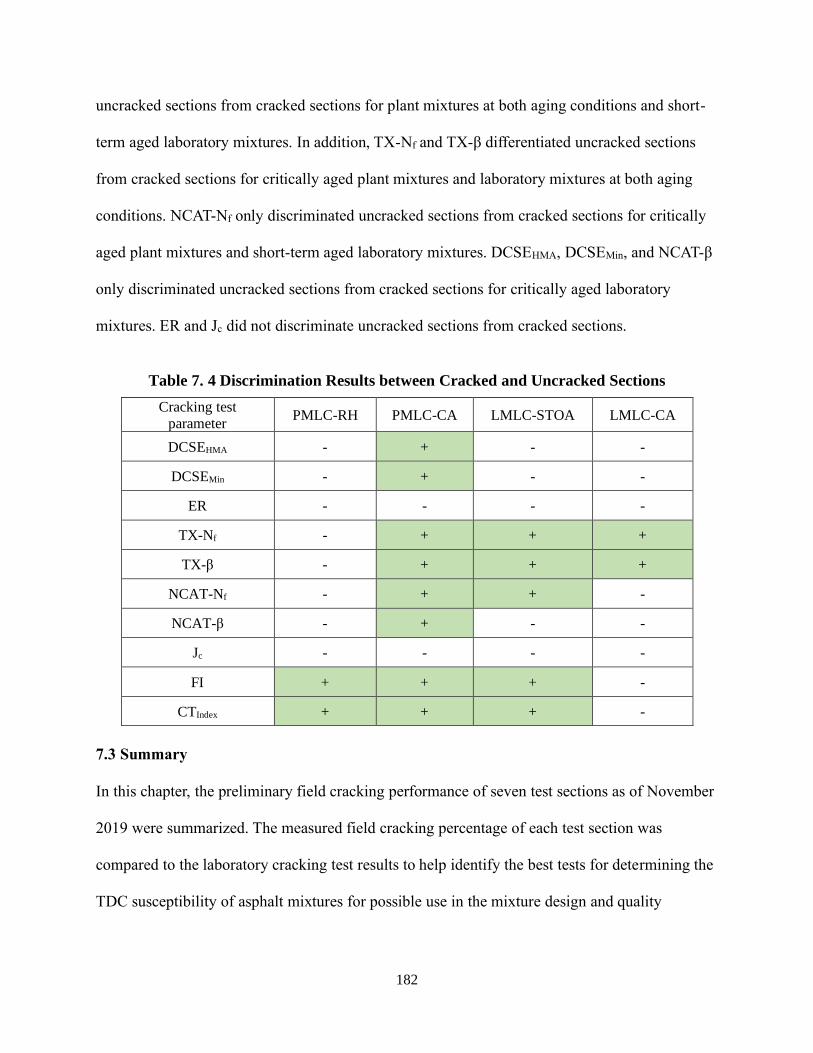
182
uncracked sections from cracked sections for plant mixtures at both aging conditions and short-
term aged laboratory mixtures. In addition, TX-Nf and TX-β differentiated uncracked sections
from cracked sections for critically aged plant mixtures and laboratory mixtures at both aging
conditions. NCAT-Nf only discriminated uncracked sections from cracked sections for critically
aged plant mixtures and short-term aged laboratory mixtures. DCSEHMA, DCSEMin, and NCAT-β
only discriminated uncracked sections from cracked sections for critically aged laboratory
mixtures. ER and Jc did not discriminate uncracked sections from cracked sections.
Table 7. 4 Discrimination Results between Cracked and Uncracked Sections
Cracking test parameter
PMLC-RH PMLC-CA LMLC-STOA LMLC-CA
DCSEHMA - + - -
DCSEMin - + - -
ER - - - -
TX-Nf - + + +
TX-β - + + +
NCAT-Nf - + + -
NCAT-β - + - -
Jc - - - -
FI + + + -
CTIndex + + + -
7.3 Summary
In this chapter, the preliminary field cracking performance of seven test sections as of November
2019 were summarized. The measured field cracking percentage of each test section was
compared to the laboratory cracking test results to help identify the best tests for determining the
TDC susceptibility of asphalt mixtures for possible use in the mixture design and quality

183
assurance. Based on the comparisons of lab test results and measured field cracking
performance, the following conclusions were obtained:
(1) Sections N1, N2, N5, and N8 exhibited a range of cracking severity and extent after
approximately 15 million ESALs and 73,728 CDD. The section N8 with 5% RAS had the
highest cracking percentage of 70.7%. No measurable cracks were found in sections S5, S6 and
S13.
(2) Based on the rp results, NCAT-β and TX-β showed a very strong linear correlation
with the preliminary cracking performance for both plant mixtures and laboratory mixtures at
both aging conditions. There was also a very strong linear relationship between DCSEMin and
field cracking performance for LMLC-STOA specimens.
(3) DCSEMin, TX-Nf, TX-β, NCAT-Nf, NCAT-β, FI, and CTIndex correctly identified
mixture N8 as the most susceptible to TDC for both plant mixtures and laboratory mixtures at
both aging conditions. DCSEHMA identified mixture N8 as the most susceptible to TDC for
PMLC-RH, PMLC-CA, and LMLC-CA specimens. Jc only identified mixture N8 as the most
susceptible to TDC for laboratory mixtures at both aging conditions. ER did not identify mixture
N8 as the most susceptible to TDC.
(4) FI and CTIndex were able to discriminate uncracked sections from cracked sections for
short-term aged laboratory mixtures and plant mixtures at both aging conditions. TX-Nf and TX-
β differentiated uncracked sections from cracked sections for critically aged plant mixtures and
laboratory mixtures at both aging conditions. NCAT-Nf only discriminated uncracked sections
from cracked sections for critically aged plant mixtures and short-term aged laboratory mixtures.
DCSEHMA, DCSEMin, and NCAT-β only discriminated uncracked sections from cracked sections

184
for critically aged laboratory mixtures. ER and Jc did not discriminate uncracked sections from
cracked sections.

185
CHAPTER 8 CONCLUSIONS AND RECOMMENDATIONS
This study focused on two aspects about TDC: 1) determining a critical aging protocol to
condition asphalt mixtures for laboratory cracking tests, and 2) evaluating the ability of
laboratory cracking tests to identify mixtures susceptible to TDC. The conclusions and
recommendations for each aspect were summarized in this chapter.
8.1 Determination of a Critical Aging Protocol
The critical field aging condition for evaluating TDC was first examined from a literature review.
An experiment was then conducted using four loose mixture aging protocols on materials from
five field projects in the USA. Two candidate CA protocols were proposed based on the binder
test results, and the key findings and conclusions of this part are summarized as follows:
• 70,000 CDD was identified as the critical field aging condition for evaluating TDC.
• The 24-hour, 135°C protocol yielded the greatest aging level, followed by the 12-hour,
135°C protocol, the 5-day, 95°C, protocol, and the 6-hour, 135°C protocol, respectively.
• No significant difference in the oxidation-hardening relationship was evident for mixtures
aged at 95°C versus 135°C.
• The 5-day, 95°C protocol was most representative of 70,000 CDD of field aging, and 8-
hour, 135°C protocol was estimated to yield an equivalent aging level as 5-day, 95°C
protocol.
Two candidate CA protocols of loose mixture aging for 5 days at 95°C and 8 hours at
135°C 5-day were further validated using four NCAT TDC experimental mixtures. The
correlations between two candidate CA protocols and field aging were evaluated using mixture

186
and binder tests. Based on the analysis results, following key findings and conclusions were
obtained:
• The two candidate CA protocols had a significant impact on reducing the fatigue and
cracking resistance of asphalt binder and mixture.
• No significant difference was observed between two CA protocols based on I-FIT test
results. The 8-hour, 135°C protocol yielded more aging than the 5-day, 95°C protocol
based on IDEAL-CT test results, the G-R parameter, LAS test results, and the ΔTc
parameter, but the opposite trend was observed for small-specimen AMPT cyclic fatigue
test results.
• The test results of post-construction field cores generally showed an expected trend of
increased stiffness and reduced cracking resistance with field aging.
• Most of the asphalt binder and mixture properties indicated that the two candidate CA
protocols yielded more severe aging than 4 years field aging in Alabama.
8.2 Preliminary Evaluation of Laboratory Cracking Tests
Six laboratory cracking tests were evaluated for their ability to identify mixtures susceptible to
TDC using seven mixtures with a wide range of characteristics including air voids, binder type,
and recycled materials. Both plant-produced and laboratory prepared mixtures at both aging
conditions were tested in this part. The key findings and conclusions from this evaluation are
summarized as followed:
• No significant differences were identified between plant mixtures and the corresponding
laboratory mixtures after critical aging for all the cracking test parameters.
187
• All the cracking test parameters of I-FIT, IDEAL-CT, and both OT tests are sensitive to
aging for both plant mixtures and laboratory mixtures. However, ER and Jc are not
sensitive to aging for both plant mixtures and laboratory mixtures.
• No cracking test parameter is statistically sensitive to all influence factors. Based on
mean value analysis, only NCAT-β is sensitive to all of the influence factors for plant
mixtures at both aging conditions. Meanwhile, the cracking test parameters of both OT
tests are sensitive to all the influence factors for laboratory mixtures.
• FI and CTIndex are sensitive to recycled asphalt materials and modified binder for both
plant mixtures and laboratory mixtures at both aging conditions.
• Strong positive linear correlations exist among NCAT-Nf, TX-Nf, FI, and CTIndex results.
Meanwhile, there are strong power relationships between the Nf and β parameters for
both OT tests.
The preliminary field cracking performance of seven test sections were compared to the
laboratory cracking test results. The following conclusions were obtained:
• Sections N1, N2, N5, and N8 exhibited a range of cracking severity and extent after
approximately 15 million ESALs and 73,728 CDD. Section N8 with 5% RAS had the
highest cracking percentage of 70.7% of the lane area. No measurable cracks were found
in sections S5, S6 or S13.
• Based on the rp results, NCAT-β and TX-β showed a very strong linear correlation with
the field cracking performance for both plant mixtures and laboratory mixtures at both
aging conditions.

188
• DCSEMin, TX-Nf, TX-β, NCAT-Nf, NCAT-β, FI, and CTIndex correctly identified mixture
N8 as the most susceptible to TDC for both plant mixtures and laboratory mixtures at
both aging conditions. ER did not identify mixture N8 as the most susceptible to TDC.
• No cracking test parameter was able to discriminate uncracked section from cracked
sections for plant mixtures and laboratory mixtures at both aging conditions. ER and Jc
did not discriminate uncracked sections from cracked sections.
8.3 Recommendations for Future Research
This study determined a critical aging protocol for TDC evaluation, and six laboratory cracking
tests were evaluated regarding their suitability to identify susceptible mixtures to TDC. The
recommendations for the future research regarding critical aging and validation of cracking tests
were summarized as follows:
• The preliminary critical field aging condition of 70,000 CDD was identified based on the
pavement distress survey results of NCHRP 09-49A. More field TDC data should be
further collected and analyzed to validate this critical field aging condition.
• According to the FT-IR CA and G-R parameter results, no significant difference in the
oxidation-hardening relationship was observed for mixtures aged at 95°C and 135°C.
However, this conclusion was obtained based on the results of five mixtures and one
95°C protocol, which needs to be further validated using more mixtures and 95°C
protocols.
• Based on the laboratory cracking test results, both FI and CTIndex are not sensitive to air
voids. Thus, the equations used to calculate these two parameters might need to be
corrected or reformed.

189
• The preliminary aging validation results indicated that two candidate CA protocols
yielded a more severe aging level than 4 years field aging in Alabama. Therefore,
additional field aging data is needed to help determine the representative CDD of the two
candidate CA protocols. The seven experimental sections on the NCAT Test Track will
remain in place for additional trafficking and environmental aging through the fall of
2020. This ongoing work will help further validate the aging protocol and identify the
best test for determining the TDC susceptibility of asphalt mixtures for possible use in
mix design and quality assurance.

190
REFERENCES
Airey, G. D. (2003). State of the art report on ageing test methods for bituminous pavement
materials. International Journal of Pavement Engineering, 4(3), 165-176.
Al-Qadi, I. L., Lippert, D. L., Wu, S., Ozer, H., Renshaw, G., Murphy, T. R., Butt, A.
Gundapuneni, S., Trepanier, J. S., Vespa, J. W., Said, I. M., Espinoza L., Arturo F., and Safi, F.
R. (2017). Utilizing Lab Tests to Predict Asphalt Concrete Overlay Performance. Illinois Center
for Transportation/Illinois Department of Transportation.
Al-Qadi, I. L., Ozer, H., & Lambros, J (2019). Development of the Illinois Flexibility Index
Test. Asphalt Mixtures, 31.
Anderson, R. M., King, G. N., Hanson, D. I., & Blankenship, P. B. (2011). Evaluation of the
relationship between asphalt binder properties and non-load related cracking. Journal of the
Association of Asphalt Paving Technologists, 80.
Arabani, M., & Ferdowsi, B. (2009). Evaluating the Semi-Circular Bending Test for HMA
Mixtures, IJE Transactions A: Basics, Vol. 22, pp. 47-58.
Arega, Z. A., Bhasin, A., & De Kesel, T. (2013). Influence of extended aging on the properties
of asphalt composites produced using hot and warm mix methods. Construction and Building
Materials, 44, 168-174.
Bahia, H. U., Hanson, D. I., Zeng, M., Zhai, H., Khatri, M. A., and Anderson, R. M. (2001).
Characterization of modified asphalt binders in Superpave mix design, NCHRP Report 459,
Transportation Research Board.
Baladi, G. Y., Schorsch, M., & Svasdisant, T. (2003). Determining the causes of top-down
cracks in bituminous pavements (No. RC-1440).
Barber, E., Al-Qadi, I. L., Giustozzi, F., & Ozer, H. (2018). Development of Machine
Compliance Factor for the Illinois Flexibility Index Test (I-FIT), Annual Meeting of the
Transportation Research Board, (No. 18-04786).
Barry, M. K. (2016). An analysis of impact factors on the Illinois flexibility index test (Doctoral
dissertation).
Batioja-Alvarez, D., Lee, J., & Haddock, J. E. (2019). Understanding the Illinois Flexibility
Index Test (I-FIT) using Indiana Asphalt Mixtures. Transportation Research Record,
0361198119841282.
Bell, C. A., AbWahab, Y., Cristi, M. E., and Sosnovske, D. (1994a). Selection of laboratory
aging procedures for asphalt-aggregate mixtures, SHRP-A-383, Strategic Highway Research
Program.

191
Bell, C. A., Sosnovske, D., & Wieder, J. A. (1994b). Aging: binder validation (No. SHRP-A-
384). Washington, DC: Strategic Highway Research Program, National Research Council.
Bennert, T., & Maher, A. (2008). Field and laboratory evaluation of a reflective crack interlayer
in New Jersey. Transportation Research Record, 2084(1), 114-123.
Bennert, T., Haas, E., & Wass, E. (2018). Indirect tensile test (IDT) to determine asphalt mixture
performance indicators during quality control testing in New Jersey. Transportation Research
Record, 2672(28), 394-403.
Bowers, B. F., Diefenderfer, B. K., Wollenhaupt, G., Stanton, B., & Boz, I. (2019). Laboratory
Properties of a Rejuvenated Cold Recycled Mixture Produced in a Conventional Asphalt Plant.
In Airfield and Highway Pavements 2019: Testing and Characterization of Pavement
Materials (pp. 100-108). Reston, VA: American Society of Civil Engineers.
Braham, A. F., Buttlar, W. G., Clyne, T. R., Marasteanu, M. O., & Turos, M. I. (2009). The
effect of long-term laboratory aging on asphalt concrete fracture energy. Journal of the
Association of Asphalt Paving Technologists, 78.
Brown, S., & Scholz, T. V. (2000). Development of laboratory protocols for the ageing of
asphalt mixtures. In Eurasphalt and Eurobitume Congress, 2nd, 2000, Barcelona, Spain.
Cao, W., Mohammad, L. N., Barghabany, P., & Cooper, S. B. (2019). Relationship between
laboratory and full-scale fatigue performance of asphalt mixtures containing recycled
materials. Materials and Structures, 52(1), 26.
Cao, W., Mohammad, L. N., Elseifi, M., Cooper III, S. B., & Saadeh, S. (2018). Fatigue
Performance Prediction of Asphalt Pavement Based on Semicircular Bending Test at
Intermediate Temperature. Journal of Materials in Civil Engineering, 30(9), 04018219.
Castro, A., Evaluation of a Surface Mixture with Delta-S Rejuvenator on NCAT Pavement Test
Track, Master Thesis, Auburn University, Auburn, United States, 2017.
Chen, C., Yin, F., Turner, P., West, R. C., & Tran, N. (2018). Selecting a Laboratory Loose Mix
Aging Protocol for the NCAT Top-Down Cracking Experiment. Transportation Research
Record, 2672(28), 359-371.
Chen, J. S., Wang, T. J., & Lee, C. T. (2018). Evaluation of a highly-modified asphalt binder for
field performance. Construction and Building Materials, 171, 539-545.
Chen, X., & Solaimanian, M. (2019). Effect of Test Temperature and Displacement Rate on
Semicircular Bend Test. Journal of Materials in Civil Engineering, 31(7), 04019104.
Chitragar, S. F., & Singh, D. (2016). Evaluation of Fracture Resistance of Asphalt Mixes
Containing Recycled Asphalt Pavement Using SCB Test. Indian Highways, 44(1).
Chong, K. P., and Kuruppu, M. D. (1988). New Specimens for Mixed Mode Fracture
Investigations of Geomaterials, Engineering Fracture Mechanics, Vol. 30, pp. 701-712.
192
Cotterell, B., & Reddel, J. K. (1977). The essential work of plane stress ductile
fracture. International journal of fracture, 13(3), 267-277.
Dauzats, M., & Rampal, A. (1987). Mechanism of surface cracking in wearing courses. In
International Conference on the Structural Design.
Dauzats, M., and Linder. R. (1982). A method for the evaluation of the structural condition of
pavements with thick bituminous road bases." In Fifth international conference on the structural
design of asphalt pavements.
De Freitas, E. F., Pereira, P., Picado–Santos, L., & Papagiannakis, A. T. (2005). Effect of
construction quality, temperature, and rutting on initiation of top-down cracking. Transportation
research record, 1929(1), 174-182.
De La Roche, C., Van de Ven, M., Gabet, T., Dubois, V., Grenfell, J., & Porot, L. (2009, May).
Development of a laboratory bituminous mixtures ageing protocol.
Devore, J., & Farnum, N. (2005). Applied Statistics for Engineers and Scientists (2nd Edition),
Belmont, CA: Thomson Brooks/Cole.
Diefenderfer, B. K., Boz, I., & Bowers, B. F. (2019). Evaluating Cracking Tests for
Performance-Based Design Concept for Cold Recycled Mixtures. In Airfield and Highway
Pavements 2019: Design, Construction, Condition Evaluation, and Management of
Pavements (pp. 220-229). Reston, VA: American Society of Civil Engineers.
Diefenderfer, S. D., & Bowers, B. F. (2019). Initial Approach to Performance (Balanced) Mix
Design: The Virginia Experience. Transportation Research Record, 2673(2), 335-345.
Domke, C., Davison, R., & Glover, C. (1999). Effect of oxidation pressure on asphalt hardening
susceptibility. Transportation Research Record: Journal of the Transportation Research Board,
(1661), 114-121.
Dong, W., & Charmot, S. (2018). Proposed tests for cold recycling balanced mixture design with
measured impact of varying emulsion and cement contents. Journal of Materials in Civil
Engineering, 31(2), 04018387.
Elseifi, M. A., Mohammad, L. N., Ying, H., & Cooper III, S. (2012). Modeling and evaluation of
the cracking resistance of asphalt mixtures using the semi-circular bending test at intermediate
temperatures. Road Materials and Pavement Design, 13(sup1), 124-139.
Elwardany, M. D., Yousefi Rad, F., Castorena, C., & Kim, Y. R. (2017). Evaluation of asphalt
mixture laboratory long-term ageing methods for performance testing and prediction. Road
Materials and Pavement Design, 18(sup1), 28-61.
Espinoza-Luque, A. F., Al-Qadi, I. L., & Ozer, H. (2018). Optimizing rejuvenator content in
asphalt concrete to enhance its durability. Construction and Building Materials, 179, 642-648.
193
Estakhri, C. K., Cao, R., Alvarez-Lugo, A., & Button, J. W. (2009). Production, placement, and
performance evaluation of warm mix asphalt in texas. In Material Design, Construction,
Maintenance, and Testing of Pavements: Selected Papers from the 2009 GeoHunan
International Conference (pp. 1-8).
Etheridge, R. A., Wang, Y. D., Kim, S. S., & Kim, Y. R. (2019). Evaluation of Fatigue Cracking
Resistance of Asphalt Mixtures Using Apparent Damage Capacity. Journal of Materials in Civil
Engineering, 31(11), 04019257.
Evans, J. D. (1996). Straightforward statistics for the behavioral sciences, Brooks/Cole.
Fisher, J., Graves, C., Blankenship, P., Hakimzadeh-Khoee, S., and Anderson, R. M. (2010).
Factors affecting asphalt pavement density and the effect on long term pavement performance,
KTC Report 10-05, Kentucky Transportation Center.
Freitas, E., P. Pereira, and L. Picado-Santos. (2003). Assessment of top-down cracking causes in
asphalt pavements. In 3rd International Symposium on Maintenance and Rehabilitation of
Pavements and Technological Control, Guimarães, Portugal, pp. 555-564.
Garcia, V. M., & Miramontes, A. (2015). Understanding sources of variability of overlay test
procedure. Transportation Research Record, 2507(1), 10-18.
Garcia, V. M., Miramontes, A., Garibay, J., Abdallah, I., Carrasco, G., Lee, R., & Nazarian, S.
(2017). Alternative methodology for assessing cracking resistance of hot mix asphalt mixtures
with overlay tester. Road Materials and Pavement Design, 18(sup4), 388-404.
Gerritsen, A. H., van Gurp, C. P., van der Heidi, J. J., Molenaar, A. A., and Pronk, A. C. (1987).
Prediction and prevention of surface cracking in asphaltic pavements, Sixth International
Conference on Structural Design of Asphalt Pavements, Vol. 1, pp. 378-391.
Glover, C. J., Davison, R. R., Domke, C. H., Ruan, Y., Juristyarini, P., Knorr, D. B., & Jung, S.
H. (2005). Development of a new method for assessing asphalt binder durability with field
validation. Texas Dept Transport, 1872.
Gu, F., Luo, X., West, R. C., Taylor, A. J., & Moore, N. D. (2018). Energy-based crack initiation
model for load-related top-down cracking in asphalt pavement. Construction and Building
Materials, 159, 587-597.
Gu, F., Zhang, Y., Luo, X., Luo, R., & Lytton, R. L. (2015). Improved methodology to evaluate
fracture properties of warm-mix asphalt using overlay test. Transportation Research
Record, 2506(1), 8-18.
Harigan, E. T., Leahy, R. B., & Youtcheff, J. S. (1994). The Superpave mix design system
manual of specifications, test methods, and practices. Strategic Highway Research Program,
SHRP-A-379, National Research Council, Washington DC.
Harmelink, D., & Aschenbrener, T. (2003). Extent of top-down cracking in Colorado (No.
CDOT-DTD-R-2003-7).

194
Harvey, J. T., & Tsai, B. W. (1996). Effects of asphalt content and air void content on mix
fatigue and stiffness. Transportation Research Record, 1543(1), 38-45.
Haslett, K. E. (2018). Evaluation of Cracking Indices for Asphalt Mixtures Using SCB Tests at
Different Temperatures and Loading Rates.
Houston, W. N., Mirza, M. W., Zapata, C. E., & Raghavendra, S. (2007). Simulating the effects
of hot mix asphalt aging for performance testing and pavement structural design. NCHR
Research Results Digest, 324.
Houston, W. N., Mirza, M. W., Zapata, C. E., & Raghavendra, S. (2005). Environmental effects
in pavement mix and structural design systems. NCHRP, Project, 9-23.
Howard, I. L., & Doyle, J. D. (2015). Durability Indexes via Cantabro Testing for Unaged,
Laboratory-Conditioned, and One-Year Outdoor-Aged Asphalt Concrete. In Transportation
Research Board 94th Annual Meeting (No. 15-1366).
Huang, B., Shu, X., & Vukosavljevic, D. (2011). Laboratory investigation of cracking resistance
of hot-mix asphalt field mixtures containing screened reclaimed asphalt pavement. Journal of
Materials in Civil Engineering, 23(11), 1535-1543.
Huang, L., Cao, K., & Zeng, M. (2009). Evaluation of semicircular bending test for determining
tensile strength and stiffness modulus of asphalt mixtures. Journal of Testing and
Evaluation, 37(2), 122-128.
Hugo, F., and Kennedy, T. W. (1985). Surface cracking of asphalt mixtures in southern Africa,
Journal of the Association of Asphalt Paving Technologists, Vol. 54, pp. 454-501.
Im, S., & Zhou, F. (2017). New and Simpler Cracking Test Method for Asphalt Mix
Designs. Transportation Research Record, 2631(1), 1-10.
Im, S., Karki, P., & Zhou, F. (2016). Development of new mix design method for asphalt
mixtures containing RAP and rejuvenators. Construction and Building Materials, 115, 727-734.
Im, S., Zhou, F., Lee, R., & Scullion, T. (2014). Impacts of rejuvenators on performance and
engineering properties of asphalt mixtures containing recycled materials. Construction and
Building Materials, 53, 596-603.
Islam, M. R., Hossain, M. I., & Tarefder, R. A. (2015). A study of asphalt aging using Indirect
Tensile Strength test. Construction and Building Materials, 95, 218-223.
Jahanbakhsh, H., Hosseini, P., Nejad, F. M., & Habibi, M. (2019). Intermediate temperature
fracture resistance evaluation of cement emulsified asphalt mortar. Construction and Building
Materials, 197, 1-11.
Jin, X., Han, R., Cui, Y., & Glover, C. J. (2011). Fast-rate–constant-rate oxidation kinetics model
for asphalt binders. Industrial & Engineering Chemistry Research, 50(23), 13373-13379.

195
Kaseer, F., Yin, F., Arámbula-Mercado, E., Martin, A. E., Daniel, J. S., & Salari, S. (2018).
Development of an index to evaluate the cracking potential of asphalt mixtures using the semi-
circular bending test. Construction and Building Materials, 167, 286-298.
Kassem, E., Masad, E., Lytton, R., & Chowdhury, A. (2011). Influence of air voids on
mechanical properties of asphalt mixtures. Road Materials and Pavement Design, 12(3), 493-
524.
Kim, B., Roque, R., & Birgisson, B. (2003). Effect of styrene butadiene styrene modifier on
cracking resistance of asphalt mixture. Transportation research record, 1829(1), 8-15.
Kim, M., Mohammad, L. N., & Elseifi, M. A. (2012). Characterization of fracture properties of
asphalt mixtures as measured by semicircular bend test and indirect tension test. Transportation
Research Record, 2296(1), 115-124.
Kim, M., Mohammad, L. N., Phaltane, P., & Elseifi, M. A. (2017). Density and SCB measured
fracture resistance of temperature segregated asphalt mixtures. International Journal of
Pavement Research and Technology, 10(2), 112-121.
Kim, S. S., Yang, J. J., & Etheridge, R. A. (2018). Effects of mix design variables on flexibility
index of asphalt concrete mixtures. International Journal of Pavement Engineering, 1-6.
Kim, Y. R., Castorena, C., Elwardany, M. D., Rad, F. Y., Underwood, S., Akshay, G., Farrar, M.
J., and Glaser, R. R. (2018). Long-term aging of asphalt mixtures for performance testing and
prediction. Transportation Research Board.
Kök, B. V., and Çolak, H. (2011). Laboratory comparison of the crumb-rubber and SBS
modified bitumen and hot mix asphalt. Construction and Building Materials, 25(8), 3204-3212.
Koohi, Y., Luo, R., Lytton, R. L., & Scullion, T. (2012). New methodology to find the healing
and fracture properties of asphalt mixes using overlay tester. Journal of Materials in Civil
Engineering, 25(10), 1386-1393.
Lee, S. H., Tam, A. B., Kim, J., & Park, D. W. (2019). Evaluation of rejuvenators based on the
healing and mechanistic performance of recycled asphalt mixture. Construction and Building
Materials, 220, 628-636.
Li, X., and Marasteanu, M. (2004). Evaluation of the low temperature fracture resistance of
asphalt mixtures using the semi circular bend test (with discussion). Journal of the Association of
Asphalt Paving Technologists, 73.
Li, Y. (1999). Asphalt Pavement Fatigue Cracking Modeling. Louisiana State University, Baton
Rouge, LA.
Ling, C., Swiertz, D., Mandal, T., Teymourpour, P., & Bahia, H. (2017). Sensitivity of the
Illinois flexibility index test to mixture design factors. Transportation Research Record, 2631(1),
153-159.
196
Little, D. N., Lytton, R. L., Williams, D., & Chen, C. W. (2001). Microdamage healing in
asphalt and asphalt concrete, Volume 1: microdamage and microdamage healing, project
summary report (No. FHWA-RD-98-141; Research report 7229). Turner-Fairbank Highway
Research Center.
Liu, M., Ferry, M. A., Davison, R. R., Glover, C. J., & Bullin, J. A. (1998). Oxygen uptake as
correlated to carbonyl growth in aged asphalts and asphalt Corbett fractions. Industrial &
engineering chemistry research, 37(12), 4669-46742.
Luo, S., Lu, Q., & Qian, Z. (2015). Performance evaluation of epoxy modified open-graded
porous asphalt concrete. Construction and Building Materials, 76, 97-102.
Lytton, R. L., Uzan, J., Fernando, E. G., Roque, R., Hiltunen, D., & Stoffels, S. M.
(1993). Development and validation of performance prediction models and specifications for
asphalt binders and paving mixes (Vol. 357). Washington, DC: Strategic Highway Research
Program.
Ma, W. (2014). Proposed Improvements to Overlay Test for Determining Cracking Resistance of
Asphalt Mixtures, Master Thesis, Auburn University, Auburn, AL.
Ma, W., Tran, N. H., Taylor, A. J., Willis, J. R., & Robbins, M. M. (2015). Comparison of
laboratory cracking test results and field performance. Journal of the Association of Asphalt
Paving Technologists, (84).
Malan, G. W., Straus, P. J., and Hugo, F. (1989). A field study of premature surface cracking in
asphalt (with discussion). In Association of Asphalt Paving Technologists Proc (Vol. 58).
Matsuno, S., and Nishizawa, T. (1992). Mechanism of Longitudinal Surface Cracking in Asphalt
Pavement, Proceedings of the 7th International Conference on Asphalt Pavements, Vol. 2, pp.
277-291.
Mensching, D. J., Andriescu, A., DeCarlo, C., Li, X., & Youtcheff, J. S. (2017). Effect of
extended aging on asphalt materials containing re-refined engine oil bottoms. Transportation
Research Record, 2632(1), 60-69.
Min Baek, C. (2010). Investigation of Top-Down Cracking Mechanisms Using the Viscoelastic
Continuum Damage Finite Element Program, Doctoral Dissertation, North Carolina State
University, Raleigh, NC.
Mogawer, W. S., Austerman, A. J., Bonaquist, R., & Roussel, M. (2011). Performance
characteristics of thin-lift overlay mixtures: High reclaimed asphalt pavement content, recycled
asphalt shingles, and warm-mix asphalt technology. Transportation Research Record, 2208(1),
17-25.
Mogawer, W., Austerman, A., Mohammad, L., & Kutay, M. E. (2013). Evaluation of high RAP-
WMA asphalt rubber mixtures. Road Materials and Pavement Design, 14(sup2), 129-147.

197
Mogawer, W., Bennert, T., Daniel, J. S., Bonaquist, R., Austerman, A., & Booshehrian, A.
(2012). Performance characteristics of plant produced high RAP mixtures. Road Materials and
Pavement Design, 13(sup1), 183-208.
Mohammad, L. N., Kim, M., & Elseifi, M. (2012). Characterization of asphalt mixture’s fracture
resistance using the semi-circular bending (SCB) test. In 7th RILEM international conference on
cracking in pavements (pp. 1-10). Springer, Dordrecht.
Mohammad, L. N., Wu, Z., & Aglan, M. A. (2004, May). Characterization of fracture and
fatigue resistance on recycled polymer-modified asphalt pavements. In Proceedings, 5th
international conference (pp. 375-382).
Mohammed-Ali, U., Rivera-Perez, J. J., Ozer, H., & Al-Qadi, I. L. (2019). Cracking Resistance
of Sulfur Extended Asphalt Mixtures Using Illinois Flexibility Index Test. In Airfield and
Highway Pavements 2019: Testing and Characterization of Pavement Materials (pp. 164-173).
Reston, VA: American Society of Civil Engineers.
Moore, N. (2016). Evaluation of Laboratory Cracking Tests Related to Top-Down Cracking in
Asphalt Pavements. Auburn University, Auburn. AL.
Morian, N., Hajj, E. Y., Glover, C. J., & Sebaaly, P. E. (2011). Oxidative aging of asphalt
binders in hot-mix asphalt mixtures. Transportation Research Record, 2207(1), 107-116.
Myers, L. A. (2000). Development and propagation of surface-initiated longitudinal wheel path
cracks in flexible highway pavements, Doctoral dissertation, University of Florida, FL.
Myers, L. A., & Roque, R. (2002). Top-down crack propagation in bituminous pavements and
implications for pavement management. Journal of the Association of Asphalt Paving
Technologists, 71.
Myers, L. A., Roque, R., & Ruth, B. E. (1998). Mechanisms of surface-initiated longitudinal
wheel path cracks in high-type bituminous pavements. Journal of the Association of Asphalt
Paving Technologists, 67.
Nesnas, K., & Nunn, M. (2004). A model for top-down reflection cracking in composite
pavements. In Fifth international RILEM conference on reflective cracking in pavements (pp.
409-416). RILEM Publications SARL.
Newcomb, D., Martin, A. E., Yin, F., Arambula, E., Park, E. S., Chowdhury, A., Brown, R.,
Rodezno, C., Tran, N., Coleri, E., Jones, D., Harvey, J. T., and Jones, D. (2015). Short-term
laboratory conditioning of asphalt mixtures (No. Project 09-52).
Nsengiyumva, G., & Kim, Y. R. (2019). Effect of Testing Configuration in Semi-Circular
Bending Fracture of Asphalt Mixtures: Experiments and Statistical Analyses. Transportation
Research Record, 0361198119839343.
Ouyang, C., Wang, S., Zhang, Y., & Zhang, Y. (2006). Improving the aging resistance of
styrene–butadiene–styrene tri-block copolymer modified asphalt by addition of antioxidants.

198
Polymer degradation and stability, 91(4), 795-804.
Ozer, H., Al-Qadi, I. L., Barber, E., Okte, E., Zhu, Z., & Wu, S. (2017). Evaluation of I-Fit
results and machine variability using MnRoad test track mixtures. Illinois Center for
Transportation/Illinois Department of Transportation.
Ozer, H., Al-Qadi, I. L., Lambros, J., El-Khatib, A., Singhvi, P., & Doll, B. (2016). Development
of the fracture-based flexibility index for asphalt concrete cracking potential using modified
semi-circle bending test parameters. Construction and Building Materials, 115, 390-401.
Ozer, H., Al-Qadi, I. L., Singhvi, P., Bausano, J., Carvalho, R., Li, X., & Gibson, N. (2018).
Prediction of pavement fatigue cracking at an accelerated testing section using asphalt mixture
performance tests. International Journal of Pavement Engineering, 19(3), 264-278.
Ozer, H., Al-Qadi, I. L., Singhvi, P., Khan, T., Rivera-Perez, J., & El-Khatib, A. (2016). Fracture
Characterization of Asphalt Mixture with RAP and RAS Using the Illinois Semi-Circular
Bending Test Method and Flexibility Index. Transportation Research Record: Journal of the
Transportation Research Board, 2575, 130-137.
Partl, M. N., Bahia, H. U., Canestrari, F., De la Roche, C., Di Benedetto, H., Piber, H., &
Sybilski, D. (Eds.). (2012). Advances in interlaboratory testing and evaluation of bituminous
materials: state-of-the-art report of the RILEM technical committee 206-ATB (Vol. 9). Springer
Science & Business Media.
Petersen, J. C. (2009). A review of the fundamentals of asphalt oxidation: chemical,
physicochemical, physical property, and durability relationships. Transportation Research E-
Circular, (E-C140).
Rahbar-Rastegar, R., Daniel, J. S., & Dave, E. V. (2018). Evaluation of viscoelastic and fracture
properties of asphalt mixtures with long-term laboratory conditioning. Transportation Research
Record, 2672(28), 503-513.
Reed, J. X. (2010). Evaluation of the effects of aging on asphalt rubber (Master's thesis, Arizona
State University).
Reinke, G., Hanz, A., Herlitzka, D., Engber, S., & Ryan, M. (2015, April). Further Investigations
into the Impact of REOB and Paraffinic Oils on the Performance of Bituminous Mixtures.
In Asphalt Binder ETG at National Asphalt Pavement Association Meeting, Fall River, Mass.
Rivera-Perez, J. J. (2017). Effect of specimen geometry and test configuration on the fracture
process zone for asphalt materials, Master Thesis, University of Illinois at Urbana-Champaign,
IL.
Rivera-Perez, J., Ozer, H., & Al-Qadi, I. L. (2018). Impact of Specimen Configuration and
Characteristics on Illinois Flexibility Index. Transportation Research Record, 2672(28), 383-
393.

199
Roque, R., Birgisson, B., Drakos, C., & Dietrich, B. (2004). Development and field evaluation of
energy-based criteria for top-down cracking performance of hot mix asphalt (with
discussion). Journal of the Association of Asphalt Paving Technologists, 73.
Roque, R., Zou, J., Kim, Y. R., Baek, C., Thirunavukkarasu, S., Underwood, B. S., & Guddati,
M. N. (2010). Top-down cracking of hot-mix asphalt layers: Models for initiation and
propagation (No. NCHRP Project 1-42A).
Rowe, G. M. (2011). Prepared Discussion for the AAPT paper by Anderson et al.: Evaluation of
the Relationship between Asphalt Binder Properties and Non-Load Related Cracking. Journal of
the Association of Asphalt Paving Technologists, 80, 649-662.
Rowe, G. M., & Bouldin, M. G. (2000, September). Improved techniques to evaluate the fatigue
resistance of asphaltic mixtures. In 2nd Eurasphalt & Eurobitume Congress Barcelona (Vol.
2000).
Ruan, Y., Davison, R. R., & Glover, C. J. (2003). The effect of long-term oxidation on the
rheological properties of polymer modified asphalts. Fuel, 82(14), 1763-1773.
Safaei, F., Castorena, C., & Kim, Y. R. (2016). Linking asphalt binder fatigue to asphalt mixture
fatigue performance using viscoelastic continuum damage modeling. Mechanics of Time-
Dependent Materials, 20(3), 299-323.
Safaei, F., Lee, J. S., Nascimento, L. A. H. D., Hintz, C., & Kim, Y. R. (2014). Implications of
warm-mix asphalt on long-term oxidative ageing and fatigue performance of asphalt binders and
mixtures. Road Materials and Pavement Design, 15(sup1), 45-61.
Safi, F. R., Al-Qadi, I. L., Hossain, K., & Ozer, H. (2019). Total Recycled Asphalt Mixes:
Characteristics and Field Performance. Transportation Research Record, 0361198119849915.
Santagata, E., Anderson, D. A., & Marasteanu, M. (1996). A rheological investigation on the
physical hardening of modified asphalt binders. In Eurasphalt & Eurobitume Congress,
Strasbourg, 7-10 May 1996. Volume 3. Paper E&E. 5.151.
Sheehy, E. (2013). Case Study: High RAP Pilot Project, Presentation from the New Jersey
Asphalt Paving Conference, accesed July 28, 2018,
https://cait.rutgers.edu/system/files/u10/High_RAP_NJDOT_--_Sheehy.pdf.
Shen, J., Amirkhanian, S., & Tang, B. (2007). Effects of rejuvenator on performance-based
properties of rejuvenated asphalt binder and mixtures. Construction and Building
Materials, 21(5), 958-964.
Shen, S. H., Wen, H. F., Mohammad, L., Lund, N., Faheem, A., Zhang, W. G., & Wu, S. H.
(2013). Performance of WMA technologies: stage II-long-term field performance. Transportation
Research Board of the National Academies, Washington, DC.
Shu, X., Huang, B., & Vukosavljevic, D. (2008). Laboratory evaluation of fatigue characteristics
of recycled asphalt mixture. Construction and Building Materials, 22(7), 1323-1330.

200
Singh, D., Chitragar, S. F., & Ashish, P. K. (2017). Comparison of moisture and fracture damage
resistance of hot and warm asphalt mixes containing reclaimed pavement materials. Construction
and Building Materials, 157, 1145-1153.
Sirin, O., Ohiduzzaman, M., Kassem, E., & Paul, D. K. (2018). Comprehensive evaluation of
long-term aging of asphalt mixtures in hot climatic condition. Road Materials and Pavement
Design, 1-23.
Son, S., Said, I. M., & Al-Qadi, I. L. (2019). Fracture properties of asphalt concrete under
various displacement conditions and temperatures. Construction and Building Materials, 222,
332-341.
Song, W., Huang, B., & Shu, X. (2018). Influence of warm-mix asphalt technology and
rejuvenator on performance of asphalt mixtures containing 50% reclaimed asphalt
pavement. Journal of Cleaner Production, 192, 191-198.
Sun, L., Wang, Y., & Zhang, Y. (2014). Aging mechanism and effective recycling ratio of SBS
modified asphalt. Construction and Building Materials, 70, 26-35.
Svasdisant, T., Schorsch, M., Baladi, G., & Pinyosunun, S. (2002). Mechanistic analysis of top-
down cracks in asphalt pavements. Transportation Research Record: Journal of the
Transportation Research Board, (1809), 126-136.
Tran, N. (2010). Evaluation of Warm Mix Asphalt with High RAP on NCAT Pavement Test
Track. NCAT
Tran, N. H., Taylor, A., & Willis, R. (2012). Effect of rejuvenator on performance properties of
HMA mixtures with high RAP and RAS contents. NCAT Report, 12-05.
Tran, N., Turner, P., & Shambley, J. (2016). Enhanced Compaction to Improve Durability and
Extend Pavement Service Life: A Literature Review (No. NCAT Report No. 16-02).
Tran, N., Xie, Z., Julian, G., Taylor, A., Willis, R., Robbins, M., & Buchanan, S. (2016). Effect
of a recycling agent on the performance of high-RAP and high-RAS mixtures: Field and lab
experiments. Journal of Materials in Civil Engineering, 29(1), 04016178.
Turner, F. (2008). WRI Research Related to the Optimal Timing of Preventive Maintenance for
Addressing Environmental Aging. Western Research Institute.
Uhlmeyer, J., Willoughby, K., Pierce, L., & Mahoney, J. (2000). Top-down cracking in
Washington state asphalt concrete wearing courses. Transportation Research Record: Journal of
the Transportation Research Board, (1730), 110-116.
Van den Bergh, W. (2011). The effect of ageing on the fatigue and healing properties of
bituminous mortars, Ph.D Dissertation, Delft University of Technology, Delft University.
Von Quintus, H. L. (1991). Asphalt-aggregate mixture analysis system, AAMAS (No. 338).
Transportation Research Board.

201
Walubita, L. F., Faruk, A. N., Das, G., Tanvir, H. A., Zhang, J., & Scullion, T. (2012). The
overlay tester: a sensitivity study to improve repeatability and minimize variability in the test
results (No. FHWA/TX-12/0-6607-1). Texas Transportation Institute.
Wang, J., Birgisson, B., & Roque, R. (2007). Windows-based top-down cracking design tool for
Florida: using energy ratio concept. Transportation Research Record, 2037(1), 86-96.
Wang, L. B., Myers, L. A., Mohammad, L. N., & Fu, Y. R. (2003). Micromechanics study on
top-down cracking. Transportation Research Record, 1853(1), 121-133.
West, R. C., Tran, N. H., Taylor, A. J., & Willis, R. J. (2016). Comparison of Laboratory
Cracking Test Results with Field Performance of Moderate and High RAP Content Surface
Mixtures on the NCAT Test Track. In 8th RILEM International Symposium on Testing and
Characterization of Sustainable and Innovative Bituminous Materials (pp. 979-991). Springer,
Dordrecht.
West, R. C., Winkle, C. V., Maghsoodloo, S., & Dixon, S. (2017). Relationships between simple
asphalt mixture cracking tests using Ndesign specimens and fatigue cracking at FHWA’s
accelerated loading facility. Road Materials and Pavement Design, 18(sup4), 428-446.
West, R., Timm, D., Powell, B., Heitzman, M., Tran, N., Rodezno, C., ... & Vargas, A.
(2019). Phase VI (2015-2017) NCAT Test Track Findings (No. NCAT Report 18-04).
Willis, J. R., Taylor, A. J., & Nash, T. M. (2016). Laboratory and Field Evaluation of Florida
Mixtures at the 2012 National Center for Asphalt Technology Pavement Test
Track. Transportation Research Record, 2590(1), 65-73.
Willis, R., Timm, D., West, R., Powell, B., Robbins, M., Taylor, A., Smit, A., Tran, N.,
Heitzman, M., Bianchini, A. (2009). Phase III NCAT test track findings. NCAT report, 09-08.
Wu, S., & Muhunthan, B. (2018). A mechanistic-empirical model for predicting top-down
fatigue cracking in an asphalt pavement overlay. Road Materials and Pavement Design, 1-32.
Wu, S., Al-Qadi, I. L., Lippert, D. L., Ozer, H., Luque, A. F. E., & Safi, F. R. (2017). Early-age
performance characterization of hot-mix asphalt overlay with varying amounts of asphalt binder
replacement. Construction and Building Materials, 153, 294-306.
Wu, Z., Mohammad, L. N., Wang, L. B., & Mull, M. A. (2005). Fracture resistance
characterization of superpave mixtures using the semi-circular bending test. Journal of ASTM
International, 2(3), 1-15.
Xie, Z., Tran, N., Julian, G., Taylor, A., & Blackburn, L. D. (2017). Performance of asphalt
mixtures with high recycled contents using rejuvenators and warm-mix additive: field and lab
experiments. Journal of Materials in Civil Engineering, 29(10), 04017190.
Yildirim, Y. (2007). Polymer modified asphalt binders. Construction and Building
Materials, 21(1), 66-72.

202
Yin, F., Kaseer, F., Arámbula-Mercado, E., & Epps Martin, A. (2017c). Characterising the long-
term rejuvenating effectiveness of recycling agents on asphalt blends and mixtures with high
RAP and RAS contents. Road Materials and Pavement Design, 18(sup4), 273-292.
Yin, F., Martin, A. E., Arámbula-Mercado, E., & Newcomb, D. (2017a). Characterization of
non-uniform field aging in asphalt pavements. Construction and Building Materials, 153, 607-
615.
Yin, F., West, R. C., Director, P. E., Xie, Z., Taylor, A., & Julian, G. (2017b). Effects of Loading
Rate and Mix Reheating on Indirect Tensile Nflex Factor and Semi-Circular Bend J-integral Test
Results to Assess the Cracking Resistance of Asphalt Mixtures (No. NCAT Report 17-09).
Zhang, Z., Roque, R., Birgisson, B., & Sangpetngam, B. (2001). Identification and verification
of a suitable crack growth law (with discussion). Journal of the Association of Asphalt Paving
Technologists, 70.
Zhao, S., Huang, B., Shu, X., Jia, X., & Woods, M. (2012). Laboratory performance evaluation
of warm-mix asphalt containing high percentages of reclaimed asphalt pavement. Transportation
Research Record, 2294(1), 98-105.
Zhou, F., & Scullion, T. (2003). Upgraded overlay tester and its application to characterize
reflection cracking resistance of asphalt mixtures (No. FHWA/TX-04/0-4467-1). Texas
Transportation Institute, Texas A & M University System.
Zhou, F., & Scullion, T. (2005). Overlay tester: A rapid performance related crack resistance
test (Vol. 7). Texas Transportation Institute, Texas A & M University System.
Zhou, F., Hu, S., Chen, D. H., & Scullion, T. (2007). Overlay tester: simple performance test for
fatigue cracking. Transportation Research Record, 2001(1), 1-8.
Zhou, F., Im, S., & Hu, S (2019). Development and Validation of the IDEAL Cracking
Test. Asphalt Mixtures, 1.
Zhou, F., Im, S., Hu, S., Newcomb, D., & Scullion, T. (2017a). Selection and preliminary
evaluation of laboratory cracking tests for routine asphalt mix designs. Road Materials and
Pavement Design, 18(sup1), 62-86.
Zhou, F., Im, S., Sun, L., & Scullion, T. (2017b). Development of an IDEAL cracking test for
asphalt mix design and QC/QA. Road Materials and Pavement Design, 18(sup4), 405-427.
Zhou, F., Newcomb, D., Gurganus, C., Banihashemrad, S., Park, E. S., Sakhaeifar, M., & Lytton,
R. L. (2016). Experimental design for field validation of laboratory tests to assess cracking
resistance of asphalt mixtures. NCHRP Project, 9-57.
Zhou, F., Scullion, T., Nady, R. M., Mahboub, K., Scullion, T., McGinnis, R., Marasteanu, M.,
Roque, R., & Dunning, R. (2005). Overlay tester: a simple performance test for thermal
reflective cracking. In Asphalt Paving Technology: Association of Asphalt Paving Technologists-

203
Proceedings of the Technical Sessions (Vol. 74, pp. 443-483). Association of Asphalt Paving
Technologist.
Zhu, Z., Singhvi, P., Espinoza-Luque, A. F., Ozer, H., & Al-Qadi, I. L. (2019). Influence of mix
design parameters on asphalt concrete aging rate using I-FIT specimens. Construction and
Building Materials, 200, 181-187.
Zou, J., & Roque, R. (2011). Top-down cracking: Enhanced performance model and improved
understanding of mechanisms. Asphalt paving technology, (80), 255-288.