validation of hot-poured crack sealant …validation of hot-poured crack sealant performance-based...
TRANSCRIPT

Validation of Hot-Poured Crack Sealant Performance-Based Guidelines http://www.virginiadot.org/vtrc/main/online_reports/pdf/17-r26.pdf
IMAD L. AL-QADI, Founder Professor of Engineering Director, Illinois Center for Transportation Department of Civil and Environmental Engineering University of Illinois at Urbana-Champaign HASAN OZER, Research Assistant Professor Department of Civil and Environmental Engineering University of Illinois at Urbana-Champaign SEYED SALEH YOUSEFI, Graduate Research Assistant Department of Civil and Environmental Engineering University of Illinois at Urbana-Champaign MOHAMMED SAWALHA, Graduate Research Assistant Department of Civil and Environmental Engineering University of Illinois at Urbana-Champaign KEVIN K. McGHEE, Principal Research Scientist Virginia Transportation Research Council Final Report VTRC 17-R26

Standard Title Page - Report on Federally Funded Project
1. Report No.: 2. Government Accession No.: 3. Recipient’s Catalog No.:
FHWA/VTRC 17-R26
4. Title and Subtitle: 5. Report Date:
Validation of Hot-Poured Crack Sealant Performance-Based Guidelines June 2017
6. Performing Organization Code:
7. Author(s):
Imad L. Al-Qadi, Hasan Ozer, Seyed Saleh Yousefi, Mohammed Sawalha, and Kevin
K. McGhee
8. Performing Organization Report No.:
VTRC 17-R26
9. Performing Organization and Address:
Virginia Transportation Research Council
530 Edgemont Road
Charlottesville, VA 22903
10. Work Unit No. (TRAIS):
11. Contract or Grant No.:
98160
12. Sponsoring Agencies’ Name and Address: 13. Type of Report and Period Covered:
Virginia Department of Transportation
1401 E. Broad Street
Richmond, VA 23219
Federal Highway Administration
400 North 8th Street, Room 750
Richmond, VA 23219-4825
Final Contract
14. Sponsoring Agency Code:
15. Supplementary Notes:
16. Abstract:
This report summarizes a comprehensive research effort to validate thresholds for performance-based guidelines and
grading system for hot-poured asphalt crack sealants. A series of performance tests were established in earlier research and
include the crack sealant bending beam rheometer (CSBBR), crack sealant direct tension test (CSDTT), the crack sealant
adhesion test (CSAT), a rotational viscosity test, and a dynamic shear test. Validation was accomplished through an extensive
field performance study incorporating a wide spectrum of commonly used sealants installed in eight test sites around the United
States using two basic treatment methods: (1) clean and seal, and (2) rout and seal. Performance of these sealants and treatment
methods were monitored for 3 years to quantify relative performance, primarily through adhesive and cohesive failures, as well
as overband wear. Field samples were also collected from the sites to conduct laboratory testing to reflect in-service properties.
A statistical method was used to develop correlations of the tests parameters with the field performance. The composite score
approach, combining ranking and correlation, was used to develop a quantitative scale for determining the level of acceptance.
Based on the composite score, a strong or acceptable correlation was obtained between field performance and laboratory test
parameters. After the correlation between field performance and lab results was confirmed, the thresholds for test methods were
selected or fine-tuned.
An investigation was also conducted to evaluate the short-term and long-term aging effects of hot-poured crack sealants
through a differential aging test. Rheological and mechanical properties of sealants at different aging stages were monitored to
characterize the aging effects. Laboratory aging of sealants was studied using three different aging methods: kettle aging, melter
aging, and vacuum oven aging (VOA). The aging index was used to evaluate the effect of these aging methods. By a
comparison of the stiffness master curves obtained from the CSBBR test for field-aged samples and laboratory-aged samples,
VOA was validated as a reasonable aging method for simulating 2 to5 years of field aging.
The research proposes new guidelines for full implementation as AASHTO specifications. In addition to validated and
revised thresholds for existing protocols, the research proposed a modified adhesion test and a simplified test for tracking
resistance. Close inspection of the installation techniques and early performance feedback also supported the development of
guidelines for crack sealant installation and application.
17 Key Words: 18. Distribution Statement:
Hot-poured crack sealant, rheology, field performance, sealant
grade, CSBBR, CSDTT, CSAT, DSR, RV, Aging
No restrictions. This document is available to the public
through NTIS, Springfield, VA 22161
19. Security Classif. (of this report):
Unclassified
20. Security Classif. (of this page):
Unclassified
21. No. of Pages:
70
22. Price:
Form DOT F 1700.7 (8-72) Reproduction of completed page authorized

FINAL REPORT
VALIDATION OF HOT-POURED CRACK SEALANT PERFORMANCE-BASED
GUIDELINES
Imad L. Al-Qadi
Founder Professor of Engineering
Director, Illinois Center for Transportation
Department of Civil and Environmental Engineering
University of Illinois at Urbana-Champaign
Hasan Ozer
Research Assistant Professor
Department of Civil and Environmental Engineering
University of Illinois at Urbana-Champaign
Seyed Saleh Yousefi
Graduate Research Assistant
Department of Civil and Environmental Engineering
University of Illinois at Urbana-Champaign
Mohammed Sawalha
Graduate Research Assistant
Department of Civil and Environmental Engineering
University of Illinois at Urbana-Champaign
Kevin K. McGhee
Principal Research Scientist
Virginia Transportation Research Council
Project Manager
Kevin K. McGhee, P.E., Virginia Transportation Research Council
In Cooperation with the U.S. Department of Transportation
Federal Highway Administration
Virginia Transportation Research Council
(A partnership of the Virginia Department of Transportation
and the University of Virginia since 1948)
Charlottesville, Virginia
June 2017
VTRC 17-R26

ii
DISCLAIMER
The project that is the subject of this report was done under contract for the Virginia
Department of Transportation, the Virginia Transportation Research Council. The contents of
this report reflect the views of the authors, who are responsible for the facts and the accuracy of
the data presented herein. The contents do not necessarily reflect the official views or policies of
the Virginia Department of Transportation, the Commonwealth Transportation Board, or the
Federal Highway Administration. This report does not constitute a standard, specification, or
regulation. Any inclusion of manufacturer names, trade names, or trademarks is for
identification purposes only and is not to be considered an endorsement.
Each contract report is peer reviewed and accepted for publication by staff of the
Virginia Transportation Research Council with expertise in related technical areas. Final
editing and proofreading of the report are performed by the contractor.
Copyright 2017 by the Commonwealth of Virginia.
All rights reserved.

iii
ABSTRACT
This report summarizes a comprehensive research effort to validate thresholds for
performance-based guidelines and grading system for hot-poured asphalt crack sealants. A
series of performance tests were established in earlier research and include the crack sealant
bending beam rheometer (CSBBR), crack sealant direct tension test (CSDTT), the crack sealant
adhesion test (CSAT), a rotational viscosity test, and a dynamic shear test. Validation was
accomplished through an extensive field performance study incorporating a wide spectrum of
commonly used sealants installed in eight test sites around the United States using two basic
treatment methods: (1) clean and seal, and (2) rout and seal. Performance of these sealants and
treatment methods were monitored for 3 years to quantify relative performance, primarily
through adhesive and cohesive failures, as well as overband wear. Field samples were also
collected from the sites to conduct laboratory testing to reflect in-service properties. A statistical
method was used to develop correlations of the tests parameters with the field performance. The
composite score approach, combining ranking and correlation, was used to develop a quantitative
scale for determining the level of acceptance. Based on the composite score, a strong or
acceptable correlation was obtained between field performance and laboratory test parameters.
After the correlation between field performance and lab results was confirmed, the thresholds for
test methods were selected or fine-tuned.
An investigation was also conducted to evaluate the short-term and long-term aging
effects of hot-poured crack sealants through a differential aging test. Rheological and
mechanical properties of sealants at different aging stages were monitored to characterize the
aging effects. Laboratory aging of sealants was studied using three different aging methods:
kettle aging, melter aging, and vacuum oven aging (VOA). The aging index was used to
evaluate the effect of these aging methods. By a comparison of the stiffness master curves
obtained from the CSBBR test for field-aged samples and laboratory-aged samples, VOA was
validated as a reasonable aging method for simulating 2 to5 years of field aging.
The research proposes new guidelines for full implementation as AASHTO
specifications. In addition to validated and revised thresholds for existing protocols, the research
proposed a modified adhesion test and a simplified test for tracking resistance. Close inspection
of the installation techniques and early performance feedback also supported the development of
guidelines for crack sealant installation and application.

1
FINAL REPORT
VALIDATION OF HOT-POURED CRACK SEALANT PERFORMANCE-BASED
GUIDELINES
Imad L. Al-Qadi
Founder Professor of Engineering
Director, Illinois Center for Transportation
Department of Civil and Environmental Engineering
University of Illinois at Urbana-Champaign
Hasan Ozer
Research Assistant Professor
Department of Civil and Environmental Engineering
University of Illinois at Urbana-Champaign
Seyed Saleh Yousefi
Graduate Research Assistant
Department of Civil and Environmental Engineering
University of Illinois at Urbana-Champaign
Mohammed Sawalha
Graduate Research Assistant
Department of Civil and Environmental Engineering
University of Illinois at Urbana-Champaign
Kevin K. McGhee
Principal Research Scientist
Virginia Transportation Research Council
INTRODUCTION
Crack sealing is widely accepted as a cost-effective, routine, and preventive maintenance
practice that extends pavement service life 3 to 5 years when properly installed. Hot-poured
asphalt crack sealant keeps its shape as applied and hardens through chemical and/or physical
processes to form a viscoelastic rubber-like material that withstands extension or compression
due to crack movements and weathering effects. Some of the essential properties of sealants,
such as extendibility, cohesiveness, and adhesive characteristics, are needed to ensure good
performance. Sealants, when properly selected and installed, can remain functional for 3 to 5
years. Therefore, the selection of a proper crack sealant for a particular environment and
pavement is essential to guarantee its performance.
The standards and specifications currently used to select crack sealants were established
based on material properties that are generally empirical and do not measure sealant fundamental
properties. Also, the specification limits vary from one state to another. These differences create

2
difficulties for crack sealant suppliers because many states with the same environmental
conditions specify different limits for the measured properties. The current standard tests are
also reported to correlate poorly with the rheological properties of bituminous-based crack
sealants and often fail to predict sealant performance in the field.
Recently, performance-based guidelines were developed as a systematic procedure to
select hot-poured bituminous crack sealants (Al-Qadi et al., 2009). These guidelines are the
outcome of the pooled-fund North American Consortium led by the University of Illinois at
Urbana-Champaign and the National Research Council of Canada. The sponsoring consortium
included 11 U.S. state departments of transportation, 13 Canadian transportation agencies, and
industry. The U.S. contribution was made through Pooled Fund Research Project TPF-5(045),
which was led by the Virginia Department of Transportation (VDOT) / Virginia Transportation
Research Council (VTRC). The work proposed a “Sealant Grade” (SG) system to select hot-
poured crack sealant based on environmental conditions. A special effort was made to use the
equipment originally developed by the Strategic Highway Research Program (SHRP), which was
used to measure binder rheological behavior as part of the binder Performance Grade (PG)
system. The equipment, specimen preparation, and testing procedure were modified in
accordance with crack sealant behavior. In addition, new tests for sealant aging and sealant
evaluation were introduced. The developed laboratory tests allow for measuring hot-poured
asphalt crack sealants rheological and mechanical properties over a wide range of service
temperatures. Preliminary thresholds for each test were identified to ensure desirable field
performance.
PURPOSE AND SCOPE
The preliminary thresholds were determined based on limited field data only and,
therefore, a comprehensive field study was urgently needed to validate and fine-tune the initially
proposed threshold values. Hence, in this study, an extensive field study was designed to
validate and fine-tune the threshold values. The purpose of this study was to achieve the
following goals: (1) validate the developed laboratory tests using field performance; (2)
determine the thresholds using a more diverse array of field performance data; and (3) develop
guidelines for crack sealant installations and applications. The scope of this study included
installation of test sites, evaluation of the field performance, and correlation to AASHTO
laboratory performance tests. Finally, new guidelines were developed and validated for full
implementation as AASHTO specifications.
METHODS
Overview of Experimental Program
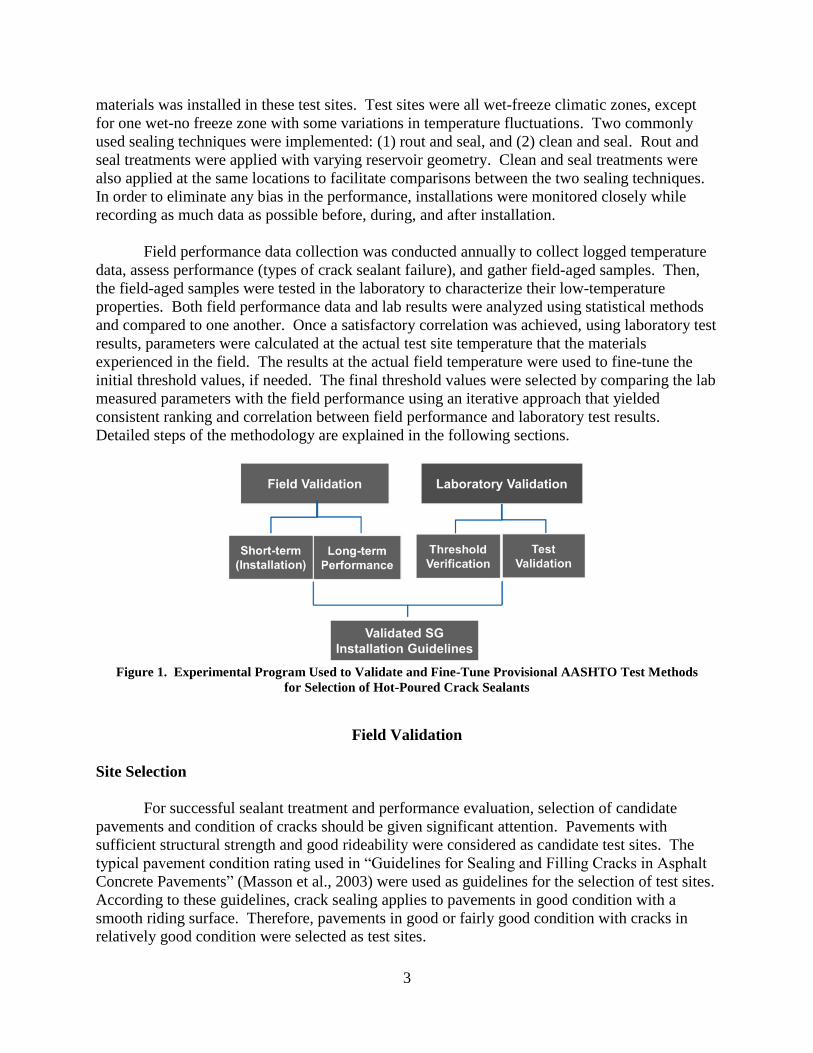
To meet the objectives of this study, the methodology presented in Figure 1 was executed.
The experimental program consists of two major tasks: field performance evaluation of crack
sealants, and laboratory characterization. Eighteen sealants were installed in six different test
sites. All test sites were selected in collaboration with participating state departments of
transportation in different environmental regions in North America. A wide spectrum of
3
materials was installed in these test sites. Test sites were all wet-freeze climatic zones, except
for one wet-no freeze zone with some variations in temperature fluctuations. Two commonly
used sealing techniques were implemented: (1) rout and seal, and (2) clean and seal. Rout and
seal treatments were applied with varying reservoir geometry. Clean and seal treatments were
also applied at the same locations to facilitate comparisons between the two sealing techniques.
In order to eliminate any bias in the performance, installations were monitored closely while
recording as much data as possible before, during, and after installation.
Field performance data collection was conducted annually to collect logged temperature
data, assess performance (types of crack sealant failure), and gather field-aged samples. Then,
the field-aged samples were tested in the laboratory to characterize their low-temperature
properties. Both field performance data and lab results were analyzed using statistical methods
and compared to one another. Once a satisfactory correlation was achieved, using laboratory test
results, parameters were calculated at the actual test site temperature that the materials
experienced in the field. The results at the actual field temperature were used to fine-tune the
initial threshold values, if needed. The final threshold values were selected by comparing the lab
measured parameters with the field performance using an iterative approach that yielded
consistent ranking and correlation between field performance and laboratory test results.
Detailed steps of the methodology are explained in the following sections.
Figure 1. Experimental Program Used to Validate and Fine-Tune Provisional AASHTO Test Methods
for Selection of Hot-Poured Crack Sealants
Field Validation
Site Selection
For successful sealant treatment and performance evaluation, selection of candidate
pavements and condition of cracks should be given significant attention. Pavements with
sufficient structural strength and good rideability were considered as candidate test sites. The
typical pavement condition rating used in “Guidelines for Sealing and Filling Cracks in Asphalt
Concrete Pavements” (Masson et al., 2003) were used as guidelines for the selection of test sites.
According to these guidelines, crack sealing applies to pavements in good condition with a
smooth riding surface. Therefore, pavements in good or fairly good condition with cracks in
relatively good condition were selected as test sites.

4
The candidate transverse cracks were full-lane width cracks with minimal edge
deterioration (i.e., spalls and secondary cracks). The criteria used for the selection of candidate
test sections are similar to those presented by Masson (2001). The following summarizes these
criteria:
Cracks should be less than 15 mm wide.
Cracks should not be a part of a web of cracks.
Cracks should show little or no branching.
Cracks should not have any severe vertical distress, such as lipping or cupping.
Four of the test sections were identified in the first year of the project (2011) and
installations were completed for those sections. All sections are located in a wet-freeze climatic
zone. Two more test sites were added to the experimental matrix in the second year (2012) and
fourth year (2014). The fourth year test site was located in a dry-no freeze climatic zone. Table
1 summarizes the test sections and relevant parameters considered in the selection of each test
section. Test site installations were performed in six states between June 2011 and January
2014.
Table 1. Test Site Summary and Parameters Considered in the Selection of Field Experimental Plan
Test Site
Location
Climatic
Region
Min/Max
Temperature
(°C)
Traffic Initial Pavement
Condition
Pavement
Type
Installation
Date
Belleville,
Wisconsin Wet-Freeze -29/32
2,000
AADT with
6% Truck
11 years old2 in fair
condition with
longitudinal and
transverse cracks
HMA 7/19/2011
St Charles,
Minnesota Wet-Freeze -31/31
13,055
ADT
2 years old in good
condition with
transverse reflective
cracking
HMA
Overlay on
Jointed PCC
9/11/2011
Lindsay,
Ontario, CA Wet-Freeze -29/30
9,022
AADT with
7.5% Truck
13 years old in fair
condition with
transverse and some
long. Cracks
HMA 9/20/2011
Grantham,
New
Hampshire
Wet-Freeze -29/32
9,500
AADT with
9% Truck
2 years old in good
condition with
transverse reflective
cracking
HMA over
PCC 10/3/2011
Canandaigua,
New York Wet-Freeze -24/31
6,600
AADT with
5% Truck
2 years old in very
good condition with
transverse reflective
cracking
HMA over
PCC 9/11/2012
Roscommon
County,
Michigan
Wet-Freeze -29/30 N/A N/A HMA 10/11/2010
Salem,
Virginia Wet-Freeze -16/34 N/A N/A HMA 9/29/2014
Champaign,
Illinois1 Wet-Freeze -24/34 No Traffic N.A HMA 09/15/2011
1 This section was designed and installed to investigate field aging mechanisms and weathering.
2 Pavement age is calculated at the time of installation.

5
Test Matrix
Following the selection of sealants, a testing plan was prepared for each test site. The
sealants were distributed to the test sites with approximately five to seven sealants installed at
each test site (Table 2). The distribution of sealants to each site was determined based on the
following criteria: (1) installation of a sealant material at a minimum of two different sections for
repeatability; (2) a spectrum of material properties to ensure significant differences in field
performance; and (3) agencies’ request to include a specific product in the test matrix. Table 2
summarizes the test matrix that was ultimately finalized and constructed.
Once the test sites and materials were selected and determined, a site-dependent test plan
was proposed. The test plans considered specific site characteristics such as pavement condition,
number of transverse cracks available, crack spacing, availability of traffic control, and length of
test section. A test matrix was prepared with the proposed sealants and the test parameters
deemed critical for field performance, including sealant type, crack treatment type, rout
geometry, and overbanding. An overview of the test plan for each test site is shown in Table 3.
Table 2. Distribution of Materials to the Test Sites
ID ASTM
Type
SG
(AASHTO
TP -xx)
Minnesota New
Hampshire Wisconsin
New
York Ontario Virginia
Total
Repetitions
Ad IV 70-40 X X 2
Bb II 64-16 X X X 3
Ca I 70-10 X 1
Da I 76-34 X X 2
Ed IV 76-40 X X X 3
Fb2 II -34 X X X 3
Gd IV 76-34 X X X 3
Hb2 II -22 X X 2
Ib2 II -10 X X 2
Lb1 II NA X 1
Jd IV 70-46 X 1
Kc2 III -28 X X 2
Mb2 II -34 X X 2
Nb2 II -34 X 1
Ob II 82-40 X X 2
Pd IV 64-28 X X 2
Rb1 II NA X 1
Sd IV 76-34 X 1 1Virgin material for sealants Lb and Rb was not available to be aged and graded in the laboratory.
2These sealants are only graded at low temperature.

6
Table 3. Site-Specific Experimental Plan for Field Investigation of Sealant Performance
Test Site Climatic
Region
Crack Treatment
Variables
Reservoir
Geometry (mm) Materials
Wisconsin Wet-Freeze Crack Seal only 20 x 20 Five materials from three
different manufacturers
Minnesota Wet-Freeze Crack Seal & Fill,
Variable Rout Size
12.5 x 12.5
20 x 20
30 x 15
Seven materials from three
different manufacturers
Ontario Wet-Freeze Crack Seal & Fill,
Variable Rout Size
20 x 20
12.5 x 12.5
30 x 15
40 x 10
Seven materials from four
different manufacturers
New
Hampshire Wet-Freeze
Crack Seal & Fill,
Variable Rout Size
12.5 x 12.5
20 x 20
30 x 15
Five materials from three
different manufacturers
New York Wet-Freeze Crack Seal & Fill,
Variable Rout Size
12.5 x 12.5
20 x 20
30 x 15
Eight materials from four
different manufacturers
Virginia Wet-Freeze Crack Seal & Fill 20 x 20 Four materials from same
manufacturer
Michigan Wet-Freeze Crack Fill only NA Sixteen materials from seven
different manufacturers
Site Preparation and Preliminary Survey
Prior to the installation of sealants, a series of tasks were performed, including
preliminary detailed survey of the test site, installation of displacement pins, and finalization of
the test plan based on on-site conditions. The preliminary tasks are summarized in detail
hereafter.
Baseline Conditions
A preliminary survey was conducted at the test sites prior to installation in order to
collect information about the initial condition of pavement and cracks. Each test site was
surveyed rigorously to determine crack spacing, number of cracks, crack rating, station
numbering, and photo documentation. A rating system was developed to document the initial
condition of the cracks. The rating system is a qualitative measurement based on visual
inspection. The cracks were rated based on their initial condition (partial- or full-length crack,
branching severity, and crack width and depth) and their suitability for sealing. Ratings from 1
to 5 were assigned to cracks with 5 indicating best condition per the selection criteria (full-length
crack, no branching, <10 mm opening), and 1 indicating worst condition. Cracks with ratings
below 3 were not evaluated for performance in this study; however, they were considered for
field sampling. Figure 2 shows images from two different test sites.

7
Figure 2. Initial Survey and Crack Numbering of a Test Section
Based on the preliminary survey, a summary of pavement and initial crack conditions is
provided in Table 4. In general, the selected test sections were in favorable conditions for crack
sealing and filling. Variation in crack spacing also allowed for evaluation of the influence of
crack displacements on sealant performance.
Table 4. A Summary of Preliminary Survey Results
Test Site Average Crack
Spacing (m)
Number of
Cracks
Average Crack
Rating (1: worst
and 5: best)
Wisconsin 17.5 156 3.3
Minnesota 11.5 225 4.6
Ontario 30 276 3.5
New Hampshire 21.5 234 4.7
New York 39 181 3.7
Virginia 15.5 137 2.8
Crack Displacement Pin Installation
Crack displacement is one of the most critical parameters influencing sealant
performance. Opening and closing of cracks can be a function of temperature, crack spacing,
pavement structure, and materials. Crack displacements were measured at each test site using
stainless steel pins driven on each side of the crack. Approximately 30 cracks were pinned at
each test site to monitor displacements. Pin installation included drilling a 6 mm hole, filling the
hole with rapid setting epoxy and driving the pin in the hole. Pins were installed at the edge,
mid-lane, and center lane locations. Measurements were taken using conical-end calipers. Initial
measurements were recorded right after installation. Figure 3 shows two cracks at a test site with
single- and triple-point displacement pins.

8
Figure 3. Crack Displacement Pins: Single-Point to Measure Only Right Wheel Path (left) and Three-Point
to Measure Both Wheel Path and Middle of the Lane (right)
Test Site Installations
This section summarizes test site installations conducted between 2011 and 2014. A brief
overview of each test site, data collected during installation, and highlights of the installation
process are presented herein.
Wisconsin Test Site
The Wisconsin test site is located in Green County on State Highway 92. The test
sections were selected from a 17.5 km pavement section between Brooklyn and Belleville. The
total length of sections where test sealants were installed is 2.9 km. This pavement section was
constructed in 2000 and consists of 10 cm asphalt concrete overlay on 15 cm asphalt concrete
supported by crushed aggregate base. Shoulders were paved with 8 cm thick asphalt concrete on
30 cm thick gravel base. The section is a two-lane highway; each lane is 3.5 m wide. The
sealants were installed on July 19 through21, 2011. The Green County Highway Department
controlled traffic and installed the sealants. This test site was partitioned into five sections for
installing five different sealants. Standard rout geometry (20 x 20 mm) was used in the entire
test site.
Minnesota Test Site
The Minnesota test site is located on Interstate 90 in the St. Charles area. The test
sections are located on westbound I-90 between Mileposts 235 and 238. The total length of the
section is 2.9 km with the test sections in the driving lane. The section was overlaid in 2009 with
11 cm thick asphalt concrete on a jointed PCC. It consists of two lanes in each direction; each is
3.6 m wide. The shoulder width is 3 m throughout the entire test section. Installation took place
during the week of September 11, 2011. This test site consisted of 24 sections including seven
sealants that were installed using various treatment methods. Reflective transverse cracking was
found to be the main crack type in this test site.
Ontario Test Site
The Ontario test site is located on Highway 35 in the Lindsay area. The test site starts
140 m south of Bethany Hills Rd on Highway 35 and ends at around 6.1 km south of the

9
Highway 7 junction. The total length of the section is 8.9 km. The section was rehabilitated in
1998 using full-depth reclamation with a 25-mm-thick asphalt concrete overlay. It consists of
two lanes; each lane is 3.2 m wide. The shoulders were partially paved and are 1 m wide. The
sealant was installed in the week of September 20, 2011. This test site consists of 16 sections
within which seven sealants were installed using various treatment methods.
New Hampshire Test Site
The New Hampshire test site is located on I-89 in the Grantham area. The test sections
are on both southbound and northbound I-89. The southbound sections start at Milepost 48.0
and end at around Milepost 46.2. The northbound sections extend from Milepost 44 to Milepost
45.6. The total test section is 5.7 km long. Installations took place in the driving lane only
during the week of October 3, 2011. The pavement sections were originally constructed between
1958 and 1971. The sections were overlaid in 2009 with 25-mm-thick asphalt concrete. The
sections consist of two 3.7 m wide lanes in each direction. The shoulder width is 3 m throughout
the entire test sections. The test site consists of 19 sections. Five sealants were installed using
various treatment methods. Transverse reflective cracks were the main cracking type with a few
longitudinal cracks developing in some sections.
New York Test Site
The New York test site is located on Chaplin Road (Road 21) in the Canandaigua area,
southeast of Rochester. The test sections are located in the south and northbound lanes of
Chaplin Road. The sections in the southbound lane start at Milepost 3003 and end at Milepost
3025. The test sections in the northbound lane extend from Milepost 3025 to Milepost 3003.
The total test section length is 7.1 km. The section was milled and overlaid in 2010. It consists
of one lane in each direction, and the lane width is 3.7 m. The shoulder width is 1.8 m
throughout the entire test section. Sealant installation took place during the week of September
11, 2012. The test site consists of 13 sections. Six sealants were installed using various
treatment methods. Transverse cracks were the main cracking type at the site with a few
longitudinal cracks.
Virginia Test Site
The Virginia test site is located on Route 11 Northbound at Milepost 7.51 to Milepost
9.04. The section is 2.5 km long running from 1 km N NINT road. The section consists of two
3.7 m wide lanes in each direction. Sealant installation took place during the week of September
29, 2014. The test site consists of five sections. Four sealants were installed using a typical rout
and seal (25 mm x 25 mm) and clean and seal treatments. Similar to the other test sites,
transverse cracks were the main cracking type at the site with a few longitudinal cracks.
Michigan Test Site
The Michigan test site was used for evaluating the performance of clean and seal
treatment. The test site was installed and monitored by Michigan DOT. Sixteen hot-pour
sealants covering a wide spectrum of products were installed in the field to accomplish the study
10
objectives. The materials were mostly different from those used in the other test sites and were
designed, installed, and monitored by the research team. However, since materials were
collected at the time of installation and performance data were available, it was decided to add
the test site to the test matrix.
The Michigan test site is located on the north and south bound lanes of US 127. The test
sections are located between the south Roscommon County line and Canoe Camp Road. The
total length of the section is 4.8 km. The test sections exist in the driving and passing lanes.
Cracks in this section were treated using the clean and seal technique without routing.
Crack Sealant Field Performance
Distress Assessment
The field performance of sealants was evaluated by conducting a detailed field survey of
crack sealants in accordance with AASHTO National Transportation Product Evaluation
Program (NTPEP) protocols (NTPEP Report 16002.3). Field inspection was conducted annually
during the project duration, immediately after crack sealant installation and every winter season
from February to March. Performance data were routinely collected, including visual distress
identification, crack displacement, temperature measurements, and material sampling for
laboratory evaluation. This report summarizes the results obtained from the test section survey
since 2011. The sealants were also visually inspected for material failure, loss in bond, and
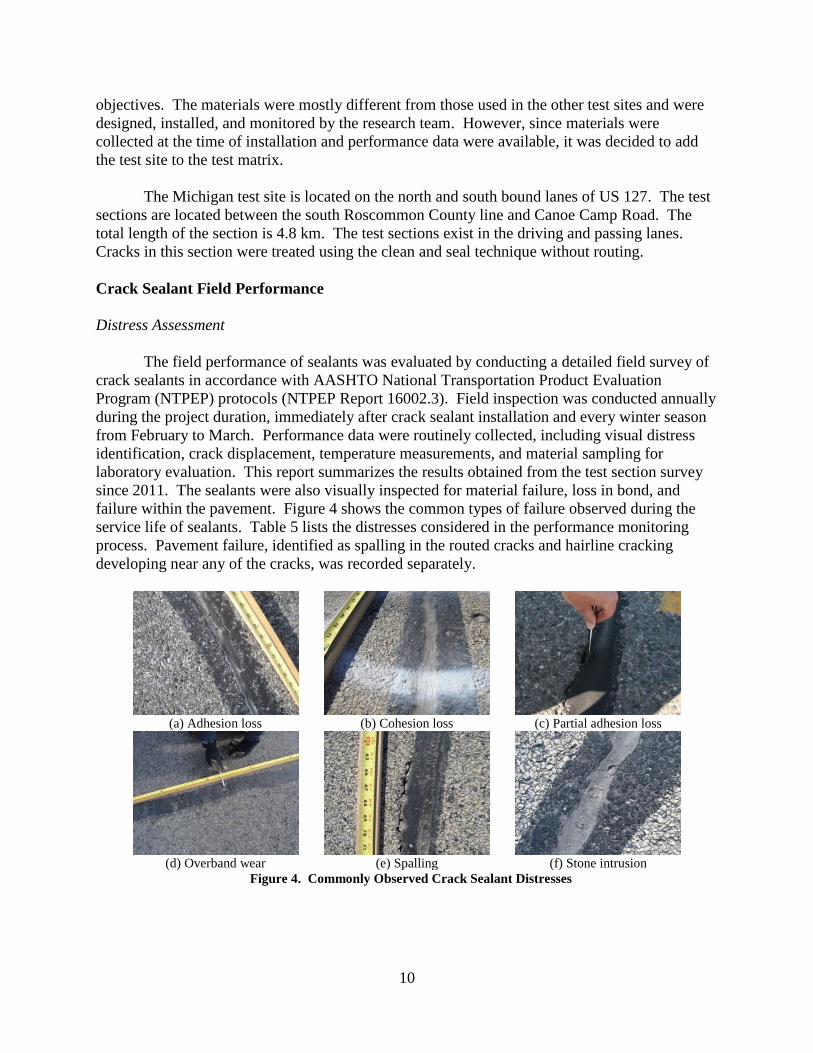
failure within the pavement. Figure 4 shows the common types of failure observed during the
service life of sealants. Table 5 lists the distresses considered in the performance monitoring
process. Pavement failure, identified as spalling in the routed cracks and hairline cracking
developing near any of the cracks, was recorded separately.
(a) Adhesion loss (b) Cohesion loss (c) Partial adhesion loss
(d) Overband wear (e) Spalling (f) Stone intrusion
Figure 4. Commonly Observed Crack Sealant Distresses
11
Table 5. Distress Types Considered in the Field Evaluation
Distress Type
Sealant material failure Adhesion loss
Cohesion loss
Partial adhesion and cohesion loss
Overband wear
Tracking
Stone intrusion
Pavement failure Spalling
Hairline cracking
During each field survey, more than 200 cracks were evaluated and crack conditions were
digitally documented. Specifically, each crack was quantitatively evaluated for percent length of
full-depth adhesive/cohesive failure, percent length of partial-depth adhesive/cohesive failure,
percent length of overband wear, percent length of spalling failure, and the amount of stone
intrusion.
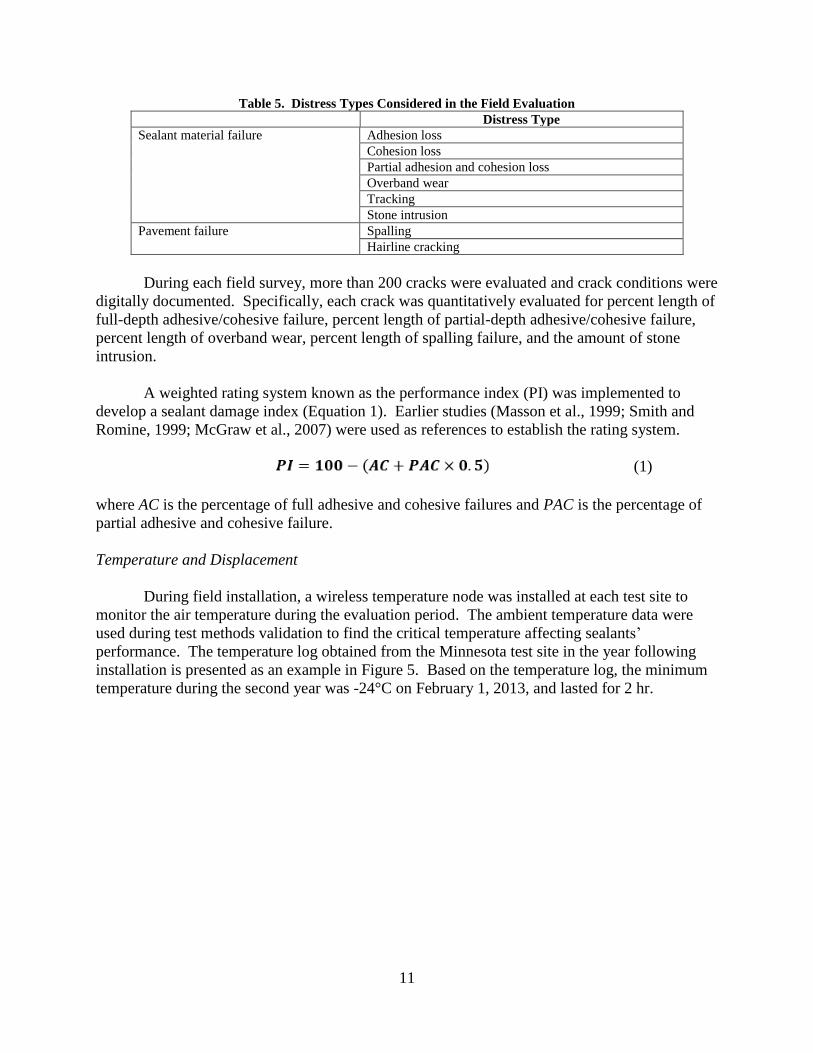
A weighted rating system known as the performance index (PI) was implemented to
develop a sealant damage index (Equation 1). Earlier studies (Masson et al., 1999; Smith and
Romine, 1999; McGraw et al., 2007) were used as references to establish the rating system.
(1)
where AC is the percentage of full adhesive and cohesive failures and PAC is the percentage of
partial adhesive and cohesive failure.
Temperature and Displacement
During field installation, a wireless temperature node was installed at each test site to
monitor the air temperature during the evaluation period. The ambient temperature data were
used during test methods validation to find the critical temperature affecting sealants’
performance. The temperature log obtained from the Minnesota test site in the year following
installation is presented as an example in Figure 5. Based on the temperature log, the minimum
temperature during the second year was -24°C on February 1, 2013, and lasted for 2 hr.

12
Figure 5. Ambient Temperature for Minnesota Test Site in the Year Following Installation
Effect of Treatment Type
To evaluate the effect of installation methods on sealant performance, cracks were treated
by routing and sealing using different rout geometries and overbanding. Additionally, to
evaluate the effect of the type of crack treatment, cracks of selected sections were cleaned and
poured with sealant without any routing (uncut crack), referred to as clean and seal in this study.
Michigan Test Deck – A Case Study
Data Collection
The test deck installed by Michigan DOT prior to the start of the project was also added
to the experimental program as a case study. The field performance at the Michigan test deck
was evaluated by MDOT, also in accordance with NTPEP protocols. Field surveys were
conducted twice every year (winter and summer) after clean and fill installation of hot-poured
asphalt crack sealants. During each field survey, approximately 160 cracks were evaluated.
Each crack was evaluated for percent length of cohesive failure and percent length of overband
wear as plow abrasion.
Ambient air temperature was also monitored continuously. A data acquisition system
was installed in the site to collect and store temperature data. Temperature data were
downloaded to a laptop during the site visits and an accumulative variation of temperature was
recorded. The main purpose of recording temperature readings was to investigate the effect of
temperature on crack sealant cohesive performance and plow failure in the field and to study
temperature performance ranges of the sealants.
Performance of Selected Sealants
The Michigan test bed was also evaluated using a rating system based on the same
previous work supporting Equation 1, but emphasizing failure modes more relevant to the site.
13
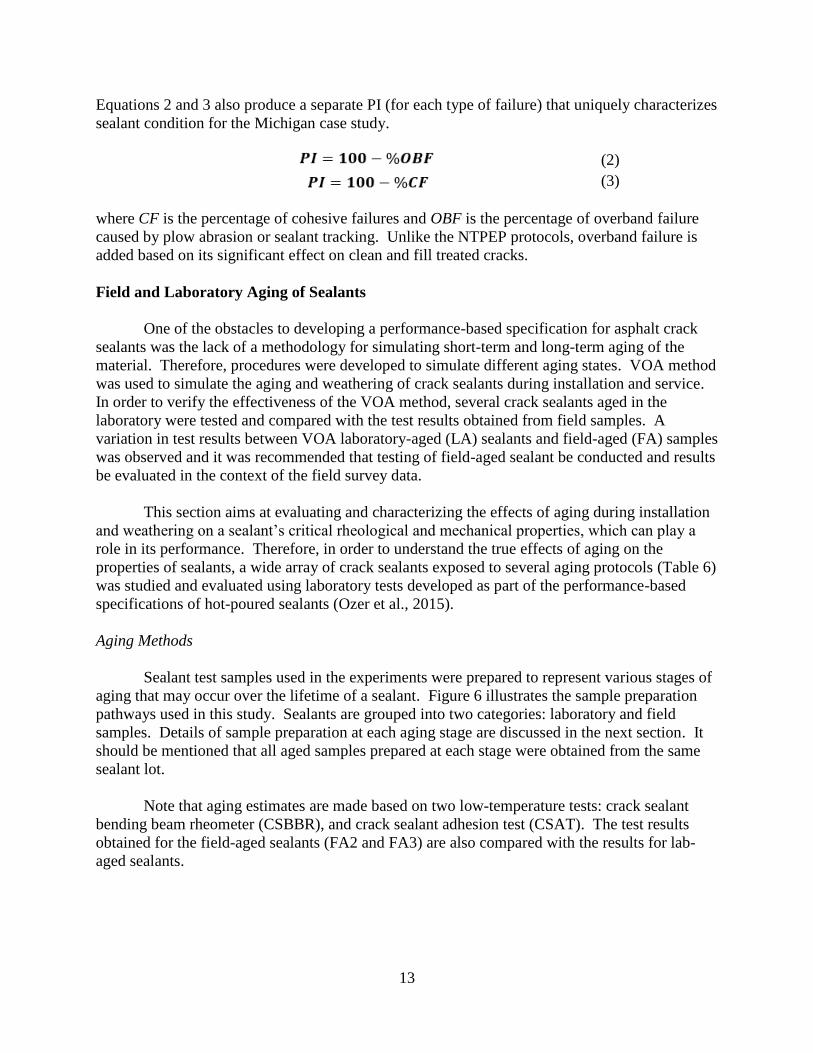
Equations 2 and 3 also produce a separate PI (for each type of failure) that uniquely characterizes
sealant condition for the Michigan case study.
(2)
(3)
where CF is the percentage of cohesive failures and OBF is the percentage of overband failure
caused by plow abrasion or sealant tracking. Unlike the NTPEP protocols, overband failure is
added based on its significant effect on clean and fill treated cracks.
Field and Laboratory Aging of Sealants
One of the obstacles to developing a performance-based specification for asphalt crack
sealants was the lack of a methodology for simulating short-term and long-term aging of the
material. Therefore, procedures were developed to simulate different aging states. VOA method
was used to simulate the aging and weathering of crack sealants during installation and service.
In order to verify the effectiveness of the VOA method, several crack sealants aged in the
laboratory were tested and compared with the test results obtained from field samples. A
variation in test results between VOA laboratory-aged (LA) sealants and field-aged (FA) samples
was observed and it was recommended that testing of field-aged sealant be conducted and results
be evaluated in the context of the field survey data.
This section aims at evaluating and characterizing the effects of aging during installation
and weathering on a sealant’s critical rheological and mechanical properties, which can play a
role in its performance. Therefore, in order to understand the true effects of aging on the
properties of sealants, a wide array of crack sealants exposed to several aging protocols (Table 6)
was studied and evaluated using laboratory tests developed as part of the performance-based
specifications of hot-poured sealants (Ozer et al., 2015).
Aging Methods
Sealant test samples used in the experiments were prepared to represent various stages of
aging that may occur over the lifetime of a sealant. Figure 6 illustrates the sample preparation
pathways used in this study. Sealants are grouped into two categories: laboratory and field
samples. Details of sample preparation at each aging stage are discussed in the next section. It
should be mentioned that all aged samples prepared at each stage were obtained from the same
sealant lot.
Note that aging estimates are made based on two low-temperature tests: crack sealant
bending beam rheometer (CSBBR), and crack sealant adhesion test (CSAT). The test results
obtained for the field-aged sealants (FA2 and FA3) are also compared with the results for lab-
aged sealants.

14
Figure 6. Sealant Sample Preparation Pathways to Represent Various Aging Stages of Sealants.
Note: LU = Lab Unaged, LA = Lab Aged, MA = Melter Aged, LK = Lab Kettle aged, FK = Field Kettle aged,
FAC = Crust portion of Field Aged, and FAB = Bottom portion of Field Aged
Table 6. Aging Procedures for Sealants Used in Performance Characterization
Aging Condition Label Remarks
Lab Unaged LU Lab homogenized sealants using ASTM D5167
Lab Aged LA Lab long-term aging using vacuum oven aging
(AASHTO T 86)
Lab Kettle Aged LK Short-term kettle aging using a rental kettle
Field Kettle Aged FK Short-term kettle aging obtained from kettles during test
site installations
Melter Aged MA Extensive aging time in the melter used to homogenize
sealants
6-Month Field Aged FA1 Field-aged samples collected during the first test site
evaluation
1.5-Year Field Aged FA2 Field-aged samples collected during the second test site
evaluation
2.5-Year Field Aged FA3 Field-aged samples collected during the third test site
evaluation
Collection of Field-Aged Samples
During field installation, two to three samples were obtained from each material at
different times. The first sample was collected right before installation, when the material was at
the recommended temperature. The second and third samples were collected during installation.
These samples were used to study the effect of kettle aging (short-term aging) on the rheological
properties of crack sealants (Figure 7a). Also during the annual field surveys, field-aged
(referred to as FA2 and FA3) samples were collected from the Minnesota, Wisconsin, Ontario,
New Hampshire, and New York test sites during the second and third evaluation period (Figure
7b).

15
(a) Field kettle (FK) sampling (b) Field-aged (FA) sampling
Figure 7. Collection of Field-Aged Samples
Laboratory Aging
The laboratory-aged samples were prepared first. The sealants were homogenized and
melted for an hour in a lab melter according to ASTM D5167-13; these samples are considered
laboratory-unaged samples. This is a standard procedure used in preparation of sealants for
laboratory tests. The unaged sealants were then aged by a VOA procedure designed to simulate
field aging of sealants. According to the procedure, 35g of sealant is kept at 115°C in the oven
with vacuumed air for 16 hr (Figure 8). The last set of laboratory-aged samples was prepared
using the melter by heating and stirring the sealants for another 4 and 8 hr to represent aging
during the installation.
Figure 8. Vacuum Oven Aging to Simulate Long-Term Aging for Crack Sealants
Three different aging methods were practiced in the laboratory: extended melter aging
(MA) according to ASTM D5167, kettle aging (LK) using a rental kettle, and VOA (LA)
according to AASHTO T P86. To study the effect of these three aging methods, test results are

16
expressed in terms of the Aging Index (AI) defined by relative change in rheological property of
aged and unaged sealant.
(4)
where S is the CSBBR stiffness at 240 sec of creep loading. AI higher than unity is an indication
of increasing in low-temperature stiffness and AI lower than unity means that sealant is getting
softer or degraded.
Laboratory Validation
Field performance data collected from the test sites were used in validation of the crack
sealant grading test methods. Information collected from lab- and field-aged samples was used
to establish correlation between laboratory and field performance and to validate the lab tests and
fine-tune the thresholds (Figure 9). The thresholds were selected by comparing the lab
parameters with field performance using an iterative approach that yielded consistent ranking
and correlation between field and laboratory test results.
Figure 9. Experimental Program for Validating and Fine-Tuning Laboratory Test Method

17
High-Temperature Grading
Background
Tracking failure of sealants results from wearing of the material subjected to the shear
loading applied by vehicles. The main cause of this failure can be improper selection of sealant
type, early traffic opening, or high temperatures. In the performance grading system, tests that
predict tracking failure are also used to determine the high-temperature grade. In Phase I of the
crack sealant study, the multiple stress creep recovery (MSCR) test was developed using a
dynamic shear rheometer (DSR) to determine high-temperature grading and tracking resistance.
The MSCR test is a well-developed procedure to determine permanent deformation
characteristics of asphalt materials. Testing protocol includes multiple cycles of creep and
recovery resulting in a model describing Non-Newtonian viscous properties indicating shear
resistance of the material. The coefficients C-value (flow coefficient) and P-value (thinning
coefficient) describe the Ostwald model parameters also used in defining the performance
threshold. Performance correlation and thresholds were determined in the previous phase using
another laboratory-scale torture test (Al-Qadi et al., 2009). The MSCR test has yet to be
validated using field performance data.
Since the MSCR test procedures are complex and time consuming, an alternative and
more practical test was sought in this phase to fulfill the same performance grading requirements
as the MSCR. The alternative high-temperature grading test is presented in this section, for
high-temperature grading of hot-poured crack sealants. This test also simulates tracking failure
of sealant due to shearing at high temperatures using a practical and less time consuming testing
protocol. Some of the major attributes of this test are explained as follows:
DSR equipment is used for testing.
Shear strain is increased at a constant rate until complete failure to observe yield point for
sealants (shear strains goes up to 600%).
A shear rate of 0.01 sec-1
was selected.
Test temperatures ranged from 46 to 82°C with 6°C increments.
A threshold value was determined as a cut-off value for high-temperature grading. The
threshold value was initially determined based on MSCR results. The test proposes a
threshold shear stress or resistance at high temperatures above which acceptable tracking
resistance should be expected.
General Test Sites
The testing protocol for predicting tracking failure was applied to ten selected sealants for
grading and evaluation. The specimens were prepared according to ASTM D5167 (1 hr melting
and homogenization at recommended installation temperature). Unaged samples were selected
to find the high-temperature grade.

18
Michigan Test Deck
Six out of sixteen sealants that were installed and evaluated by MDOT were selected to
correlate field and laboratory performance. The main difference between Michigan test site
evaluations and other test sites evaluations is the frequency of field surveys, which were
conducted twice a year (winter and summer) as compared to once in other test sites (after
winter). This helped evaluate the overband failure separately for hot and cold seasons and
correlate it with corresponding laboratory performance.
Viscosity
Viscosity plays an essential role in predicting the field performance of hot-poured crack
sealants: upper and lower viscosity limits must be identified. The upper limit ensures that the
material is sufficiently liquid so it can be poured; the lower limit helps avoid excessively fluid
sealants, which create problems in filling cracks during installation (Al-Qadi et al., 2009). A
Brookfield rotational viscometer was used to measure the apparent viscosity of hot-poured crack
sealants that simulates installation conditions (AASHTO TP 85).
Low-Temperature Grading
Crack Sealant Bending Beam Rheometer
The CSBBR test, a modified Bending Beam Rheometer (BBR) test, was introduced to
measure the flexural creep of crack sealants at temperatures as low as -40°C. This procedure has
been adopted as an AASHTO TP 87 provisional standard. Two performance parameters were
suggested for use in the specification: stiffness at 240 sec (S240), and average creep rate. The
field-aged samples were tested at three different temperatures for better characterization of
sealant performance. A stiffness master curve was obtained for each sealant at a reference
temperature.
Sealants with similar field performance, according to their PIs, were grouped together
based on statistical testing. The sealants were evaluated based on their respective test results and
grouped based on statistical tests. Groups with matching lab and field performance indicated
that the laboratory test parameter provided positive correlation to field performance. Two
separate statistical methods were used to determine groupings for the data collected from the lab
and field. Field data were statistically analyzed using the Games-Howell test and categorized in
different subsets. Each subset presents a group of sealants with a similar field performance.
Another statistical test was also applied to the test parameters obtained from the CSBBR test.
Because of the normal distribution of laboratory test results, the Tukey test was used to
categorize sealants in different subsets. The subsets of field and lab data were compared
separately for each test site.
Crack Sealant Direct Tension Test
The Crack Sealant Direct Tension Test (CSDTT) has been adopted as an AASHTO
provisional standard (AASHTO TP 88). Extendibility at the test temperature is suggested as a

19
performance parameter. Similar to the CSBBR test method, sealants with distinct lab results
were expected to be grouped in the same field performance subsets to validate the CSDTT test
method.
Modified Adhesion Test
Field-aged samples were tested using the AASHTO provisional standard TP 89 CSAT to
seek correlation to field performance (Figure 10a). A similar approach used for CSBBR was
followed to interpret the test results. Field and laboratory test data were analyzed using
independent statistical tests, and similarly performing sealants were grouped together. The
subsets of field and lab data were compared separately for each test site. Overall, no specific
trends were obtained for the effect of test temperature. None of the sealants in this site passed
the criterion for adhesion load (50 N). Sealants performed differently depending on the tested
temperature. Some of the critical observations regarding this test are summarized as follows:
Repeatability of test results was poor. The field-aged specimens showed a high
coefficient of variation (CoV) - CoV of the loads could reach as high as 62%. Variability
was higher with the energy results.
The test was not able to discriminate sealant adhesion performance. No significant
differences were observed among the adhesive capacity of different sealants.
Sample preparation and the quality of the shim used to create the notch are key factors
affecting the quality of test results.
Therefore, a more robust and repeatable adhesion test addressing the abovementioned
challenges were sought through modification of CSAT. Different test trials were introduced by
changing the fixture geometry used in the DTT machine. A larger cross-section was used to
provide a larger contact area. Rectangular cross-sections of 30 mm x 20 mm were then
introduced (Figure 10b). A 6 mm notch from each side of the interface was applied using the
mold release. The modified adhesion test mold assembly consists mainly of two T-shape end
pieces and a U-shape to confine the end pieces. The reason for using a U-shape end piece is to
get a good grip of the mold assembly. The notch would minimize bulk sealant deformations and
redirect the applied energy for interface debonding. The end tab contact surface is 30 mm × 20
mm. Tests were conducted with four replicates at selected temperatures. This set up was
identified as the main adhesion test and used to test all sealants after preliminary evaluation was
performed.
(a) CSAT (b) Modified Adhesion Test
Figure 10. Specimen Configuration for Current and Modified Tensile Adhesion Tests

20
Test molds were made from 6061 type aluminum. The adhesion interface was polished
to No. 32 grit. The molds consist of three parts: two end tabs, and one U-shape. The notch area
is applied to produce a symmetrical interface. The U-shape part can be used to create the notch
area by first marking the location where the notch is introduced. The process is repeated for the
other side notch. The proposed design of the molds provides a very easy demolding process. It
also minimizes the impact of the specimen weight during the conditioning. The symmetry and
ease of handling provided by this design improved the results significantly.
After a preliminary evaluation of the new and improved adhesion test method, a set of
evaluation criteria was established to verify the robustness of the new test and determine whether
it could fulfill the objectives of the study. Evaluation criteria were as follows:
Repeatability between test replicates and users
Meaningfulness of results (i.e., whether the results follow a trend with temperature and
aging)
Discrimination potential among sealants to determine a pass/fail threshold
RESULTS
Field Performance Review
General Condition Summary
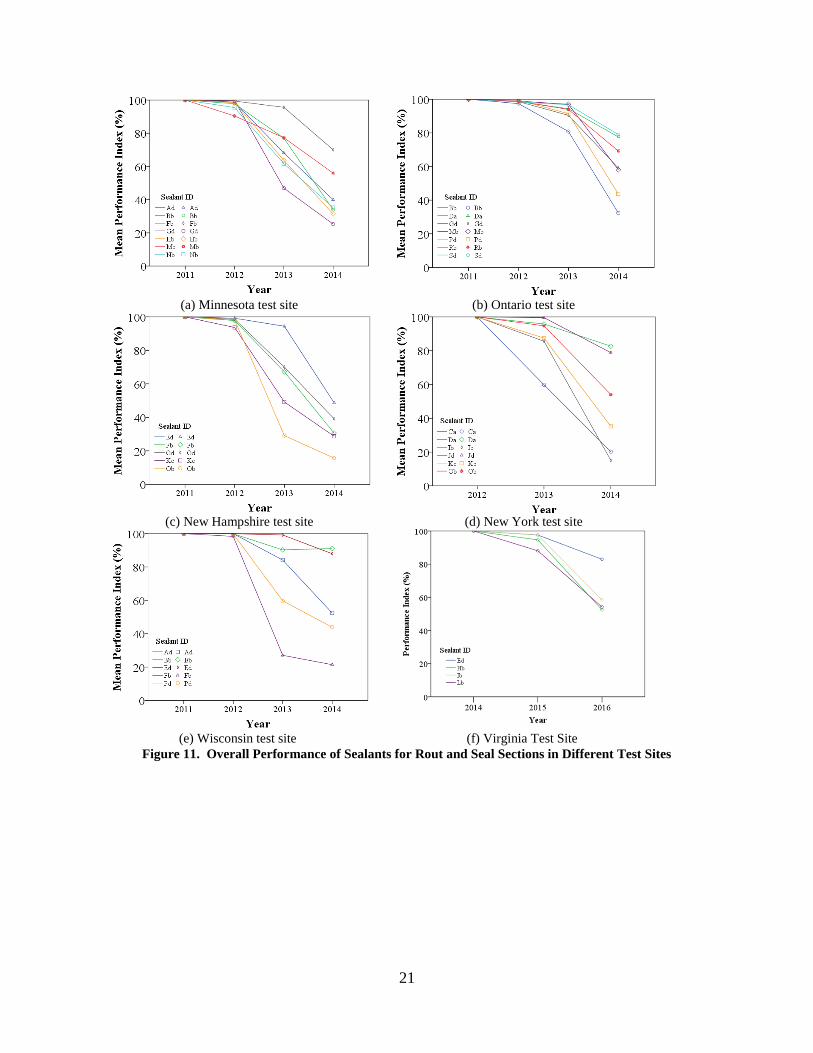
A summary of evaluation results (using PI) at different test sites is presented in Figure 11
for rout and seal sections and Figure 12 for clean and seal sections. Overall, severe changes
were noticed in the failure extent between winter 2013 and winter 2014. Adhesion loss, which
allows the penetration of water into pavement layers, was the most observed sealant failure in the
field. The amount of adhesion loss is calculated based on the effective length of the crack, which
is the total length of spalling along the crack subtracted from total crack length. Figure 11 shows
the significant drop in PI values for the majority of sealants after the second and third winters.
Severe failure of the clean and seal sections was also observed after the first and second winters
(Figure 12).
21
(a) Minnesota test site (b) Ontario test site
(c) New Hampshire test site (d) New York test site
(e) Wisconsin test site (f) Virginia Test Site
Figure 11. Overall Performance of Sealants for Rout and Seal Sections in Different Test Sites

22
(a) Minnesota test site (b) Ontario test site
(c) New Hampshire test site (d) New York test site
(e) Virginia Test Site
Figure 12. Overall Performance of Sealants for Clean and Seal Sections in Different Test Sites
Temperature and Displacement
The detailed temperature log for the five coldest days at four test sites is presented in
Table 7. The corresponding crack displacements for each winter at each site are shown in Figure
13.

23
Table 7. Summary of Minimum Temperatures for the Five Coldest Days at All Test Sites
Test Site Temperature (°C)
1 2 3 4 5 Average
Minnesota -24.0 -22.8 -22.8 -21.0 -20.5 -22.2
Ontario -33.2 -29.0 -28.8 -27.5 -27.5 -29.2
New York -21.7 -20.7 -20.5 -19.7 -19.0 -20.3
New Hampshire -26.7 -24.0 -23.5 -22.8 -22.2 -23.8
Figure 13. Average Crack Displacements Measured at Each Test Site
Effect of Treatment Type
The effect of different treatment methods on the performance of crack sealants is
compared in Figure 14. Following the second winter at all test sites, there was a significant drop
in the PI for clean and seal sections. The difference between clean and seal sections and rout and
seal sections was approximately 30% on average. After winter 2014, almost all clean and seal
sections had failed.
Overband application was also evaluated as another factor that affects the performance of
crack sealants. The effect of overbanding is evident in Figure 15. Foregoing an overband as a
test variable in some of the sections in the New York test site led to a significant drop in the
performance of sealants. The average of differences between the sealants with overband and
without overband after both winters is about 18% to 20%. Similar observations were reported in
SHRP project H-106 (Smith and Romine, 1999).

24
Figure 14. Effect of Treatment Type on Crack Sealants Performance after Second Winter for Different
Materials at Different Test Sites. Note: C & S = Clean and Seal; R & S = Rout and Seal
Figure 15. Effect of Overband Application on Crack Sealants Performance for Different Materials
at Different Test Sites after Second Winter
Michigan Case Study
This section summarizes the field performance reviews from the Michigan test deck since
2011. The common crack filling (clean and seal) failures as observed from the site were
cohesive failures resulting from crack movements and overband failure due to tire tracking and
plows (Figure 16). Sample pictures from sealant field performance are presented in Figure 17.
The sealant in crack 1.1 failed due to poor cohesive performance while the overband was still in
contact; the sealant in cracks 14.9 and 16.6 failed due to poor cohesive and overband
performance, respectively.

25
(a) Cohesive failure (b) Overband failure
Figure 16. Common Failure Modes of Clean and Seal Treatment
(a) Crack 5.7 (b) Crack 9.8 (c) Crack 8.7 (d) Crack 1.1 (e) Crack 14.9 (f) Crack 16.6
Figure 17. Sample Pictures for Sealants Field Performance in Michigan Test Site
Six crack sealants with consistent installation conditions were selected from the Michigan
deck - Sections 03, 04, 06, 07, 12, and 16. The corresponding ASTM D6690 classification of
each sealant is provided in Table 8. Out of six hot-poured crack sealants selected in this study,
three are Type I (Sections 04, 06, and 07), one is Type II (Section 16), and two are Type IV
(Sections 03 and 12). The sealants were classified based on effectiveness of the seal with respect
to climatic conditions, low-temperature performance, and the percentage of extension. Based on
the field performance and as a result of resistance against plows, sealants at Sections 04 and 12
reflected good field performance, Sections 07 and 16 demonstrated fair performance, and
Sections 03 and 06 had poor performance. Because of their cohesive properties, sealants at
Sections 03, 04, and 06 had very good or good performance, while sealants at Sections 07, 12,
and 16 showed fair or poor performance.
26
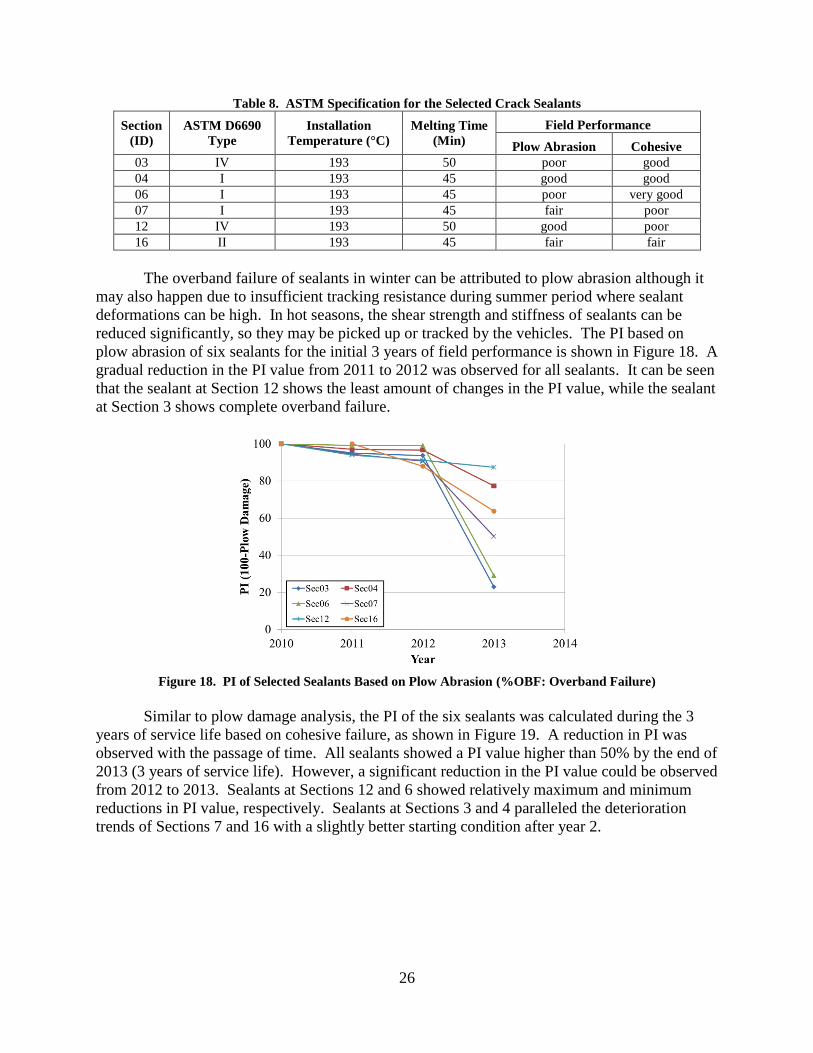
Table 8. ASTM Specification for the Selected Crack Sealants
Section
(ID)
ASTM D6690
Type
Installation
Temperature (°C)
Melting Time
(Min)
Field Performance
Plow Abrasion Cohesive
03 IV 193 50 poor good
04 I 193 45 good good
06 I 193 45 poor very good
07 I 193 45 fair poor
12 IV 193 50 good poor
16 II 193 45 fair fair
The overband failure of sealants in winter can be attributed to plow abrasion although it
may also happen due to insufficient tracking resistance during summer period where sealant
deformations can be high. In hot seasons, the shear strength and stiffness of sealants can be
reduced significantly, so they may be picked up or tracked by the vehicles. The PI based on
plow abrasion of six sealants for the initial 3 years of field performance is shown in Figure 18. A
gradual reduction in the PI value from 2011 to 2012 was observed for all sealants. It can be seen
that the sealant at Section 12 shows the least amount of changes in the PI value, while the sealant
at Section 3 shows complete overband failure.
Figure 18. PI of Selected Sealants Based on Plow Abrasion (%OBF: Overband Failure)
Similar to plow damage analysis, the PI of the six sealants was calculated during the 3
years of service life based on cohesive failure, as shown in Figure 19. A reduction in PI was
observed with the passage of time. All sealants showed a PI value higher than 50% by the end of
2013 (3 years of service life). However, a significant reduction in the PI value could be observed
from 2012 to 2013. Sealants at Sections 12 and 6 showed relatively maximum and minimum
reductions in PI value, respectively. Sealants at Sections 3 and 4 paralleled the deterioration
trends of Sections 7 and 16 with a slightly better starting condition after year 2.

27
Figure 19. Performance Index of Selected Sealants Based on Cohesive Failure
During the seasonal surveys, the average crack displacement readings were obtained for
specific sections to ascertain the effect of temperature on crack displacement and crack spacing.
Average crack spacing and the net movement of 10 consecutive cracks per section were
measured and recorded. Figure 20 presents the average crack displacment (bars) and spacing
(line) from the field measurments during the winter surveys for the selected sections.
Figure 20. Average Crack Displacement and Spacing
It may be noted from Figure 20 that crack displacement during the winter of 2012 was
lower than that of winter 2011. This may be atrributed to the fact that the temperature was
relatively lower in winter 2011 than winter 2012. Data were unavailable for the sealant at
Section 16.
28
Aging of Sealants
Evaluation
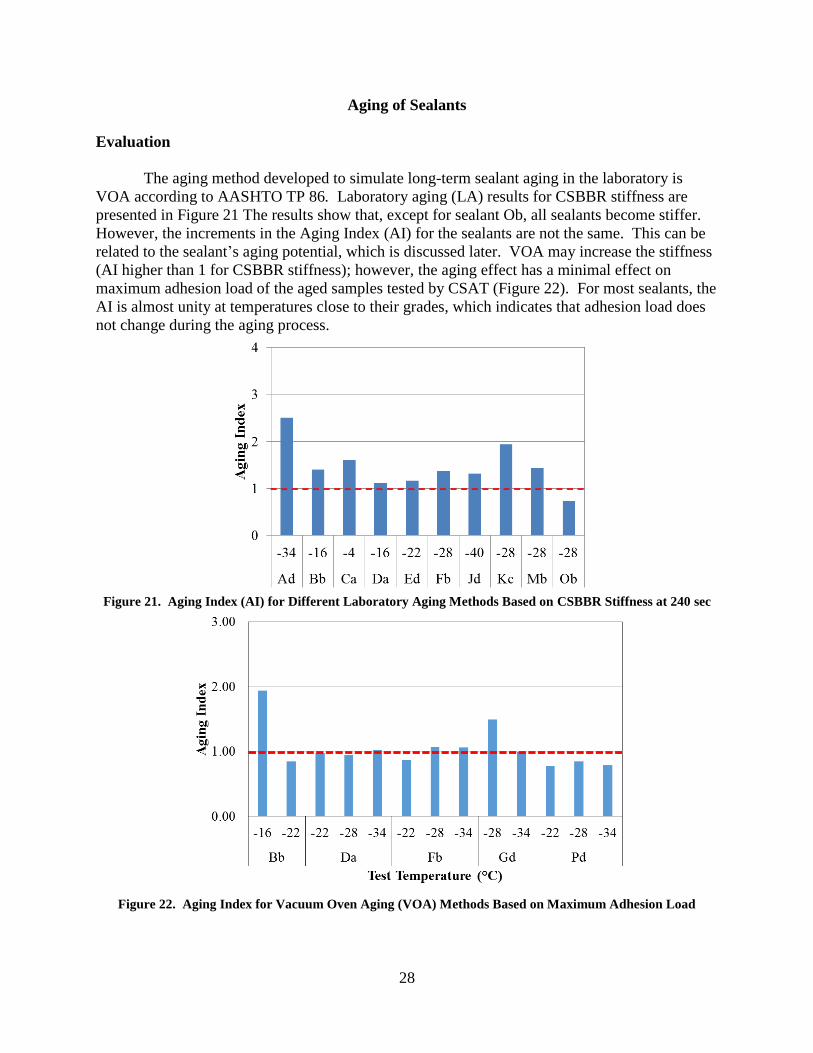
The aging method developed to simulate long-term sealant aging in the laboratory is
VOA according to AASHTO TP 86. Laboratory aging (LA) results for CSBBR stiffness are
presented in Figure 21 The results show that, except for sealant Ob, all sealants become stiffer.
However, the increments in the Aging Index (AI) for the sealants are not the same. This can be
related to the sealant’s aging potential, which is discussed later. VOA may increase the stiffness
(AI higher than 1 for CSBBR stiffness); however, the aging effect has a minimal effect on
maximum adhesion load of the aged samples tested by CSAT (Figure 22). For most sealants, the
AI is almost unity at temperatures close to their grades, which indicates that adhesion load does
not change during the aging process.
Figure 21. Aging Index (AI) for Different Laboratory Aging Methods Based on CSBBR Stiffness at 240 sec
Figure 22. Aging Index for Vacuum Oven Aging (VOA) Methods Based on Maximum Adhesion Load
29
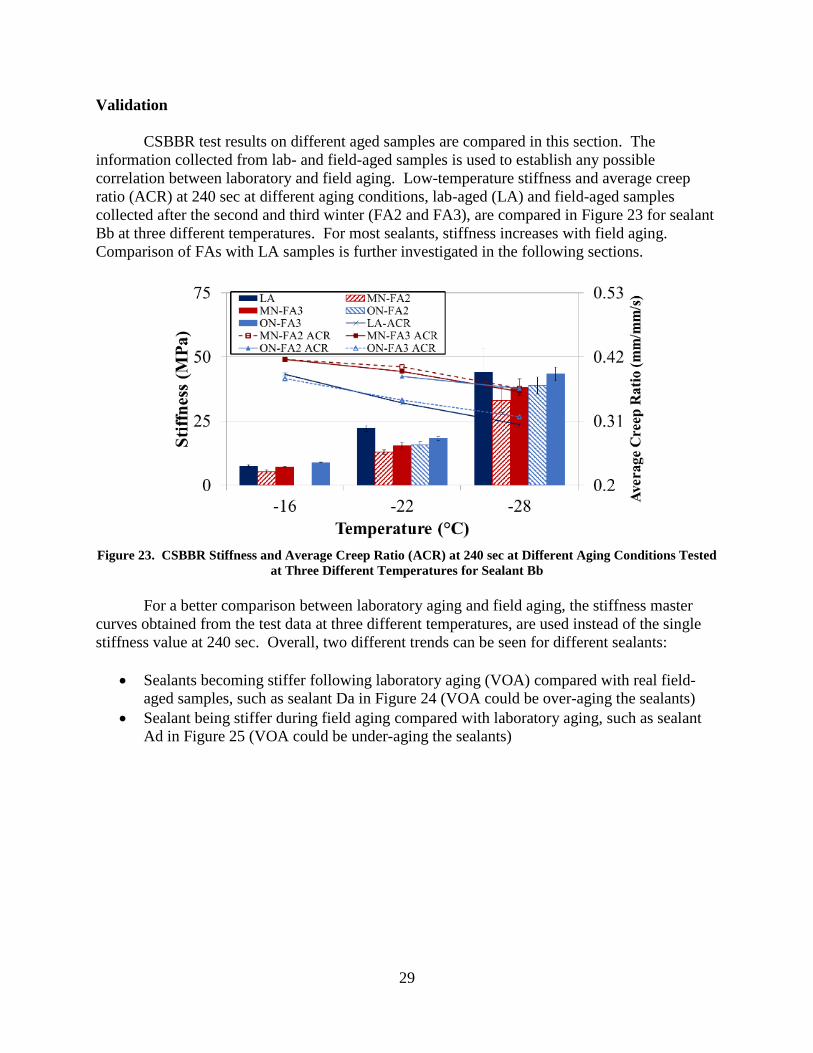
Validation
CSBBR test results on different aged samples are compared in this section. The
information collected from lab- and field-aged samples is used to establish any possible
correlation between laboratory and field aging. Low-temperature stiffness and average creep
ratio (ACR) at 240 sec at different aging conditions, lab-aged (LA) and field-aged samples
collected after the second and third winter (FA2 and FA3), are compared in Figure 23 for sealant
Bb at three different temperatures. For most sealants, stiffness increases with field aging.
Comparison of FAs with LA samples is further investigated in the following sections.
Figure 23. CSBBR Stiffness and Average Creep Ratio (ACR) at 240 sec at Different Aging Conditions Tested
at Three Different Temperatures for Sealant Bb
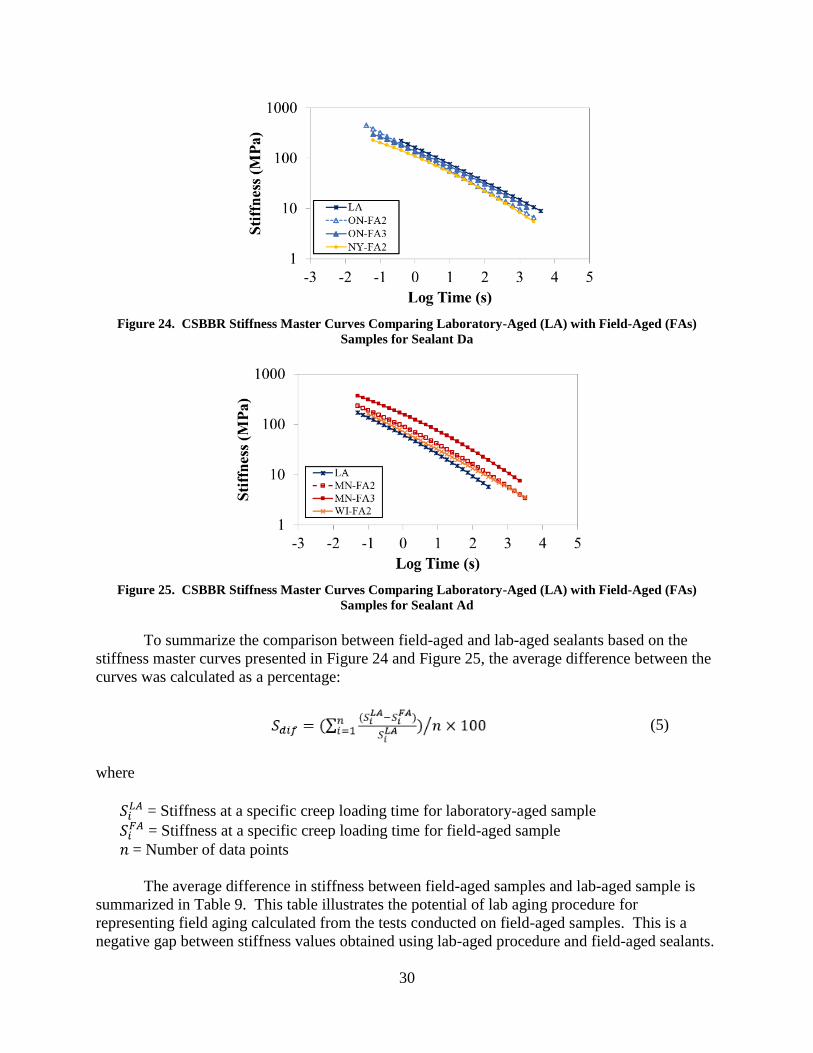
For a better comparison between laboratory aging and field aging, the stiffness master
curves obtained from the test data at three different temperatures, are used instead of the single
stiffness value at 240 sec. Overall, two different trends can be seen for different sealants:
Sealants becoming stiffer following laboratory aging (VOA) compared with real field-
aged samples, such as sealant Da in Figure 24 (VOA could be over-aging the sealants)
Sealant being stiffer during field aging compared with laboratory aging, such as sealant
Ad in Figure 25 (VOA could be under-aging the sealants)
30
Figure 24. CSBBR Stiffness Master Curves Comparing Laboratory-Aged (LA) with Field-Aged (FAs)
Samples for Sealant Da
Figure 25. CSBBR Stiffness Master Curves Comparing Laboratory-Aged (LA) with Field-Aged (FAs)
Samples for Sealant Ad
To summarize the comparison between field-aged and lab-aged sealants based on the
stiffness master curves presented in Figure 24 and Figure 25, the average difference between the
curves was calculated as a percentage:
(5)
where
𝑆𝑖𝐿𝐴 = Stiffness at a specific creep loading time for laboratory-aged sample
𝑆𝑖𝐹𝐴 = Stiffness at a specific creep loading time for field-aged sample
𝑛 = Number of data points
The average difference in stiffness between field-aged samples and lab-aged sample is
summarized in Table 9. This table illustrates the potential of lab aging procedure for
representing field aging calculated from the tests conducted on field-aged samples. This is a
negative gap between stiffness values obtained using lab-aged procedure and field-aged sealants.

31
The cells shaded with green are the ones with stiffness differences within ±10%, or LA stiffness
higher than field-aged samples, which are considered acceptable because it is conservative to
overestimate stiffness. The range of gap varies between approximately ±30% of field-aged
stiffness; with the majority of samples ranging within the ±10% difference band. There are some
sealants for which aging properties are underestimated by lab aging compared to the field aging.
These are the type of sealants one may consider changing the severity of aging protocol to
accelerate aging in the lab. On the other hand, lab aging overestimated the stiffness of several
other sealants. This is considered a conservative approach since those sealants will experience
more aging after the end of 3-year monitoring period. Therefore, having lab-aged sealants stiffer
than field-aged sealants is considered a conservative approach. Based on the number of
acceptable cases, the VOA procedure was able to satisfactorily represent field aging at a rate
higher than 70% of the cases.
The differences can be attributed to several factors. First, the samples collected from the
routs are homogenized in the lab, thus resulting in blended properties of sealants. It is shown
that field aging has a gradient starting from the surface. The properties of the bottom portion of
the sealant may remain unchanged or weakened due to moisture infiltration. Second, field
samples were collected from sites that were a maximum of 2.5 years old. As the materials
continue to be aged in the field, these properties may continue to change. Third, deicing
chemicals and salts may be another factor affecting the stiffness and adhesion properties in
addition to aging, which cannot be covered by the laboratory tests. Therefore, it should not be
expected to obtain one to one match between field and lab aged test results as there are various
factors that cannot be simulated in the lab. However, when the stiffness master curves obtained
from CSBBR test for field-aged samples and laboratory-aged samples are compared, it was
determined that VOA is a reasonable aging method for simulating 2 to 5 years of field aging.
Table 9. Comparison between Field-aged and Lab-aged Sealants based on Stiffness Master Curves
Illustrating the Change in their Stiffness as Compared to Lab-aged Stiffness
Sealant
Test Sites
Minnesota Ontario Wisconsin New
York
New
Hampshire
2nd
yr. 3rd
yr. 2nd
yr. 3rd
yr. 2nd
yr. 2nd
yr. 3rd
yr.
Ad -13.10% -32% - - -6.80% - -
Bb 5.90% 2.00% 1.60% 0.20% 27.40% - -
Ca - - - - - 6.50% -
Da - - 8.90% 3.30% - 11.80% -
Ed - - - - 11.30% - -16.60%
Fb -14.00% -3.80% - - 0.10% - -2.70%
Gd -1.50% 2.70% 1.60% -9.00% - - -7.10%
Hb 3.40% 0.20% - - - - -
Mb -2.70% 6.10% 3.20% 3.00% - - -
Nb -32.50% -17.30% - - - - -
Ob - - - - - -45.20% -13.00%
Pd - - -2.70% -6.20% -11.80% - -
Sd - - -10.50% -12.50% - - -

32
Validation of Laboratory Tests
This section summarizes the field performance and laboratory data results and presents
the correlation between the sets of data using statistical methods.
Dynamic Shear Rheometer
Laboratory Results
The sealants selected for testing at high temperature are summarized in Table 10.
According to the MSCR procedure, the sealant high-temperature grade was selected where C-
value (flow coefficient) was higher than 4.0 kPa.s and P-value (thinning coefficient) was higher
than 0.7. MSCR coefficients also show that the C-value is more critical for defining the high-
temperature grade than the P-value.
Table 10. Summary of High-Temperature Grade for Selected Sealants Used in this Study
Sealant ID
MSCR Parameters High-Temperature
Sealant Grade (°C) C-value
(kPa.s) P-value
Ad 4.4 0.91 70
Bb 4.8 0.92 64
Ca 4.6 0.96 70
Da 4.7 0.91 76
Ed 4.2 0.86 76
Gd 5.2 0.86 76
Jd 5.5 0.86 70
Ob 4.5 0.79 82
Pd1 NA NA 64
Sd 6.3 0.85 76
MI2
3 4.8 0.92 64
4 6.6 0.82 76
6 7.9 0.91 70
7 5.4 0.78 82
12 6.6 0.90 70
16 4.9 0.83 76 1 The grade for sealant Pd is predicted based on coefficients at 70°C.
2 Sealants from MI test site has identified by numbers and were used for field validation.
A typical result of the yield test conducted for sealant Ad at different temperatures is
presented in Figure 26. The tests were conducted at three different temperatures initially based
on the grade defined by the MSCR test. As temperature increases, the capacity of the material to
sustain shear loads decreases. Since the sealants do not exhibit a clear yielding point or cannot
be determined with only monotonic loading test, yield stress is selected as a threshold criterion at
specific strain levels (50%, 100%, and 200%).

33
Figure 26. Shear Stress vs. Strain for Sealant Ad at Three Different Temperatures
The two high-temperature grading methods are shown in Figure 27 by comparing the
shear stress values from the yield test at three strain levels and C-value from the MSCR test.
There is a reasonable correlation between the two test results. Based on the strain level (50%,
100%, or 200%), a threshold value for shear stress can be selected. For example, if a sealant is
tested at a specific temperature, and it has a shear stress higher than 180 Pa at 200% strain level,
the sealant will pass the criterion for that temperature. Therefore, it was concluded that the yield
test can be a good alternative for high-temperature grading of sealants if an appropriate level of
stiffness is selected. The stress level of 180 Pa at 200% strain level was selected as a threshold
since there is a more clear separation of pass and fail points indicating good consistency between
the two methods.
(a) at 50% strain level (b) at 100% strain level
(c) at 200% strain level
Figure 27. Shear Stress Threshold for Yield Testing at Different Strain Levels

34
Using the 180 kPa threshold at 200% strain, sealants were graded again for high
temperature and correlated with the grade defined by the MSCR test (Table 11). Good
correlation was noticed between the two tests. Eight sealants had the same grade defined by both
test methods.
Table 11. Crack Sealant High-Temperature Grades Using Yield Test and Correlating to MSCR Test
ID MSCR Grade
(°C)
Yield Grade
(°C) Agreement
Ad 70 70 Yes
Bb 64 76 No
Ca 70 70 Yes
Da 76 76 Yes
Ed 76 76 Yes
Gd 76 76 Yes
Jd 70 70 Yes
Ob 82 82 Yes
Pd 64 76 No
Sd 76 76 Yes
MI
3 64 64 Yes
4 76 76 Yes
6 70 70 Yes
7 82 82 Yes
12 70 70 Yes
16 76 70 No
Relationship Between Laboratory and Field Performance
Ambient air temperature for the Michigan sealants was monitored continuously using a
data acquisition system installed on the site. The average five hottest days in 2011, 2012, and
2013 are 34.9, 43.2, and 26.8oC, respectively. The performance index (PI) of the six selected
crack sealants installed in the Michigan test site was calculated from 2010 onward, as presented
in Figure 28 based on overband failure. Most sealant failures resulting from tracking occurred in
summer 2012. Sections 12 and 4 were the best performers among the selected sealants while
Section 16 was the worst performer, followed by Section 3.
The Michigan test site sealants were also evaluated for high-temperature grading using
both MSCR and yield test methods (Table 12). For five out of six sealants, both tests gave the
same high-temperature grade. The grade can also be correlated to the field performance as
presented in Figure 28 using the criteria considering overband wear. The sealants with PI lower
than 70% are categorized as poor performance for the clean and seal sections. For example,
sections with relatively low high-temperature grade such as 3 and 16 according to the yield test
method demonstrated fair and poor performance. However, the MSCR test showed a relatively
high grade for Section 16 (the worst performing section based on overband failure). However,
there are also some sealants (6 and 12) with relatively low high-temperature grade but good field
performance. The mechanisms of overband wear and it occurs at a wide range of temperatures
including winter time during plowing operations. Therefore, it is not expected to get a perfect
correlation between high-temperature grade and overband wear type of failure.

35
Figure 28. Performance Index of Sealants Based on Overband Failure
Table 12. Field and Lab Performance Correlation for Selected Sealants at Michigan Test Site
Test Section PI (%) Field
Performance
High-Temperature Grade (°C)
MSCR Test Yield Test
3 78.7 Fair 64 64
4 97.8 Good 76 76
6 94.3 Good 70 70
7 88.9 Good 82 82
12 99.6 Good 70 70
16 68.8 Poor 76 70
Using the DSR to determine sealants high-temperature grade, a good correlation was
observed for MSCR and yield test parameters with respect to their SG. Comparing the two tests
for high-temperature grade determination, the yield test is recommended as the performance test
in relation to both tracking resistance and overband wear due to its simplified approach.
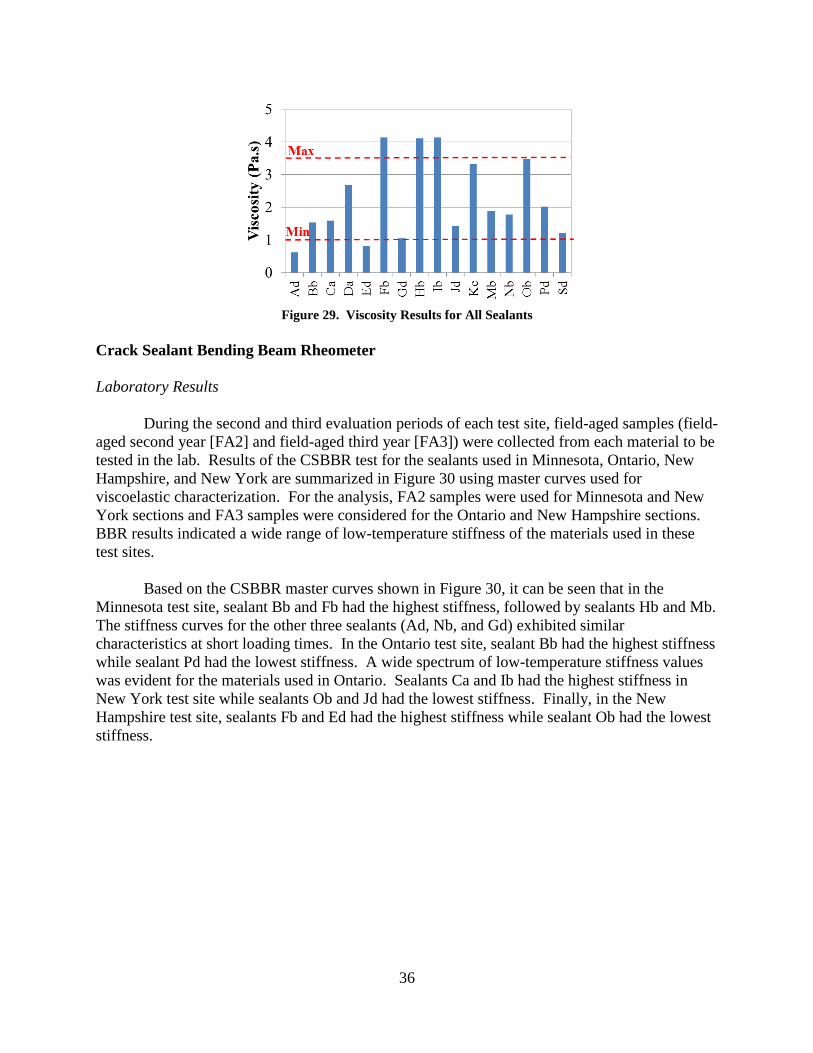
Viscosity
The apparent viscosity test results for all sealants are presented in Figure 29. Based on
field observations during installation, the thresholds showed reliability that could ensure
sufficient workability during installation at the recommended pouring temperature. However, it
is very important not to overheat or underheat sealants.
36
Figure 29. Viscosity Results for All Sealants
Crack Sealant Bending Beam Rheometer
Laboratory Results
During the second and third evaluation periods of each test site, field-aged samples (field-
aged second year [FA2] and field-aged third year [FA3]) were collected from each material to be
tested in the lab. Results of the CSBBR test for the sealants used in Minnesota, Ontario, New
Hampshire, and New York are summarized in Figure 30 using master curves used for
viscoelastic characterization. For the analysis, FA2 samples were used for Minnesota and New
York sections and FA3 samples were considered for the Ontario and New Hampshire sections.
BBR results indicated a wide range of low-temperature stiffness of the materials used in these
test sites.
Based on the CSBBR master curves shown in Figure 30, it can be seen that in the
Minnesota test site, sealant Bb and Fb had the highest stiffness, followed by sealants Hb and Mb.
The stiffness curves for the other three sealants (Ad, Nb, and Gd) exhibited similar
characteristics at short loading times. In the Ontario test site, sealant Bb had the highest stiffness
while sealant Pd had the lowest stiffness. A wide spectrum of low-temperature stiffness values
was evident for the materials used in Ontario. Sealants Ca and Ib had the highest stiffness in
New York test site while sealants Ob and Jd had the lowest stiffness. Finally, in the New
Hampshire test site, sealants Fb and Ed had the highest stiffness while sealant Ob had the lowest
stiffness.

37
(a) Minnesota test site (b) Ontario test site
(c) New York test site (d) New Hampshire test site
Figure 30. Stiffness Master Curves Obtained from CSBBR Test Results at -28°C for Sealants Used
in Different Test Sites
Relationship Between Laboratory and Field Performance
The field and lab performance of all sealants installed in the test sites are presented in
Table 13. It should be mentioned that the field performance of sealants is related to several
factors, including low-temperature stiffness and resistance to cohesive and adhesive failure.
Therefore, it was not expected to see a complete correlation between field and CSBBR data at
this point. However, for validating the CSBBR test method, the sealants with similar lab
performance were expected to be grouped in the same field performance subsets. The same
procedure of ranking and grouping was applied to the data collected from all test sites.
The following observations relate specifically to each site:
New York:
Two of the three soft sealants (Kc and Ob) in Subset A are in the same field performance
group (Subset C).
Sealants with high stiffness (Ib and Ca) are placed in the same group based on their field
performance (Subset A).

38
Table 13. Statistical Grouping of the Sealants in Test Sites Base on Their Field and Lab Performance
Sealant
ID
SG
(°C)
NY NH MN ON
Field
Performance
Lab Performance
(CSBBR)
Field
Performance
Lab Performance
(CSBBR)
Field
Performance
Lab Performance
(CSBBR)
Field
Performance
Lab Performance
(CSBBR)
PI
(%)
Statistical
Subset1
Stiffness
(MPa)
Statistical
Subset2
PI
(%)
Statistical
Subset
Stiffness
(MPa)
Statistical
Subset
PI
(%)
Statistical
Subset
Stiffness
(MPa)
Statistical
Subset
PI
(%)
Statistical
Subset
Stiffness
(MPa)
Statistical
Subset
Ca -16 20.2 A 119.5 D - - - - - - - - - - - -
Ib -22 15.1 A 83.1 C - - - - - - - - - - - -
Da -34 82.7 C 16.4 B - - - - - - - - 77.6 D 22.2 B
Jd -46 78.9 C 8.9 A,B - - - - - - - - - - - -
Kc -40 35.2 A, B 15.0 A, B 28.7 A,B 5.6 A,B - - - - - - - -
Ob -40 54.0 B 6.6 A 15.7 A 3.1 A - - - - - - - -
Ed -40 - - - - 48.8 C 14.3 C - - - - - - - -
Fb -34 - - - - 30.6 B 18.6 D 95.6 C 29.5 C - - - -
Gd -46 - - - - 39.2 B, C 7.1 B 47.0 A 5.7 A 59.2 B, C 7.3 A
Nb -46 - - - - - - - - 61.7 A, B 7.1 A - - - -
Hb -28 - - - - - - - - 63.7 A, B 17.6 B - - - -
Ad -46 - - - - - - - - 68.1 A, B 4.0 A - - - -
Mb -34 - - - - - - - - 77.3 B 7.0 A 58.1 B, C 7.1 A
Bb -28 - - - - - - - - 77.0 B 33.2 C 32.4 A 43.3 C
Pd -40 - - - - - - - - - - - - 43.7 A, B 7.1 A
Rb NA - - - - - - - - - - - - 69.3 C, D 24.1 B
Sd -40 - - - - - - - - - - - - 79.1 D 10.8 A 1 Statistical groups for field performance are represented with letters: “A” (lowest rank performer) to “C” or “D” (highest rank performer).
2 Statistical groups for lab performance are represented with letters: “A” (lowest stiffness) to “C” or “D” (highest stiffness).
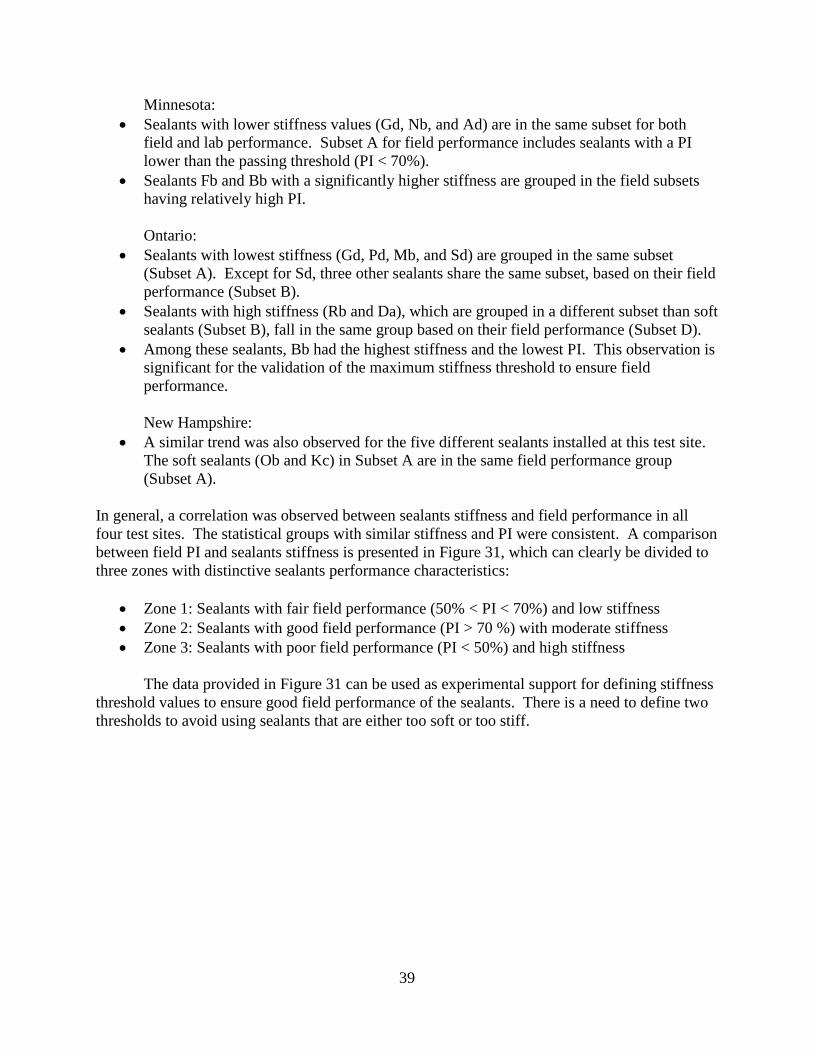
39
Minnesota:
Sealants with lower stiffness values (Gd, Nb, and Ad) are in the same subset for both
field and lab performance. Subset A for field performance includes sealants with a PI
lower than the passing threshold (PI < 70%).
Sealants Fb and Bb with a significantly higher stiffness are grouped in the field subsets
having relatively high PI.
Ontario:
Sealants with lowest stiffness (Gd, Pd, Mb, and Sd) are grouped in the same subset
(Subset A). Except for Sd, three other sealants share the same subset, based on their field
performance (Subset B).
Sealants with high stiffness (Rb and Da), which are grouped in a different subset than soft
sealants (Subset B), fall in the same group based on their field performance (Subset D).
Among these sealants, Bb had the highest stiffness and the lowest PI. This observation is
significant for the validation of the maximum stiffness threshold to ensure field
performance.
New Hampshire:
A similar trend was also observed for the five different sealants installed at this test site.
The soft sealants (Ob and Kc) in Subset A are in the same field performance group
(Subset A).
In general, a correlation was observed between sealants stiffness and field performance in all
four test sites. The statistical groups with similar stiffness and PI were consistent. A comparison
between field PI and sealants stiffness is presented in Figure 31, which can clearly be divided to
three zones with distinctive sealants performance characteristics:
Zone 1: Sealants with fair field performance (50% < PI < 70%) and low stiffness
Zone 2: Sealants with good field performance (PI > 70 %) with moderate stiffness
Zone 3: Sealants with poor field performance (PI < 50%) and high stiffness
The data provided in Figure 31 can be used as experimental support for defining stiffness
threshold values to ensure good field performance of the sealants. There is a need to define two
thresholds to avoid using sealants that are either too soft or too stiff.
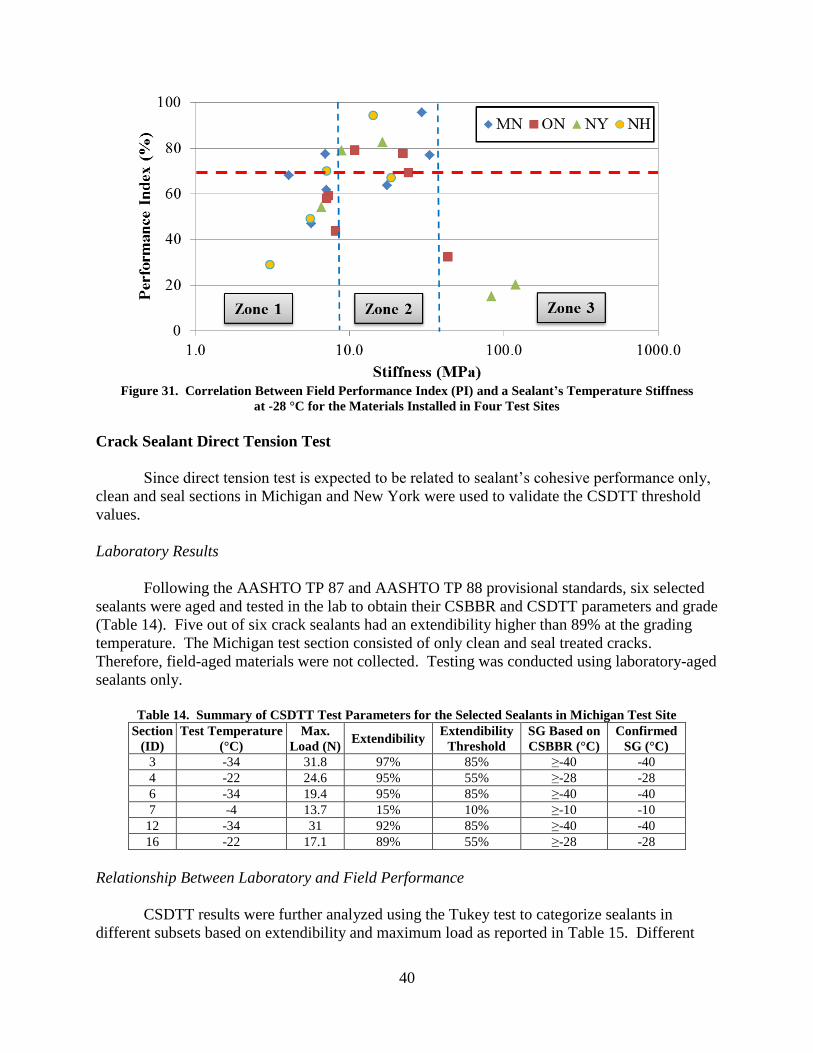
40
Figure 31. Correlation Between Field Performance Index (PI) and a Sealant’s Temperature Stiffness
at -28 °C for the Materials Installed in Four Test Sites
Crack Sealant Direct Tension Test
Since direct tension test is expected to be related to sealant’s cohesive performance only,
clean and seal sections in Michigan and New York were used to validate the CSDTT threshold
values.
Laboratory Results
Following the AASHTO TP 87 and AASHTO TP 88 provisional standards, six selected
sealants were aged and tested in the lab to obtain their CSBBR and CSDTT parameters and grade
(Table 14). Five out of six crack sealants had an extendibility higher than 89% at the grading
temperature. The Michigan test section consisted of only clean and seal treated cracks.
Therefore, field-aged materials were not collected. Testing was conducted using laboratory-aged
sealants only.
Table 14. Summary of CSDTT Test Parameters for the Selected Sealants in Michigan Test Site
Section
(ID)
Test Temperature
(°C)
Max.
Load (N) Extendibility
Extendibility
Threshold
SG Based on
CSBBR (°C)
Confirmed
SG (°C)
3 -34 31.8 97% 85% ≥-40 -40
4 -22 24.6 95% 55% ≥-28 -28
6 -34 19.4 95% 85% ≥-40 -40
7 -4 13.7 15% 10% ≥-10 -10
12 -34 31 92% 85% ≥-40 -40
16 -22 17.1 89% 55% ≥-28 -28
Relationship Between Laboratory and Field Performance
CSDTT results were further analyzed using the Tukey test to categorize sealants in
different subsets based on extendibility and maximum load as reported in Table 15. Different
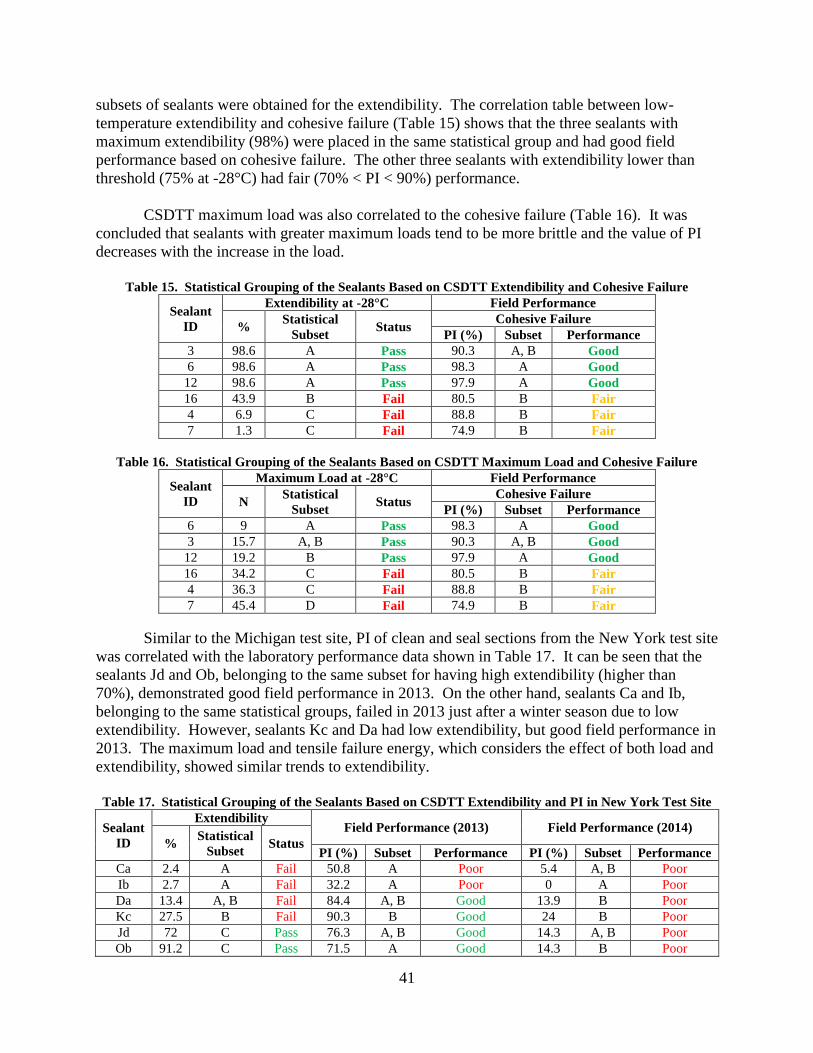
41
subsets of sealants were obtained for the extendibility. The correlation table between low-
temperature extendibility and cohesive failure (Table 15) shows that the three sealants with
maximum extendibility (98%) were placed in the same statistical group and had good field
performance based on cohesive failure. The other three sealants with extendibility lower than
threshold (75% at -28°C) had fair (70% < PI < 90%) performance.
CSDTT maximum load was also correlated to the cohesive failure (Table 16). It was
concluded that sealants with greater maximum loads tend to be more brittle and the value of PI
decreases with the increase in the load.
Table 15. Statistical Grouping of the Sealants Based on CSDTT Extendibility and Cohesive Failure
Sealant
ID
Extendibility at -28°C Field Performance
% Statistical
Subset Status
Cohesive Failure
PI (%) Subset Performance
3 98.6 A Pass 90.3 A, B Good
6 98.6 A Pass 98.3 A Good
12 98.6 A Pass 97.9 A Good
16 43.9 B Fail 80.5 B Fair
4 6.9 C Fail 88.8 B Fair
7 1.3 C Fail 74.9 B Fair
Table 16. Statistical Grouping of the Sealants Based on CSDTT Maximum Load and Cohesive Failure
Sealant
ID
Maximum Load at -28°C Field Performance
N Statistical
Subset Status
Cohesive Failure
PI (%) Subset Performance
6 9 A Pass 98.3 A Good
3 15.7 A, B Pass 90.3 A, B Good
12 19.2 B Pass 97.9 A Good
16 34.2 C Fail 80.5 B Fair
4 36.3 C Fail 88.8 B Fair
7 45.4 D Fail 74.9 B Fair
Similar to the Michigan test site, PI of clean and seal sections from the New York test site
was correlated with the laboratory performance data shown in Table 17. It can be seen that the
sealants Jd and Ob, belonging to the same subset for having high extendibility (higher than
70%), demonstrated good field performance in 2013. On the other hand, sealants Ca and Ib,
belonging to the same statistical groups, failed in 2013 just after a winter season due to low
extendibility. However, sealants Kc and Da had low extendibility, but good field performance in
2013. The maximum load and tensile failure energy, which considers the effect of both load and
extendibility, showed similar trends to extendibility.
Table 17. Statistical Grouping of the Sealants Based on CSDTT Extendibility and PI in New York Test Site
Sealant
ID
Extendibility Field Performance (2013) Field Performance (2014)
% Statistical
Subset Status
PI (%) Subset Performance PI (%) Subset Performance
Ca 2.4 A Fail 50.8 A Poor 5.4 A, B Poor
Ib 2.7 A Fail 32.2 A Poor 0 A Poor
Da 13.4 A, B Fail 84.4 A, B Good 13.9 B Poor
Kc 27.5 B Fail 90.3 B Good 24 B Poor
Jd 72 C Pass 76.3 A, B Good 14.3 A, B Poor
Ob 91.2 C Pass 71.5 A Good 14.3 B Poor
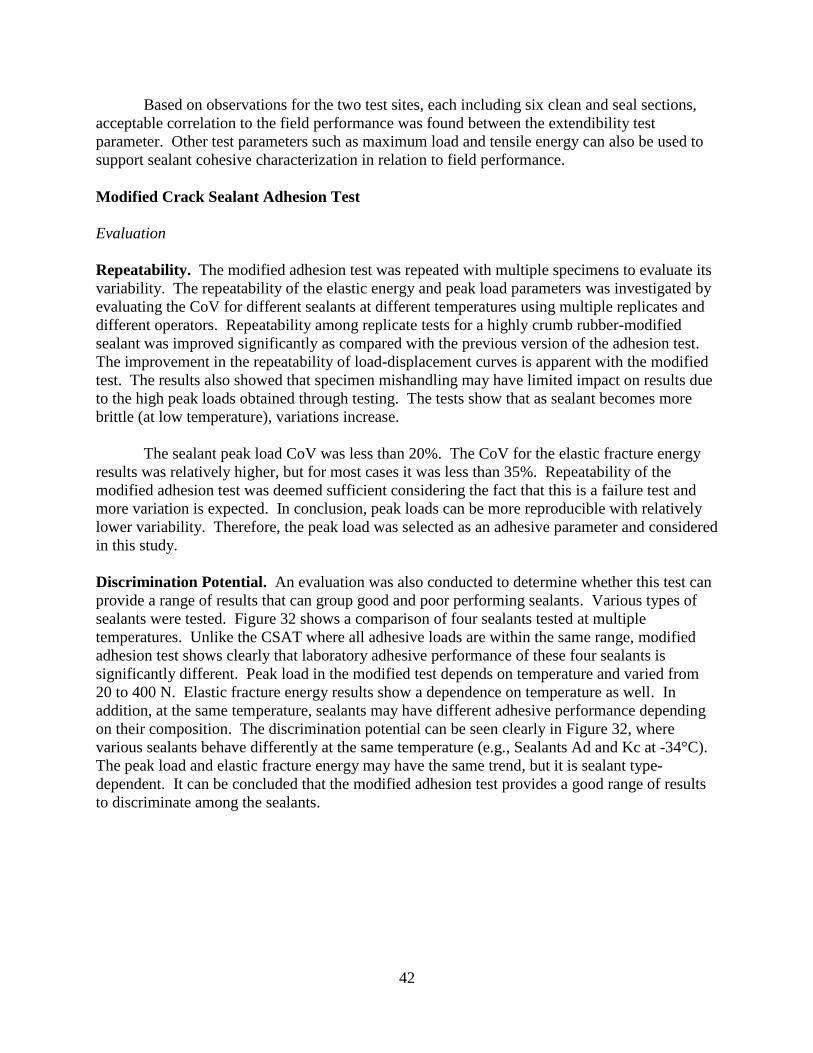
42
Based on observations for the two test sites, each including six clean and seal sections,
acceptable correlation to the field performance was found between the extendibility test
parameter. Other test parameters such as maximum load and tensile energy can also be used to
support sealant cohesive characterization in relation to field performance.
Modified Crack Sealant Adhesion Test
Evaluation
Repeatability. The modified adhesion test was repeated with multiple specimens to evaluate its
variability. The repeatability of the elastic energy and peak load parameters was investigated by
evaluating the CoV for different sealants at different temperatures using multiple replicates and
different operators. Repeatability among replicate tests for a highly crumb rubber-modified
sealant was improved significantly as compared with the previous version of the adhesion test.
The improvement in the repeatability of load-displacement curves is apparent with the modified
test. The results also showed that specimen mishandling may have limited impact on results due
to the high peak loads obtained through testing. The tests show that as sealant becomes more
brittle (at low temperature), variations increase.
The sealant peak load CoV was less than 20%. The CoV for the elastic fracture energy
results was relatively higher, but for most cases it was less than 35%. Repeatability of the
modified adhesion test was deemed sufficient considering the fact that this is a failure test and
more variation is expected. In conclusion, peak loads can be more reproducible with relatively
lower variability. Therefore, the peak load was selected as an adhesive parameter and considered
in this study.
Discrimination Potential. An evaluation was also conducted to determine whether this test can
provide a range of results that can group good and poor performing sealants. Various types of
sealants were tested. Figure 32 shows a comparison of four sealants tested at multiple
temperatures. Unlike the CSAT where all adhesive loads are within the same range, modified
adhesion test shows clearly that laboratory adhesive performance of these four sealants is
significantly different. Peak load in the modified test depends on temperature and varied from
20 to 400 N. Elastic fracture energy results show a dependence on temperature as well. In
addition, at the same temperature, sealants may have different adhesive performance depending
on their composition. The discrimination potential can be seen clearly in Figure 32, where
various sealants behave differently at the same temperature (e.g., Sealants Ad and Kc at -34°C).
The peak load and elastic fracture energy may have the same trend, but it is sealant type-
dependent. It can be concluded that the modified adhesion test provides a good range of results
to discriminate among the sealants.
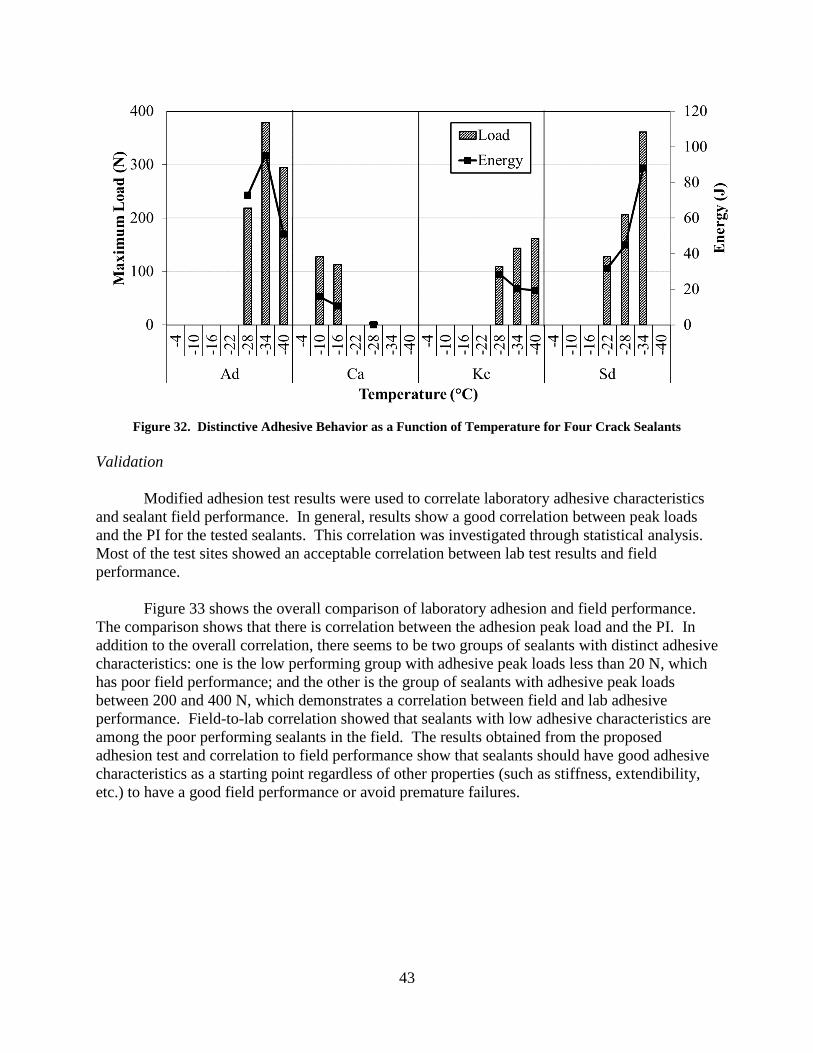
43
Figure 32. Distinctive Adhesive Behavior as a Function of Temperature for Four Crack Sealants
Validation
Modified adhesion test results were used to correlate laboratory adhesive characteristics
and sealant field performance. In general, results show a good correlation between peak loads
and the PI for the tested sealants. This correlation was investigated through statistical analysis.
Most of the test sites showed an acceptable correlation between lab test results and field
performance.
Figure 33 shows the overall comparison of laboratory adhesion and field performance.
The comparison shows that there is correlation between the adhesion peak load and the PI. In
addition to the overall correlation, there seems to be two groups of sealants with distinct adhesive
characteristics: one is the low performing group with adhesive peak loads less than 20 N, which
has poor field performance; and the other is the group of sealants with adhesive peak loads
between 200 and 400 N, which demonstrates a correlation between field and lab adhesive
performance. Field-to-lab correlation showed that sealants with low adhesive characteristics are
among the poor performing sealants in the field. The results obtained from the proposed
adhesion test and correlation to field performance show that sealants should have good adhesive
characteristics as a starting point regardless of other properties (such as stiffness, extendibility,
etc.) to have a good field performance or avoid premature failures.

44
Figure 33. Correlation between Performance Index and Adhesion Peak Load
DISCUSSION
Field Performance in Relation to Laboratory Test Results
Generally Observed Trends
Low-temperature test parameters and their expected relationships with field performance
are summarized in Table 18. Cohesive failure was the main failure type observed in clean and
seal treatments, while adhesive failure was the main failure type observed in rout and seal
treatments. Field correlation results showed that the CSBBR parameters (stiffness and ACR) are
related to good sealant durability. Thus, higher relaxation potential (represented by high ACR
values) is required to ensure a good flexibility rate of the material against deformation. Stiffness
is the major characteristic that reduces the stress build up during crack movements within the
material, material interface, and rout wall. The parameters obtained from the CSBBR test could
be related to both adhesive and cohesive failures as the stiffness parameter also reflects the
overall characteristics of sealants related to formulations and field performance.
The CSAT simulates adhesion performance in the rout and seal configurations. The
parameters that can be obtained are maximum adhesion load and interfacial energy. Higher peak
loads and higher adhesive energy are desired for a good bonding between the sealant and rout
wall. Finally, CSDTT test method is needed to ensure good cohesive properties of the sealants
for clean and seal treatments. Therefore, high extendibility and tensile energy should result in
better field performance. Field observations support the following grading schemes for the two
types of sealing treatments:
Rout and seal: Primary test is the CSBBR test (stiffness and ACR parameters) and
secondary test is the adhesion test (the CSAT and maximum adhesion load parameter)
Clean and seal: Primary test is the CSBBR test (stiffness and ACR parameters) and
secondary test is the direct tension test (the CSDTT and extendibility parameter)

45
Table 18. Test Parameters and Expected Trends with Field Performance
Test Method Test
Parameter
Expected Trend with
Field Performance Mechanism Application
CSBBR
(AASHTO
TP 87)
Stiffness at
240 sec Inverse
Increasing stiffness and
higher stresses in the sealant
Required for both rout
& seal and clean &
seal
Average
Creep Rate Proportional
Lower ACR and higher
stresses in the sealant
Required for both rout
& seal and clean &
seal
CSAT
(AASHTO
TP 89)
Peak Load Proportional
Increasing adhesive load and
stronger bond between
sealant and rout’s wall
Required for rout &
seal
Interfacial
Energy
(optional)
Proportional Increasing energy and work
of adhesion
Required for rout &
seal
CSDTT
(AASHTO
TP 88)
Extendibility Proportional High elongations and large
crack openings
Required for clean &
seal
Dissipated
Energy
(optional)
Proportional Increasing energy and better
tensile work
Required for clean &
seal
Based on the laboratory performance and correlation with field performance, sealants
were categorized into three general groups. Table 19 presents the average climatic conditions
observed in the majority of test site installations to illustrate the most critical testing parameters
that have a defining role in the field performance. It appears that adhesion and stiffness are the
two most critical parameters. In general, it was observed that when adhesion capacity is low, the
risk of premature failure is high, accompanied by crack openings as well as excessive stiff
characteristics of sealants (2 or more grades warmer). The best performing sealants are the ones
with high adhesion capacity and moderate stiffness, depending on the climate they are installed
in. The medium performing group are those with soft sealants (1 or 2 grades colder) and
moderate adhesion. Additional mobility was observed in this group, thus indicating moving
upward and downwards in the ranks depending on the installation quality and on-site conditions
affecting crack movements such as crack length and pavement type and materials.
Another observation from the information provided in the table is the correlation between
adhesion and stiffness. As sealant stiffness increases or decreases, adhesion capacity changes
indicating an optimum adhesion performance that can be obtained from sealant formulation. In
Table 19 the first group includes sealants with poor field performance (PI < 50%). These
sealants had some common characteristics. Depending on the site they were installed in, the
sealants in this group demonstrated high stiffness and low adhesive properties. The majority of
sealants were in the second group with fair field performance (50% < PI < 70%). Most of these
sealants have low stiffness (except Fb and Ed) with respect to test site requirements. Except for
sealant Pd, the sealants in this group have an acceptable adhesive load at the test site temperature.
Therefore, their fair performance can be related to the low stiffness and resistance to wear and
abrasion. Low CSBBR stiffness means low resistance against plows and early failure of the
overband, which exposes the sealant and rout interface and potentially accelerates adhesive
failure. It is important to note that the performance of some sealants in this category could be
lower or higher depending on the on-site conditions such as crack length, pavement and initial
crack condition, as well as the installation quality. The third group includes sealants that have
moderate stiffness and good adhesive performance. This is the ideal combination for a sealant to

46
survive longer in the field. Subsequently, these sealants also have good field performance (PI >
70%).
Table 19. Overall Sealant Grouping Based on Expected Field Performance for Sites at Moderately Cold
Climate Regions (-28 to -34 °C)
Sealant
ID Test Site
Field
Performance
Adhesion
Load
Stiffness
Property Remarks
Bb ON, MN, WI
Group 1:
Poor (PI less
than 50%)
Low High Sealants having high stiffness AND
low adhesive capacity. Failure
mechanism could be due to low
adhesion or excessive stiffness with
respect to the climate they are installed.
Ca NY Low High
Hb MN Low High
Ib NY Low High
Kc NY, NH Low High
Ad MN, WI
Group 2: Fair
(PI between
50% and
70%)
Medium Low
Sealants with low stiffness AND
moderate adhesion capacity. Overband
failure common in those sealants.
Some mobility upwards or downwards
is expected with installation quality and
on-site conditions
Ed2
NH, WI Medium Low
Fb2
MN, NH, WI Medium Medium
Gd MN, ON, NH Medium Low
Mb MN, ON Medium Low
Nb MN Medium Low
Ob NH, NY Medium Low
Pd1
ON, WI Low Low
Sd ON Group 3:
Good (PI
higher than
70%)
High Medium Sealants with moderate stiffness AND
good adhesion capacity. Candidates for
the best performance for this climate.
Da ON, NY High Medium
Jd NY High Medium
Rb ON High Medium 1 Sealant Pd can switch to a low performing type depending on the on-site conditions and installation quality.
2 Sealants Fb and Ed were among the relatively high performing subset of medium performing sealants. Depending
on the on-site conditions and installation quality, these two sealants can switch to high performing group.
Correlation Score
A holistic evaluation method is required to evaluate which laboratory test methods have
the best correlation to field performance. Different statistical tests were used to develop a
composite score and to establish a quantitative correlation based on sealant field performance (PI)
compared with different parameters, such as flexural stiffness and ACR from the CSBBR
method, peak load from CSAT method, and peak load and extendibility from CSDTT method.
Two different statistical correlation techniques were used: Kendall’s tau-b, and regression (linear
or quadratic). Kendall’s tau-b is a test for independence and correlates PI with test parameters
based on ranking. The regression method correlates field and lab based on their values. The
Kendall’s tau-b measure of association is a distribution-free, or non-parametric, rank correlation
parameter. The Kendall’s parameter is better suited to small datasets than is the correlation
coefficient, R, or the coefficient of determination, R2, which are more appropriate for larger
datasets.

47
The composite score is developed based on Gibson et al. (2012) as follows:
(6)
where
CS = Composite score (0 for no correlation and 1 for complete correlation)
𝑅 = Regression coefficient
𝜏𝐾= Kendall’s tau-b measure of association score, -1 < 𝜏𝐾< 1
𝑃𝑅= ANOVA significance of the regression slope
𝑃𝐾= Significance of the Kendall’s tau-b association
Using these parameters, the composite score is calculated for clean and seal as well as
rout and seal sections. For rout and seal sections, the scores of CSAT and CSBBR parameters
were evaluated while for clean and seal sections the scores were calculated for CSDTT and
CSBBR parameters. The following thresholds were used to identify satisfactory levels of
correlation. A score higher than 0.60 is considered acceptable; if the score is higher than 0.80,
then a strong correlation between the parameters is assumed. Composite scores for different test
parameters with their corresponding PI are presented in Figure 34. The low-temperature
stiffness parameter obtained from the CSBBR test (Figure 34a) has a strong correlation with the
field performance (except the Minnesota test site, which has an acceptable correlation score).
However, the score for ACR is either acceptable or poor. Adhesion peak load and energy,
except for the sealants at the Minnesota test site, have an acceptable or a strong correlation score
with the field performance (Figure 34b).
For the clean and seal sections, the composite score is calculated for the parameters
obtained from CSDTT and CSBBR methods for New York and Michigan test sites. The scores
presented in Figure 34c shows that, similar to the rout and seal sections, stiffness has a strong
correlation with field performance. However, ACR either had a strong or very poor score. For
the CSDTT test parameters, both peak load and extendibility had an acceptable or strong score.
48
(a) CSBBR test parameters score compared with rout and seal (R&S) PI
(b) CSAT test parameters compared with rout and seal (R&S) PI
(c) CSBBR and CSDTT test parameters compared with clean and seal (C&S) PI
Figure 34. Composite Score Correlating Test Parameters with PI for R&S and C&S Sections
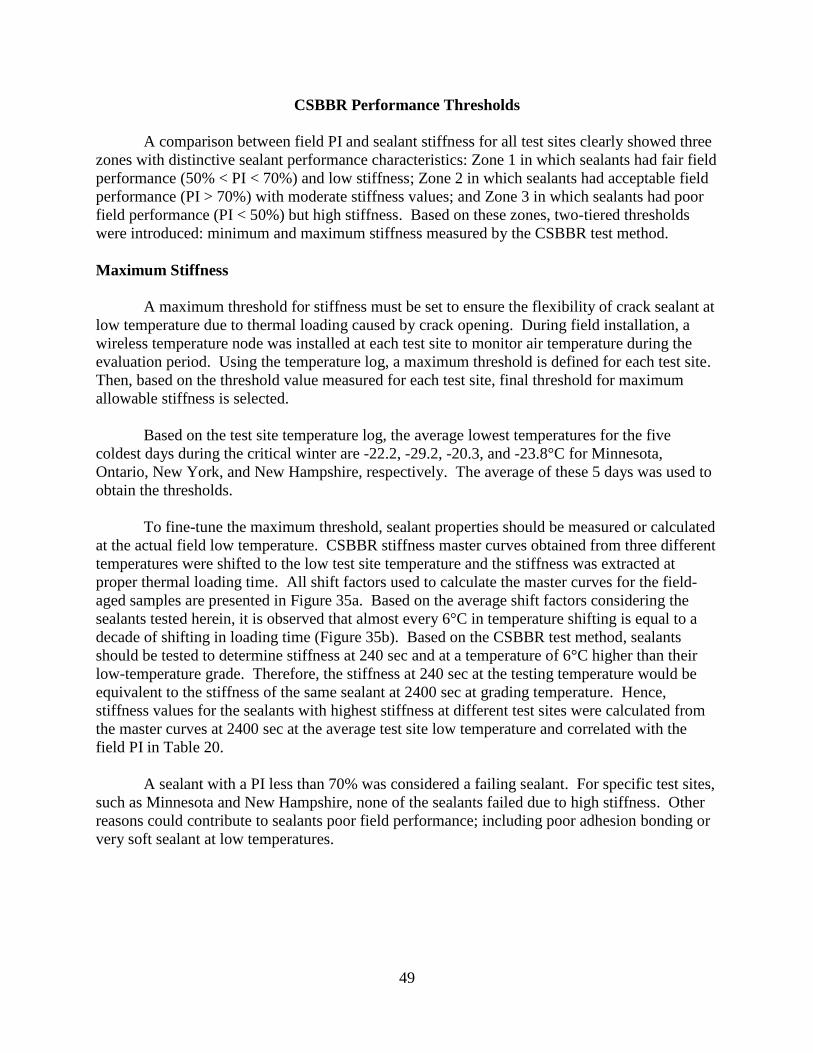
49
CSBBR Performance Thresholds
A comparison between field PI and sealant stiffness for all test sites clearly showed three
zones with distinctive sealant performance characteristics: Zone 1 in which sealants had fair field
performance (50% < PI < 70%) and low stiffness; Zone 2 in which sealants had acceptable field
performance (PI > 70%) with moderate stiffness values; and Zone 3 in which sealants had poor
field performance (PI < 50%) but high stiffness. Based on these zones, two-tiered thresholds
were introduced: minimum and maximum stiffness measured by the CSBBR test method.
Maximum Stiffness
A maximum threshold for stiffness must be set to ensure the flexibility of crack sealant at
low temperature due to thermal loading caused by crack opening. During field installation, a
wireless temperature node was installed at each test site to monitor air temperature during the
evaluation period. Using the temperature log, a maximum threshold is defined for each test site.
Then, based on the threshold value measured for each test site, final threshold for maximum
allowable stiffness is selected.
Based on the test site temperature log, the average lowest temperatures for the five
coldest days during the critical winter are -22.2, -29.2, -20.3, and -23.8°C for Minnesota,
Ontario, New York, and New Hampshire, respectively. The average of these 5 days was used to
obtain the thresholds.
To fine-tune the maximum threshold, sealant properties should be measured or calculated
at the actual field low temperature. CSBBR stiffness master curves obtained from three different
temperatures were shifted to the low test site temperature and the stiffness was extracted at
proper thermal loading time. All shift factors used to calculate the master curves for the field-
aged samples are presented in Figure 35a. Based on the average shift factors considering the
sealants tested herein, it is observed that almost every 6°C in temperature shifting is equal to a
decade of shifting in loading time (Figure 35b). Based on the CSBBR test method, sealants
should be tested to determine stiffness at 240 sec and at a temperature of 6°C higher than their
low-temperature grade. Therefore, the stiffness at 240 sec at the testing temperature would be
equivalent to the stiffness of the same sealant at 2400 sec at grading temperature. Hence,
stiffness values for the sealants with highest stiffness at different test sites were calculated from
the master curves at 2400 sec at the average test site low temperature and correlated with the
field PI in Table 20.
A sealant with a PI less than 70% was considered a failing sealant. For specific test sites,
such as Minnesota and New Hampshire, none of the sealants failed due to high stiffness. Other
reasons could contribute to sealants poor field performance; including poor adhesion bonding or
very soft sealant at low temperatures.
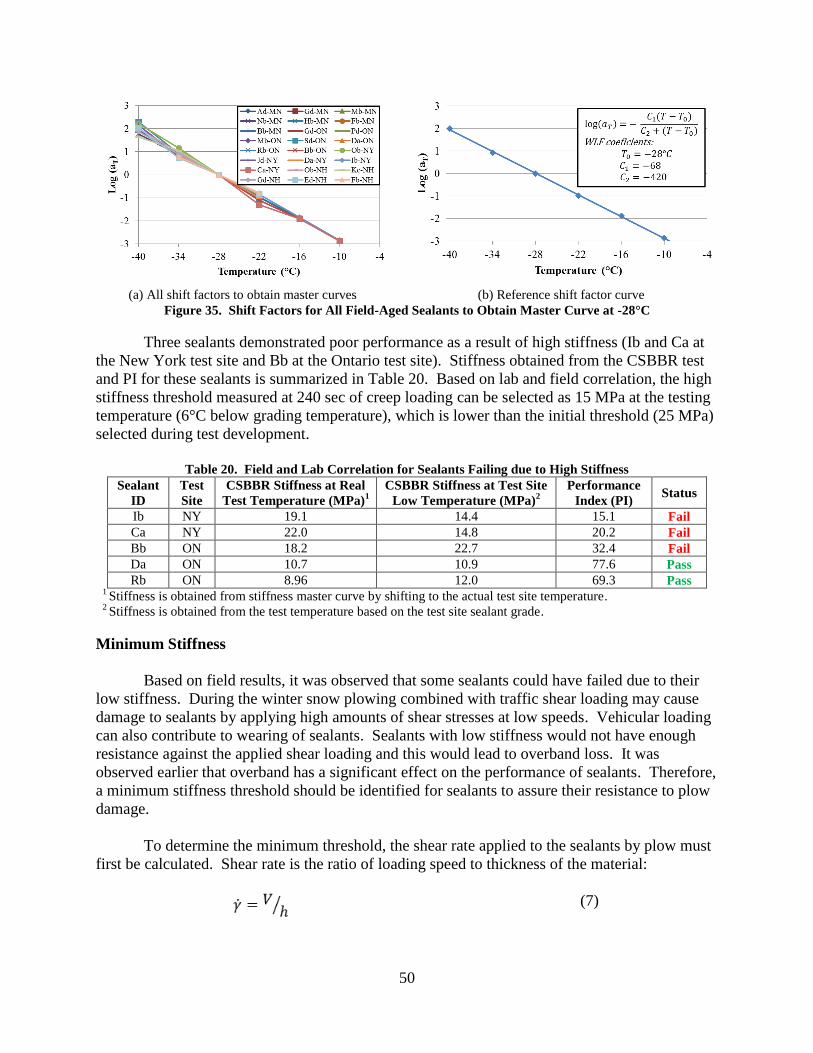
50
(a) All shift factors to obtain master curves (b) Reference shift factor curve
Figure 35. Shift Factors for All Field-Aged Sealants to Obtain Master Curve at -28°C
Three sealants demonstrated poor performance as a result of high stiffness (Ib and Ca at
the New York test site and Bb at the Ontario test site). Stiffness obtained from the CSBBR test
and PI for these sealants is summarized in Table 20. Based on lab and field correlation, the high
stiffness threshold measured at 240 sec of creep loading can be selected as 15 MPa at the testing
temperature (6°C below grading temperature), which is lower than the initial threshold (25 MPa)
selected during test development.
Table 20. Field and Lab Correlation for Sealants Failing due to High Stiffness
Sealant
ID
Test
Site
CSBBR Stiffness at Real
Test Temperature (MPa)1
CSBBR Stiffness at Test Site
Low Temperature (MPa)2
Performance
Index (PI) Status
Ib NY 19.1 14.4 15.1 Fail
Ca NY 22.0 14.8 20.2 Fail
Bb ON 18.2 22.7 32.4 Fail
Da ON 10.7 10.9 77.6 Pass
Rb ON 8.96 12.0 69.3 Pass 1
Stiffness is obtained from stiffness master curve by shifting to the actual test site temperature. 2
Stiffness is obtained from the test temperature based on the test site sealant grade.
Minimum Stiffness
Based on field results, it was observed that some sealants could have failed due to their
low stiffness. During the winter snow plowing combined with traffic shear loading may cause
damage to sealants by applying high amounts of shear stresses at low speeds. Vehicular loading
can also contribute to wearing of sealants. Sealants with low stiffness would not have enough
resistance against the applied shear loading and this would lead to overband loss. It was
observed earlier that overband has a significant effect on the performance of sealants. Therefore,
a minimum stiffness threshold should be identified for sealants to assure their resistance to plow
damage.
To determine the minimum threshold, the shear rate applied to the sealants by plow must
first be calculated. Shear rate is the ratio of loading speed to thickness of the material:
(7)

51
Assuming a plow speed of 8.94 m/sec (20 mph) and a typical rout depth of 20 mm, the
shear rate will be 447 sec-1
. Hence, loading time will be equal to 0.0022 sec. The minimum
threshold is obtained by correlating the stiffness values identified from the CSBBR master
curves at low temperature with the PI. The summary of field and lab data for the sealants failing
due to their low stiffness in all test sites is presented in Table 21. Based on these results, the
minimum stiffness can be defined as 210 MPa at real loading time (0.0022 sec). Stiffness of
sealants to withstand loading rate applied by plows was extracted from the master curves
developed using the CSBBR test. A practical loading time in the CSBBR test is then needed to
correlate with relatively fast loading rates applied in the field and resulting in overband wear.
Thus, the corresponding stiffness in the CSBBR is also calculated in the first second at the
testing temperature that represents sealants resistance to faster loading rates (Table 21). Based
on the lab and field correlation, it can be concluded that the low stiffness threshold measured at 1
sec of creep loading should be more than 40 MPa at the testing temperature.
Table 21. Field and Lab Correlation for Sealants Failing Due to Low Stiffness
Sealant ID Test Site PI (%)
CSBBR Stiffness
(MPa) at 0.0022 sec at
Real Temperature1
CSBBR Stiffness
(MPa) at 1 sec at
Test Temperature2
Status
Ob NY 54.0 128.8 18 Fail
Gd MN 47.0 194.0 39 Fail
Nb MN 61.7 168.8 21 Fail
Ad MN 68.1 157.0 < 40 Fail
Sd ON 79.1 > 750 92 Pass
Mb MN 77.3 244.4 74 Pass
Da NY 82.7 266.2 69 Pass 1
Stiffness is obtained from stiffness master curve by shifting to the actual test site temperature. 2
Stiffness is obtained from the test temperature based on the test site sealant grade.
CSDTT Performance Thresholds
Similar to the CSBBR test method, CSDTT was validated using the correlation of field
and lab performance. Then, the parameters and thresholds were fine-tuned using the same field
performance and laboratory performance data of sealants.
Field and lab correlation showed that sealants passing the extendibility threshold also
performed well in the field. However, field and lab correlation showed that some sealants may
fail the extendibility threshold, but have acceptable field performance (sealant Kc and Da in New
York test site). In this case, the load can be defined as a secondary threshold. CSDTT tensile
load might indicate sealant brittleness; the higher the tensile load, the more brittle the sealant.
Brittle sealants are not appropriate for clean and seal treatment. Peak tensile load for the sealants
treated as clean and seal is plotted based on their PI in Figure 36. This plot shows that sealants
with a peak tensile load higher than 25 N had poor field performance; this value could be used as
an additional optional threshold for the CSDTT method.

52
Figure 36. Sealants CSDTT Tensile Load vs. Performance Index
CSAT Performance Thresholds
The new adhesion test showed that there is very good correlation between the peak
adhesion load and field performance. Previously, the threshold was set at 50 N for all sealants at
all temperatures. Due to unpredictable changes in sealant adhesion load with temperature and
changing interfacial loads with decreasing temperatures, a single value of threshold was deemed
inappropriate. A multi-temperature testing and corresponding threshold is adopted similar to
CSBBR protocol. To simplify the characterization process, an envelope type of threshold was
suggested for peak loads.
In colder temperatures, pavement openings enlarge. This enlargement induces stresses
within the sealant as well as to the interface. While these stresses are negligible to the pavement
itself, they are significant for the low modulus sealants. These stresses increase as the
temperature drops. For good sealant performance, sealants should acquire certain adhesive and
cohesive characteristics to withstand these stresses. Adhesive failures occur when the interface
stresses exceed the capacity of the interface adhesion (sealant-to-pavement wall). Since
pavement opening is the driving factor, the sealant and the interface are exposed to larger
displacements at colder temperatures. A sealant’s ability to expand reduces as the temperature
drops. This induces larger interface strains to accommodate the larger pavement opening at
colder temperature, thus generating higher interface stresses and rendering sealants more prone
to adhesion failures. As a result, the suggested approach was to assign a lower threshold at
higher temperatures since the interface loads are lower compared with cold temperatures.
Further investigation and correlating with sealant field performance revealed that the
threshold is capable of capturing the worst sealants in the field. The selected threshold is shown
in Figure 37 and presented in Table 22.
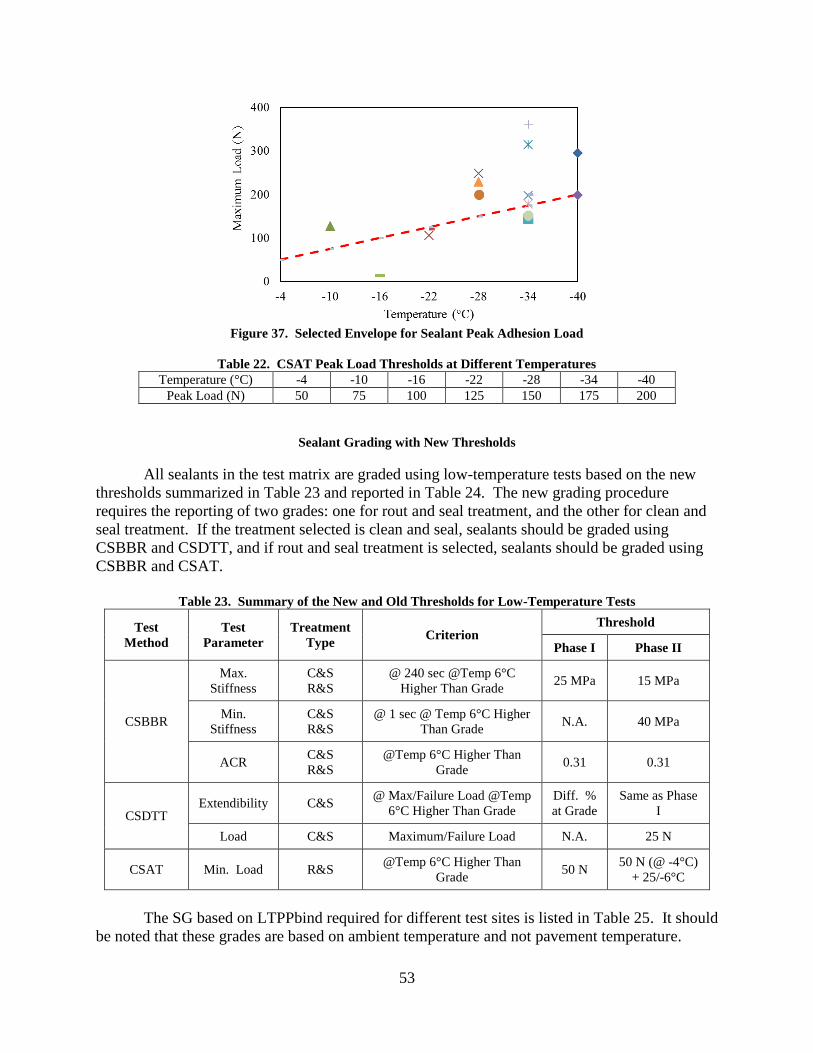
53
Figure 37. Selected Envelope for Sealant Peak Adhesion Load
Table 22. CSAT Peak Load Thresholds at Different Temperatures
Temperature (°C) -4 -10 -16 -22 -28 -34 -40
Peak Load (N) 50 75 100 125 150 175 200
Sealant Grading with New Thresholds
All sealants in the test matrix are graded using low-temperature tests based on the new
thresholds summarized in Table 23 and reported in Table 24. The new grading procedure
requires the reporting of two grades: one for rout and seal treatment, and the other for clean and
seal treatment. If the treatment selected is clean and seal, sealants should be graded using
CSBBR and CSDTT, and if rout and seal treatment is selected, sealants should be graded using
CSBBR and CSAT.
Table 23. Summary of the New and Old Thresholds for Low-Temperature Tests
Test
Method
Test
Parameter
Treatment
Type Criterion
Threshold
Phase I Phase II
CSBBR
Max.
Stiffness
C&S
R&S
@ 240 sec @Temp 6°C
Higher Than Grade 25 MPa 15 MPa
Min.
Stiffness
C&S
R&S
@ 1 sec @ Temp 6°C Higher
Than Grade N.A. 40 MPa
ACR C&S
R&S
@Temp 6°C Higher Than
Grade 0.31 0.31
CSDTT Extendibility C&S
@ Max/Failure Load @Temp
6°C Higher Than Grade
Diff. %
at Grade
Same as Phase
I
Load C&S Maximum/Failure Load N.A. 25 N
CSAT Min. Load R&S @Temp 6°C Higher Than
Grade 50 N
50 N (@ -4°C)
+ 25/-6°C
The SG based on LTPPbind required for different test sites is listed in Table 25. It should
be noted that these grades are based on ambient temperature and not pavement temperature.
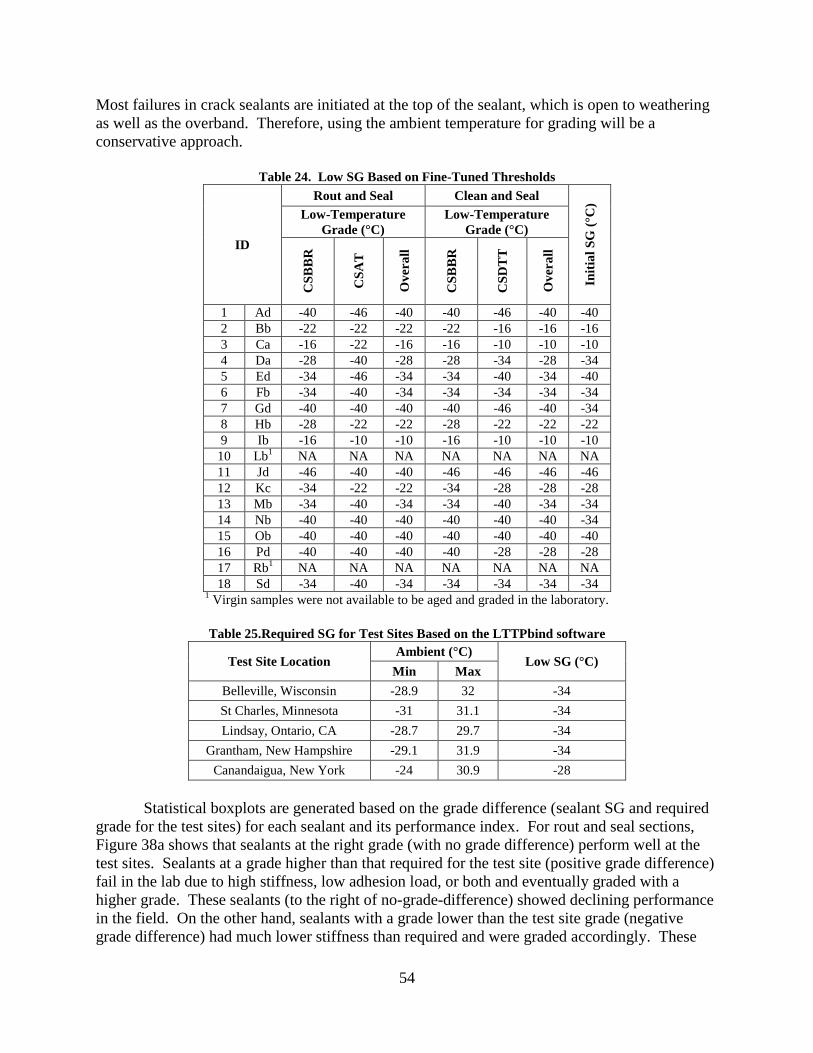
54
Most failures in crack sealants are initiated at the top of the sealant, which is open to weathering
as well as the overband. Therefore, using the ambient temperature for grading will be a
conservative approach.
Table 24. Low SG Based on Fine-Tuned Thresholds
ID
Rout and Seal Clean and Seal
Init
ial
SG
(°C
)
Low-Temperature
Grade (°C)
Low-Temperature
Grade (°C)
CS
BB
R
CS
AT
Ov
era
ll
CS
BB
R
CS
DT
T
Ov
era
ll
1 Ad -40 -46 -40 -40 -46 -40 -40
2 Bb -22 -22 -22 -22 -16 -16 -16
3 Ca -16 -22 -16 -16 -10 -10 -10
4 Da -28 -40 -28 -28 -34 -28 -34
5 Ed -34 -46 -34 -34 -40 -34 -40
6 Fb -34 -40 -34 -34 -34 -34 -34
7 Gd -40 -40 -40 -40 -46 -40 -34
8 Hb -28 -22 -22 -28 -22 -22 -22
9 Ib -16 -10 -10 -16 -10 -10 -10
10 Lb1 NA NA NA NA NA NA NA
11 Jd -46 -40 -40 -46 -46 -46 -46
12 Kc -34 -22 -22 -34 -28 -28 -28
13 Mb -34 -40 -34 -34 -40 -34 -34
14 Nb -40 -40 -40 -40 -40 -40 -34
15 Ob -40 -40 -40 -40 -40 -40 -40
16 Pd -40 -40 -40 -40 -28 -28 -28
17 Rb1 NA NA NA NA NA NA NA
18 Sd -34 -40 -34 -34 -34 -34 -34 1 Virgin samples were not available to be aged and graded in the laboratory.
Table 25.Required SG for Test Sites Based on the LTTPbind software
Test Site Location Ambient (°C)
Low SG (°C) Min Max
Belleville, Wisconsin -28.9 32 -34
St Charles, Minnesota -31 31.1 -34
Lindsay, Ontario, CA -28.7 29.7 -34
Grantham, New Hampshire -29.1 31.9 -34
Canandaigua, New York -24 30.9 -28
Statistical boxplots are generated based on the grade difference (sealant SG and required
grade for the test sites) for each sealant and its performance index. For rout and seal sections,
Figure 38a shows that sealants at the right grade (with no grade difference) perform well at the
test sites. Sealants at a grade higher than that required for the test site (positive grade difference)
fail in the lab due to high stiffness, low adhesion load, or both and eventually graded with a
higher grade. These sealants (to the right of no-grade-difference) showed declining performance
in the field. On the other hand, sealants with a grade lower than the test site grade (negative
grade difference) had much lower stiffness than required and were graded accordingly. These

55
sealants (to the left of no-grade-difference) also showed poor performance, possibly due to low
stiffness and early overband failure that may have accelerated other types of failures such as
adhesive failure. Similar observations, but not as clear as in the rout and seal case, were also
observed for the clean and seal treatment (Figure 38b). Sealants with higher grades (positive
grade difference) had insufficient cohesive capacity (failing either due to exceeding thresholds
for maximum stiffness or minimum extendibility), leading to poor field performance. On the
other hand, sealants with lower grade (negative grade difference) could be too soft for the test
site. These sealants could suffer from overband wear due to low stiffness.
(a) Rout and seal (b) Clean and seal
Figure 38. Boxplots of the Relationship between Sealants’ Grade Difference with Test Site and Their Field
Performance
SUMMARY AND CONCLUSIONS
The ASTM standards and specifications currently used to select crack sealant were
established based on material properties that are generally empirical and do not measure the
fundamental properties of sealants. Also, the specification limits vary from one state to another.
These differences create difficulties for crack sealant suppliers because many states with the
same environmental conditions specify different limits for the measured properties. These
standard tests were also reported to poorly characterize the rheological properties of bituminous-
based crack sealants and often fail to predict sealant performance in the field.
Therefore, performance-based guidelines were developed as a systematic procedure to
select hot-poured asphalt crack sealants. The work proposed a “Sealant Grade” (SG) system to
select hot-poured crack sealant based on environmental conditions. A special effort was made to
use the equipment originally developed by SHRP, which was used to measure binder rheological
behavior as part of the Performance Grade (PG) system. New tests and corresponding
preliminary thresholds for each test were identified to ensure desirable field performance.
However, because the preliminary thresholds were determined based on only limited field
data, in this study, an extensive field study was designed to validate and fine-tune the threshold
56
values proposed initially. The scope of this study includes installation of test sites, evaluation of
the field performance, and correlation of field performance to lab test results. Finally, new
guidelines were developed and validated for full implementation as AASHTO specifications.
Seven test sites were selected in collaboration with participating state departments of
transportation in different environmental regions in North America. A wide spectrum of
materials was installed in these test sites. Test sites were all wet-freeze climatic zone with some
variations in temperature fluctuations. Two commonly used sealing techniques were
implemented: (1) rout and seal, and (2) clean and seal. Rout and seal treatments were applied
with varying reservoir geometry. Clean and seal treatments were also applied at the same
locations to compare the two sealing techniques.
Field inspection of crack sealant performance was conducted annually during the project
duration, immediately after crack sealant installation and every winter season during the
February-March months. Performance data were routinely collected, including visual distress
identification, crack opening displacement, temperature measurements, and sampling for
laboratory evaluation. Key observations from the field performance study include:
Overbanding had a clear and positive impact on the performance of sealants.
Adhesive failure was the predominant type of failure for rout and seal sections, whereas
the clean and seal sections failed either because of complete loss of overband or cohesive
failure.
Overband wear accelerated initiation and progression of adhesive failure.
The severe temperature drops in winter 2013 and 2014 significantly affected the
performance of sealants.
Most sealants failed (fell below a performance index [PI] threshold of 70%) after 3 years.
Observations (and sampling) from the field installations were used to correlate field to
laboratory performance. Important findings from this component of the study include:
Vacuum oven aging (VOA) is a reasonable method for simulating 2 to 5 years of field
aging.
The current criteria for sealant viscosity appear to ensure sufficient workability during
installation at the recommended pouring temperatures.
A comparison between field performance (PI) and stiffness supports defining two
threshold values to avoid sealants that are either too soft or too stiff.
The worst performing sealants were the ones with low adhesion capacity and high
stiffness based on the climatic regions in which they are installed.
The best performing sealants were the ones with highest adhesion capacity and moderate
stiffness.
For clean and seal treatments, PI decreased as stiffness and/or tensile load increased.
CSAT showed poor correlation with PI and, therefore, an improved adhesion test was
suggested.
Based on the composite score, for most test sites, a strong or acceptable correlation
between field performance and laboratory test parameters was obtained.
57
o CSBBR stiffness had the strongest correlation followed by adhesion energy and
load for rout and seal treatments.
o For clean and seal treatment, CSBBR stiffness had the best score, followed by
tensile load and extendibility.
The field performance study supported the field-to-lab correlation exercise, which led to
significant modification of one laboratory performance test, the validation of several threshold
criteria, and the fine-tuning of several others. Highlights of this facet of the research include:
A simplified approach for detecting tracking potential using the yield test, which also
uses the DSR
The development and validation of a modified adhesion test
Two separate low-temperature grading schemes that depend on predominant failure mode
of the treatment type
o The CSBBR and CSDTT methods proposed for clean and fill treatment
o The CSBBR and CSAT methods proposed for rout and seal treatment
A revised crack sealant performance grading procedure using the modified tests and new
thresholds
o For the CSBBR test method, a maximum stiffness threshold was reduced from 25
MPa to 15 MPa, defined at 240 sec at 6°C higher than the grading temperature.
o For the CSBBR test method, a minimum stiffness threshold was introduced and
selected at 40 MPa, defined at 1 sec at 6°C higher than the grading temperature.
o For the CSBBR test method, the average creep ratio (ACR) was kept unchanged
(minimum of 0.31).
o For the CSDTT test method, the extendibility thresholds were kept the same as
the provisional standard. However, a secondary threshold was introduced as a
maximum tensile load and selected at 25N to avoid the use of less ductile
sealants.
o For CSAT, the minimum adhesion load changed from 50 N to 50 N at -4°C plus
25 N for every 6°C reduction at the test temperature.
Key conclusions from this work include:
It is important to use the proper grade as a performance criterion. Sealant performance is
maximized in the absence of deviation from the proper grade (i.e., when the test site
temperature was equivalent to the sealant grade testing temperature). Otherwise, a
decline in sealant performance was observed when the deviation increased.
Rout and seal sections performed much better than the clean and seal sections in this
study. Most clean and seal sections failed within 2 years.
Proper selection of pavements, crack types, and sealant material are critical for the
performance of clean and seal sections. As shown with the results obtained from
Michigan test deck, clean and seal sections could also perform satisfactorily when the
vertical and horizontal crack movements are not expected to be high such as in the case
of overlays on jointed concrete pavements.
58
VOA is a reasonable aging method for simulating 2 to 5 years of field aging. The
stiffness master curves obtained from the CSBBR test for field-aged samples compared
well to those determine from laboratory-aged samples.
The originally established thresholds for the viscosity test ensure sufficient workability at
the recommended pouring temperatures.
Overall, modified CSAT results correlated well with field performance. Sealants with
adhesion peak loads less than 20 N had the worst field performance. The results
emphasized the significance of adhesive characteristics for avoiding premature failures,
regardless of other sealant characteristics.
RECOMMENDATIONS
The effectiveness of a performance-based and systematic process for selection of hot-
poured asphalt crack sealants was confirmed through this research. The updated guidelines for
crack sealant grade (SG) are presented in Table 26 along with a complete list of AASHTO test
methods and specifications revised or developed in the current study. Key observations, findings,
and conclusions of this research support the following recommendations:
1. Pavement owner/agencies should install crack sealants during the fall to avoid
unnecessary aging that will take place over the summer.
2. Pavement owner/agencies should use the rout and seal treatment technique when
possible, particularly when sealing transverse reflective cracking.
3. Researchers and AASHTO representatives from the sponsoring members of this pooled
fund study (No. TPF-5[225]) should submit the revised tests and guidelines for
consideration as new and/or revised AASHTO standards and specifications.
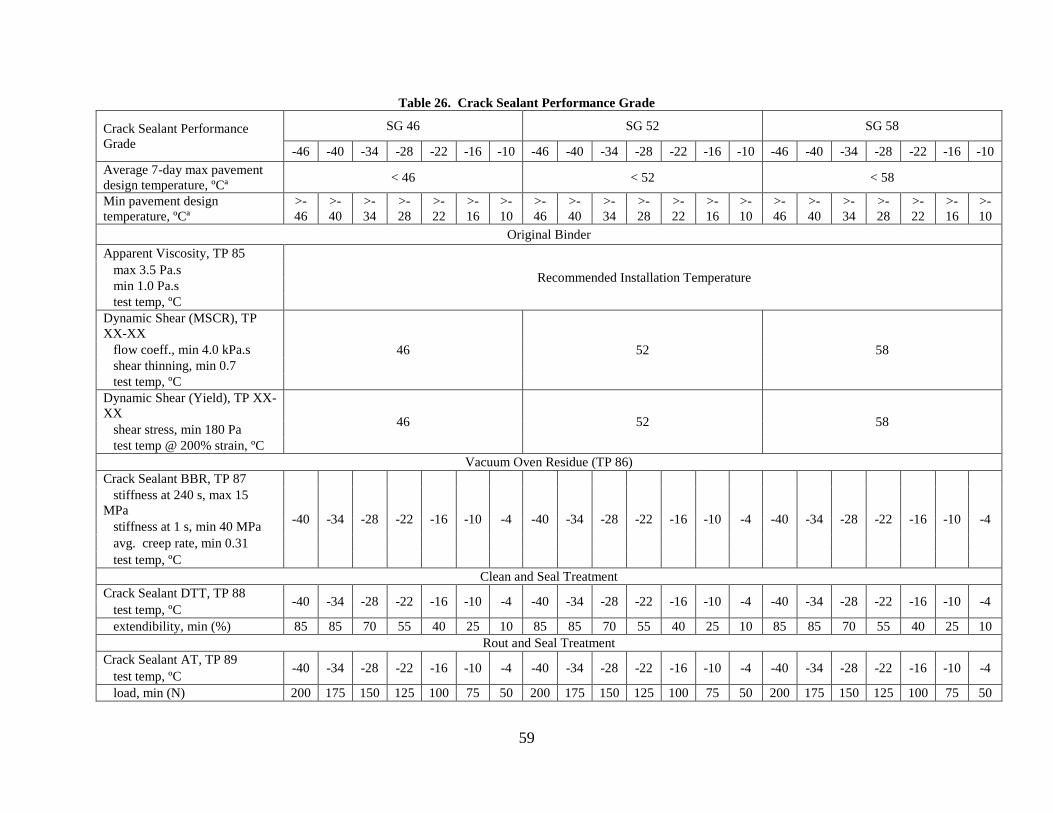
59
Table 26. Crack Sealant Performance Grade
Crack Sealant Performance
Grade
SG 46 SG 52 SG 58
-46 -40 -34 -28 -22 -16 -10 -46 -40 -34 -28 -22 -16 -10 -46 -40 -34 -28 -22 -16 -10
Average 7-day max pavement
design temperature, ºCª < 46 < 52 < 58
Min pavement design
temperature, ºCª
>-
46
>-
40
>-
34
>-
28
>-
22
>-
16
>-
10
>-
46
>-
40
>-
34
>-
28
>-
22
>-
16
>-
10
>-
46
>-
40
>-
34
>-
28
>-
22
>-
16
>-
10
Original Binder
Apparent Viscosity, TP 85
Recommended Installation Temperature max 3.5 Pa.s
min 1.0 Pa.s
test temp, ºC
Dynamic Shear (MSCR), TP
XX-XX
46 52 58 flow coeff., min 4.0 kPa.s
shear thinning, min 0.7
test temp, ºC
Dynamic Shear (Yield), TP XX-
XX 46 52 58
shear stress, min 180 Pa
test temp @ 200% strain, ºC
Vacuum Oven Residue (TP 86)
Crack Sealant BBR, TP 87
-40 -34 -28 -22 -16 -10 -4 -40 -34 -28 -22 -16 -10 -4 -40 -34 -28 -22 -16 -10 -4
stiffness at 240 s, max 15
MPa
stiffness at 1 s, min 40 MPa
avg. creep rate, min 0.31
test temp, ºC
Clean and Seal Treatment
Crack Sealant DTT, TP 88 -40 -34 -28 -22 -16 -10 -4 -40 -34 -28 -22 -16 -10 -4 -40 -34 -28 -22 -16 -10 -4
test temp, ºC
extendibility, min (%) 85 85 70 55 40 25 10 85 85 70 55 40 25 10 85 85 70 55 40 25 10
Rout and Seal Treatment
Crack Sealant AT, TP 89 -40 -34 -28 -22 -16 -10 -4 -40 -34 -28 -22 -16 -10 -4 -40 -34 -28 -22 -16 -10 -4
test temp, ºC
load, min (N) 200 175 150 125 100 75 50 200 175 150 125 100 75 50 200 175 150 125 100 75 50

60
Table 26. Crack Sealant Performance Grade (continued)
Crack Sealant Performance
Grade
SG 64 SG 70 SG 76
-46 -40 -34 -28 -22 -16 -10 -46 -40 -34 -28 -22 -16 -10 -46 -40 -34 -28 -22 -16 -10
Average 7-day max pavement
design temperature, ºCª < 64 < 70 < 76
Min pavement design
temperature, ºCª
>-
46
>-
40
>-
34
>-
28
>-
22
>-
16
>-
10
>-
46
>-
40
>-
34
>-
28
>-
22
>-
16
>-
10
>-
46
>-
40
>-
34
>-
28
>-
22
>-
16
>-
10
Original Binder
Apparent Viscosity, TP 85
max 3.5 Pa.s
min 1.0 Pa.s
test temp, ºC
Dynamic Shear (MSCR), TP
XX-XX
64 70 76 flow coeff., min 4.0 kPa.s
shear thinning, min 0.7
test temp, ºC
Dynamic Shear (Yield), TP
XX-XX 64 70 76
shear stress, min 180 Pa
test temp @ 200% strain, ºC
Vacuum Oven Residue (TP 86)
Crack Sealant BBR, TP 87
-40 -34 -28 -22 -16 -10 -4 -40 -34 -28 -22 -16 -10 -4 -40 -34 -28 -22 -16 -10 -4
stiffness at 240 s, max 15
MPa
stiffness at 1 s, min 40 MPa
avg. creep rate, min 0.31
test temp, ºC
Clean and Seal Treatment
Crack Sealant DTT, TP 88 -40 -34 -28 -22 -16 -10 -4 -40 -34 -28 -22 -16 -10 -4 -40 -34 -28 -22 -16 -10 -4
test temp, ºC
extendibility, min (%) 85 85 70 55 40 25 10 85 85 70 55 40 25 10 85 85 70 55 40 25 10
Rout and Seal Treatment
Crack Sealant AT, TP 89 -40 -34 -28 -22 -16 -10 -4 -40 -34 -28 -22 -16 -10 -4 -40 -34 -28 -22 -16 -10 -4
test temp, ºC
load, min (N) 200 175 150 125 100 75 50 200 175 150 125 100 75 50 200 175 150 125 100 75 50

61
Table 26. Crack Sealant Performance Grade (continued)
Crack Sealant Performance Grade SG 82
-46 -40 -34 -28 -22 -16 -10
Average 7-day max pavement
design temperature, ºCª < 82
Min pavement design
temperature, ºCª
>-
46
>-
40
>-
34
>-
28
>-
22
>-
16
>-
10
Original Binder
Apparent Viscosity, TP 85
max 3.5 Pa.s
min 1.0 Pa.s
test temp, ºC
Dynamic Shear (MSCR), TP XX-
XX
82 flow coeff., min 4.0 kPa.s
shear thinning, min 0.7
test temp, ºC
Dynamic Shear (Yield), TP XX-
XX 82
shear stress, min 180 Pa
test temp @ 200% strain, ºC
Vacuum Oven Residue (TP 86)
Crack Sealant BBR, TP 87
-40 -34 -28 -22 -16 -10 -4
stiffness at 240 s, max 15 MPa
stiffness at 1 s, min 40 MPa
avg. creep rate, min 0.31
test temp, ºC
Clean and Seal Treatment
Crack Sealant DTT, TP 88 -40 -34 -28 -22 -16 -10 -4
test temp, ºC
extendibility, min (%) 85 85 70 55 40 25 10
Rout and Seal Treatment
Crack Sealant AT, TP 89 -40 -34 -28 -22 -16 -10 -4
test temp, ºC
load, min (N) 200 175 150 125 100 75 50

62
The AASHTO test specifications should be used in determination or verification of hot-
poured asphalt crack sealant grade. The following AASHTO test method and specifications
were revised or developed during the project period:
AASHTO MP-25, Performance-Graded Hot-Poured Asphalt Crack Sealant (under review)
AASHTO PP xx, Grading or Verifying the Sealant Grade (SG) of a Hot-Poured Asphalt
Crack Sealants (under review)
AASHTO TP 85, Apparent Viscosity of Hot-Poured Asphalt Crack Sealant Using
Rotational Viscometer
AASHTO TP 86, Accelerated Aging of Hot-Poured Asphalt Crack Sealants Using a
Vacuum Oven
AASHTO TP 87, Measure Low-Temperature Flexural Creep Stiffness of Hot-Poured
Asphalt Crack Sealants by BBR
AASHTO TP 88, Evaluation of the Low-Temperature Tensile Property of Hot-Poured
Asphalt Crack Sealants by Direct Tension Test
AASHTO TP 89, Measuring Adhesion of Hot-Poured Asphalt Crack Sealant Using Direct
Adhesion Tester
AASHTO TP 90, Measuring Interfacial Fracture Energy of Hot-Poured Crack Sealant
Using a Blister Test
AASHTO TP xx, Evaluation of the Tracking Resistance of Hot-Poured Asphalt Crack
Sealants by Dynamic Shear Rheometer (DSR) (under review)
ASTM D 5167, Standard Practice for Melting of Hot-Applied Joint and Crack Sealant and
Filler for Evaluation
COSTS AND BENEFITS ASSESSMENT
A survey on pavement preventive maintenance programs from 18 transportation agencies
in North America shows significant investments in these programs (Al-Qadi et al., 2009).
Hence, if sealing cracks could prove to be a cost-effective technique, life-cycle savings could be
realized. Life-cycle cost analysis was performed to evaluate life-cycle benefits through sealing
treatments. The standard procedures with a 30-year analysis period and the following
assumptions were followed (Hein and Rao, 2010):
Pavement lasts 8.5 years without any application of treatment. Proper crack sealing
application extends the pavement life by 2 years.
The initial construction is assumed to be for a 300 mm full-depth asphalt. This includes
75 mm of polymerized hot mixed asphalt (HMA), 125 mm of binder HMA, and 50 mm
of stone mastic asphalt with prime coat.
Initial pavement condition index is 93. Overlay application restores the performance to
its original value. Overlays are 100 mm of HMA, and overlay performance is considered
identical to performance upon initial construction.
Cracks are occurring on an average distance of 6.1 m. Rout and seal is used. All sealants
are assumed to cost an average value. The total costs are assumed to be indifferent to the
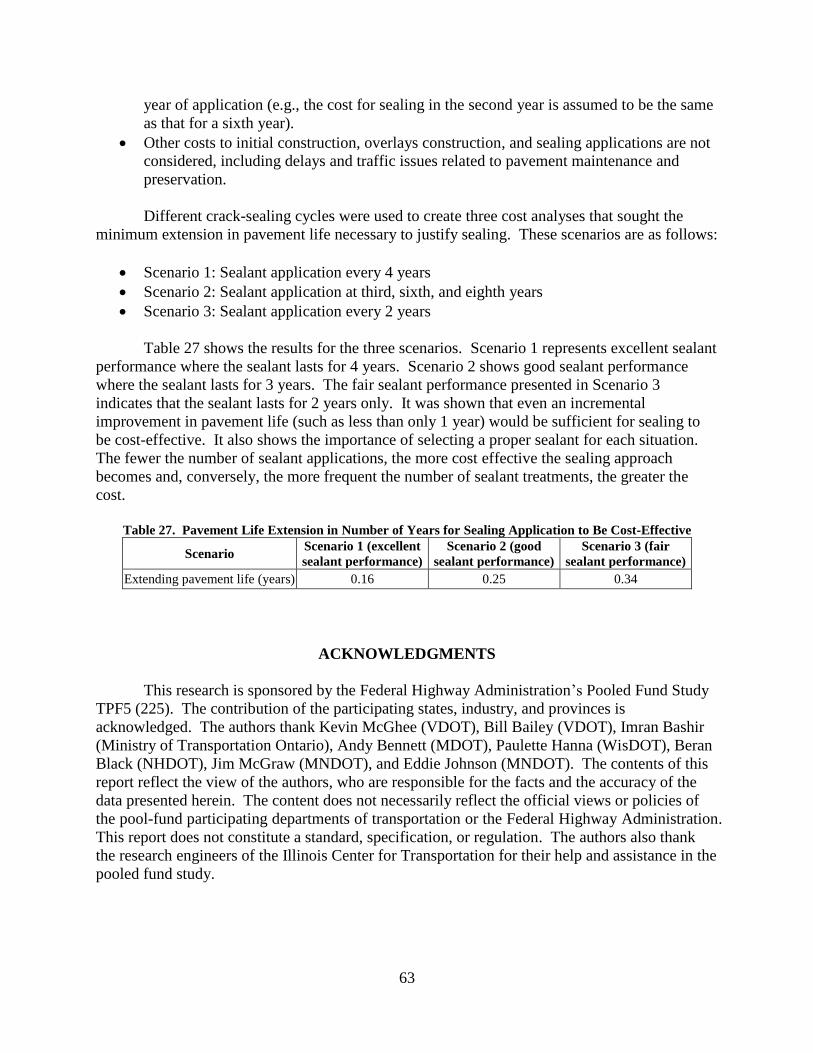
63
year of application (e.g., the cost for sealing in the second year is assumed to be the same
as that for a sixth year).
Other costs to initial construction, overlays construction, and sealing applications are not
considered, including delays and traffic issues related to pavement maintenance and
preservation.
Different crack-sealing cycles were used to create three cost analyses that sought the
minimum extension in pavement life necessary to justify sealing. These scenarios are as follows:
Scenario 1: Sealant application every 4 years
Scenario 2: Sealant application at third, sixth, and eighth years
Scenario 3: Sealant application every 2 years
Table 27 shows the results for the three scenarios. Scenario 1 represents excellent sealant
performance where the sealant lasts for 4 years. Scenario 2 shows good sealant performance
where the sealant lasts for 3 years. The fair sealant performance presented in Scenario 3
indicates that the sealant lasts for 2 years only. It was shown that even an incremental
improvement in pavement life (such as less than only 1 year) would be sufficient for sealing to
be cost-effective. It also shows the importance of selecting a proper sealant for each situation.
The fewer the number of sealant applications, the more cost effective the sealing approach
becomes and, conversely, the more frequent the number of sealant treatments, the greater the
cost.
Table 27. Pavement Life Extension in Number of Years for Sealing Application to Be Cost-Effective
Scenario Scenario 1 (excellent
sealant performance)
Scenario 2 (good
sealant performance)
Scenario 3 (fair
sealant performance)
Extending pavement life (years) 0.16 0.25 0.34
ACKNOWLEDGMENTS
This research is sponsored by the Federal Highway Administration’s Pooled Fund Study
TPF5 (225). The contribution of the participating states, industry, and provinces is
acknowledged. The authors thank Kevin McGhee (VDOT), Bill Bailey (VDOT), Imran Bashir
(Ministry of Transportation Ontario), Andy Bennett (MDOT), Paulette Hanna (WisDOT), Beran
Black (NHDOT), Jim McGraw (MNDOT), and Eddie Johnson (MNDOT). The contents of this
report reflect the view of the authors, who are responsible for the facts and the accuracy of the
data presented herein. The content does not necessarily reflect the official views or policies of
the pool-fund participating departments of transportation or the Federal Highway Administration.
This report does not constitute a standard, specification, or regulation. The authors also thank
the research engineers of the Illinois Center for Transportation for their help and assistance in the
pooled fund study.

64
REFERENCES
American Association of State Highway and Transportation Officials (AASHTO), Final Report
of Field and Laboratory Evaluation of Hot-Mix Crack Sealing Materials, Publication NTPEP
Report 16002.3, AASHTO, Washington, DC, June 2009.
Al-Qadi, I. L., Fini, E., Elseifi, M., Masson, J-F, and McGhee, K. (2006). Procedure for
Viscosity Determination of Hot-Poured Bituminous Sealants, Transportation Research
Record: Journal of the Transportation Research Board, No. 1958, pp. 74-81.
Al-Qadi, I., Loulizi, A., Aref, S., Masson, J-F, and McGhee, K. K. (2005). Modification of
Bending Beam Rheometer Specimen for Low-temperature Evaluation of Bituminous Crack
Sealants, Transportation Research Record: Journal of the Transportation Research Board,
No. 1933, pp. 97-106.
Al-Qadi, I. L., Masson, J-F, Dessouky, S., Collins, P., Yang, S-H, Bundalo-Perc, S., Fini, E.,
Elseifi, M., and McGhee, K. K. (2005). Development of Performance Guidelines for
Selection of Hot-Poured Crack Sealants, Publication Interim Report No. B5508-7, National
Research Council of Canada, September.
Al-Qadi, I. L., Masson, J-F, Loulizi, A., Collins, P., Woods, J. R., Bundalo-Perc, S., and
McGhee, K. K. (2004). Long-Term Accelerated Aging and Low Temperature BBR Testing
of Sealants, Publication Interim Report No. B5508-7, National Research Council of Canada.
Al-Qadi, I. L., Masson, J-F, Yang, S-H, and Fini, E. (2008). Towards Performance-Based
Selection Guidelines for Roadway Crack Sealant, Publication Report No. NRCC-50835,
National Research Council of Canada, August.
Al-Qadi, I. L, Yang, S-H, Dessouky, S., and Masson, J-F. (2007). Low Temperature
Characterization of Hot-Poured Crack Sealant Using Modified SHRP Direct Tensile Tester,
Transportation Research Record: Journal of the Transportation Research Board, No. 1991,
pp. 109-118.
Al-Qadi, I. L, Yang, S-H., Dessouky, S., Masson, J-F, Loulizi, A., and Elseifi, M. (2007).
Development of Crack Sealant Bending Beam Rheometer (CSBBR) Testing to Characterize
Hot-Poured Bituminous Crack Sealant at Low Temperature, Journal of AAPT, Vol. 76, pp.
85-122.
Al-Qadi, I., Yang, S-H, Elseifi, M., Masson, J-F, and McGhee, K. (2006). Specifications of
Bituminous-Based Crack Sealants Using Modified Bending Beam Rheometer, TRB Paper
No. 06-1882. The 85th Annual Meeting of the Transportation Research Board, National
Research Council, Washington, DC.
Al-Qadi, I., Masson, J.-F., Fini, E., Yang, S.-H., & McGhee, K. K. (2009). Development of
Performance-Based Guidelines for Selection of Bituminous-Based Hot-Poured Pavement
Crack Sealant: An Executive Summary Report. Illinois Center for Transportation,
Springfield.
Al-Qadi, I., Masson, J.-F., Fini, E., Yang, S.-H., and McGhee, K. K. (2009). Development of
Performance-Based Guidelines for Selection of Bituminous-Based Hot-Poured Pavement
Crack Sealant: An Executive Summary Report. Publication VTRC 09-CR7, Virginia
Transportation Research Council, Charlottesville.
ASTM D6690 (2006). Standard Specification for Joint and Crack Sealants, Hot Applied, for
Concrete and Asphalt Pavements, American Society for Testing and Materials, Philadelphia,
PA.

65
ASTM D5329 (2004). Standard Test Methods for Sealants and Fillers, Hot-Applied, for Joints
and Cracks in Asphaltic and Portland Cement Concrete Pavements, American Society for
Testing and Materials, Philadelphia, PA.
ASTM C670 (2003). Standard Practice for Preparing Precision and Bias Statements for Test
Methods for Construction Materials, American Society for Testing and Materials,
Philadelphia, PA.
Belangie, M. C., and Anderson, D. I. (1985). Crack Sealing Methods and Materials for Flexible
Pavements, Publication FHWA-UT-85-1, Utah Department of Transportation, Salt Lake
City.
Chong, G. J., and Phang, W. A. (1987). Consequences of Deferred Maintenance Treatment on
Transverse Cracks in Cold Regions, Proceedings of Paving in Cold Areas Mini-Workshop,
Ottawa, Ontario, Canada, pp. 638-686.
Chong, G. J., and Phang, W. A. (1987). Improved Preventive Maintenance: Sealing Cracks in
Flexible Pavements in Cold Regions, Publication PAV-87-01, Ontario Ministry of
Transportation, Downsview, Ontario, Canada.
Chong, G. J. (1990). Rout and Seal Cracks in Flexible Pavements—A Cost-Effective
Preventive Maintenance Procedure, Transportation Research Record: Journal of the
Transportation Research Board, No. 1268, pp. 8-16.
Collins, P., Veitch, M., Masson, J-F, and Al-Qadi, I. (2008). Deformation and Tracking of
Bituminous Sealants in Summer Temperatures: Pseudo-Field Behavior, International
Journal of Pavement Engineering, Volume 9, pp. 1-8.
Cuelho, E., Johnson, D. R., and Freeman, R. B. (2002). Cost-Effectiveness of Crack Sealing
Materials and Techniques for Asphalt Pavements, Publication FHWA/MT-02-002/8127,
Montana Department of Transportation, Helena.
Cuelho, E., Ganeshan, S. K., Johnson, D. R., Freeman, R. B., and Schillings, P. L. (2003).
Relative Performance of Crack Sealing Materials and Techniques for Asphalt Pavements,
Third International Symposium on Maintenance and Rehabilitation of Pavements and
Technological Control, Guimarães, Portugal, pp. 327–337.
Cuelho, E., and Freeman, R. B. (2004). Cost-Effectiveness of Crack Sealing Materials and
Techniques for Asphalt Pavements. Montana Department of Transportation, Helena.
Elseifi, M., Dessouky, S., Al-Qadi, I. L., and Yang, S-H (2006). A Viscoelastic Model to
Describe the Mechanical Response of Bituminous Sealants at Low Temperature,
Transportation Research Record: Journal of the Transportation Research Board, No. 1958,
pp. 82-89.
Fang, C., Galal, K. A., Ward, D. R., Haddock, J. E., and Kuczek, T. (2003). Cost-Effectiveness
of Joint and Crack Sealing, Presented at the 82nd Annual Meeting of the Transportation
Research Board, Washington, DC.
Fang, C., Haddock, J., Galal, K., and Ward, D. (2003). Initial Study for Cost-Effectiveness of
Joint/Crack Sealing. Indiana Department of Transportation, Indianapolis.
Fini, E., Al-Qadi, I. L., and Dessouky, S. H. (2006). Adhesion of Hot-Poured Crack Sealant to
Aggregate, The 85th Annual Meeting of the Transportation Research Board, National
Research Council, Washington, DC.
Fini, E., Al-Qadi, I. L., Masson, J-F, & McGhee, K. K. (2008). Interfacial Fracture Energy: An
Indicator of the Adhesion of Bituminous Materials, Journal of AAPT, Vol. 77, pp. 827-850.

66
Gibson, N., Qi, X., Shenoy, A., Al-Khateeb, G., Kutay, M. E., Andriescu, A. and Harman, T.
(2012). Performance testing for Superpave and structural validation, Publication FHWA-
HRT-11-045. Washington, DC: Federal Highway Administration Research and Technology.
Hein, D. K., and Rao, S. (2010). Rational Procedures for Evaluating the Effectiveness of
Pavement Preservation Treatments. Compendium of Papers from the First International
Conference on Pavement Preservation, pp. 117-130.
Masson, J. F., Boudreau, B., and Girard, C. (2003). Guidelines for Sealing and Filling Cracks in
Asphalt Concrete Pavement: A Best Practice, National Guide to Sustainable Municipal
Infrastructure, National Research Council Canada, Canada.
Masson, J-F, Collins, P., Perraton, D., and Al-Qadi, I. L. (2007). Rapid Assessment of the
Tracking Resistance of Bituminous Crack Sealants, Canadian Journal of Civil Engineering,
Vol. 34, pp. 126-131.
Masson, J.-F. (2000). Bituminous Sealants for Pavement Joints and Cracks: Building the Basis
for a Performance-Based Specification, In Durability of Building and Construction Sealants,
A. Wolf, Ed., RILEM, Paris, pp. 315-328.
Masson, J.-F., and Lacasse, M. A. (1999). Effect of Hot-Air Lance on Crack Sealant Adhesion,
Journal of Transportation Engineering, Vol. 125, No. 4, pp. 357-363.
Ozer, H., Solanki, P., Yousefi, S. S., and Al-Qadi, I. L. (2014). Field Validation of Laboratory-
Predicted Low-Temperature Performance of Hot-Poured Crack Sealants. Transportation
Research Record: Journal of the Transportation Research Board, No. 2431, pp. 57-66.
Ozer, H, Yousefi, S. S., Al-Qadi, I. L., and Elizalde, G. (2015). Field Aging and Development
of Aging Model for Hot-Poured Crack Sealants. Transportation Research Record: Journal
of the Transportation Research Board, No. 2481, pp. 90-99.
Panea, J., and Kennepohl, G. J. (1996). Crack Sealing in Flexible Pavements: A Life Cycle Cost
Analysis, Transportation Research Record: Journal of the Transportation Research Board,
No. 1529, pp. 86-94.
Panea, J. (1990). Field Evaluation of Rout and Seal Crack Treatment in Flexible Pavement,
Publication PAV-90-03, Ministry of Transportation of Ontario, Downsview, Ontario,
Canada.
Penn, L. S., and Defex, E. (2002). Relation between Work of Adhesion and Work of Fracture
for Simple Interfaces, Journal of Materials Science, Vol. 37, pp. 505-513.
Peshkin, D., Smith, K. L., Wolters, A., Krstulovich, J., Moulthrop, J., and Alvarado, C. (2011).
Guidelines for the Preservation of High-Traffic-Volume Roadways. Transportation Research
Board, Washington, DC.
Ponniah, J. E., and Kennepohl, G. (1996). Crack Sealing in Flexible Pavements: A Life-Cycle
Cost Analysis. Transportation Research Record: Journal of the Transportation Research
Board, No. 1529, pp. 86-94.
Smith, K. L., and Romine, A. R. (1993). Innovative Materials Development and Testing
Volume 3: Treatment of Cracks in Asphalt Concrete-Surfaced Pavements, Publication SHRP-
H-354. Strategic Highway Research Program, National Research Council, Washington, DC.
Smith, K. L., and Romine, A. R. (1999). LTPP Pavement Maintenance Materials: SHRP Crack
Treatment Experiment, Publication FHWA-RD-99-143, FHWA, U.S. Department of
Transportation, Washington, DC.
Solanki, P., Ozer, H., Yousefi, S. S., and Al-Qadi, I. L. (2014). Effect of Installation Parameters
on Performance of Hot-Poured Crack Sealants. Proceeding of T&DI Congress, Orlando, FL,
pp. 142-152.
67
Wang, Y., Wang, G., and Mastin, N. (2012). Costs and Effectiveness of Flexible Pavement
Treatments: Experience and Evidence. Journal of Performance of Constructed Facilities,
Vol. 26, Issue 4, pp. 516–525.
Ward, D. R. (2001). Evaluation of the Implementation of Hot-Pour Sealants and Equipment for
Crack Sealing in Indiana, Publication FHWA/IN/JTRP-2000/27, FHWA, U.S. Department
of Transportation, Washington, DC.
Yang, S-H, and Al-Qadi, I. (2008). A Modified Direct Tension Test (DTT) for Bituminous
Crack Sealant Characterization at Low Temperature. Journal of AAPT, Vol. 77, pp. 107-142.
Yousefi, S. S., Ozer, H., Hafeez, I., and Al-Qadi, I. L. (2016). Field and Laboratory Low
Temperature Performance of Hot-Poured Crack Sealants in Michigan. Presented at 95th
Annual Meeting of the Transportation Research Board, Washington, DC.
Yousefi, S. S., Ozer, H., and Al-Qadi, I. L. (2016). Identification of Low Temperature Stiffness
Thresholds for Hot-Poured Sealants Using the Crack Sealant Bending Beam Rheometer Test
Method. Presented at 95th Annual Meeting of the Transportation Research Board,
Washington, DC.