validation of a scale for rating the process of delivery...
TRANSCRIPT

1
Validation of a scale for rating the process of delivery of
psycho-social treatments for alcohol dependence and misuse:
the UKATT Process Rating Scale (PRS). Tober, G., Clyne, W., Finnegan, O., Farrin, A. and Russell, I. in collaboration
with the UKATT Research Team
Leeds Addiction Unit, 19 Springfield Mount, Leeds, LS2 9NG

2
Validation of a scale for rating the process of delivery of psycho-social
treatments for alcohol dependence and misuse: the UKATT Process Rating Scale
(PRS).
Tober, G., Clyne, W., Finnegan, O., Farrin, A. and Russell, I. in collaboration
with the UKATT Research Team
Summary
The development and validation of a manual based method for monitoring and rating
the process of the delivery of psychosocial treatments of alcohol dependence and
misuse is described. Tests of the validity and reliability of the UKATT Process Rating
Scale (PRS) show that it is able to detect the two treatments for which it was designed
and to discriminate between them.
Introduction
Why it is important to measure treatment fidelity
The requirement to monitor the delivery of psychological and social treatment
underlies clinical governance of routine clinical practice, supervision and
psychotherapy research. For all these purposes it is necessary to quantify and assess
the quality of treatment delivery. Treatment integrity or fidelity checks provide the
means to examine the extent to which treatments are delivered and the quality of such
delivery (Moncher and Prinz 1991). Interpretation of the findings in both
effectiveness and efficacy trials in psychotherapy research requires measurement of
treatment implementation (Waltz et al. 1993). Variations in competence can be
identified and potential treatment effects more accurately attributed. For example,
where there are no treatment fidelity checks, treatment effects could be wrongly
attributed to the treatments themselves rather than a difference in therapist
competence. Equally the potential emergence of a treatment effect may be masked by
variations in the extent and quality of the delivery of treatment. Null findings could
be ascribed to treatment adherence problems such as similarity of elements in
different therapies (Carroll & Nuro 1996) or overlap in treatments that were delivered
to different groups (Kazdin 1994).

3
Therapeutic outcomes can be influenced by participant characteristics, treatment
delivery, qualities of the therapist and the interaction between therapist and client. If
inferences are to be drawn from effectiveness studies, these factors need to be
measured and their influence calculated. This approach forms the basis of the
‘technology model’ of psychotherapy research design, described by Waskow (1984)
and Carroll et al. (1994), which aims to replicate the rigour employed in randomised
controlled drug trials: therapy is specified in terms of dose delivered, active and
‘inert’ ingredients and the conditions of administration.
Procedures to safeguard treatment fidelity and measure treatment delivered have not
always been adopted as standard procedure in psychotherapy outcome research
(Moncher & Prinz, 1991). However, the issue was given serious consideration in the
National Institute of Mental Health Treatment of Depression Collaborative Research
Program (TDCRP) (Elkin et al. 1985; 1989; Hill et al. 1992), providing the impetus
for subsequent measurement of treatment fidelity in psychotherapy research in
general, and specifically in the addiction field (e.g. Carroll et al. 1998a; Barber et al.
1996; 2004). The TDCRP utilised a comprehensive manual to record adherence to
treatment for depression: the Collaborative Study Psychotherapy Rating Scale (Hill et
al. 1992). Raters in this study were non-expert in the therapeutic modalities assessed,
but did have a professional background in clinical psychotherapy.
Measuring treatment fidelity in psychotherapeutic treatment of addiction
Waltz et al. (1993) elaborated the method of measuring treatment integrity by
identifying two central concepts – adherence and competence. Adherence is
described as the extent to which a therapist used the recommended intervention and
competence refers to the skills demonstrated by the therapist in their implementation
of the intervention. These investigators recommended that both be measured in order
to account for treatment integrity.
The National Institute on Drug Abuse (NIDA) Collaborative Cocaine Treatment
Study trial (Crits-Christoph et al. 1999) compared four different psychosocial
interventions for the treatment of cocaine dependence using the technology model to
specify the treatment and its delivery, adding measures of therapists’ competence as
well as protocol adherence in delivering treatment. Three different rating scales were
4
used by raters who were experts in one of the treatments delivered: the Cognitive
Therapy Adherence/Competence Scale (Barber et al. 2003), based on the previously
validated Cognitive Therapy Scale (Young & Beck 1980), the
Adherence/Competence Scale for Individual Drug Counselling for Cocaine
Dependence (Barber et al. 1996) and the Adherence/Competence Scale for Supportive
Expressive Dynamic Therapy for Cocaine Dependence (Barber et al. 1997). Each
rater listened to a portion of two randomly selected audiotapes of sessions from each
client, and also rated a smaller number of tapes from the therapy conditions in which
they were not considered expert, using the rating scale in which they were expert.
The measurement of treatment delivered in this trial successfully discriminated
between treatment conditions and demonstrated that therapists adhered to their
prescribed therapy. However different types of therapies were, in the main, rated with
different rating scales by different raters, rendering comparisons of interventions
difficult; rater bias in terms of knowledge and expectations of the therapy rated cannot
be ruled out.
Project MATCH (Project MATCH Research Group 1997) used a similar rating
system to that utilised by the TDCRP depression study. The MATCH Tape Rating
Scale (MTRS) (Carroll et al. 1998b) was utilised to assess trial treatment protocol
adherence and differentiation between the treatment conditions. Likert type scales
were used to measure delivery of the unique active ingredients of the therapies
examined. The MTRS successfully discriminated between the three treatments that
were compared in the trial (Carroll et al. 1998b). Competence in therapist delivery of
treatment was assessed using a non-treatment specific measure of general therapist
skill, rather than a measure of competence in the specific ingredients of each therapy.
The same pool of raters, who were blind to treatment type, rated all sessions.
Refinement of the MTRS resulted in development of the Yale Adherence and
Competence Scale (YACS), a system for rating therapist adherence and competence
in delivering psychological treatment for substance misuse disorders (Carroll et al.
2000). This scale was similarly based upon the principles of the technology model
(Waskow 1984; Carroll & Rounsaville 1990). The rating system is a general
psychotherapy rating scale, designed so that it could be easily adapted for other types
of psychotherapy for addictions. It encompasses four dimensions designed to ensure

5
content validity of a measure of treatment fidelity (Bond et al. 2000; Carroll et al.
2000; Calsyn 2000). Thus the scale includes items that refer to ingredients of the
therapy and therapist behaviours that are 1) unique and essential 2) essential but not
unique 3) acceptable but neither unique nor essential and 4) proscribed within the
therapeutic framework. It is proposed that raters, non-expert in individual treatment
types, are able to rate competence based on detailed descriptions giving examples of
individual therapeutic behaviours.
An instrument designed to rate a specific therapy, namely Motivational Interviewing,
the Motivational Interviewing Skill Code (MISC) (Miller & Mount 2001) measures
adherence but not competence. A psycholinguistic code for measuring changes in
client speech expected to occur with effective Motivational Interviewing is used in
conjunction with it. Raters are required to listen to an audiotape of a therapy session
three times: the first time the rater makes global ratings about therapeutic factors
relating to the clinician, the client and the clinician-client interaction. The second
time the rater codes each client and therapist utterance in terms of motivational
interviewing factors. The third time the rater measures the proportion of time that the
client and the clinician speak. Seventy five per cent of global ratings items
demonstrated fair, good or excellent reliability, however items measuring individual
therapist and client behaviours ranged from poor to excellent, with only 44% of items
yielding intra-class correlations indicating good to excellent reliability (Moyers et al.
2003). The question of raters being blinded to treatment type or expert in the
treatment is inconsequential in the use of the MISC as it only measures one type of
treatment.
A less time consuming method was described by Strang and McCambridge (2004)
who utilised a short therapist self-report measure of what occurred in a session,
completed in writing immediately post session. The measure took approximately two
minutes to complete and included categorical and five-point scale ratings. Although
this method is time efficient, the potential unreliability of therapist self-report throws
into question its validity. Miller & Mount (2003) found that therapists were likely to
report greater increases in motivational interviewing skills following a Motivational
Interviewing training programme, than other observers who rated therapy sessions
using the MISC. In a study investigating the effectiveness of psychotherapy and

6
pharmacotherapy for cocaine users, Carroll et al. (1998a) similarly found a lack of
concordance between therapist and observer ratings of session content when using a
session checklist immediately post-session.
The purpose of the present study was to develop and validate a manual based method
of rating treatment fidelity, capable of rating frequency and quality of the delivery of
treatment components, treatment manual adherence, therapeutic style and
discriminability between different treatments. The UK Alcohol Treatment Trial
Process Rating Scale (UKATT-PRS) was designed to measure adherence to protocols
and competence in the delivery of manualised therapies. A rating scale, designed to be
time-efficient, to allow all sessions to be rated by the same rater, to be readily
adaptable to use with a range of therapeutic approaches to substance misuse treatment
and appropriate for use in a UK context was developed.
Ratings of the frequency and quality of delivery of treatment can assist in
interpretation of treatment effects in a number of ways: in clinical trials where
effectiveness is measured, treatment process ratings form the basis for attributing
outcomes to treatment received and for investigating which components of the
treatment contribute to such effectiveness; they can form the basis for matching
therapist attributes with competence and can also be used for assessing competence to
practice and in routine supervision of practice.
Method
Scale and manual development and piloting
The MATCH Tape Rating Scale (MTRS) (Carroll et al. 1998b), designed to rate the
delivery of three individually based psycho-social treatments, Motivational
Enhancement Therapy, Cognitive Behavioural Coping Skills and Twelve Step
Facilitation Therapy, was used as the basis for developing the UK Alcohol Treatment
Trial Process Rating Scale (UKATT-PRS). The new scale was designed to rate the
frequency and quality of the delivery of a UK version of Motivational Enhancement
Therapy (MET) (Miller et al. 1995) and a new treatment, Social Behaviour and
Network Therapy (SBNT) (Copello et al. 2002), compared for effectiveness in the
UK Alcohol Treatment Trial (UKATT 2001) and chosen for UKATT on the strength
of their evidence base (or the evidence base of their component parts), for their

7
distinctiveness (the former being a treatment targeting individual, internal motivation
and the latter targeting the social environment in which drinking and change occur)
and for their acceptability for routine clinical practice.
The principles of Motivational Enhancement Therapy require the therapist to elicit
client concerns about drinking, to heighten ambivalence and to direct the client
towards a decision to cut down or stop drinking. In Social Behaviour and Network
Therapy the therapist aims to identify and work with a social network supportive of
positive change; eight structured sessions focus on topics ranging from
communication and coping skills in the network, to relapse prevention plans and
alternative activities to drinking.
Fifty-two therapists from three treatment centres in the UK successfully completed
training in one of the two manualised treatments to which they had been randomly
assigned. Their practice was video-recorded and supervised throughout the trial. The
videos were stored anonymously at the trial training centre where they were available
for the purpose of independent blind rating.
To generate rating scale items, essential active ingredients (both unique and common)
of each treatment were identified from treatment manuals in discussion with the
authors of these manuals. Active ingredients included style and content specific to
each treatment. The items were then re-examined to ensure they covered all treatment
components, and that they were balanced between the treatments.
These items were combined into a twenty-six item scale, divided into three sections.
The first section contained 6 items measuring session management, the second section
contained 13 items measuring specific tasks and the third contained 7 items measuring
therapist style (see Appendix 1). These twenty-six items were rated on two 5-point
scales, one measuring the extent to which the item was performed (frequency), the
other measuring how well the therapist performed the item (quality). The scale
measuring frequency was anchored at 0 - Not at all and 4 - Extensively with
intermediate labels of A little, Somewhat and Considerably. The scale measuring
quality was anchored at 0 - Not at all well and 4 - Very well with unlabelled
intermediate points. A checklist of specific session topics was attached (example

8
items include Feedback of test results and Relapse prevention plan - see Table 11)
and there was a preliminary factual question referring to numbers present at the
session.
Items were specified in a manual. For each item, a definition, a description of the
characteristics of high and low ratings for frequency and quality and examples of
therapist dialogue illustrating these were provided. The manual also included general
guidance on differentiating the frequency and quality of therapist behaviours, on
avoiding common pitfalls relating to possible rater bias and on the method for note-
taking during the session.
Sampling
Video recordings of two psychosocial treatments of alcohol misuse and dependence
delivered in the UK Alcohol Treatment Trial (UKATT) were available for the purpose
of developing and validating the rating scale. One video per client (where available)
was sampled for process rating. The sample of over 400 video tapes was stratified by
treatment (MET, SBNT), session number (1-3 for MET, 1-8 for SBNT) and centre
(South Wales, Leeds, West Midlands) (see Table 1). Replacement sampling was used
when a video was subsequently found to be unrateable, in order to retain the balance
between treatments, session numbers and centres.
Table 1 Selection of videotapes by treatment and treatment session
Number available Number selected Session MET n SBNT n MET n (%) SBNT n (%)
No videos 106 104 1 316 212 92 (36%) 44 (23%) 2 254 157 84 (32%) 21 (11%) 3 160 142 83 (32%) 23 (12%) 4 119 21 (11%) 5 102 22 (11%) 6 82 20 (10%) 7 66 22 (11%) 8 54 20 (10%)
There was a target of 50 videos to be sampled for double rating and of these 25 would
be triple rated. Videos were randomly selected throughout the trial for double and
triple rating by a further two independent raters. This ensured inclusion of ratings

9
throughout the entire treatment phase of the trial and ensured balance by treatment,
session number and centre.
Rater training and supervision
An independent rater, referred to hereafter as the primary rater, blind to the types of
therapy being rated, was trained in the use of the manual and supervised throughout
the study to enhance consistency over time. Initial training involved rating six video
recordings of treatment sessions and calibration of these ratings through discussion
with two supervisors. Further, all these videos were rated a second time by the
primary rater and supervisors, and ratings compared over time. Inter-rater agreement
was reached when the primary rater’s scores were at least adjacent to the supervisors’
scores for all items in all six videos. The primary rater then commenced rating the
sample of videos selected for the study. Calibration meetings were held every 3 weeks
throughout the rating period to prevent rater drift. Between 15 and 20 videos were
rated by the primary rater between calibration meetings and two of these were
randomly selected for blind supervisor rating and discussion.
Not all the video recordings were of an equal quality, due to the fact that the
recordings took place in a variety of settings, using different equipment and relying
upon the ability of the therapist to operate the recording equipment. A number of
criteria for determining the rateability of video recordings were therefore agreed at the
outset. Videos were deemed unrateable if there was no sound, or insufficiently good
sound to make out the content of the dialogue. If the recording obviously cut out
before the end of the session, or cut in after the beginning of the session, a note was
made to take account of the possibility this might bias subsequent analysis.
Analysis
Validity
Treatment specific items were analysed separately to examine the validity of the scale
for measuring the delivery of the two treatments. Four summary scores were created:
METf (the mean of the frequency scores for MET items): METq (the mean of the
quality scores for MET items where frequency ratings were >0); SBNTf (the mean of
the frequency scores for SBNT items) and SBNTq (the mean of the quality scores for
SBNT items where frequency ratings >0).

10
The ability of the scale to discriminate the two treatments was investigated by
comparing individual item scores and frequency summary scores for each treatment.
A t-test was used to compare the mean item scores and the mean frequency summary
scores between SBNT and MET. It was hypothesised that MET items and MET
summary scores would be high for MET sessions and low for SBNT sessions and vice
versa for SBNT items and frequency summary scores.
Concurrent validity was examined by analysis of variance comparing manual derived
quality summary scores for the two treatments with global ratings of individual
therapist’s skills (low/medium/high) given by the treatment specific supervisors.
Reliability
Cronbach's alpha was calculated to assess the internal consistency of the four
summary scores. Principal components analysis was conducted to determine the
factor structure of the scale. If certain items were shown to be redundant they could be
removed from the scale.
The inter-rater reliability of the scale was examined using comparisons between the
primary rater and two others, giving independent ratings for a sample of the videos.
Agreement was recorded if either the same score or adjacent scores were given to a
scale item by both raters. The percentage agreement was calculated for each item to
determine the degree of agreement between the primary rater and double raters. For
the four summary scores, the average of the two raters’ scores was plotted against
difference in their score (Bland & Altman 1986) to make pairwise comparisons
between raters. This illustrates graphically whether the summary scores are rated
consistently, how well the raters agree on average and what the limits of agreement
are. The plot shows the line of mean difference which indicates whether one rater
consistently rates higher (or lower) than the other, and the spread of data points about
the line of mean difference which illustrates the variability in agreement between the
raters.

11
Analysis of learning curves was not undertaken due to insufficient numbers of
therapists having a large number of clients and due to the high degree of variability in
outcomes between clients, which could mask individual therapist patterns over time.
Additional data analysis
The session management frequency and quality scores were individually and
collectively compared across treatments to assess their ability to identify non-
treatment specific components of good practice in treatment delivery. Reliability of
session management items was assessed by comparing frequency scores from the
primary and two independent raters.
A checklist of main and characteristic activities for each treatment was compiled. This
session content could be used to confirm the nature of the treatment given during a
session and for comparison between treatments in line with the randomised treatment
assignment.
Results
Five hundred and sixty-four of 774 (73%) clients had at least one video; 337/443
(76%) were for MET; 227/331 (69%) were for SBNT. Four hundred and fifty-two
clients had a rateable video: 259 were for MET and 193 were for SBNT. One hundred
and twelve clients had at least one unrateable video - a total of 160 videos were
unrateable: 101 for MET and 59 for SBNT.
Validity
Table 2 shows mean frequency scores for treatment specific items for both treatments.
Although some of the treatment specific items have low mean frequency scores, there
is a significant difference between their frequency ratings in each of the treatments
and in each case the rating is higher for the treatment for which the item was
designed.

12
Table 2 Mean frequency ratings for treatment specific items by treatment type (standard deviation in parentheses).
Treatment
MET n=259 SBNT n=193 Manual items
Mean frequency score (SD)
Mean frequency score (SD)
Mean Difference
CI for the mean difference
MET items Feedback 1.64 (1.81) .02 (0.14) 1.62 1.40-1.84 Eliciting client concerns about drinking
1.66 (1.58) .10 (0.39) 1.56 1.36-1.76
Eliciting self efficacy for change
.41 (0.78) .09 (0.34) 0.31 0.19-0.43
Commitment to drinking goal
2.26 (1.10) 1.21 (1.20) 0.65 0.43-0.87
Ambivalence .51 (0.80) .04 (0.31) 0.47 0.37-0.58 Creating conflict .18 (0.48) .12 (0.19) 0.16 0.09-0.22 Eliciting commitment to change drinking
.30 (0.59) .04 (0.22) 0.27 0.19-0.35
Eliciting optimism for change
1.64 (1.40) .16 (0.48) 1.47 1.29-1.66
Reflective listening 2.89 (0.85) 1.46 (0.83) 1.43 1.28-1.59 Exploration of feelings 1.11 (0.97) .45 (0.69) 0.67 0.52-0.83 Empathy 1.97 (0.99) 1.24 (0.91) 0.72 0.54-0.90 SBNT items Homework .19 (0.47) .97 (1.20) -0.80 -0.98- -0.62 Alternative activities to drinking
.37 (0.77) .93 (1.22) -0.56 -0.76- -0.36
Social support for change – general
.03 (0.20) 1.25 (1.08) -1.23 -1.38- -1.07
Identify sources of support for change
.24 (0.59) 1.31(1.54) -1.07 -1.30- -0.84
Involvement of others in behaviour change
.42 (0.75) 2.40 (1.20) -1.99 -2.18- -1.80
Therapist as task oriented .86 (1.15) 2.55 (1.35) -1.70 -1.94- -1.46 Therapist as an active agent for change
.05 (0.27) .32 (0.76) -0.27 -0.38- -0.16
Collaboration .04 (0.26) .45 (0.65) -0.42 -0.52- -0.32 Interpersonal focus 1.53 (1.0) 2.56 (1.52) -1.06 -1.29- -0.82
- Values range from not at all (0) to extensively (4). - All item differences between the two treatments significant with p<.05

13
SBNT and MET frequency summary scores by treatment group are represented in
Figures 1 and 2. Mean scores for frequency of MET items were significantly higher in
MET than in SBNT (MET mean = 1.32; SBNT mean = 0.47; CI for the difference =
0.79 to 0.91). Mean scores for frequency of SBNT items were significantly higher in
SBNT than in MET (SBNT mean = 1.42; MET mean = 0.42; CI for the difference = -
1.08 to - 0.93).
Figure 1 Mean and 95%CI for SBNT frequency summary by randomised group 2 sample t-test; p<0.001

14
Figure 2 Mean and 95%CI for MET frequency summary by randomised group 2 sample t-test; p<0.001
15
Comparison of quality scores for individual items by treatment type were conducted
on those individual items for which there were sufficient data. As quality scores were
only given if the item was given a frequency rating of 1 or more (that is, if the item
was rated as having occurred) some items had very low numbers of quality ratings
particularly for the treatment to which those items were not attributed. Items with ten
or more quality ratings were included in the analysis. Six items had insufficient data
for analysis (feedback, ambivalence, creating conflict, eliciting commitment to change
drinking, social support for change and collaboration). T-tests were conducted on the
fourteen items with sufficient data. Four of the seven MET items showed a
significantly higher quality score for MET than for SBNT. Six of the seven SBNT
items had significantly higher ratings of quality for SBNT than for MET (see Table
3).
Where a treatment specific item was given a frequency rating, it was also given a
quality rating. Figures 3 and 4 represent SBNT and MET quality summary scores by
randomised group. Where SBNT quality ratings are given, quality is rated
significantly higher in SBNT treatment than in MET treatment (SBNT mean = 2.31;
MET mean 1.94; CI for the difference = -0.51 to -0.23). Where MET quality ratings
are given, they are higher in MET treatment than in SBNT treatment (MET mean =
2.47; SBNT mean 2.35; CI for the difference = 0.01 to 0.24).

16
Table 3 Quality ratings for individual items by treatment assignment Manual items Treatment MET SBNT
MET items n Mean quality
score (SD) n Mean quality
score (SD) Difference between means
CI for the difference
Feedback 132 2.95 (1.06) 4 1.25 (0.96) 1.702 0.64 – 2.75 Elicit client concerns 162 2.61 (1.04) 15 1.67 (1.35) 0.941 0.38 – 1.51 Elicit self efficacy 70 1.96 (1.08) 17 1.47 (0.87) 0.494 -0.76 – 1.05 Commitment to drinking goal 244 2.49 (1.14) 154 2.28 (1.17) 0.214 -0.25 – 0.442 Ambivalence 89 2.22 (0.96) 4 2.00 (1.41) 0.234 -0.77 – 1.22 Create conflict 36 2.22 (0.99) 3 1.67 (0.58) 0.564 -0.63 – 1.74 Elicit commitment to change 60 2.23 (1.16) 6 2.00 (0.63) 0.234 -0.44 – 0.91 Elicit optimism for change 181 2.39 (1.15) 25 2.00 (1.12) 0.404 -0.90 – 0.87 Reflective listening 255 2.89 (0.62) 165 2.74 (0.84) 0.154 0.01 – 0.30 Exploration of feelings 181 1.98 (0.81) 64 1.75 (0.76) 0.233 0.00 – 0.46 Empathy 241 2.53 (0.82) 150 2.43 (0.96) 0.104 -0.09 – 0.29 SBNT items Homework 43 1.44 (1.03) 100 2.32 (1.05) -0.881 -1.25 – -0.50 Alternative activities 59 1.47 (0.82) 93 1.91 (0.98) -0.442 -0.74 – -0.14 Social support-general 7 1.43 (1.13) 135 2.06 (0.92) -0.634 -1.34 – 0.08 Identify sources of support 45 1.51 (0.66) 101 2.55 (1.12) -1.041 -1.34 – -0.75 Involvement of others 73 1.19 (0.72) 178 2.22 (1.02) -1.031 -1.26 – -0.81 Therapist task oriented 115 2.03 (0.90) 172 2.49 (0.99) -0.451 -0.68 – -0.23 Therapist active agent 10 2.00 (1.05) 38 2.18 (1.18) -0.184 -1.00 – 0.63 Collaboration 7 1.43 (0.53) 74 1.93 (0.78) -0.504 -1.01 – 0.00 Interpersonal focus 214 2.17 (0.86) 171 2.82 (1.10) -0.651 -0.85 – -0.45 Values range from not at all (0) to extensively (4). 1 p<.001 2 p<.005 3 p<.05 4 ns

17
Figure 3 Mean and 95%CI for SBNT quality summary by randomised group 2 sample t-test; p<0.001

18
Figure 4 Mean and 95% CI for MET quality summary by randomised group 2 sample t-test; p=0.04
Concurrent validity
Global ratings of quality of therapists’ treatment delivery were provided in three
categories (high, medium and low quality) by the two treatment specific supervisors
and compared with quality summary ratings made by the primary rater. The
magnitude of ratings between the primary rater and the supervisors showed
concurrence in that rater derived scores were highest for those in the supervisors’ high
category and lowest in the supervisors’ low category. Analysis of variance revealed
an overall significant difference between summary ratings for therapists in each of the
allocated categories of high, medium and low quality given by the treatment specific
supervisors (see Table 4).

19
Table 4
Quality summary scores against supervisors' ratings Supervisor's rating SBNT videos
- quality summary MET videos - quality summary
Low
Mean (SD)
2.09 (0.63)
2.20 (0.53)
N
36
46
Medium
Mean (SD)
2.11 (0.69)
2.53 (0.47)
N
72
105
High
Mean (SD)
2.56 (0.63)
2.55 (0.53)
N
85
107
ANOVA
p-value
<0.001
<0.001
Reliability
Item analysis was conducted separately for frequency of MET items and for
frequency of SBNT items producing Cronbach’s Alpha of .71 for MET items and .76
for SBNT items. Item-total correlations are given in Table 5 and Table 6.
Table 5 Item analysis statistics for frequency of MET items (coefficient alpha .71)
MET items Corrected item-total correlation
Cronbach’s Alpha if item deleted
Feedback .46 .68 Eliciting client concerns about drinking .59 .65 Eliciting self efficacy for change .24 .71 Commitment to drinking goal .19 .72 Ambivalence .35 .70 Creating conflict .20 .71 Eliciting commitment to change drinking .25 .71 Eliciting optimism for change .33 .70 Reflective listening .63 .65 Exploration of feelings .42 .69 Empathy .37 .69

20
Table 6 Item analysis statistics for frequency of SBNT items (coefficient alpha .76)
SBNT items Corrected item-total correlation
Cronbach’s Alpha if item deleted
Homework .48 .73 Alternative activities to drinking .31 .76 Social support for change – general .60 .72 Identify sources of support for change .39 .75 Involvement of others in behaviour change .70 .69 Therapist as task oriented .62 .70 Therapist as an active agent for change .24 .76 Collaboration .38 .75 Interpersonal focus .33 .76
Results of the Principal Components Analysis are shown in Table 7. A single factor
with an eigen value of 5.13 accounting for 25% of the variance emerged. All
treatment components had a loading greater than .29 on this factor with the exception
of creating conflict, eliciting self-efficacy and commitment to goal. MET items all had
positive loadings and SBNT items all had negative loadings suggesting that the more
MET was practised, the less SBNT was practised.

21
Table 7 Principal Components Analysis: frequency of task and style items
Frequency of task and style items Component 1 Homework -.533 Feedback .646 Alternative activities -.397 Elicit client concern .707 Social support - given -.665 Elicit self-efficacy .254 Involvement of others -.798 Commitment to goal .164 Sources of support -.495 Ambivalence .448 Creating conflict .229 Commitment to change .294 Eliciting optimism .500 Task oriented -.725 Active agent for change -.292 Reflective listening .674 Collaboration -.453 Interpersonal focus -.370 Exploration of feelings .461 Empathy .375
Extraction Method: Principal Component Analysis.

22
Inter-rater reliability was measured by comparing independent ratings of frequency
and quality given by two further researchers with those of the primary rater. Table 8
shows the number of videos rated by each of the two independent raters and the
proportion and percentage agreement (measured by identical or adjacent ratings on
the Likert scale) with the primary rater. The third column of Table 8 shows the
proportion and percentage agreement with the primary rater by one or other of the
independent raters when maximum agreement is selected.

23
Table 8 Double Rating: Number (%) of agreements with primary rater
Double Rater 1 Double Rater 2 Double Rater 1 or 2
Frequency: homework 58 / 64 (87%) 58 / 66 (88%) 70 / 73 (96%) Quality: homework 9 / 11 (82%) 15 / 18 (83%) 20 / 20 (100%) Frequency: feedback 60 / 63 (95%) 62 / 66 (94%) 72 / 74 (97%) Quality: feedback 12 / 14 (86%) 11 / 13 (85%) 13 / 14 (93%) Frequency: alternative activities 56 / 63 (89%) 58 / 66 (88%) 69 / 74 (93%) Quality: alternative activities 11 / 16 (69%) 11 / 16 (69%) 11 / 16 (69%) Frequency: elicit client concern 49 / 64 (77%) 57 / 66 (82%) 70 / 73 (96%) Quality: elicit client concern 16 / 21 (76%) 20 / 25 (80%) 24 / 26 (92%) Frequency: social support – general 53 / 64 (83%) 58 / 66 (88%) 63 / 72 (88%) Quality: social support – general 17 / 20 (85%) 18 / 21 (86%) 23 / 26 (89%) Frequency: elicit self-efficacy 46 / 64 (72%) 58 / 66 (88%) 72 / 76 (95%) Quality: self-efficacy 14 / 16 (88%) 14 / 16 (88%) 14 / 16 (88%) Frequency: involvement of others 51 / 64 (80%) 51 / 66 (77%) 63 / 69 (91%) Quality: involvement of others 22 / 28 (79%) 22 / 28 (79%) 22 / 28 (79%) Frequency: commitment to goal 45 / 64 (70%) 50 / 66 (76%) 63 / 68 (93%) Quality: commitment to goal 42 / 53 (79%) 37 / 47 (79%) 55 / 57 (97%) Frequency: sources of support 50 / 64 (78%) 55 / 66 (83%) 68 / 74 (94%) Quality: sources of support 20 / 25 (80%) 18 / 22 (82%) 27 / 29 (93%) Frequency: ambivalence 57 / 64 (89%) 61 / 66 (92%) 73 / 75 (97%) Quality: ambivalence 7 / 8 (87%) 4 / 8 (50%) 9 / 10 (90%) Frequency: creating conflict 51 / 64 (80%) 51 / 64 (80%) 51 / 64 (80%) Quality: creating conflict 1 / 2 (50%) 2 / 3 (67%) 2/ 3 (67%) Frequency: commitment to change 40 / 64 (62%) 59 / 66 (89%) 69 / 74 (93%) Quality: commitment to change 9 / 13 (69%) 9 / 13 (69%) 9 / 13 (69%) Frequency: eliciting optimism 39 / 64 (61%) 55 / 66 (83%) 66 / 72 (92%) Quality: eliciting optimism 23 / 30 (77%) 19 / 24 (79%) 29 / 31 (94%) Frequency: task oriented 51 / 64 (80%) 49 / 66 (74%) 64 / 68 (94%) Quality: task oriented 16 / 21 (76%) 16 / 21 (76%) 16 / 21 (70%) Frequency: active agent for change 61 / 64 (95%) 65 / 66 (98%) 75 / 75 (100%) Quality: active agent for change 1 / 1 (100%) 2 / 2 (100%) 2 / 2 (100%) Frequency: reflective listening 50 / 64 (78%) 51 / 66 (77%) 69 / 73 (95%) Quality: reflective listening 50 / 52 (96%) 48 / 54 (89%) 62 / 62 (100%) Frequency: collaboration 60 / 64 (94%) 60 / 64 (94%) 60 / 64 (94%) Quality: collaboration 3 / 4 (75%) 3 / 4 (75%) 3 / 4 (100%) Frequency: interpersonal focus 44 / 63 (70%) 43 / 63 (70%) 44 / 63 (70%) Quality: interpersonal focus 31 / 40 (77%) 37 / 45 (82%) 45 / 50 (94%) Frequency: exploration of feelings 44 / 64 (69%) 44 / 64 (69%) 44 / 64 (69%) Quality: exploration of feelings 20 / 27 (74%) 25 / 30 (83%) 33 / 34 (97%) Frequency: empathy 45 / 63 (71%) 45 / 63 (71%) 45 / 63 (71%) Quality: empathy 36 / 43 (84%) 33 / 40 (82%) 50 / 51 (98%)
Rater 1 & 2: 57 videos Rater 1 alone: 10 videos Rater 2 alone: 10 videos
24
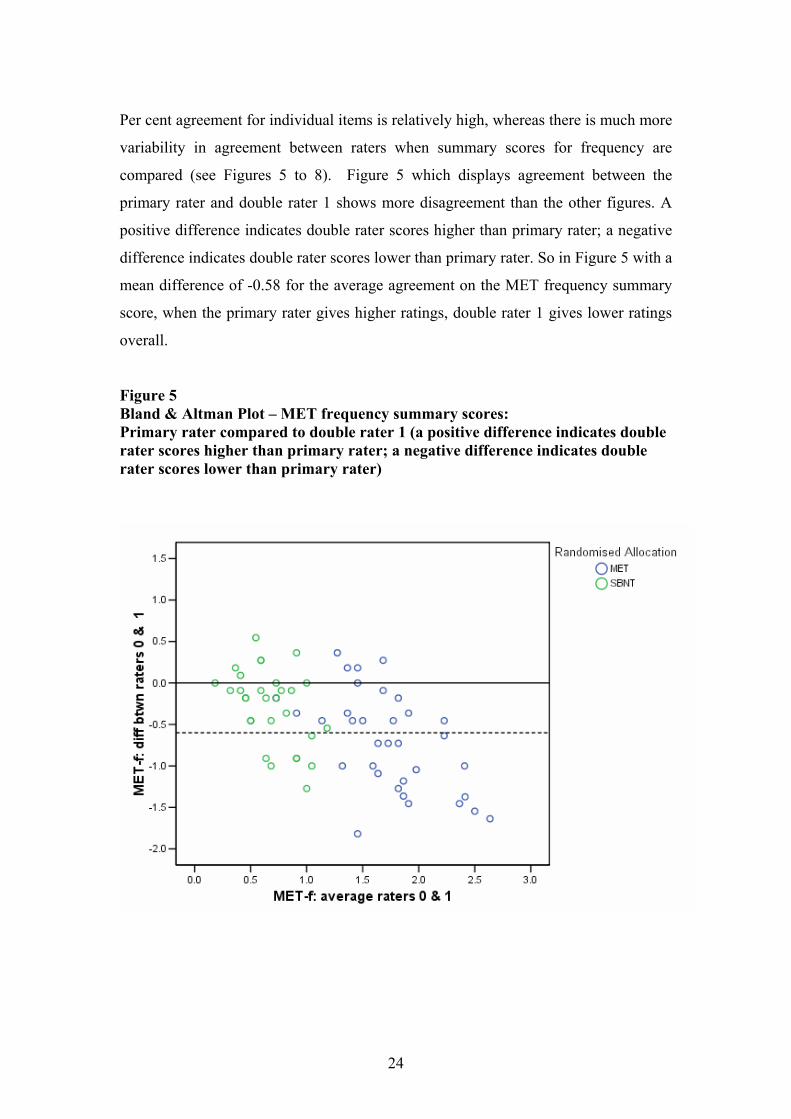
Per cent agreement for individual items is relatively high, whereas there is much more
variability in agreement between raters when summary scores for frequency are
compared (see Figures 5 to 8). Figure 5 which displays agreement between the
primary rater and double rater 1 shows more disagreement than the other figures. A
positive difference indicates double rater scores higher than primary rater; a negative
difference indicates double rater scores lower than primary rater. So in Figure 5 with a
mean difference of -0.58 for the average agreement on the MET frequency summary
score, when the primary rater gives higher ratings, double rater 1 gives lower ratings
overall.
Figure 5 Bland & Altman Plot – MET frequency summary scores: Primary rater compared to double rater 1 (a positive difference indicates double rater scores higher than primary rater; a negative difference indicates double rater scores lower than primary rater)

25
Figure 6 Bland & Altman Plot – MET frequency summary scores: initial rater compared to double rater 2
Figure 7 Bland & Altman plot – SBNT frequency summary scores: Initial rater compared to double rater 1

26
Figure 8 Bland & Altman plot – SBNT frequency summary scores: Initial rater compared to double rater 2
Session management items
A comparison of the mean frequency scores for the six session management items
revealed a significant difference between the scores for each therapy when rated by
the primary rater, with the exception of frequency scores for the item “review inter-
session change”. Frequency ratings were significantly higher for Motivational
Enhancement Therapy on four items: maintaining the structure of the session, setting
the agenda for the session, maintaining a focus on the drinking problem, giving an end
of session summary and for Social Behaviour and Network Therapy on one item,
describing the philosophy of the treatment (see Table 9).

27
Table 9 Comparison of mean frequency scores for session management items for the two treatments
MET n= 258 SBNT n =193 p Maintaining structurea 2.51 1.92 <0.001 Agenda setting 1.21 0.64 <0.001 Philosophy of treatment 0.80 1.48 <0.001 Review inter session change 2.02 2.06 ns Consistency of problem focus 3.28 2.85 <0.001 End of session summary 1.73 0.76 <0.001
a=SBNT251 MET 191
In order to investigate the inter-rater reliability of the instrument with reference to the
session management items, the % agreement between the primary rater and the
second and third rater was calculated. These percentages are shown in Table 10.
Agreement for frequency ratings for end of session summary is low; agreement for
the other end of session management items is much higher.
Table 10 Double Rating: Number (%) of agreements with primary rater
Double Rater 1 Double Rater 2
Double Rater 1 or 2
Frequency: maintaining structure 52 / 64 (81%) 49 / 60 (82%) 61 / 67 (91%) Quality: maintaining structure 42 / 54 (78%) 64 / 61 (89%) 63 / 65 (97%) Frequency: agenda setting 44 / 64 (69%) 58 / 65 (89%) 71 / 73 (97%) Quality: agenda setting 35 / 39 (90%) 33 / 37 (89%) 45 / 45 (100%) Frequency: philosophy of treatment 54 / 65 (81%) 56 / 66 (85%) 68 / 71 (96%) Quality: philosophy of treatment 28 / 32 (87%) 26 / 32 (81%) 36 / 37 (97%) Frequency: review inter session 49 / 65 (75%) 51 / 66 (77%) 66 / 71 (93%) Quality: review inter session 41 / 50 (82%) 39 / 53 (74%) 54 / 59 (92%) Frequency: consistency of problem 43 / 65 (66%) 52 / 66 (79%) 64 / 70 (91%) Quality: consistency of problem 39 / 54 (72%) 47 / 64 (73%) 57 /64 (89%) Frequency: end of session 24 / 65 (37%) 24 / 66 (36%) 34 / 62 (55%) Quality: end of session 24 / 38 (63%) 26 / 41 (63%) 33 / 40 (83%)

28
The frequency of session content items and comparison of their presentation in the
two treatments are shown in Table 11. There was a fairly low level of reporting of the
session topics, especially for action planning, advice giving, alcohol education and
employment. These four topics were also as likely to be given in one treatment as they
were in the other.
Table 11 The frequency of session content topics and a comparison of their presentation between treatments MET sessions n=258; SBNT sessions n=193. (More than one item of session content could be checked per session). Session Content Frequency in MET Frequency in SBNT p< MET Feedback 110 1 0.001 Change plan worksheet 37 0 0.001 Action plan 11 5 ns SBNT Communication skills 0 27 0.001 Coping skills 0 19 0.001 Social support 23 167 0.001 Relapse prevention 0 31 0.001 Alcohol education 12 11 ns Pleasurable activities 17 44 0.001 Employment 12 13 ns Giving advice 14 15 ns
Discussion
The scale developed for process rating the delivery of MET and SBNT in the UK
Alcohol Treatment Trial is able accurately to detect components of each of the
treatments and to discriminate between them. The scale detected that the randomised
treatment was delivered as planned in those sessions included in this study and that
characteristics of the other treatment were either missing or were delivered
infrequently. The summary ratings for each treatment are indicative of the ability of
the scale to discriminate the two treatments. Further, all treatment-specific items in
the UKATT-PRS showed significant differences between the two treatments
indicating that the scale is able both to discriminate the treatments generally and to
detect the delivery of all specific components of the content and style of the two
treatments that are included in the scale.

29
Relatively low frequency ratings were found for four of the MET items (self-efficacy
for change, commitment to change, creating conflict and ambivalence) and four of the
SBNT items (active agent for change, collaboration, homework and alternative
activities to drinking). There are a number of possible explanations for these low
ratings. It is possible that the therapists who were trained and supervised in the two
treatments performed some aspects of these treatments infrequently. That is, the scale
did detect these aspects of the two treatments when they occurred but they did not
occur very frequently. Alternatively it is possible that the therapists performed these
components of the two treatments but the scale did not accurately measure the
performance of these items. Reliability analysis enables us to determine which
explanation is more likely. If the three raters (the main rater and the two independent
raters) were readily able to reach agreement about the frequency with which an item
occurred across a number of sessions then we can assume that the item in the scale
was clearly specified and functional. This would lead us to question the level of
performance of the specific item by therapists in the trial. If the item had lower
reliability between raters and was recorded as occurring infrequently, then it is
possible that the item has not been specified sufficiently to enable an accurate
measure of the extent to which the component of the treatment was delivered in
therapeutic sessions.
The data presented in Table 4 show that seven of the eight items with low frequency
scores have high levels of agreement between the primary rater and the two
independent raters (lowest % agreement: self-efficacy for change: 72%; creating
conflict: 80%, ambivalence: 89%, active agent for change: 95%, collaboration: 94%,
homework: 87%, alternative activities to drinking: 89%). One of the items shows a
lower level of agreement between the primary rater and double rater 1 (commitment
to change drinking: 62%) though a good level of agreement with double rater 2
(89%). It is possible that the item ‘commitment to change drinking’ may need tighter
specification in the manual for the UKATT-PRS. However, the data above point to
the possibility that other items with low frequency scores are likely to have been
detected by the UKATT-PRS when they occurred but the delivery of these items in
the sessions included in this study was infrequent.

30
The scale is better able to detect SBNT than MET on the grounds of quality ratings.
Six out of seven SBNT items were found to have significantly higher quality ratings
in SBNT than in MET treatment, but only four out of seven MET items were found to
have significantly higher quality ratings in MET than in SBNT. It is possible either
that the manual guidance given for rating quality is better able to detect quality of
SBNT delivery than MET delivery or that the treatments have a different number of
components which are both essential and unique to that treatment. For example,
SBNT is likely to contain more essential items that are also unique than does MET;
the latter more established treatment was designed to incorporate basic principles of a
widely used evidence based effective counselling style, namely motivational
interviewing. Its characteristic style of delivery is therefore more likely to be practised
across different treatment types.
To assess the validity of the scale in measuring the quality of delivery, summary
quality scores were compared with global ratings of the quality of therapists’ practice
provided by the treatment supervisors. Supervisors’ ratings were general ratings of
performance of therapists across the whole of the treatment trial and the primary
ratings were derived from observation of individual sessions. The comparison
suggests that the UKATT-PRS is able to measure the quality of therapists’ delivery of
the two treatments.
Internal consistency analysis of the scale, based upon analysis of frequency ratings of
individual items in the two parts of the scale, suggests the possible deletion or
redesign of specific items. The item “Commitment to drinking goal” showed low
corrected item total correlation (.19) with other MET items; it is worth noting that
although this item was performed frequently in MET, it was also performed in SBNT
and is therefore deemed unreliable in detecting MET or in discriminating the
treatments. The items “Eliciting self efficacy for change”, “Creating conflict” and
“Eliciting commitment to change drinking” also have low corrected item total
correlations but Cronbach’s alpha is not raised by their deletion. There remains a
question about their removal from the scale or a clearer specification in the manual.
One item in the SBNT component of the scale has a low corrected item total
reliability, namely “Therapist as active agent for change” (.24) and Cronbach’s alpha
31
is not raised by its deletion. This item describes a component thought to be definitive
of the nature of SBNT (Copello et al. 2002) but in fact performed infrequently by
therapists in this study. Given this, re-specification of the item in the treatment
manual might merit consideration.
Principal components analysis produced a main factor (labelled UKATT treatment)
accounting for 25% of the variance, with positive loadings for MET items with the
exception of creating conflict, eliciting self efficacy and commitment to goal (these
items are deemed suitable for rejection or modification) and negative loadings for all
SBNT items, supporting the evidence that therapists delivered either MET or SBNT.
Measurement of agreement between the three independent raters for individual items
is relatively high and agreement is comparable for MET and SBNT sessions.
Agreement between independent raters is equally high for frequency and quality
ratings. This suggests that the scale is a reliable measure of components of the two
treatments. Agreement between the three raters for summary scores is much more
variable.
The session management part of the scale did not work as predicted. It was
hypothesised that these items would not discriminate between the treatments and in
the event only one of them showed no significant differences between scores for each
of the treatments. Comparison of scores of the three independent raters suggests that
these items can be measured reliably with the exception of end of session summary.
Discussion between the raters revealed that the primary rater had adhered to a stricter
definition of the timing of the end of the session summary than the two independent
raters. Examination of the treatment manuals and training protocols reveals that
aspects of session management were not similarly prescribed in each of the
treatments. Greater and more specific emphasis was given to some of these
components in the MET treatment manual compared to the SBNT treatment manual,
probably accounting for the significant differences in frequency ratings. Reviewing
inter session change was integral to the protocols of both treatments.
Of the eleven session content items contained in the checklist, seven showed
differences between MET and SBNT consistent with treatment specification. Four

32
items do not discriminate between treatments. The session content checklist was
devised as a method of verifying the content of the session. In the event only seven
items were able to do this in a meaningful way.
The overall sample for this kind of study was large and involved a minimum of 452
hours viewing of video recordings with additional time for rating and supplementary
administration. Nonetheless there was a question about potential bias in the study
sample: video recordings were available for only 73% of the study clients where the
design aimed for 100% video recording of sessions. Of those sampled on the basis of
one video from each client, 160 were unrateable, with 101 of these being for MET
and 59 for SBNT. Some therapists might be less well represented in this sample and
more videos were unrateable in one of the treatments (MET) than the other (SBNT).
Conclusion
The UKATT-PRS is a valid and reliable method of rating the delivery of two
psychosocial treatments for alcohol problems and dependence. It is likely to be able to
be adapted for the purpose of rating the delivery of other psycho-social treatments
applying the same principles used in its development. It can therefore form the basis
of measuring performance and treatment fidelity in clinical trials, in treatment audit
and in routine supervision of practice.
References
Barber, J.P., Foltz, C., Crits-Christoph, P. & Chittams, J. (2004) Therapists’
adherence and competence and treatment discrimination in the NIDA Collaborative
Cocaine Treatment Study, Journal of Clinical Psychology, 60, 29 – 41.
Barber, J.P., Liese, B.S. & Abrams, M.J. (2003) Development of the Cognitive
Therapy Adherence and Competence Scale, Psychotherapy Research, 13, 205 – 221.
Barber, J.P., Krakauer, I., Calvo, N., Badgio, P.C. & Faude, J. (1997). Measuring
adherence and competence of dynamic therapists in the treatment of cocaine
dependence, Journal of Psychotherapy Practice and Research, 6, 12 – 24.

33
Barber, J.P., Mercer, D., Krakauer, I. & Calvo, N. (1996) Development of an
adherence/competence rating scale for individual drug counselling, Drug and Alcohol
Dependence, 43, 125 – 132.
Bland, J.M., Altman, D.G. (1986) Statistical methods for assessing agreement
between two methods of clinical measurement, Lancet, i, 307-310.
Bond, G.R., Evans, L., Salyers, M.P., Williams, J. & Hea-Won, K. (2000).
Measurement of fidelity in psychiatric rehabilitation. Mental Health Services
Research, 2, 75 – 87.
Calsyn, R.J. (2000) A checklist for critiquing treatment fidelity studies. Mental
Health Services Research, 2, 107 – 113.
Carroll, K.M., Nich, C. & Rounsaville, B.J. (1998a) Utility of therapist session
checklists to monitor delivery of coping skills treatment for cocaine abusers,
Psychotherapy Research, 8, 307 – 320.
Carroll, K.M., Connors, G.J., Cooney, N.L., DiClemente, C.C., Donovan, D.M.,
Kadden, R.R., Longabaugh, R.L., Rounsaville, B.J., Wirtz, P.W. & Zweben, A.
(1998b). Internal validity of Project MATCH treatments: discriminability and
integrity, Journal of Consulting and Clinical Psychology, 66, 290 – 303.
Carroll, K.M., Kadden, R.M., Donovan, D.M., Zweben, A. & Rounsaville, B. (1994).
Implementing the treatment and protecting the validity of the independent variable in
treatment matching studies, Journal of Studies on Alcohol, Suppl. 12, 149 – 155.
Carroll, K.M., Nich, C., Sifry, R.L., Nuro, K.F., Frankforter, T.L., Ball, S.A., Fenton,
L. & Rounsaville, B.J. (2000) A general system for evaluating therapist adherence and
competence in psychotherapy research in the addictions, Drug and Alcohol
Dependence, 57, 225 – 238.

34
Carroll, K.M. & Nuro, K.F. (1996) The Technology Model: An Introduction to
Psychotherapy Research in Substance Abuse. Yale University Psychotherapy
Development Center, Training Series No.1.
Carroll, K.M. & Rounsaville, B.J. (1990) Can a technology model be applied to
psychotherapy research in cocaine abuse treatment? In L.S. Onken & J.D. Blaine
(Eds.), Psychotherapy and counseling in the treatment of drug abuse, NIDA Research
Monograph Series, Number 104, 91 – 104. (MD: NIDA, Rockville).
Copello, A., Orford, J., Hodgson, R., Tober, G. & Barrett, C. on behalf of the UKATT
Research Team (2002) Social behaviour and network therapy Basic principles and
early experiences, Addictive Behaviors, 27, 345-366.
Crits-Christoph, P, Siqueland, L., Blaine, J., Frank, A., Luborsky, L., Onken, L. S.,
Muenz, L. R., Thase, M. E., Weiss, R. D., Gastfriend, D. R., Woody, G. E., Barber, J.
P., Butler, S. F., Daley, D., Salloum, I., Bishop, S., Najavits, L. M., Lis, J. Mercer, D.,
Griffin, M. L., Moras, K., Beck, A. T. (1999) Psychosocial Treatments for Cocaine
Dependence National Institute on Drug Abuse Collaborative Cocaine Treatment
Study, Archives of General Psychiatry. 56: 493-502.
Elkin, I., Parloff, M.B., Hadley, S.W. & Autry, J.H. (1985) NIMH Treatment of
Depression Collaborative Research Program, Archives of General Psychiatry, 42, 305
– 316.
Elkin, I., Shea, T., Watkins, J.T., Imber, S.D., Sotsky, S.M., Collins, J.F., Glass, D.R.,
Pilkonis, P.A., Leber, W.R., Docherty, J.P., Fiester, S.J. & Parloff, M.B. (1989)
NIMH Treatment of Depression Collaborative Research Program: general
effectiveness of treatment, Archives of General Psychiatry, 46, 971 – 982.
Hill, C.E., O’Grady, K.E. & Elkin, I. (1992) Applying the Collaborative Study
Psychotherapy Rating Scale to rate therapist adherence in cognitive behavior therapy,
interpersonal therapy and clinical management, Journal of Consulting and Clinical
Psychology, 60, 73 – 79.

35
Kazdin, A.E. (1994) Methodology, design and evaluation in psychotherapy research.
In Handbook of Psychotherapy and Behavior Change (4th edn.) (Eds. A.E. Bergin &
S.L. Garfield) pp. 19 – 71.
Miller, W.R. & Mount, K.A. (2001) A small study of training in motivational
interviewing: does one workshop change clinician and client behavior? Behavioural
and Cognitive Psychotherapy, 29, 457 – 471.
Miller, W. R., Zweben, A., DiClemente, C. C. & Rychtarik, R. G. (1995)
Motivational enhancement therapy manual: a clinical guide for therapists treating
individuals with alcohol abuse and dependence. NIAAA Project MATCH monograph
series, Volume 2, Rockville, USA.
Miller, W.R., Yahne, C.E. & Tonigan, J.S. (2003) Motivational interviewing in drug
abuse services: a randomised trial, Journal of Consulting and Clinical Psychology, 71,
754 – 763.
Moncher, F.J. & Prinz, R.J. (1991) Treatment fidelity in outcome studies, Clinical
Psychology Review, 11, 247 – 266.
Moyers, T., Martin, T., Catley, D., Harris, K. & Ahluwalia, J.S. (2003). Assessing the
integrity of motivational interviewing interventions: reliability of the Motivational
Interviewing Skills Code, Behavioural and Cognitive Psychotherapy, 31, 177 – 184.
Project MATCH Research Group (1997) Matching Alcoholism Treatment to client
Heterogeneity: Project Match Research Group Post Treatment Drinking Outcomes,
Journal for the Study of Alcohol, 58, 07-29.
Strang, J. & McCambridge, J. (2004). Can the practitioner correctly predict outcome
in motivational interviewing? Journal of Substance Abuse Treatment, 27, 83 – 88.
Waltz, J., Addis, M.E., Koerner, K. & Jacobson, N.S. (1993) Testing the integrity of a
psychotherapy protocol: assessment of adherence and competence, Journal of
Consulting and Clinical Psychology, 61, 620 – 630.
36
UKATT RESEARCH TEAM (2001) United Kingdom Alcohol Treatment Trial
(UKATT): Hypotheses, design and methods, Alcohol & Alcoholism, 36, 11-21.
Waskow, I. E. (1984). Specification of the technique variable in the NIMH Treatment
of Depression Collaborative Research Program. In J.B. Williams & R.L. Spitzer
(Eds.) Psychotherapy Research (New York, Guilford Press) pp. 150 – 159.
Young, J. & Beck, A.T. (1980) Development of the Cognitive Therapy Scale.
Unpublished manuscript. Philadelphia: Center for Cognitive Therapy.

37
Appendix 1 Manual items
Session management Maintaining Structure Agenda Setting Explanation of Philosophy of Treatment or Treatment Session Reviewing Inter - Session Change Consistency of Problem Focus End of Session Summary Specific tasks Homework Drinking – Feedback/Negative Consequences Alternative Activities to Drinking Eliciting Client Concerns about Drinking Social Support for Change - General Eliciting Self-efficacy for Change Involvement of Others in Behaviour Change Commitment to Drinking Goal Identify Sources of Support for Change Ambivalence Creating Conflict Eliciting Commitment to Change Drinking Eliciting Optimism for Change Therapist style Therapist as Task Oriented Therapist as Active Agent for Change Reflective listening Collaboration Interpersonal focus Exploration of feelings
Empathy