validation data for direct plating method for trh name of ... · validation data for direct plating...
TRANSCRIPT
Validation Data for Direct plating method for trh
Name of Method Submitter: Jessica L. Jones, Ph.D.
Specific purpose or intent of the method for use in the NSSP: Seeking approval for this method as an
approved limited use method that can be used as appropriate for PHP validation and verification testing,
as well as environmental testing such as that which may be required for the re-opening of growing areas
closed due to illness.
Validation Criteria Data: For evaluation of all validation criteria below, PHP oysters were obtained in the
best effort to find samples free of the target organism. A different lot of PHP oysters was used for each
sample. For each sample, a minimum of 10 animals were used to prepare a homogenate. The
homogenate was then aliquoted and appropriate aliquots spiked with a tdh+/trh+ Vibrio
parahaemolyticus (unless otherwise noted), while one aliquot was left unioculated (sample blank).
Spike levels were determined by spread plating dilution of the culture in triplicate onto TSA+2% NaCl.
Appropriate aliquots of spiked samples were spread plated onto T1N3 agar and colony lifts hybridized
with an alkaline phosphatase-labeled probe specific for trh.
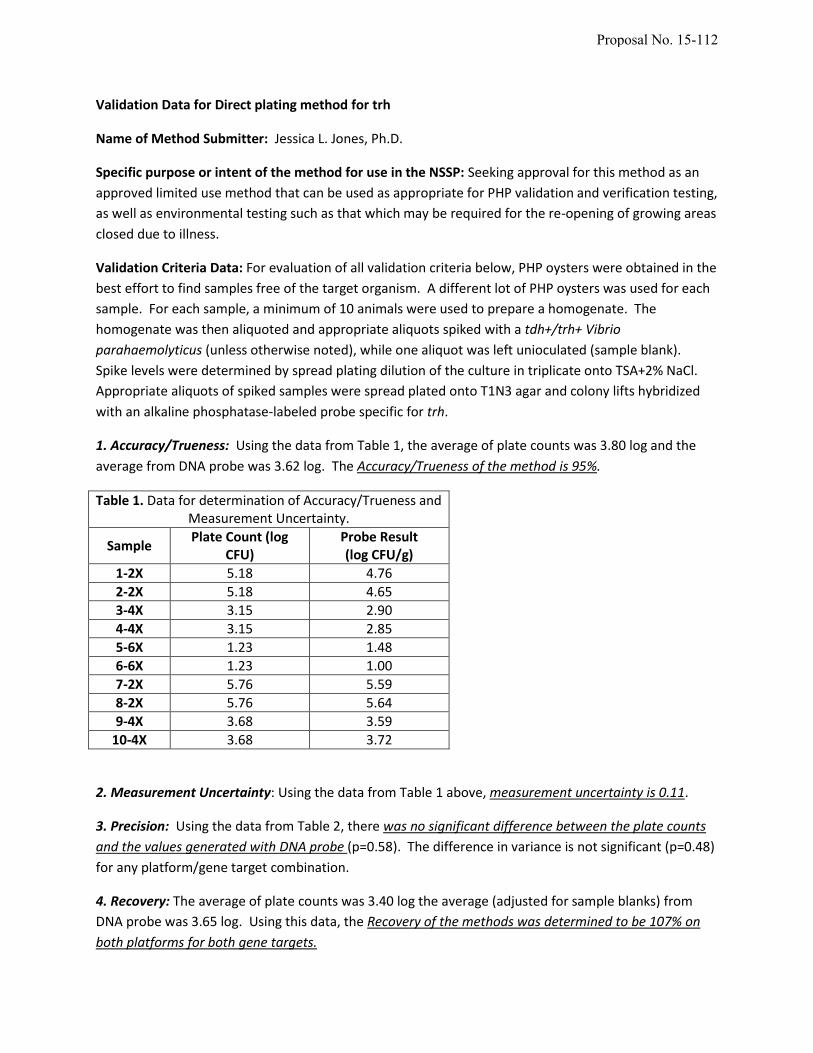
1. Accuracy/Trueness: Using the data from Table 1, the average of plate counts was 3.80 log and the
average from DNA probe was 3.62 log. The Accuracy/Trueness of the method is 95%.
Table 1. Data for determination of Accuracy/Trueness and Measurement Uncertainty.
Sample Plate Count (log
CFU) Probe Result (log CFU/g)
1-2X 5.18 4.76
2-2X 5.18 4.65
3-4X 3.15 2.90
4-4X 3.15 2.85
5-6X 1.23 1.48
6-6X 1.23 1.00
7-2X 5.76 5.59
8-2X 5.76 5.64
9-4X 3.68 3.59
10-4X 3.68 3.72
2. Measurement Uncertainty: Using the data from Table 1 above, measurement uncertainty is 0.11.
3. Precision: Using the data from Table 2, there was no significant difference between the plate counts
and the values generated with DNA probe (p=0.58). The difference in variance is not significant (p=0.48)
for any platform/gene target combination.
4. Recovery: The average of plate counts was 3.40 log the average (adjusted for sample blanks) from
DNA probe was 3.65 log. Using this data, the Recovery of the methods was determined to be 107% on
both platforms for both gene targets.
Proposal No. 15-112

Table 2. Data for determination of Precision and Recovery
Sample Aliquot Plate Count (log
CFU) Probe Result (log CFU/g)
1 Blank N/A <1.00
1 2X 5.18 4.76
1 2Z 5.18 5.38
1 4X 3.18 2.48
1 4Z 3.18 2.85
1 6X 1.18 <1.00
1 6Z 1.18 1.00
3 Blank N/A <1.00
3 2X 5.15 4.65
3 2Z 5.15 4.76
3 4X 3.15 2.90
3 4Z 3.15 3.04
3 6X 1.15 <1.00
3 6Z 1.15 1.78
5 Blank N/A 1.85
5 2X 5.23 3.54
5 2Z 5.23 3.84
5 4X 3.23 2.70
5 4Z 3.23 3.00
5 6X 1.23 1.48
5 6Z 1.23 1.30
7 Blank N/A 1.00
7 2X 5.76 5.59
7 2Z 5.76 5.23
7 4X 3.76 3.57
7 4Z 3.76 3.64
7 6X 1.76 1.78
7 6Z 1.76 1.7
9 Blank N/A <1.00
9 2X 5.68 5.25
9 2Z 5.68 5.11
9 4X 3.68 3.59
9 4Z 3.68 3.54
9 6X 1.68 2.94
9 6Z 1.68 1.48
5. Specificity: Samples were prepared as above and the interfering organism was spiked at an ~4 log
higher concentration than Vibrio parahaemolyticus. Using the data from Table 3, the average Specificity
of the method is 1.38, which is within the 95% confidence interval of the method (0.44) from 1.
Table 3. Data for determination of Specificity.
Probe Result
Proposal No. 15-112

(log CFU/g)
Sample Spiked with Vp only Spiked with Vp and Vv
6-Blank <1.00 ---
6-6T 1.60 1.30
6-6U 1.30 <1.00
6-6W 1.48 1.48
6-6X 1.00 1.00
6-6Z 1.48 1.48
6. Working and Linear Range: Based on the data presented in Table 4, there is a significant correlation
between the plate counts and CFU values by DNA probe (p<0.001). The correlation coefficient is 0.96,
demonstrating the linearity of the method.
Table 4. Data for determination of Working and Linear Range, Limit of Detection, and Limit of Quantitation/Sensitivity
Sample Aliquot Plate Count
(log CFU) Probe Result (log CFU/g)
1 1X 6.18 5.36
1 1Z 6.18 6.18
1 2X 5.18 4.76
1 2Z 5.18 5.38
1 4X 3.18 2.48
1 4Z 3.18 2.85
1 6X 1.18 <1.00
1 6Z 1.18 1.00
1 7X 0.18 <1.00
1 7X 0.18 <1.00
3 1X 6.15 6.29
3 1Z 6.15 6.09
3 2X 5.15 4.65
3 2Z 5.15 4.76
3 4X 3.15 2.90
3 4Z 3.15 3.04
3 6X 1.15 <1.00
3 6Z 1.15 1.78
3 7X 0.15 1.00
3 7Z 0.15 <1.00
5 1X 6.23 5.57
5 1Z 6.23 5.64
5 2X 5.23 3.54
5 2Z 5.23 3.84
5 4X 3.23 2.70
5 4Z 3.23 3.00
5 6X 1.23 1.48
Proposal No. 15-112

5 6Z 1.23 1.30
5 7X 0.23 1.30
5 7Z 0.23 1.48
7 1X 6.76 6.68
7 1Z 6.76 6.37
7 2X 5.76 5.59
7 2Z 5.76 5.23
7 4X 3.76 3.57
7 4Z 3.76 3.64
7 6X 1.76 1.78
7 6Z 1.76 1.70
7 7X 0.76 1.00
7 7Z 0.76 <1.00
9 1X 6.68 6.44
9 1Z 6.68 4.70
9 2X 5.68 5.25
9 2Z 5.68 5.11
9 4X 3.68 3.59
9 4Z 3.68 3.54
9 6X 1.68 2.94
9 6Z 1.68 1.48
9 7X 0.68 <1.00
9 7Z 0.68 <1.00
7. Limit of Detection: The Limit of Detection of the method is 10 CFU/g. This is reliant upon the amount
of sample (0.1g) that can be tested by the spread plate method.
8. Limit of Quantification/ Sensitivity: The limit of quantification/sensitivity is also reliant upon the
amount of sample that can be tested.
9. Ruggednes: Replicate spiked aliquots from each sample were processed with different batches of
media/ lots of reagents at the same time. Different samples were processed on different days. Using
the data in Table 5, there was no significant difference (p=0.94) between batches/lots of media and
reagents.
Table 5. Data for determination of Ruggedness.
Sample Probe Result (log CFU/g)
Replicate 1 (X) Replicate 2 (Z)
2 4.78 4.88
4 2.85 2.78
Proposal No. 15-112

6 1.00 1.48
8 5.64 5.73
10 3.72 3.57
10. Matrix Effects: Effects of oyster matrix on the performance of the method was taken into
consideration in testing all of the above criteria by using the sample blank.
11. Additional Data: Inclusivity/Exclusivity. Control filters with the isolates listed below were prepared
and tested as outlined above. All isolates. All isolates gave the expected reaction, demonstrating 100%
Inclusivity/Exclusivity.
Species
Number of
Strains Tested
Number
trh-positive
V. parahaemolyticus† 43 43
V. parahaemolyticus* 39 0
V. cholerae 25 0
V. vulnificus 13 0
V. metschnikovii 12 0
V. fluvialis 6 0
V. hollisae 5 0
V. algenolyticus 2 0
Salmonella spp. 20 0
Listeria spp. 20 0
Other non-Vibrio species 15 0
† V. parahaemolyticus strains previously determined to be trh-positive.
* V. parahaemolyticus strains previously determined to be trh-negative.
Step-by-step procedure including equipment, reagents and safety requirements necessary to run the
method:
1. Special Equipment, Media, and Reagents 1.1. Special Equipment and Materials Required
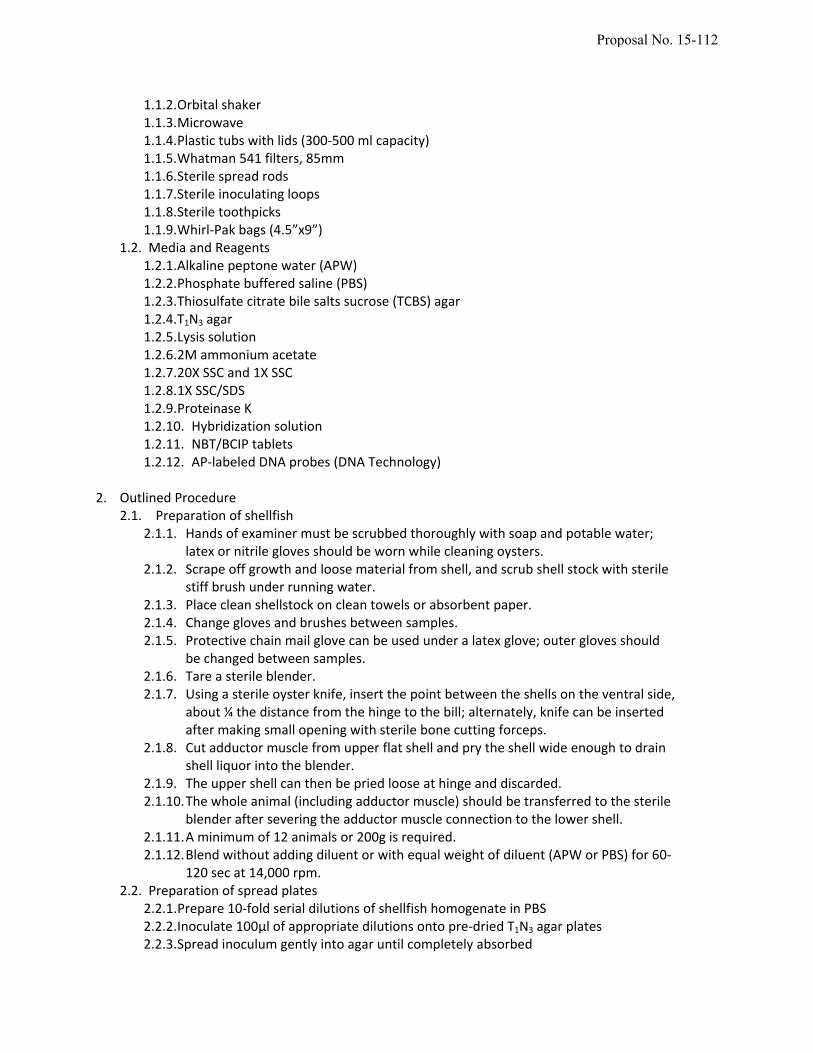
1.1.1. Shaking water bath(s) (42°C and 54°C) 1.1.2. Orbital shaker
Proposal No. 15-112

1.1.3. Microwave 1.1.4. Plastic tubs with lids (300-500 ml capacity) 1.1.5. Whatman 541 filters, 85mm 1.1.6. Sterile spread rods 1.1.7. Sterile inoculating loops 1.1.8. Sterile toothpicks 1.1.9. Whirl-Pak bags (4.5”x9”)
1.2. Media and Reagents 1.2.1. Alkaline peptone water (APW) 1.2.2. Phosphate buffered saline (PBS) 1.2.3. Thiosulfate citrate bile salts sucrose (TCBS) agar 1.2.4. T1N3 agar 1.2.5. Lysis solution 1.2.6. 2M ammonium acetate 1.2.7. 20X SSC and 1X SSC 1.2.8. 1X SSC/SDS 1.2.9. Proteinase K 1.2.10. Hybridization solution 1.2.11. NBT/BCIP tablets 1.2.12. AP-labeled DNA probes (DNA Technology)
2. Outlined Procedure
2.1. Preparation of shellfish 2.1.1. Hands of examiner must be scrubbed thoroughly with soap and potable water;
latex or nitrile gloves should be worn while cleaning oysters. 2.1.2. Scrape off growth and loose material from shell, and scrub shell stock with sterile
stiff brush under running water. 2.1.3. Place clean shellstock on clean towels or absorbent paper. 2.1.4. Change gloves and brushes between samples. 2.1.5. Protective chain mail glove can be used under a latex glove; outer gloves should
be changed between samples. 2.1.6. Tare a sterile blender. 2.1.7. Using a sterile oyster knife, insert the point between the shells on the ventral side,
about ¼ the distance from the hinge to the bill; alternately, knife can be inserted after making small opening with sterile bone cutting forceps.
2.1.8. Cut adductor muscle from upper flat shell and pry the shell wide enough to drain shell liquor into the blender.
2.1.9. The upper shell can then be pried loose at hinge and discarded. 2.1.10. The whole animal (including adductor muscle) should be transferred to the sterile
blender after severing the adductor muscle connection to the lower shell. 2.1.11. A minimum of 12 animals or 200g is required. 2.1.12. Blend without adding diluent for 60-120 sec at 14,000 rpm.
2.2. Preparation of spread plates 2.2.1. Prepare 10-fold serial dilutions of shellfish homogenate in PBS 2.2.2. Inoculate 100µl of appropriate dilutions onto pre-dried T1N3 agar plates 2.2.3. Spread inoculum gently into agar until completely absorbed 2.2.4. Invert plates and incubate at 30-37°C overnight.
Proposal No. 15-112

2.2.5. Alternately, this method can be utilized with suspect isolates replicated to T1N3 agar from 96 well plates obtained from a standard MPN method
2.3. DNA Probe Colony Hybridization 2.4. Alkaline phosphatase-labeled oligonucleotide probes (AP-tlh, AP-tdh, and AP-trh) can
be stored in the refrigerator (4°C) for 1-2 years; do not freeze. 2.5. Filter Preparation
2.5.1. Label #541 Whatman filters with sample number, date, analyst initials, and probe to be hybridized with (tlh, tdh, or trh). Make sure orientation of filter is noted so that positive spots can be correlated to the appropriate well in the microtiter plate. A dot near the A1 well is sufficient.
2.5.2. Place each filter label-side down on appropriate T1N3 plate; apply gentle pressure to ensure contact with each colony. Allow labeled filter to sit at RT for 1-30 min. Transfer each filter with colony-side up to a plastic or glass petri dish lid containing 1 ml of lysis solution.
2.5.3. Microwave filters in petri dishes (full power) for 15-20 sec/filter depending on wattage of microwave; rotate dishes with filters and repeat microwaving. Filters should be hot and almost completely dry but not brown.
2.5.4. Transfer filters to a plastic wash container (up to 30 filters can be combined in one container) and neutralize with ammonium acetate (4 ml/filter) for 5 min on shaker at RT.
2.5.5. Decant ammonium acetate and rinse filters 2 times with 1X SSC buffer (10 ml/filter), for 2 min each time. (Filters can be air dried and stored at this point.)
2.6. Proteinase K (proK) treatment 2.6.1. Prepare proK solution (this is made by adding 10 ml/filter of 1X SSC and 20
µl/filter of proK stock solution) for the appropriate number of filters. Place filters (up to 30) in plastic wash container of proK solution. Incubate for 30 min in a 42°C water bath with shaking (50 rpm) to destroy naturally occurring alkaline-phosphatase and digest bacterial protein.
2.6.2. Decant proK solution. Rinse filter 3 times in 1X SSC (10 ml/filter) for 10 min at RT with shaking at 50 rpm. (Filters can be air dried by placing on paper towels and stored when completely dry.)
2.7. Hybridization 2.7.1. Place up to 5 proK-treated filters (either dried or straight from treatment) in a
Whirl-Pak bag. Add 10 ml of pre-warmed hybridization buffer and close bag to exclude air. Avoid trapping air bubbles. Incubate filters for 30 min at 54°C in a shaking (50 rpm) water bath.
2.7.2. Pour off buffer from bag and add 10 ml fresh pre-warmed buffer/bag. Add probe (final conc. is 0.5 pmol/ml) to bag with filters. Reseal bag, excluding air, and incubate 1 h in a 54°C water bath with shaking. The temperature is critical for hybridization and washing steps.
2.7.3. Remove filters from hybridization bags and place in plastic wash container(s). 2.7.4. Add 10 ml/filter 1X SSC/1% SDS . Incubate in a 54°C water bath with shaking for
10 min. Repeat wash a second time. 2.7.5. Rinse filter 5 times for 5 min each in 1X SSC at RT on an orbital shaker, 100 rpm.
2.8. Color development
Proposal No. 15-112

2.8.1. In petri dish, add 20 ml of NBT/BCIP solution. Add filters (5 or fewer) to dish and incubate with gentle shaking at 35-37°C; cover to omit light. Check development of positive control every 30 min.
2.8.2. Transfer filters to a plastic wash container and add tap water (10 ml/filter). Rinse filters at RT with shaking for 10 min. Repeat rinse 2 additional times to stop color development. Do not expose filters to light as they will continue to develop. Consider purple or brown spots positive.
Proposal No. 15-112

Validation Data for Direct Plating Method for trh, Proposal 15‐112
Name of Method Submitter: Jessica L. Jones, Ph.D.
Specific purpose or intent of the method for use in the NSSP: Seeking approval for this method as an
approved limited use method that can be used as appropriate for PHP validation and verification testing
of oysters, as well as environmental testing such as that which may be required for the re‐opening of
growing areas closed due to illness.
Validation Criteria Data: For evaluation of all validation criteria below, PHP oysters were obtained in the
best effort to find samples free of the target organism. A different lot of PHP oysters was used for each
sample. For each sample, a minimum of 10 animals were used to prepare a homogenate. The
homogenate was then aliquoted and appropriate aliquots spiked with a tdh+/trh+ Vibrio
parahaemolyticus culture (unless otherwise noted), while one aliquot was left unioculated (sample
blank). Spike levels were determined by spread plating dilutions of the culture in triplicate onto TSA+2%
NaCl. Appropriate aliquots of spiked samples were spread plated onto T1N3 agar and colony lifts
hybridized with an alkaline phosphatase‐labeled probe specific for trh as detailed in the step‐by‐step
procedure. Data were analyzed as described in the “SLV Documents for Marine Biotoxin and Non‐MPN
Based Microbiological Methods” on the ISSC website.
Table 1. Data for determination of Accuracy/Trueness and Measurement Uncertainty
Sample Plate Count (log CFU/g)
Sample Blank Probe Result (log CFU/g)
Spiked Sample Probe Result (log CFU/g)
1‐2X 5.18 <1.00 4.76
2‐2X 5.18 <1.00 4.78
3‐4X 3.15 <1.00 2.90
4‐4X 3.15 <1.00 2.85
5‐6X 1.15 1.85 1.48
6‐6X 1.15 <1.00 1.00
7‐2X 5.76 1.00 5.59
8‐2X 5.76 <1.00 5.64
9‐4X 3.68 <1.00 3.59
10‐4X 3.68 <1.00 3.72
11‐6X 1.60 <1.00 1.70
12‐6X 1.60 <1.00 1.85
13‐2X 5.72 <1.00 5.70
14‐2X 5.72 <1.00 5.44
15‐4X 3.62 <1.00 3.49
16‐4X 3.62 <1.00 3.53
17‐6X 1.74 1.00 1.70
18‐6X 1.62 1.00 2.04
19‐2X 5.74 <1.00 5.45
20‐6X 1.62 1.00 1.78
Proposal No. 15-112

1. Accuracy/Trueness: Using the data from Table 1, the average of plate counts was 3.52 log and the
average from DNA probe (after adjustment with sample blank results) was 3.48 log. The
Accuracy/Trueness of the method is 99%.
Measurement Uncertainty: Using the data from Table 1 above, measurement uncertainty is 0.13 log
CFU/g.
2. Ruggedness: Replicate spiked
aliquots from each sample were
processed with different batches of
media/ lots of reagents at the same
time. Different samples were
processed on different days. Using
the data in Table 2, a left skew of
both sets of data was observed, with
a variance ratio of 1.09 (not
significant, p=0.91), so a paired t‐test
was used to compare the results.
There was no significant difference
(p=0.94) between batches/lots of
media and reagents.
Table 3. Data for determination of Precision and Recovery
Sample Aliquot Plate Count (log CFU/g)
Sample Blank Probe Result (log CFU/g)
Spiked Sample Probe Result (log CFU/g)
1 2x 5.18 <1.00 4.76
1 2z 5.18 <1.00 5.38
1 4x 3.18 <1.00 2.48
1 4z 3.18 <1.00 2.85
1 6x 1.18 <1.00 <1.00
1 6z 1.18 <1.00 1.00
3 2x 5.15 <1.00 4.65
3 2z 5.15 <1.00 4.76
3 4x 3.15 <1.00 2.90
3 4z 3.15 <1.00 3.04
3 6x 1.15 <1.00 <1.00
3 6z 1.15 <1.00 1.78
5 2x 5.16 1.85 3.54
5 2z 5.16 1.85 3.84
5 4x 3.16 1.85 2.70
5 4z 3.16 1.85 3.00
Table 2. Data for determination of Ruggedness
Sample Probe Result (log CFU/g)
Replicate 1 (X) Replicate 2 (Z)
2 4.78 4.88
4 2.85 2.78
6 1.00 1.48
8 5.64 5.73
10 3.72 3.57
12 1.85 1.85
14 5.44 5.29
16 3.53 3.71
18 2.04 2.08
20 1.78 1.78
Proposal No. 15-112

5 6x 1.15 1.85 1.48
5 6z 1.15 1.85 1.30
7 2x 5.76 1.00 5.59
7 2z 5.76 1.00 5.23
7 4x 3.76 1.00 3.57
7 4z 3.76 1.00 3.64
7 5x 2.76 1.00 2.58
7 5z 2.76 1.00 2.57
7 6x 1.76 1.00 1.78
7 6z 1.76 1.00 1.70
9 2x 5.68 <1.00 5.25
9 2z 5.68 <1.00 5.11
9 4x 3.68 <1.00 3.59
9 4z 3.68 <1.00 3.54
9 6x 1.68 <1.00 2.94
9 6z 1.68 <1.00 1.48
11 2x 5.60 <1.00 5.54
11 2z 5.60 <1.00 5.46
11 4x 3.60 <1.00 3.48
11 4z 3.60 <1.00 3.71
11 6x 1.60 <1.00 1.70
11 6z 1.60 <1.00 1.00
13 2x 5.72 <1.00 5.70
13 2z 5.72 <1.00 5.08
13 4x 3.72 <1.00 3.36
13 4z 3.72 <1.00 3.36
13 6x 1.72 <1.00 1.48
13 6z 1.72 <1.00 1.30
15 2x 5.62 <1.00 5.53
15 2z 5.62 <1.00 4.98
15 4x 3.62 <1.00 3.49
15 4z 3.62 <1.00 3.48
15 6x 1.62 <1.00 1.30
15 6z 1.62 <1.00 1.00
17 2x 5.74 1.00 5.51
17 2z 5.74 1.00 5.42
17 4x 3.74 1.00 3.57
17 4z 3.74 1.00 3.64
17 6x 1.74 1.00 1.70
17 6z 1.74 1.00 1.90
19 2x 5.74 <1.00 5.45
Proposal No. 15-112

19 2z 5.74 <1.00 5.64
19 4x 3.74 <1.00 3.51
19 4z 3.74 <1.00 3.45
19 6x 1.74 <1.00 1.78
19 6z 1.74 <1.00 1.70
3. Precision: Using the data from Table 3, there was no significant difference (p>0.05) in the variance
ratio across the range of concentrations, with a coefficient of variance of 45% for the method.
Additionally, there was no significant difference between the plate counts and the values generated with
DNA probe (p=0.68).
Recovery: The average of plate counts was 3.51 log CFU/g the average (adjusted for sample blanks) from
DNA probe was 3.28 log CFU/g. Using this data, the Recovery of the method was determined to be 93%.
Table 4. Data for determination of Specificity
Sample Aliquot (Vp only) Log CFU/g Aliquot (Vp and Vv) Log CFU/g
6 6T 1.60 VVT 1.30
6 6U 1.30 VVU <1.00
6 6W 1.48 VVW 1.48
6 6X 1.00 VVX 1.00
6 6Z 1.48 VVZ 1.48
Sample Aliquot (Vp only) Log CFU/g Aliquot (Vp and Vc) Log CFU/g
12 6T 1.60 VCT 1.48
12 6U 2.00 VCU <1.00
12 6W 1.70 VCW 1.60
12 6X 1.85 VCX 1.48
12 6Z 1.85 VCZ 1.00
Sample Aliquot (Vp only) Log CFU/g Aliquot (Vp and Vf) Log CFU/g
18 6T 1.95 VFT <10.00
18 6U 2.11 VFU <10.00
18 6W 2.11 VFW <10.00
18 6X 2.04 VFX <10.00
18 6Z 2.08 VFZ <10.00
Sample Aliquot (Vp only) Log CFU/g Aliquot (Vp and Va) Log CFU/g
20 6T 1.70 VAT <1.00
20 6U 1.48 VAU <1.00
20 6W 1.78 VAW <1.00
20 6X 1.78 VAX <1.00
20 6Z 1.78 VAZ <1.00
Proposal No. 15-112

4. Specificity: Interfering organisms tested were V. vulnificus (Vv), V. cholerae (Vc), V. fluvialis (Vf), and
V. alginolyticus (Va). Using the data from Table 4, the overall average Specificity Index of the method is
1.43, which is within the 95% confidence interval of the method (0.44) from 1.
However, significant differences between the average specificity indices and 1 were observed when
examining the data from each interfering organism. Differences were significant for V. fluvialis
(p<0.001) and V. alginolyticus (p<0.001), as well as V. cholerae (p=0.05). This significance is likely due to
the differences in spike levels, rather than the specific organism as the ratio of V. parahaemolyticus to
interfering organism was 1:13000, 1:6000, 1:1500, and 1:240 for V. fluvialis, V. alginolyticus, V. cholerae,
and V. vulnificus, respectively. Additionally, it should be noted that filters were lifted from plates with
more colonies than recommended from the samples with the interfering organisms to give the best
likelihood of enumerating V. parahaemolyticus. Together, this indicates that the method specificity is
dependent on the ratio of target to interfering organism, where ratios of 1:1000 may cause interference,
but lower ratios do not. In real world samples, this ratio of trh+ V. parahaemolyticus to other Vibrio
species, is unlikely, supporting the fit‐for‐purpose of this method.
Table 5. Data for Working/Linear Range
Sample Plate Count Replicate 1 (X) Replicate 2 (Z)
1‐1 6.18 5.36 6.18
1‐2 5.18 4.76 5.38
1‐4 3.18 2.48 2.85
1‐5 2.18 2.00 1.85
1‐6 1.18 <1.00 1.00
1‐7 0.18 <1.00 <1.00
3‐1 6.15 6.29 6.09
3‐2 5.15 4.65 4.76
3‐4 3.15 2.90 3.04
3‐5 2.15 2.23 2.68
3‐6 1.15 <1.00 1.78
3‐7 0.15 1.00 <1.00
5‐1 6.16 5.57 5.64
5‐2 5.16 3.54 3.84
5‐4 3.16 2.70 3.00
5‐5 2.16 2.20 2.38
5‐6 1.15 1.48 1.30
5‐7 0.15 1.30 1.48
7‐1 6.76 6.68 6.37
7‐2 5.76 5.59 5.23
7‐4 3.76 3.57 3.64
7‐5 2.76 2.58 2.57
7‐6 1.76 1.78 1.70
Proposal No. 15-112

7‐7 0.76 1.00 <1.00
9‐1 6.68 6.44 4.70
9‐2 5.68 5.25 5.11
9‐4 3.68 3.59 3.54
9‐5 2.68 2.49 2.79
9‐6 1.68 2.94 1.48
9‐7 0.68 <1.00 <1.00
11‐1 6.60 6.40 6.44
11‐2 5.60 5.54 5.46
11‐4 3.60 3.48 3.71
11‐5 2.60 3.06 2.84
11‐6 1.60 1.70 1.00
11‐7 0.60 <1.00 <1.00
13‐1 6.72 6.71 5.55
13‐2 5.72 5.70 5.08
13‐4 3.72 3.36 3.36
13‐5 2.72 2.48 2.38
13‐6 1.72 1.48 1.30
13‐7 0.72 <1.00 <1.00
15‐1 6.62 6.22 6.40
15‐2 5.62 5.53 4.98
15‐4 3.62 3.49 3.48
15‐5 2.62 1.85 1.60
15‐6 1.62 1.30 1.00
15‐7 0.62 <1.00 <1.00
17‐1 6.74 6.33 6.39
17‐2 5.74 5.51 5.42
17‐4 3.74 3.57 3.64
17‐5 2.74 2.60 2.72
17‐6 1.74 1.70 1.90
17‐7 0.74 1.30 <1.00
19‐1 6.74 6.36 6.32
19‐2 5.74 5.45 5.64
19‐4 3.74 3.51 3.45
19‐5 2.74 2.72 2.53
19‐6 1.74 1.78 1.70
19‐7 0.74 1.30 <1.00
5. Working and Linear Range: Based on the data presented in Table 4, the linear range of the method is
50 to 100,000 CFU/g. There is a significant correlation between the plate counts and CFU values by
DNA probe (p<0.001), with a correlation coefficient is 0.93.
Proposal No. 15-112

Limit of Detection: The theoretical LOD based on the data above is 4.7 CFU/g. However, this is reliant
upon the amount of sample (0.1g) that can be tested by the spread plate method. Therefore, the Limit
of Detection of the method is 10 CFU/g.
Limit of Quantitation/ Sensitivity: The limit of quantification/sensitivity is also reliant upon the amount
of sample that can be tested. As such, the Limit of Quantitation of the method is 10 CFU/g.
Additional Data: Inclusivity/Exclusivity. Control filters with the isolates listed below were prepared and
tested as outlined above. All isolates. All isolates gave the expected reaction, demonstrating 100%
Inclusivity/Exclusivity.
Species
Number of
Strains Tested
Number
trh‐positive
V. parahaemolyticus† 43 43
V. parahaemolyticus* 39 0
V. cholerae 25 0
V. vulnificus 13 0
V. metschnikovii 12 0
V. fluvialis 6 0
Grimontia hollisae 5 0
V. alginolyticus 2 0
Salmonella spp. 20 0
Listeria spp. 20 0
Other non‐Vibrio species 15 0
† V. parahaemolyticus strains previously determined to be trh‐positive.
* V. parahaemolyticus strains previously determined to be trh‐negative.
Step‐by‐step procedure including equipment, reagents and safety requirements necessary to run the
method:
1. Special Equipment, Media, and Reagents 1.1. Special Equipment and Materials Required
1.1.1. Shaking water bath(s) (42°C and 54°C)
Proposal No. 15-112
1.1.2. Orbital shaker 1.1.3. Microwave 1.1.4. Plastic tubs with lids (300‐500 ml capacity) 1.1.5. Whatman 541 filters, 85mm 1.1.6. Sterile spread rods 1.1.7. Sterile inoculating loops 1.1.8. Sterile toothpicks 1.1.9. Whirl‐Pak bags (4.5”x9”)
1.2. Media and Reagents 1.2.1. Alkaline peptone water (APW) 1.2.2. Phosphate buffered saline (PBS) 1.2.3. Thiosulfate citrate bile salts sucrose (TCBS) agar 1.2.4. T1N3 agar 1.2.5. Lysis solution 1.2.6. 2M ammonium acetate 1.2.7. 20X SSC and 1X SSC 1.2.8. 1X SSC/SDS 1.2.9. Proteinase K 1.2.10. Hybridization solution 1.2.11. NBT/BCIP tablets 1.2.12. AP‐labeled DNA probes (DNA Technology)
2. Outlined Procedure 2.1. Preparation of shellfish
2.1.1. Hands of examiner must be scrubbed thoroughly with soap and potable water; latex or nitrile gloves should be worn while cleaning oysters.
2.1.2. Scrape off growth and loose material from shell, and scrub shell stock with sterile stiff brush under running water.
2.1.3. Place clean shellstock on clean towels or absorbent paper. 2.1.4. Change gloves and brushes between samples. 2.1.5. Protective chain mail glove can be used under a latex glove; outer gloves should
be changed between samples. 2.1.6. Tare a sterile blender. 2.1.7. Using a sterile oyster knife, insert the point between the shells on the ventral side,
about ¼ the distance from the hinge to the bill; alternately, knife can be inserted after making small opening with sterile bone cutting forceps.
2.1.8. Cut adductor muscle from upper flat shell and pry the shell wide enough to drain shell liquor into the blender.
2.1.9. The upper shell can then be pried loose at hinge and discarded. 2.1.10. The whole animal (including adductor muscle) should be transferred to the sterile
blender after severing the adductor muscle connection to the lower shell. 2.1.11. A minimum of 12 animals or 200g is required. 2.1.12. Blend without adding diluent or with equal weight of diluent (APW or PBS) for 60‐
120 sec at 14,000 rpm. 2.2. Preparation of spread plates
2.2.1. Prepare 10‐fold serial dilutions of shellfish homogenate in PBS 2.2.2. Inoculate 100µl of appropriate dilutions onto pre‐dried T1N3 agar plates 2.2.3. Spread inoculum gently into agar until completely absorbed
Proposal No. 15-112

2.2.4. Invert plates and incubate at 30‐37°C overnight. 2.2.5. Alternately, this method can be utilized with suspect isolates replicated to T1N3 agar
from 96 well plates obtained from a standard MPN method 2.3. DNA Probe Colony Hybridization
2.4. Alkaline phosphatase‐labeled oligonucleotide probes (AP‐tlh, AP‐tdh, and AP‐trh) can be stored in the refrigerator (4°C) for 1‐2 years; do not freeze.
2.5. Filter Preparation 2.5.1. Label #541 Whatman filters with sample number, date, analyst initials, and
probe to be hybridized with (tlh, tdh, or trh). Make sure orientation of filter is noted so that positive spots can be correlated to the appropriate well in the microtiter plate. A dot near the A1 well is sufficient.
2.5.2. Place each filter label‐side down on appropriate T1N3 plate; apply gentle pressure to ensure contact with each colony. Allow labeled filter to sit at RT for 1‐30 min. Transfer each filter with colony‐side up to a plastic or glass petri dish lid containing 1 ml of lysis solution. Alternatively, to avoid overheating, a Whatman #3 filter pad can be saturated with 4ml of lysis buffer in the bottom of the petri dish onto which the #541 filter is transferred.
2.5.3. Microwave filters in petri dishes (full power) for 15‐20 sec/filter depending on wattage of microwave; rotate dishes with filters and repeat microwaving. Filters should be hot and almost completely dry but not brown.
2.5.4. Transfer filters to a plastic wash container (up to 30 filters can be combined in one container) and neutralize with ammonium acetate (4 ml/filter) for 5 min on shaker at RT.
2.5.5. Decant ammonium acetate and rinse filters 2 times with 1X SSC buffer (10 ml/filter), for 1‐2 min each time. (Filters can be air dried and stored at this point.)
2.6. Proteinase K (proK) treatment 2.6.1. Prepare proK solution (this is made by adding 10 ml/filter of 1X SSC and 20
µl/filter of proK stock solution) for the appropriate number of filters. Place filters (up to 30) in plastic wash container of proK solution. Incubate for 30 min in a 42°C water bath with shaking (50 rpm) to destroy naturally occurring alkaline‐phosphatase and digest bacterial protein.
2.6.2. Decant proK solution. Rinse filter 3 times in 1X SSC (10 ml/filter) for 10 min at RT with shaking at 50 rpm. (Filters can be air dried by placing on paper towels and stored when completely dry.)
2.7. Hybridization 2.7.1. Place up to 5 proK‐treated filters (either dried or straight from treatment) in a
Whirl‐Pak bag. Add 10 ml of pre‐warmed hybridization buffer and close bag to exclude air. Avoid trapping air bubbles. Incubate filters for 30 min at 54°C in a shaking (50 rpm) water bath.
2.7.2. Pour off buffer from bag and add 10 ml fresh pre‐warmed buffer/bag. Add probe (final conc. is 0.5 pmol/ml) to bag with filters. Reseal bag, excluding air, and incubate 1 h in a 54°C water bath with shaking. The temperature is critical for hybridization and washing steps.
2.7.3. Remove filters from hybridization bags and place in plastic wash container(s).
Proposal No. 15-112

2.7.4. Add 10 ml/filter 1X SSC/1% SDS . Incubate in a 54°C water bath with shaking for 10 min. Repeat wash a second time.
2.7.5. Rinse filter 5 times for 5 min each in 1X SSC (10ml/ filter) at RT on an orbital shaker, 100 rpm.
2.8. Color development 2.8.1. In petri dish, add 20 ml of NBT/BCIP solution. Add filters (5 or fewer) to dish and
incubate with gentle shaking; cover to omit light. Incubation temperatures from room temperature up to 40˚C can be used; color development will be quicker at higher temperatures. Check development of positive control every hour.
2.8.2. Transfer filters to a plastic wash container and add tap water (10 ml/filter). Rinse filters at RT with shaking for 10 min. Repeat rinse 2 additional times to stop color development. Do not expose filters to light as they will continue to develop. Consider purple or brown spots positive.
Proposal No. 15-112