validation and inter-comparison of satellite rainfall products over complex topography
DESCRIPTION
Validation and Inter-comparison of Satellite Rainfall Products over Complex Topography T. Dinku, P. Ceccato, E. Grover-Kopec, S. J. Connor and C. F. Ropelewski [email protected]. International Research Institute for climate and society (IRI) - PowerPoint PPT PresentationTRANSCRIPT

Validation and Inter-comparison of Validation and Inter-comparison of Satellite Rainfall Products over Satellite Rainfall Products over
Complex TopographyComplex Topography
T. Dinku, P. Ceccato, E. Grover-Kopec, T. Dinku, P. Ceccato, E. Grover-Kopec, S. J. Connor and C. F. RopelewskiS. J. Connor and C. F. Ropelewski
International Research Institute for climate and society (IRI)
The Earth Institute at Columbia University
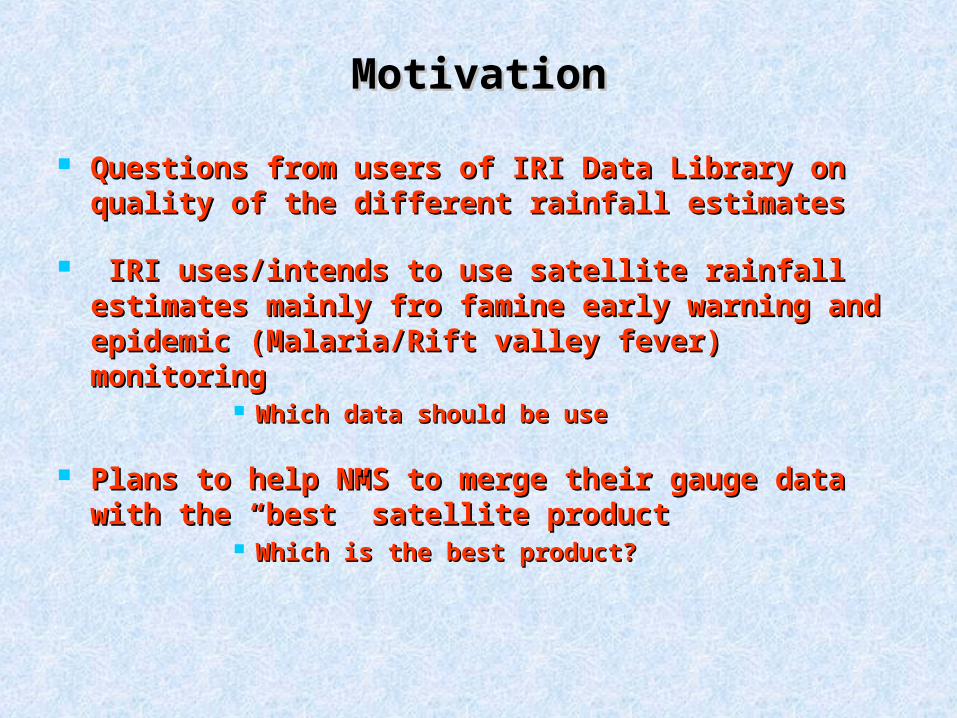
MotivationMotivation Questions from users of IRI Data Library on Questions from users of IRI Data Library on
quality of the different rainfall estimatesquality of the different rainfall estimates
IRI uses/intends to use satellite rainfall IRI uses/intends to use satellite rainfall estimates mainly fro famine early warning and estimates mainly fro famine early warning and epidemic (Malaria/Rift valley fever) monitoringepidemic (Malaria/Rift valley fever) monitoring
Which data should be useWhich data should be use
Plans to help NMS to merge their gauge data Plans to help NMS to merge their gauge data with the “best” satellite productwith the “best” satellite product
Which is the best product?Which is the best product?
OutlineOutline Study regionStudy region
Gauge and satellite data usedGauge and satellite data used
Monthly products at 2.5-deg resolutionMonthly products at 2.5-deg resolution
Ten-daily accumulation at 1-deg resolutionTen-daily accumulation at 1-deg resolution
- Effects of topography, PM input and Calibration- Effects of topography, PM input and Calibration
Daily products at 0.25 degreeDaily products at 0.25 degree
SummarySummary
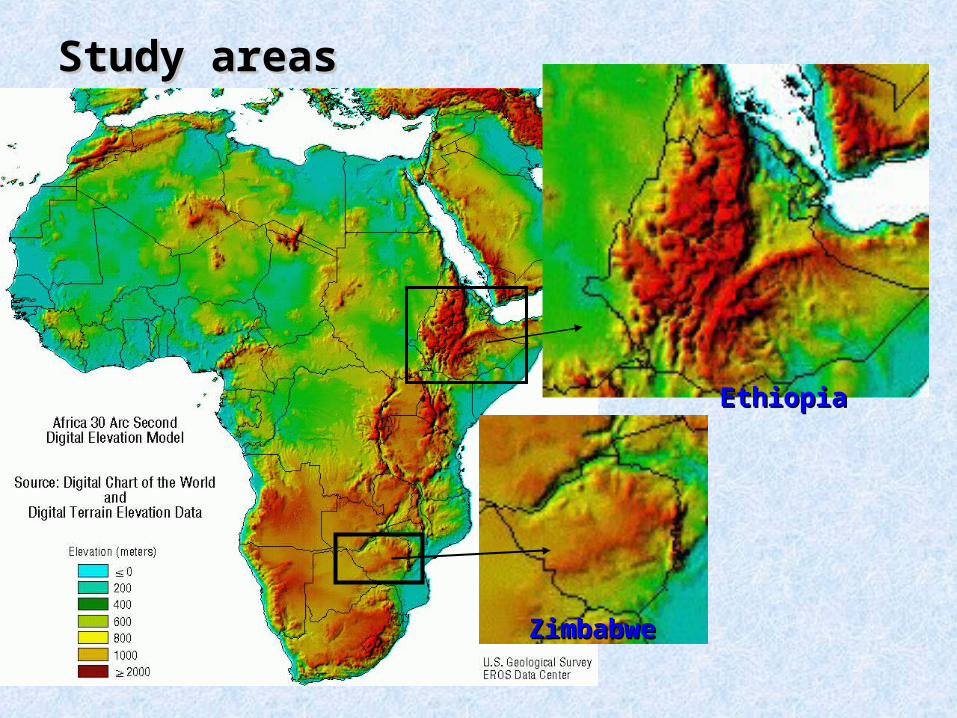
Study areasStudy areas
EthiopiaEthiopia
ZimbabweZimbabwe

Ethiopia: Mean Annual RainfallEthiopia: Mean Annual Rainfall
New_LocClim (FAO)

Ethiopia: Topography vs. RainfallEthiopia: Topography vs. Rainfall
NewLocClimNew_LocClim (FAO)
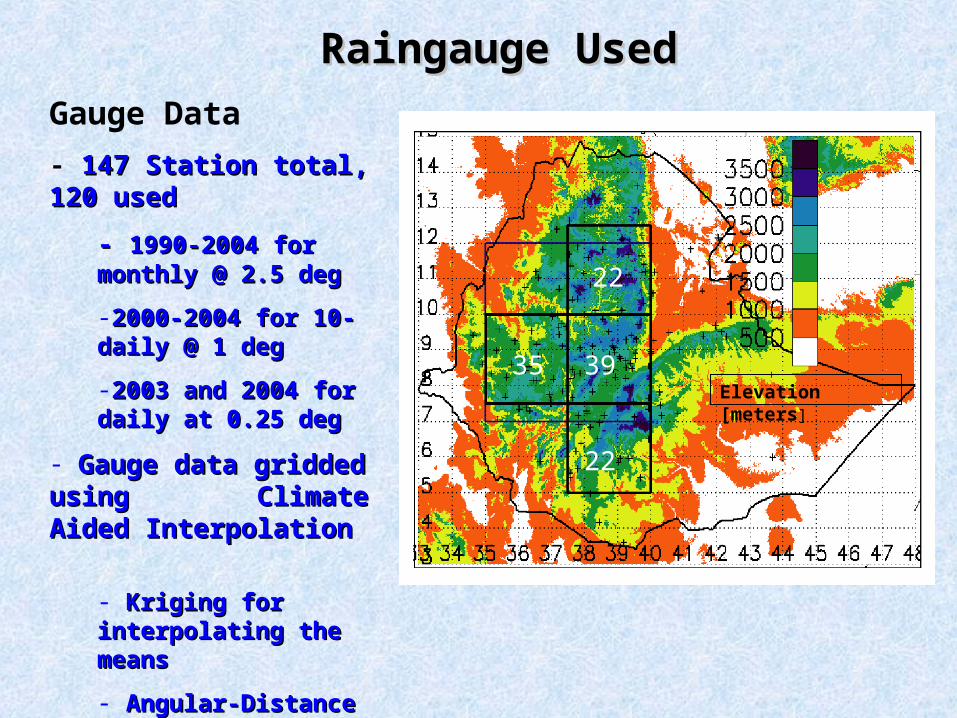
Gauge Data- 147 Station total, 120 used147 Station total, 120 used
- - 1990-2004 for monthly @ 1990-2004 for monthly @ 2.5 deg2.5 deg
-2000-2004 for 10-daily @ 1 2000-2004 for 10-daily @ 1 degdeg
-2003 and 2004 for daily at 2003 and 2004 for daily at 0.25 deg0.25 deg
- Gauge data gridded using Gauge data gridded using Climate Aided Interpolation Climate Aided Interpolation
- Kriging for interpolating Kriging for interpolating the meansthe means
- Angular-Distance Angular-Distance Weighting for anomaliesWeighting for anomalies
Raingauge UsedRaingauge Used
22
35 39
22
Elevation [meters]

Seasonal variation of rainfallSeasonal variation of rainfall
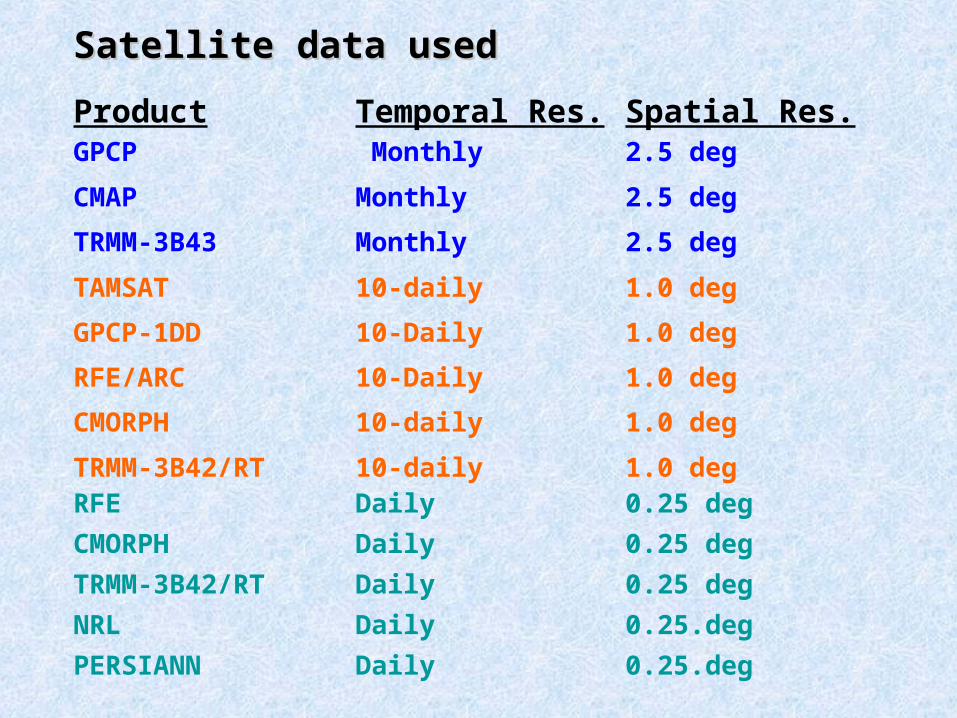
Satellite data usedSatellite data usedProduct Temporal Res. Spatial Res.GPCP Monthly 2.5 deg
CMAP Monthly 2.5 deg
TRMM-3B43 Monthly 2.5 deg
TAMSAT 10-daily 1.0 deg
GPCP-1DD 10-Daily 1.0 deg
RFE/ARC 10-Daily 1.0 deg
CMORPH 10-daily 1.0 deg
TRMM-3B42/RT 10-daily 1.0 deg RFE Daily 0.25 degCMORPH Daily 0.25 deg TRMM-3B42/RT Daily 0.25 deg NRL Daily 0.25.degPERSIANN Daily 0.25.deg
Comparisons: monthly @ 2.5 degComparisons: monthly @ 2.5 deg
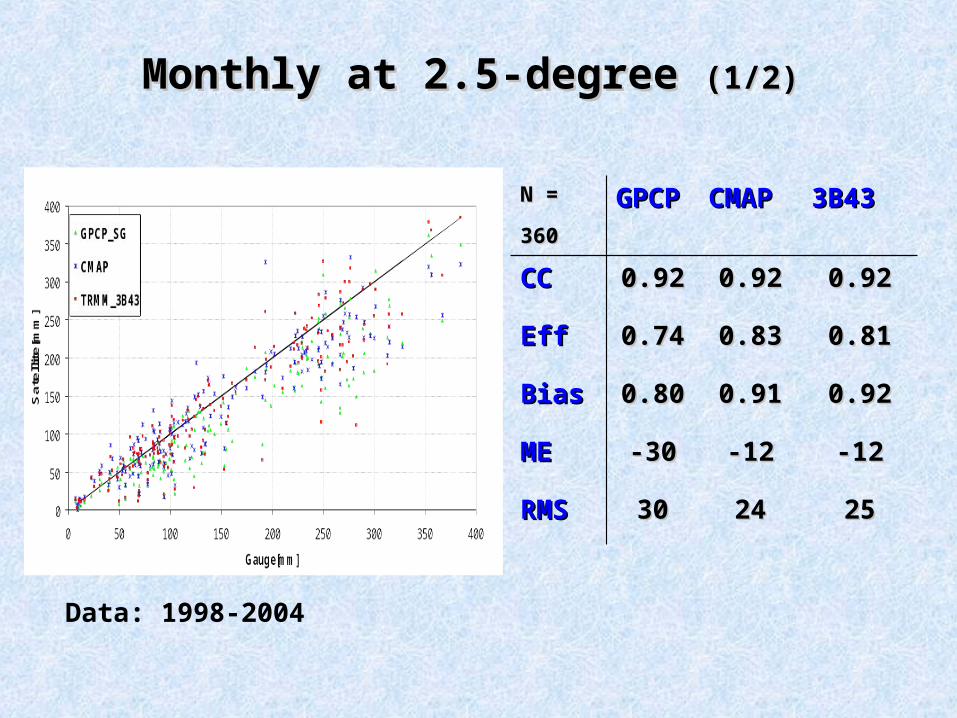
Monthly at 2.5-degree Monthly at 2.5-degree (1/2)(1/2)
N = 360N = 360 GPCPGPCP CMAPCMAP 3B433B43
CCCC 0.920.92 0.920.92 0.920.92
EffEff 0.740.74 0.830.83 0.810.81
BiasBias 0.800.80 0.910.91 0.920.92
MEME -30-30 -12-12 -12-12
RMSRMS 3030 2424 2525
Data: 1998-2004

Monthly at 2.5-degree Monthly at 2.5-degree (2/2)(2/2)

Comparisons: 10-daily @ 1.0 degComparisons: 10-daily @ 1.0 deg
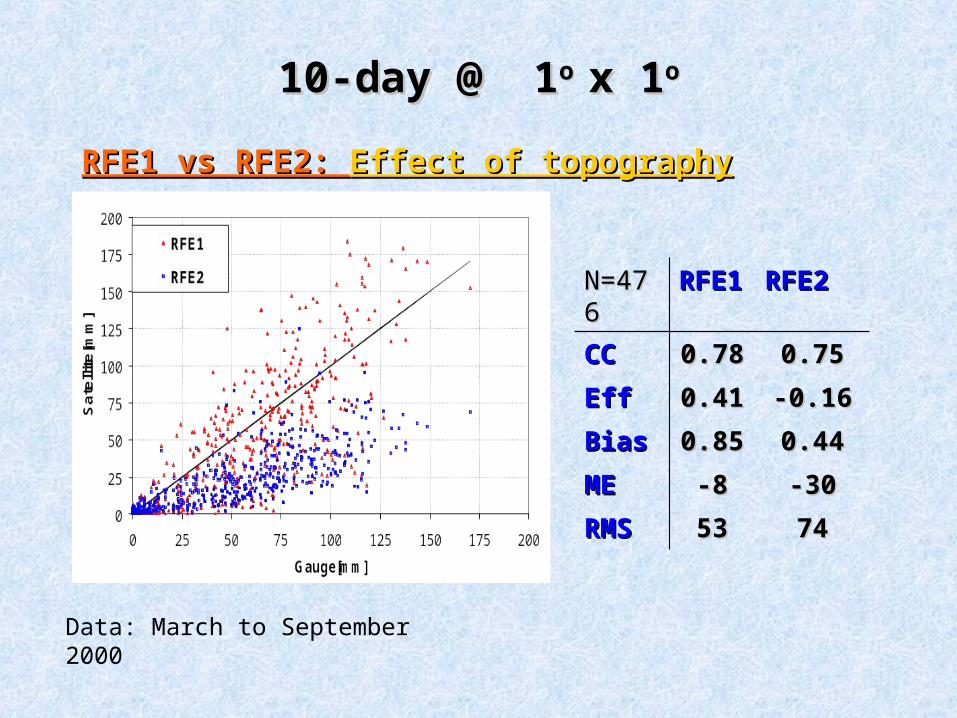
10-day @ 110-day @ 1o o x 1x 1oo
N=476N=476 RFE1RFE1 RFE2RFE2
CCCC 0.780.78 0.750.75
EffEff 0.410.41 -0.16-0.16
BiasBias 0.850.85 0.440.44
MEME -8-8 -30-30
RMSRMS 5353 7474
RFE1 vs RFE2: RFE1 vs RFE2: Effect of topographyEffect of topography
Data: March to September 2000

10-day @ 110-day @ 1o o x 1x 1oo
0
25
50
75
100
125
150
175
200
0 25 50 75 100 125 150 175 200Gauge[mm]
Sate
llite
[mm
]
RFE2
ARC
RFE2RFE2 vs ARC: vs ARC: Effect of PM data and sampling?Effect of PM data and sampling?
N=1020N=1020 RFE2RFE2 ARCARC
CCCC 0.660.66 0.660.66
EffEff -0.45-0.45 -0.88-0.88BiasBias 0.550.55 0.450.45
MEME -30-30 -38-38
RMSRMS 5858 6666

10-day @ 110-day @ 1o o x 1x 1oo
RFE2 vs 3B42RT: RFE2 vs 3B42RT: Effect of calibration(?)Effect of calibration(?)
N=828N=828 3B423B42 3B42RT3B42RT RFE2RFE2CCCC 0.700.70 0.720.72 0.700.70
EffEff 0.300.30 -0.07-0.07 -0.13-0.13
BiasBias 0.860.86 0.950.95 0.620.62
MEME -9-9 -4-4 -26-26
RMSRMS 4141 5050 5252

10-day @ 110-day @ 1o o x 1x 1oo
1DD, 3B42, TAMSAT and CMORPH1DD, 3B42, TAMSAT and CMORPH
N=306N=306 1DD 3B42 TAMSAT
CMORPH
CC 0.68 0.68 0.79 0.83Eff 0.04 0.26 0.53 0.49Bias 0.77 0.94 0.86 0.98ME -16 -4 -9 -1

. . -20
.. -30ОО -40
.. -50
.. -60
Ethiopia: CCD Thresholds(oC)

10-day @ 0.2510-day @ 0.25o o
RFE2, 3B42, CMORPHRFE2, 3B42, CMORPH
N=2448N=2448 RFE2RFE2 3B423B42 CMORPHCMORPH
CCCC 0.550.55 0.550.55 0.740.74
EffEff -0.23-0.23 0.020.02 0.350.35
BiasBias 0.590.59 0.920.92 0.980.98
MEME -27-27 -5-5 -1-1
RMSRMS 6262 5656 4646

Comparisons: Daily @ 0.25 degComparisons: Daily @ 0.25 deg

Daily @ 0.25Daily @ 0.25o o
EthiopiaEthiopiaRFE PERSIAN NRL 3B42 3B42RT CMORPH
Corr 0.08 0.14 0.12 0.11 0.12 0.14MnErr -2.37 3.26 -0.83 -0.34 0.00 0.09RMSE 10.22 18.13 12.24 11.27 13.81 10.45
Bias 0.65 1.48 0.88 0.95 1.00 1.01CSI 0.62 0.57 0.51 0.60 0.54 0.68
POD 0.71 0.64 0.57 0.69 0.62 0.80FAR 0.18 0.17 0.17 0.18 0.19 0.19HSS 0.18 0.18 0.14 0.16 0.13 0.21
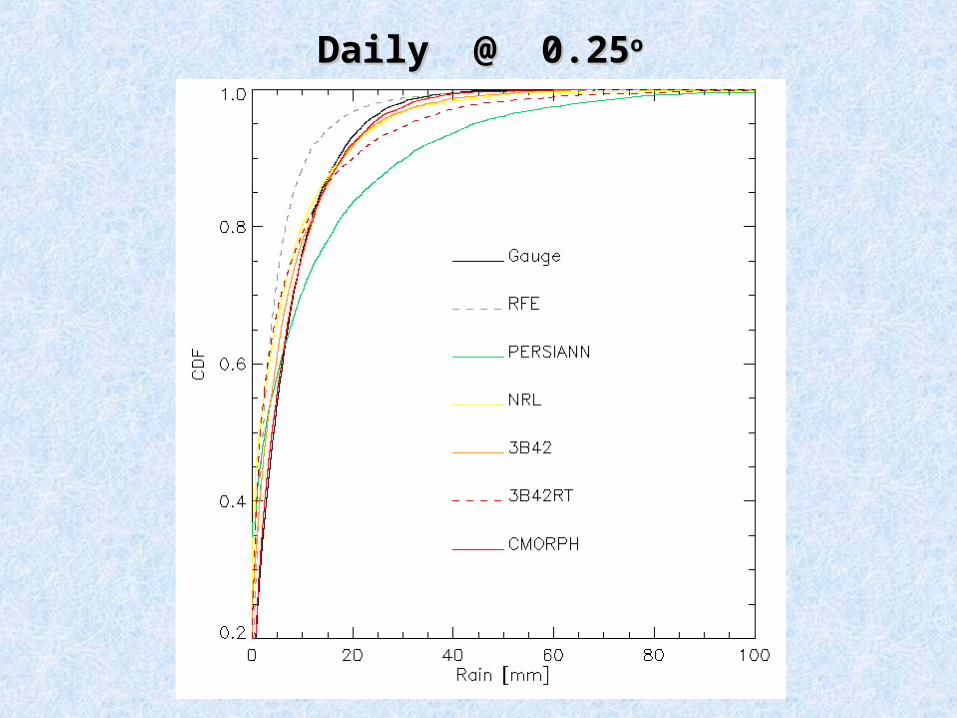
Daily @ 0.25Daily @ 0.25o o
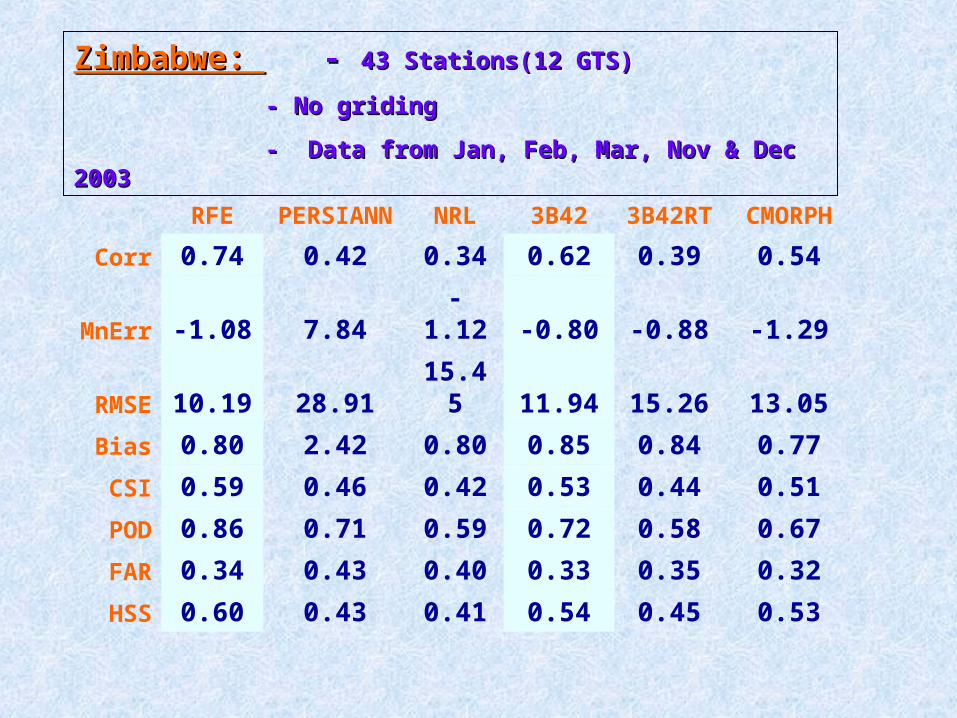
RFE PERSIANN NRL 3B42 3B42RT CMORPHCorr 0.74 0.42 0.34 0.62 0.39 0.54
MnErr -1.08 7.84 -1.12 -0.80 -0.88 -1.29RMSE 10.19 28.91 15.45 11.94 15.26 13.05
Bias 0.80 2.42 0.80 0.85 0.84 0.77CSI 0.59 0.46 0.42 0.53 0.44 0.51
POD 0.86 0.71 0.59 0.72 0.58 0.67FAR 0.34 0.43 0.40 0.33 0.35 0.32HSS 0.60 0.43 0.41 0.54 0.45 0.53
Zimbabwe: Zimbabwe: - - 43 Stations(12 GTS)43 Stations(12 GTS)
- No griding- No griding
- Data from Jan, Feb, Mar, Nov & Dec 2003- Data from Jan, Feb, Mar, Nov & Dec 2003
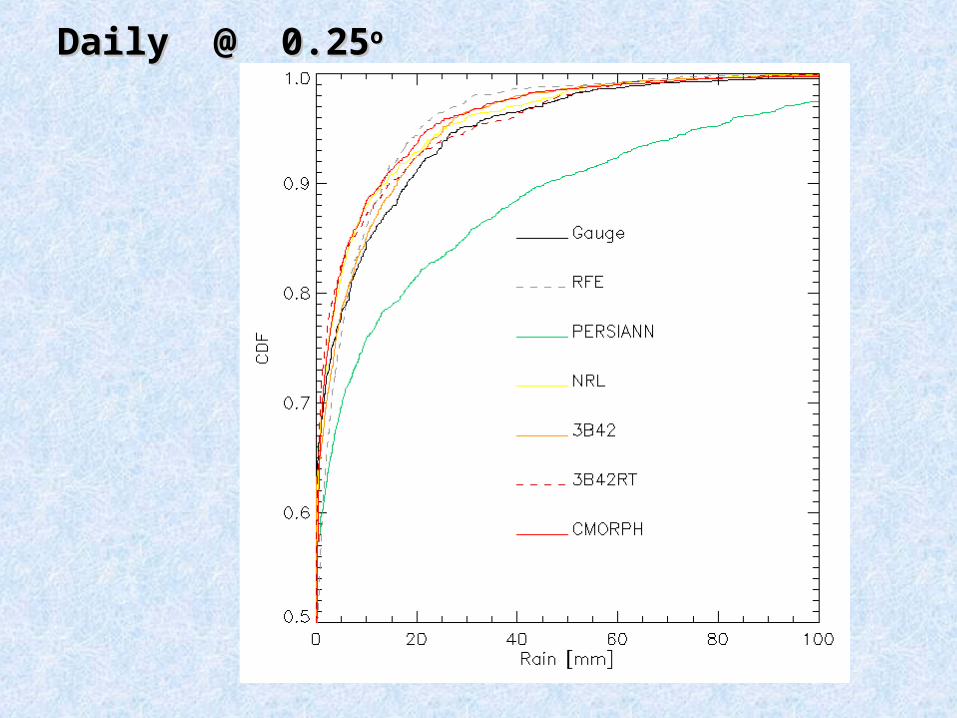
Daily @ 0.25Daily @ 0.25o o
SummarySummary
Results very good for monthly products @ 2.5 deg, good for 10-Results very good for monthly products @ 2.5 deg, good for 10-day products @ 1 deg, but poor for the daily products @ 0.25 day products @ 1 deg, but poor for the daily products @ 0.25 degdeg
There is significant influence of topography, which should be There is significant influence of topography, which should be taken into accounttaken into account
Spatially (and temporally) varying temperature thresholds and Spatially (and temporally) varying temperature thresholds and regression parameters improve the accuracy significantly.regression parameters improve the accuracy significantly.
-> TAMSAT performed as well as CMORPH-> TAMSAT performed as well as CMORPH