validating the existence of vaalbara in the neoarchean
TRANSCRIPT

V
Ma
b
a
ARRA
KPCKPN
1
sKPabSasttbetioePtSdw
0d
Precambrian Research 174 (2009) 145–154
Contents lists available at ScienceDirect
Precambrian Research
journa l homepage: www.e lsev ier .com/ locate /precamres
alidating the existence of Vaalbara in the Neoarchean
ichiel O. de Kock a,∗, David A.D. Evans b, Nicolas J. Beukes a
Department of Geology, University of Johannesburg, Auckland Park 2006, South AfricaDepartment of Geology and Geophysics, Yale University, New Haven, CT 06511, USA
r t i c l e i n f o
rticle history:eceived 20 February 2009eceived in revised form 26 June 2009ccepted 7 July 2009
eywords:
a b s t r a c t
An interesting aspect of Precambrian geology is the similarities between successions of the Kaapvaal andPilbara cratons of southern Africa and Australia. Coeval trends in these successions are commonly usedto reconstruct global atmospheric and oceanic conditions during the Archean-Proterozoic transition. Thesimilarities, however, could also suggest their paleogeographic proximity in the form of a supercraton, oreven Earth’s oldest assembled continent, named Vaalbara. If these cratons indeed were nearest neighbours
aleomagnetismontinental Reconstructionaapvaalilbaraeoarchean
in a supercraton, the parallel trends preserved in supracrustal sequences may reflect local effects ina single basin instead of global paleoenvironmental conditions. Here we report a paleomagnetic polefrom the Neoarchean Ventersdorp Supergroup of South Africa, which provide quantitative support forVaalbara’s existence. Our reconstruction differs greatly from earlier suggestions and contests those thatplace the cratons far apart. It provides the oldest example, and the only Archean instance, of paleomagneticreconstruction between continental blocks in terms of paleolatitude and relative longitude. If correct, our
at pre
reconstruction implies th. Introduction
The existence of a Vaalbara supercraton or early continent isuggested by similarities in stratigraphic elements between theaapvaal and Pilbara cratons. In particular are those regardingaleoproterozoic iron-formations (Trendall, 1968), but there arelso broader links between 3.5 Ga and 1.8 Ga volcano-sedimentaryasins and mineral deposits (e.g., Button, 1979; Cheney, 1996).ome ascribe the similarities to global processes (e.g., Nelson etl., 1999) and question Vaalbara’s existence. An alternative recon-truction, named Ur (Rogers, 1996), places the cratons far apart,hus imposing global controls on the parallel trends. In this wayhe correlation of sulphur isotopic data between the cratons haveeen interpreted to reflect global changes linked to atmosphericvolution (Kaufman et al., 2007). The Ur hypothesis, which placeshe cratons in their Gondwanaland configuration (Rogers, 1996),s contradicted by widespread evidence of Precambrian collisionalrogens between Australia and Africa (e.g., Fitzsimons, 2000; Bogert al., 2001; Meert, 2003; Jacobs and Thomas, 2004; Collins andisarevsky, 2005); yet it has continued to receive support and men-
ion in the literature (e.g., Mukherjee and Das, 2002; Rogers andantosh, 2003; Zhao et al., 2006). Confusingly Mondal et al. (2009)epicts what they call an “Ur” protocontinent at 2400–2200 Ma inhich the Pilbara and Kaapvaal cratons are placed within a more∗ Corresponding author. Tel.: +27 115594707; fax: +27 115594702.E-mail address: [email protected] (M.O. de Kock).
301-9268/$ – see front matter © 2009 Elsevier B.V. All rights reserved.oi:10.1016/j.precamres.2009.07.002
vious paleoenvironmental conclusions may need reconsideration.© 2009 Elsevier B.V. All rights reserved.
traditional Vaalbaran configuration. A plethora of suggested recon-structions, some going under the same name, and disagreementamong authors about which one is more credible at any specifictime, all create confusion in the geosciences community. In thispaper we test the various reconstructions involving the Kaapvaaland the Pilbara cratons during the Neoarchean, with the goal ofeliminating some and providing more credence to others.
In Vaalbara, Pilbara is traditionally juxtaposed next to the south-western margin of the present-day Kaapvaal craton (Cheney, 1996).This is referred to hereafter as the “Cheney” fit. Cheney includedthe Zimbabwe and the Yilgarn cratons in their present configura-tions relative to the Kaapvaal and Pilbara cratons in his definition ofVaalbara (Cheney, 1990, 1996). The Grunehogna craton of Antarc-tica, positioned in a Mesozoic Gondwana reconstruction (Jones etal., 2003), can also be included.
A paleolatitude comparison at 2.78–2.77 Ga at first failed tolend support for Vaalbara’s existence (Wingate, 1998), but withupdated Pilbaran poles (Strik et al., 2003), a direct juxtapositionbecame allowable. Another set of older Neoarchean poles (Zegerset al., 1998), but with large associated age uncertainties, also allowPilbara–Kaapvaal proximity. By placing Pilbara towards the eastof Kaapvaal (“Zegers” fit) a fair alignment of Archean structuralelements is achieved. Since the paleomagnetic method of single-
age pole comparison, as used by Zegers and Strik (see previouscitations), does not provide relative longitudinal constraints, it isequally allowable that the cratons were far apart along their respec-tive bands of paleolatitude. They may also have been in oppositehemispheres due to geomagnetic polarity ambiguity.
1 rian R
g1f2Tu
2
sugcsiw2attieSgaa2r
Ktcadb
Fi(d
46 M.O. de Kock et al. / Precamb
We report a new paleopole for the ∼2.7 Ga Ventersdorp Super-roup of South Africa that, together with existing data (Wingate,998), allow for the comparison of distances between paleopolesrom both cratons through a better constrained time interval (i.e.,.78–2.70 Ga), using two pairs of coeval poles from the two blocks.his provides relative paleolongitudinal constraints for a moreniquely determined reconstruction.
. Ventersdorp–Fortescue correlation
The Ventersdorp Supergroup is the most extensive volcano-edimentary sequence on the Kaapvaal craton and is largelyndeformed and very well preserved, having only reached lowerreenschist facies (Crow and Condie, 1988). It is lithostratigraphi-ally (e.g., Wingate, 1998) and chemically (Nelson et al., 1992) veryimilar to the Fortescue Group of Australia, but a simple correlations unsupported by published age data (Fig. 1). The Fortescue Group,
hich has been densely sampled for geochronology, dates from772 ± 2 Ma (Wingate, 1999) to 2713 ± 3 Ma (Blake et al., 2004),nd by current estimates appears to be mostly older than the Ven-ersdorp Supergroup. A 2714 ± 14 Ma age for basalt at the base ofhe Ventersdorp (Armstrong et al., 1991), however, remains unver-fied, and it could conceivably be as old as 2764 ± 5 Ma (Englandt al., 2001), the maximum age for the underlying Witwatersrandupergroup. If this is so, the Klipriviersberg Group would be analo-ous to the Mt. Roe Basalt of Australia and the Derdepoort volcanicsnd Kanye volcanics from the northwestern Kaapvaal craton, datedt 2772 ± 2 Ma (Wingate, 1999), 2781 ± 5 Ma (Wingate, 1998), and784 ± 2 Ma (Grobler and Walraven, 1993; Moore et al., 1993),espectively.
The 2709 ± 8 Ma age for bimodal volcanic rocks overlying thelipriviersberg Group (Armstrong et al., 1991) is accepted even
hough lithostratigraphic equivalents on the western margin of theraton yield older U-Pb ages (de Kock, 2007; Poujol et al., 2005),nd the age of the Allanridge Formation, although not directlyated, is fairly well constrained. The Allanridge lies unconformablyetween one sequence dated at 2709 ± 8 Ma and another dated
ig. 1. Correlation of the Ventersdorp Supergroup and the Fortescue Group. Diagrams modified after Wingate (1998). Age references: (a) Wingate (1999), (b) Blake et al.2004), (c) England et al. (2001), (d) Wingate (1998), (e) Armstrong et al. (1991), (f)e Kock (2007), (g) Poujol et al. (2005) and (h) Barton et al. (1995).
esearch 174 (2009) 145–154
at 2664 ± 6 Ma (Barton et al., 1995), thus making it comparable,within uncertainties, to the ∼2713 Ma Maddina Basalt of Australia(Fig. 1).
To complement the 2781 ± 5 Ma Derdepoort pole (Wingate,1998), and to achieve our proposed double pole-pair comparison,we conducted a paleomagnetic study of the Allanridge Formation.Previous paleomagnetic work (Jones et al., 1967; Henthorn, 1972;Strik et al., 2007) either pre-date the use of progressive demagne-tization techniques or lack adequate stability field tests.
3. New paleomagnetic data
3.1. Sampling sites and laboratory techniques
Table 1 provides a summary of sampling sites, their local-ities, lithologies sampled and bedding attitude associated witheach. All samples were drilled in the field with a portable, hand-held gasoline-powered drill. A magnetic compass, and for mostsamples also a sun compass, were used for orientation. Individ-ual cores were trimmed to one or more specimens 2.4 cm inlength.
At Taung the Allanridge Formation was sampled at three sites.At Ritchie, two lava flows separated by a prominent amygdaloidalflow-top were sampled. A total of eleven sites were sampled alongexposures cut by the Orange River between the towns of Hopetownand Douglas (see Fig. 2 for the geological setting of these samplinglocalities). In addition two compound or sheet flows and a blockyflow-top breccia, pillow flows and pillow fragments in volcanicbreccias were extensively sampled along the Orange River.
Andesitic lava samples were prepared using standard meth-ods and were subjected to magnetic cleaning, which consisted oflow-field-strength alternating-field (AF) pre-treatment and step-wise thermal demagnetization to 580 ◦C. Measurements were madewith an Agico JR6-A spinner magnetometer within a magneticallyshielded room at the University of Johannesburg, South Africa.Alternating-field demagnetization was carried out with a Molspin2-axis tumbling demagnetizer and thermal demagnetization, in ashielded furnace. Calculation of paleomagnetic poles assumes anaxial-geocentric dipolar magnetic field and a paleoradius for theEarth equal to the present Earth radius.
Magnetic components were identified and quantified via leastsquares principal component analysis (Kirschvink, 1980). These cal-culations, together with all subsequent statistical analyses, utilizedsoftware Paleomag (Jones, 2002), PaleoMac (Cogné, 2003) and thePmagPy open source software by Lisa Tauxe.
3.2. Results
Stable and consistent magnetic components were identifiedin all but one site, which displayed an erratic distribution ofcomponents. In addition to low-coercivity and present local field-like components (PLF for short), demagnetization revealed up tothree higher-stability components (A, B+ and B−). Samples usuallyrecorded two components, but never all three (Fig. 3 and Table 2).
Six sites revealed northerly and downward-directed com-ponents (A) within the temperature range of 375–450 ◦C, butsometimes persisting up to 500 ◦C. In most cases, however, demag-netization above 450 ◦C revealed characteristic components (B+or B−). Sample magnetization became irregular above 540 ◦C.Characteristic components were southerly and steeply downward-
directed (B+) in 88% of the sites, while one site revealed oppositepolarity components (i.e., north and up or B− for short). B+ and B−are not strictly antipodal, but this is unsurprising as the B− com-ponent falls within a cloud of normal data that is undersampled inthis instance by our one site.
M.O. de Kock et al. / Precambrian Research 174 (2009) 145–154 147
Table 1Summary of sampling site information.
Site Locality (◦N, ◦E) N Lithology Bedding (strike/dip)
TaungTGC −27.15◦ , 024.78◦ 14 Massive lava 152◦/10◦SWTGD −27.53◦ , 024.85◦ 12 Massive lava 262◦/12◦NWTGE −27.54◦ , 024.84◦ 7 Porphyritic lava Sub-horizontal
RitcieRCBa −29.04◦ , 024.56◦ 20 Amygdaloidal lava Sub-horizontalRCBb −29.04◦ , 024.56 3 Amygdaloidal lava Sub-horizontal
Hopetown-DouglasHTA −29.57◦ , 024.08◦ 41 Pillow lava and pillow clasts Sub-horizontalHTB −29.57◦ , 024.07◦ 26 Pillow lava, clasts and hyaloclastite matrix Sub-horizontalHTC −29.48◦ , 023.94◦ 18 Amygdaloidal lava Sub-horizontalHTDa −29.30◦ , 023.81◦ 7 Amygdaloidal lava Sub-horizontalHTDb −29.30◦ , 023.81◦ 6 Amygdaloidal lava Sub-horizontalHTDc −29.30◦ , 023.81◦ 6 Blocky flow-top breccia clasts Sub-horizontalHTE −29.29◦ , 023.82◦ 13 Massive lava 194◦/9◦WHTF −29.39◦ , 023.93◦ 15 Porphyritic lava 191◦/9◦WHTG −29.39◦ , 023.92◦ 17 Massive lava Sub-horizontal
N
3
ooPbl
FBoCb
HTH −29.48◦ , 023.93◦ 6HTI −29.48◦ , 023.93◦ 10
= number of samples taken at each site.
.3. Intraformational conglomerate tests
Hyaloclastite clasts and interbedded pillow flows provide an
pportunity for conducting a conglomerate test (Fig. 4a). A sec-nd test was performed on clasts from a flow-top breccia (Fig. 4b).illow fragments, of variable internal texture, displayed similarehaviour to that of underlying and overlying pillow lavas duringow level demagnetization (Fig. 4a). Low-coercivity components
ig. 2. Geological setting of sampling areas at Taung, Ritchie and between Hopetown anushveld Complex are simplified from geological maps of South Africa (Council for Geoscienutlines of the craton, the Trompsburg anomaly and the Vredefort impact structure as wolesberg lineament) were identified from an aeromagnetic map produced by De Beers (19asin. Insert depicts crustal blocks (De Beers, 1998; Eglington and Armstrong, 2004).
Amygdaloidal lava Sub-horizontalAmygdaloidal lava Sub-horizontal
were removed in all of the samples and PLF components in 65%of the pillow fragment samples. At higher demagnetization levels(i.e., above 300 ◦C), samples displayed linear trajectories towards
the origin. These characteristic components, however, have a scat-tered distribution and differ significantly from the underlying andoverlying pillow flows, which displayed well-grouped B+ compo-nents at similar demagnetization levels (Fig. 4a). A suite of statisticaltests demonstrates (see below) that the distribution of character-d Douglas. Outcrop distribution of the Ventersdorp, the Kanye Formation and thece, 1997) and Botswana (Geological Survey Department Lobatse, 1984). Geophysicalell as major crustal elements (i.e., the Thabazimbi-Murchison lineament and the
98). The seismic lines provide information on the possible extent of the Ventersdorp

148 M.O. de Kock et al. / Precambrian Research 174 (2009) 145–154
Fig. 3. Representative sample demagnetization behaviour. (a) Some samples did not respond well to demagnetization due to the adverse affects of lightning strikes, theses incos cted oh Solidr
iogidpa
Fala
amples record high-coercivity components of random orientation. (b–f) Apart fromome samples (plot b) displayed intermediate temperature northerly and down direigh-stability southerly downward (B+) or northerly and upward (B−) directions.emanent magnetization.
stic directions in the fragments is significantly distinct from thatf the lava flows. This represents a positive intraformational con-
lomerate test and supports a conclusion that the B+ remanences primary. In further support of this, characteristic componentserived from a pair of individually oriented core samples from oneillow differ significantly from B+ directions seen in other pillowsround it (Fig. 4a). The presence of coherent PLF components inig. 4. Intraformational conglomerate tests. Equal-area plots: solid = lower hemispheressociated 95% cone of confidence. (a) Positive test for pillow lava (bottom) and hyaloclastievels (characteristic components) are shown. Samples HTA18 and 17 originate from the sssociated blocky flow-top. Arrow in photo = stratigraphic up.
nsistent low-coercivity components and local present-field-like (PLF) components,r A-components, while most samples (plots b–e and f, respectively) displayed eithersymbols = horizontal plane, open symbols = E-W and vertical plane. NRM = natural
these samples and the surrounding pillows excludes orientationerror (Fig. 4a), and the most plausible explanation is that the sam-
pled pillow represents a rotated body that became reconsolidatedin the pillow lava hyaloclastite-unit.A flow-top breccia was sampled at a locality about 46 km north-west of the pillow lava hyaloclastite-unit. The breccias from thislocality is a lenticular unit at the top-edge of and underlying lava
, open = upper hemisphere, grey filled symbol and ellipse = component mean andte clasts (top). Components below 300 ◦C (PLF) and those at higher demagnetizationame rotated pillow. (b) Negative test for components A and B+ in a lava flow and an

M.O. de Kock et al. / Precambrian Research 174 (2009) 145–154 149
Table 2Summary of least-squares component directions and component means for the Allanridge Formation.
Site n/N L/P Unbl. Declination Inclination K ˛95
PLF componentsTGE 5/7 5/0 300 ◦C 006.6 −54.4 39.3 12.4RCBa 6/20 6/0 200 ◦C 317.7 −52.0 21.3 14.9HTA 14/18 14/0 300 ◦C 348.0 −53.2 42.8 5.7HTA (clasts) 15/23 15/0 200 ◦C 346.4 −51.4 10.5 12.4HTB 10/15 10/0 200 ◦C 339.7 −58.4 45.9 7.2HTB (matrix) 6/7 6/0 200 ◦C 027.6 −59.6 12.4 19.8HTC 15/18 15/0 300 ◦C 328.8 −58.8 25.2 8.1HTDc 5/6 5/0 300 ◦C 341.7 −58.2 17.8 18.6THE 11/13 11/0 250 ◦C 334.2 −51.1 42.1 7.1HTF 3/15 3/0 300 ◦C 328.8 −60.5 75.9 14.2HTG 13/15 13/0 250 ◦C 334.6 −57.9 43.0 6.4HTH 6/6 6/0 250 ◦C 335.2 −56.6 144.3 5.6HTI 9/10 9/0 300 ◦C 340.0 −53.3 41.1 8.1
PLF mean 341.7 −56.9 63.2 5.3
North down componentsRCBa 9/20 9/0 450 ◦C 314.6 63.6 28.7 9.8HTDc 5/6 5/0 375 ◦C 008.6 58.7 18.7 18.1THE 8/13 8/0 375 ◦C 359.4 58.0 14.1 15.3
North down mean 349.7 62.0 33.7 21.6
Characteristic components (south down)TGCa 14/14 14/0 450 ◦C 198.5 47.2 30.1 7.4TGE 5/7 3/2 520 ◦C 158.9 65.6 24.8 16.8RCBa 13/20 13/0 540 ◦C 221.5 74.5 63.2 5.3HTA 14/18 14/0 500 ◦C 191.8 61.1 31.9 7.2HTB 13/15 10/3 500 ◦C 184.2 68.4 12.5 12.3HTDa 6/7 5/1 490 ◦C 215.8 62.0 86.0 7.4HTDb 4/6 3/1 490 ◦C 236.2 55.2 30.8 17.8HTDc 5/6 5/0 490 ◦C 213.0 60.6 40.2 12.2HTEa 5/13 3/2 515 ◦C 213.0 63.8 52.3 11.4HTFa 15/15 15/0 550 ◦C 216.1 58.3 59.6 5.0HTG 15/15 14/1 550 ◦C 199.9 66.4 23.5 8.1HTH 6/6 6/0 470 ◦C 198.2 62.6 113.7 6.3HTI 9/10 9/0 555 ◦C 195.7 58.4 217.7 3.5
South down mean 203.9 62.5 88.6 4.9
Characteristic components (north up)HTC 7/18 5/2 440 ◦C 4.5 −85.1 75.0 7.2
n/N = number of samples included/number analyzed, L/P = line versus plane least squares analyses, Unbl. = temperature in degrees Celsius at which component unblocks,d , k = Fip .
fltbmwwblca(usBorcpdotpl
eclination = mean declination in degrees, inclination = mean inclination in degreeslane data were combined, and ˛95 = radius of 95% confidence cone about the meana Sites for which bedding corrections were applied.
ow, and it resembles a flow toe. At a maximum it is about 3 mhick, but it pinches out towards the east in less than 5 m. Thereccia unit grades laterally westward as well as downward intoassive andesitic lava (of which there is ∼4 m thickness exposed)ith irregular amygdale-rich zones. Another massive lava unitith patchy amygdale zones wrap across and overlie the sampled
reccia-lavaflow unit (a maximum of 2 m thickness of this over-ying unit is exposed). Demagnetization of flow-top breccia clastslearly suggests that the acquisition of medium-temperature And the characteristic B+ components occurred after fragmentationFig. 4b). We suggest that the longer cooling time of the flow-topnit stands in contrast to the quenching of the pillow clasts andhards in the hyaloclastite, and further suggest that, in this case,+ was acquired shortly after fragmentation and during coolingf the lava-breccia-unit. Another possibility is that it represents aemagnetization acquired during post-depositional re-heating andooling due to an overlying flow unit. We are cautious in our inter-retation given the limited exposure of the overlying flow unit. We
o, however, interpret remanence A to be a much younger magneticverprint. A is better developed in the blocky flow-top comparedo the parent lava flow (Fig. 4b), and we propose that the higherermeability of the breccia made it more prone to alteration andater magnetic overprinting.
sher’s precision parameter, except when in modified form for where both line and
3.3.1. Statistical evaluation of the conglomerate test HTAIn contrast to the well-grouped south-down characteristic direc-
tions within pillow lava samples, those identified in fragmentsof pillow lava are significantly more scattered when viewed ona stereographic projection (Fig. 4a). The majority of these scat-tered directions (i.e., 18 out of 21 clasts) are positively inclinedand about five resemble the south-down character of the com-ponents from the parent lithology. This may explain why theWatson’s test for randomness fails (R = 10.91 > R0 = 7.40 for n = 21).The Shipunov conglomerate test (Shipunov et al., 1998), whichemploys alternative hypothesis testing, passes if the present localgeomagnetic-field (PLF) direction is used as a known secondaryoverprint (� = −0.259 < �c = 0.207). We interpreted this to mean thatdemagnetization procedure adequately removed the PLF overprint(which is apparent from Zijderveld diagrams), but we are not satis-fied to reject the possibility that the characteristic components arenon-random. A perhaps more meaningful implementation of theShipunov test would be to use the south-down direction as a poten-
tial regional overprint direction. Upon doing so, the test becomesnegative (� = 0.351 > �c = 0.207). This suggests that the south-downdirection is present in some of the clasts. We are, however, still waryof rejecting the randomness of the dataset for several reasons. Thesuite of clast directions is visually distinct from that of the par-
150 M.O. de Kock et al. / Precambrian Research 174 (2009) 145–154
Fig. 5. Test for common (Tauxe et al., 2009) mean showing that the two data sets do not share a common mean. Top panel shows equal area projections of characteristicremanence directions from pillow lava (left) and pillow fragments (right) and their associated mean values and 95% confidence cones. Open symbols = upper hemisphere,c of coc stippleo the tw
eT(tttcaim1adk(
tveatdpSsflo
losed symbols = lower hemisphere. Bottom panels show cumulative distributionsonfidence as solid vertical lines, solid grey = pillow samples and 95% confidence asf the pillow lava samples and that of the pillow fragment samples, suggesting that
nt lithology, while exhibiting similar demagnetization behaviour.here is therefore reason to believe that the null-hypothesis is truei.e., the dataset is random) despite indications that the alterna-ive hypothesis is true (south-down direction is present). Rejectinghe null-hypothesis would result in a Type-1 error. Furthermore,he Shipunov test is based on three assumptions, one being thatlasts have a random orientation (Shipunov et al., 1998). While thisssumption is usually true for well-rounded pebbles and boulders,t is not necessarily true for breccia clasts that may have undergone
inor amounts of rotation. Another assumption (Shipunov et al.,998) is that a possible remagnetization direction is known. Thepproach of using some arbitrary direction as a possible secondaryirection, as we did with the south-down component, instead of anown secondary overprint, is less than ideal and may be erroneousShipunov et al., 1998).
In order to illustrate the statistical distinctiveness of the two dis-ributions (i.e., the characteristic components from parent lithologys. pillow fragments) we choose to test for a common mean (Tauxet al., 2009). Despite the large uncertainty of the mean for the char-cteristic components seen in pillow fragments, we can illustratehat the mean from the parent pillow lava samples is significantlyifferent at the 95% level (Fig. 5). We interpreted this result as aositive intraformational conglomerate test and suggest that the
hipunov’s test and Watson test for randomness result in Type-1tatistical errors due to limited rotation of pillow clasts during theormation of the hyaloclastite, and/or delayed remanence lock-in inava clasts or partial remagnetization during subsequent extrusionf overlying lava flows.mponent means in cartesian coordinates. Solid black = pillow fragments and 95%d vertical lines. There is no overlap between the distributions of the x-componentso data sets do not share a common mean.
3.4. Interpretation of results
3.4.1. Secondary A componentA north-down remanence direction was identified in samples
from three sampling sites (Table 2) within a relatively narrow tem-perature range between 300 ◦C and 375 ◦C, but sometimes as highas 450 ◦C. A mean declination = 349.7◦ and inclination = 62.0◦ trans-lates to a paleopole at 16.7◦N, 015.7◦E with A95 = 15.7◦. A negativeconglomerate test for this component in clasts from a blocky flow-top breccia implies that it is a secondary component acquired afterextrusion of the Allanridge Formation lavas.
Comparison with known poles from the Kaapvaal craton (deKock et al., 2006) suggests either ∼2.0 Ga or 1.8–1.9 Ga as possi-ble times of acquisition of this overprint (Fig. 6). The Bushveldcomplex (Fig. 2) intruded at this time (Buick et al., 2001) andthe Vredefort impact is dated at 2023 Ma (Kamo et al., 1996).Both of these events have been implicated as potential sourcesof widespread remagnetization on the central Kaapvaal craton(Evans et al., 2002; Layer et al., 1988). Extensive intraplate mag-matism also occurred during the development of the Waterbergand Soutpansberg Groups at ∼1.9 Ga and ∼1.8 Ga (Hanson et al.,2004). The Trompsburg intrusion, which is responsible for the so-called Trompsburg anomaly (Fig. 2), has also yielded a 1.9 Ga age
(Maier et al., 2003). The restricted occurrence of the north-downoverprint, however, attests to the generally undisturbed preser-vation of the Ventersdorp succession in the Kimberley regionand invites further paleomagnetic study in this relatively pristinearea.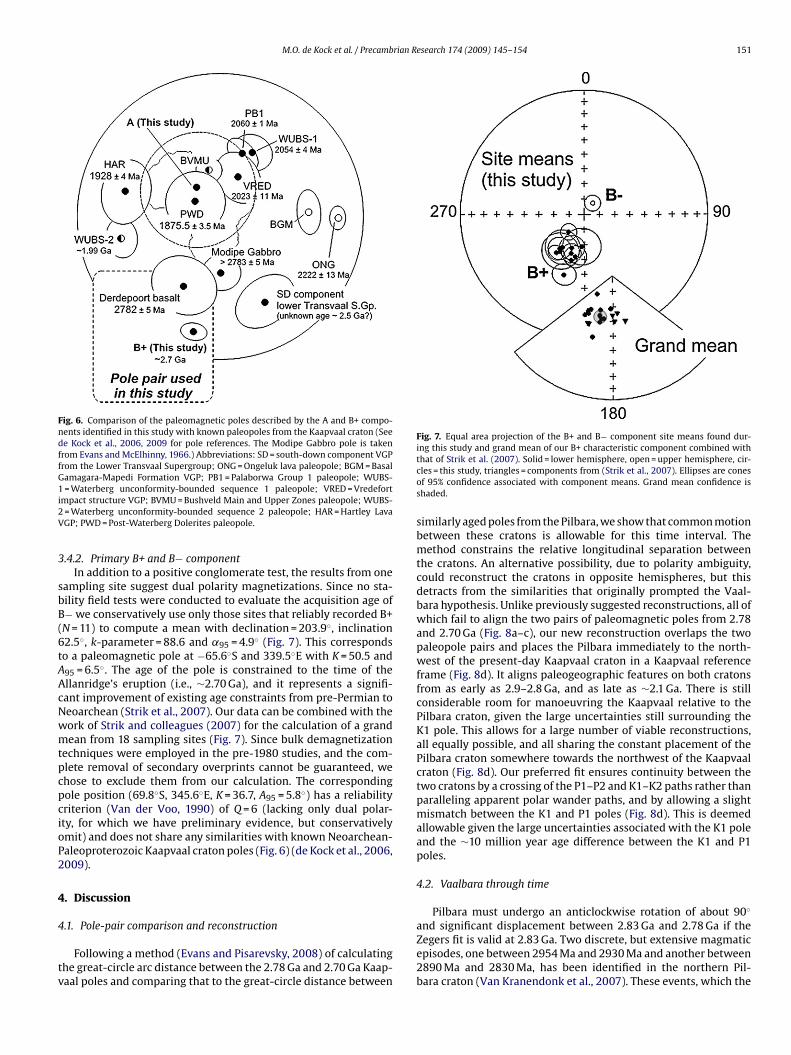
M.O. de Kock et al. / Precambrian Research 174 (2009) 145–154 151
Fig. 6. Comparison of the paleomagnetic poles described by the A and B+ compo-nents identified in this study with known paleopoles from the Kaapvaal craton (Seede Kock et al., 2006, 2009 for pole references. The Modipe Gabbro pole is takenfrom Evans and McElhinny, 1966.) Abbreviations: SD = south-down component VGPfrom the Lower Transvaal Supergroup; ONG = Ongeluk lava paleopole; BGM = BasalGamagara-Mapedi Formation VGP; PB1 = Palaborwa Group 1 paleopole; WUBS-1i2V
3
sbB(6tAAcNwmtpcpcioP2
4
4
tv
Fig. 7. Equal area projection of the B+ and B− component site means found dur-ing this study and grand mean of our B+ characteristic component combined with
and significant displacement between 2.83 Ga and 2.78 Ga if the
= Waterberg unconformity-bounded sequence 1 paleopole; VRED = Vredefortmpact structure VGP; BVMU = Bushveld Main and Upper Zones paleopole; WUBS-= Waterberg unconformity-bounded sequence 2 paleopole; HAR = Hartley LavaGP; PWD = Post-Waterberg Dolerites paleopole.
.4.2. Primary B+ and B− componentIn addition to a positive conglomerate test, the results from one
ampling site suggest dual polarity magnetizations. Since no sta-ility field tests were conducted to evaluate the acquisition age of− we conservatively use only those sites that reliably recorded B+N = 11) to compute a mean with declination = 203.9◦, inclination2.5◦, k-parameter = 88.6 and ˛95 = 4.9◦ (Fig. 7). This correspondso a paleomagnetic pole at −65.6◦S and 339.5◦E with K = 50.5 and95 = 6.5◦. The age of the pole is constrained to the time of thellanridge’s eruption (i.e., ∼2.70 Ga), and it represents a signifi-ant improvement of existing age constraints from pre-Permian toeoarchean (Strik et al., 2007). Our data can be combined with theork of Strik and colleagues (2007) for the calculation of a grandean from 18 sampling sites (Fig. 7). Since bulk demagnetization
echniques were employed in the pre-1980 studies, and the com-lete removal of secondary overprints cannot be guaranteed, wehose to exclude them from our calculation. The correspondingole position (69.8◦S, 345.6◦E, K = 36.7, A95 = 5.8◦) has a reliabilityriterion (Van der Voo, 1990) of Q = 6 (lacking only dual polar-ty, for which we have preliminary evidence, but conservativelymit) and does not share any similarities with known Neoarchean-aleoproterozoic Kaapvaal craton poles (Fig. 6) (de Kock et al., 2006,009).
. Discussion
.1. Pole-pair comparison and reconstruction
Following a method (Evans and Pisarevsky, 2008) of calculatinghe great-circle arc distance between the 2.78 Ga and 2.70 Ga Kaap-aal poles and comparing that to the great-circle distance between
that of Strik et al. (2007). Solid = lower hemisphere, open = upper hemisphere, cir-cles = this study, triangles = components from (Strik et al., 2007). Ellipses are conesof 95% confidence associated with component means. Grand mean confidence isshaded.
similarly aged poles from the Pilbara, we show that common motionbetween these cratons is allowable for this time interval. Themethod constrains the relative longitudinal separation betweenthe cratons. An alternative possibility, due to polarity ambiguity,could reconstruct the cratons in opposite hemispheres, but thisdetracts from the similarities that originally prompted the Vaal-bara hypothesis. Unlike previously suggested reconstructions, all ofwhich fail to align the two pairs of paleomagnetic poles from 2.78and 2.70 Ga (Fig. 8a–c), our new reconstruction overlaps the twopaleopole pairs and places the Pilbara immediately to the north-west of the present-day Kaapvaal craton in a Kaapvaal referenceframe (Fig. 8d). It aligns paleogeographic features on both cratonsfrom as early as 2.9–2.8 Ga, and as late as ∼2.1 Ga. There is stillconsiderable room for manoeuvring the Kaapvaal relative to thePilbara craton, given the large uncertainties still surrounding theK1 pole. This allows for a large number of viable reconstructions,all equally possible, and all sharing the constant placement of thePilbara craton somewhere towards the northwest of the Kaapvaalcraton (Fig. 8d). Our preferred fit ensures continuity between thetwo cratons by a crossing of the P1–P2 and K1–K2 paths rather thanparalleling apparent polar wander paths, and by allowing a slightmismatch between the K1 and P1 poles (Fig. 8d). This is deemedallowable given the large uncertainties associated with the K1 poleand the ∼10 million year age difference between the K1 and P1poles.
4.2. Vaalbara through time
Pilbara must undergo an anticlockwise rotation of about 90◦
Zegers fit is valid at 2.83 Ga. Two discrete, but extensive magmaticepisodes, one between 2954 Ma and 2930 Ma and another between2890 Ma and 2830 Ma, has been identified in the northern Pil-bara craton (Van Kranendonk et al., 2007). These events, which the

152 M.O. de Kock et al. / Precambrian Research 174 (2009) 145–154
Fig. 8. 2.78 Ga and 2.70 Ga pole-pair comparison. All reconstructions are in a present Kaapvaal reference frame and centred on 30◦S and 30◦E. In global views the Kaapvaaland the Grunehogna cratons are indicated in green, whereas the Pilbara craton is orange. Kaapvaal poles (green): K1 = 2782 ± 5 Ma Derdepoort Basalt pole (Wingate, 1998),K2 = ∼2.7 Ga Allanridge Formation pole (this study). Pilbara poles (Strik et al., 2003) in orange: P1 = 2772 ± 2 Ma Pilbara Flood basalts Package 1, P2 = 2717 ± 2 Ma Pilbara Floodbasalts Package 8–10. Angular distances: K1–K2 = 31.8 ± 23.3◦ , P1–P2 = 24.7 ± 16.2◦ . (a) Ur-like fit produces misalignment of pole pairs. Pilbara was rotated into a Pangeanposition about an Euler pole at 29.1◦S, 57.2◦W through an anticlockwise angle of 54.1◦ . (b) Cheney fit with the Pilbara south of Kaapvaal does not result in pole overlap:Pilbara is rotated about an Euler pole at 71.7◦N, 40.6◦E through an angle of −85.0◦ . (c) Zegers fit was originally suggested for 2.83 Ga old poles, but a similar fit causeslarge separation between the 2.78 Ga and 2.70 Ga pole pairs. For the Zegers fit to be valid at 2.83 Ga, the Pilbara craton has to undergo a near 90◦ anticlockwise rotationand significant displacement before 2.78 Ga. Rotation parameters for the Pilbara craton: 39.3◦N, 102.9◦W through an angle of −156.9◦ . (d) Overlap of similarly aged poles isa g it inn n geols distribi es to
Zv2cehnSwSa(oKt2
shttnFtb2t(
l
chieved by rotating the Pilbara 93.2◦ about an Euler pole at 59.0◦S, 251.5◦E, bringinorthwest of Kaapvaal given the pole constraints, but we prefer a tight fit based ouperimposed onto reconstruction (d). (f) Paleogeography and sedimentary faciesndicate paleocontinental shelf-slope boundaries. (For interpretation of the referenc
egers fit (Fig. 8c) predicts to be represented in the eastern Kaap-aal, have thus far gone unrecognized (Eglington and Armstrong,004; Poujol et al., 2003) – during these times the eastern andentral parts of the craton experienced a period of magmatic qui-scence. The younger, western and northern parts of Kaapvaal,owever, share voluminous plutonism at 2.88–2.82 Ga with theorthern Pilbara Kurrana Terrane (Eglington and Armstrong, 2004;chmitz et al., 2004) and possibly with the Sylvania inlier (south-estern Pilbara). No precise ages exist for basement rocks from the
ylvania inlier, but Rb-Sr ages approximately ∼2.8 Ga (Tyler, 1991),nd a minimum age is provided by ∼2.75 Ga NNE trending dikesWingate, 1999). Furthermore, in our reconstruction, the trendsf greenstone belts of the Sylvania inlier align with those of theraaipan and Amalia greenstone belts of Kaapvaal, suggesting that
he cratons shared a similar history since 3.2–3.0 Ga (Poujol et al.,003).
The parallel development of Neoarchean volcano-sedimentaryequences, which constitutes the foundation of the Vaalbaraypothesis, provides geological piercing points for our reconstruc-ion. Both this study and the Cheney fit align major structural trendshroughout the development of the two sequences, but paleomag-etic data contradict the Cheney fit (Fig. 8a). Facies in the upperortescue Group suggest a deepening of the Fortescue basin towardhe west and a NW-SE stretching paleoshoreline when the Pil-ara is placed to the northwest of Kaapvaal (Thorne and Trendall,001). Seismic reflectors, above and below the Allanridge Forma-
ion, reveal a similar westward deepening of the Ventersdorp basinTinker et al., 2002) (Fig. 8e).The westward deepening and general NW-SE paleoshore-ine were maintained throughout deposition of the Hamersley
close and to the northwest of Kaapvaal. Note: Pilbara is allowed in a restricted areaogical constraints. (e) Paleogeography and volcanic facies distribution at ∼2.70 Gaution at ∼2.50 Ga superimposed onto reconstruction (d). Dashed curves in e and fcolour in this figure legend, the reader is referred to the web version of the article.)
Group and the Vryburg Formation-lower Transvaal Supergroup(Beukes, 1987; McConchie, 1984; Morris and Horwitz, 1983).Superimposing geochronological, paleogeographical and structuralinformation from these successions onto the proposed recon-struction illustrate this (Fig. 8f). Simultaneous deposition ofcarbonates and iron-formation during this time further supportsparallel basin development (Nelson et al., 1999; Pickard, 2003).A single Transvaal-Hamersley basin at ∼2.5 Ga, which is repre-sentative of only a small portion of the Earth’s surface, shouldbe considered when evaluating the secular trends in chemicalsedimentation, stable isotope signatures, and paleoclimate prox-ies.
We cautiously evaluate the existence of Vaalbara after ∼2.5 Ga.After the ∼2.7 Ga pole (this paper), the paleopole record from theKaapvaal resumes only at 2.22 Ga (Evans et al., 1997), from whenon it is well defined until ∼1.87 Ga (de Kock et al., 2006). Theequivalent Pilbaran record is poor, and the only pole compari-son that can be made is at ∼2.0 Ga or ∼1.8 Ga, depending on theage assigned to iron ores of the Hamersley province (de Kock etal., 2008). Following the method of comparing great-circle dis-tances between successive poles, it can be shown that either ageassignment is unsupportive of our Vaalbara model. This implieseither that Vaalbara fragmented by ∼2.0 Ga, or if the ∼1.8 Ga ageis preferred, that the Vaalbara connection is possible at 2.0 Ga, butunlikely thereafter. Kaapvaal experienced compression before ca.2.1 Ga (Beukes et al., 2002), which was responsible for the develop-
ment of long-wavelength N-S axial-folds. Riebeckite is associatedwith the axial zones of these folds (Button, 1979). On the Pilbaracraton the ca. 2208–2031 Ma (Müller et al., 2005) Ophthalmianorogeny was responsible for the development of E-W trending fold
rian R
aaim∼
5
KwgfPiLVecacKribatitgE
A
AaWf
R
A
B
B
B
B
B
B
B
C
C
M.O. de Kock et al. / Precamb
xes. Here too, Riebeckite is associated with the folds (Krapez etl., 2003). A clockwise rotation of Pilbara, as our reconstructionmplies, brings the fold axes of the cratons into rough align-
ent. Shared histories thus support our Vaalbara model up to2.1 Ga.
. Conclusions
A good match between the apparent polar wander paths of theaapvaal and Pilbara cratons for the period 2.78–2.70 Ga togetherith strikingly similar geological features (e.g., lithostratigraphy,
eochronology, structures, etc.) provide the best evidence thus faror the existence of Vaalbara during the late Neoarchean and earlyaleoproterozoic eras. Improved paleomagnetic data paired with
mproved age constraints from units like the Derdepoort, Kanye andobatse volcanics; the Modipe Gabbro; Allanridge Formation andryburg Formation as well as the numerous dike swarms exposedspecially on the eastern part of the Kaapvaal craton can helponstrain the configuration of Vaalbara significantly. The currentlyvailable paleomagnetic data constrain the position of the Pilbararaton in close immediate proximity towards the northwest of theaapvaal craton in a present-day Kaapvaal reference frame. This
econstruction provides the oldest example, and the only Archeannstance, of paleomagnetic reconstruction between continentallocks in terms of both paleolatitude and relative longitude. It maylso require a significant reappraisal of previous paleoenvironmen-al conclusions concerning the Archean-Paleoproterozoic boundaryn the Hamersley and Transvaal basins. Our reconstruction implieshat any detailed datasets coming from these well-preserved strati-raphies represent one basin, in one location on the 2.7–2.2 Gaarth.
cknowledgements
The South African National Research Foundation and thegouron Institute for Geobiology supported this study. D.A.D.E.cknowledges support of the David and Lucile Packard Foundation.e would like to thank Wouter Bleeker, Joe Meert and Lisa Tauxe
or their critical readings of the manuscript.
eferences
rmstrong, R.A., Compston, W., Retief, E.A., Williams, I.S., Welke, H.J., 1991. Zirconion microprobe studies bearing on the age and evolution of the Witwatersrandtriad. Precambrian Research 53, 243–266.
arton, J.M.J., Blignaut, E., Salnikova, E.B., Kotov, A.B., 1995. The stratigraphical posi-tion of the Buffelsfontein Group based on field relationships and chemical andgeochronological data. South African Journal of Geology 98, 386–392.
eukes, N.J., 1987. Facies relations, depositional environments and diagenesis in amajor Early Proterozoic stromatolitic carbonate platform to basinal sequence,Campbellrand Subgroup, Transvaal Supergroup, Southern Africa. SedimentaryGeology 54, 1–46.
eukes, N.J., Dorland, H.C., Gutzmer, J., Nedachi, M., Ohmoto, H., 2002. Tropicallaterites, life on land, and the history of atmospheric oxygen in the Paleopro-terozoic. Geology 30 (6), 491–494.
lake, T.S., Buick, R., Brown, S.J.A., Barley, M.E., 2004. Geochronology of a LateArchaean flood basalt province in the Pilbara Craton, Australia: constraints onbasin evolution, volcanic and sedimentary accumulation, and continental driftrates. Precambrian Research 133, 143–173.
oger, S.D., Wilson, C.J.L., Fanning, C.M., 2001. Early Paleozoic tectonism within theEast Antarctic craton: the final suture between east and west Gondwana? Geol-ogy 29, 463–466.
uick, I.S., Maas, R., Gibson, R., 2001. Precise U-Pb titanite age constraints on theemplacement of the Bushveld Complex, South Africa. Journal of the GeologicalSociety, London 158, 3–6.
utton, A., 1979. Transvaal and Hamersley Basins—review of basin development andmineral deposits. Minerals Science and Engineering 8, 262–290.
heney, E.S., 1990. Evolution of the “Southwestern” continental margin of Vaalbara,Extended Abstracts Geocongress’90. Geological Society of South Africa, CapeTown, pp. 88–91.
heney, E.S., 1996. Sequence stratigraphy and plate tectonic significance of theTransvaal succession of southern Africa and its equivalent in Western Australia.Precambrian Research 79, 3–24.
esearch 174 (2009) 145–154 153
Cogné, J.P., 2003. PaleoMac: a Macintosh (application for reconstructions. Geochem-istry Geophysics Geosystems 4, 1007, doi:10.1029/2001GC000227.
Collins, A.S., Pisarevsky, S.A., 2005. Amalgamating eastern Gondwana: the evolutionof the Circum-Indian Orogens. Earth-Science Reviews 71, 229–270.
Crow, C., Condie, K.C., 1988. Geochemistry and origin of late Archean volcanicsfrom the Ventersdorp Supergroup, South Africa. Precambrian Research 42 (1–2),19–37.
Council for Geoscience, 1997. Geological Map of the Republic of South Africa and theKingdoms of Leshoto and Swaziland. Council for Geoscience, Pretoria, 1:1 000000.
De Beers, 1998. Aeromagnetic map. In: Ayers, N.P., Hatton, C.J., Quadling, K.E., Smith,C.D. (Eds.), Update on the Distribution in Time and Space of Southern AfricanKimberlites.
de Kock, M.O., 2007. Paleomagnetism of selected Neoarchean-Paleoproterozoic coversequences on the Kaapvaal craton and implications for Vaalbara. UnpublishedPh.D. Thesis. University of Johannesburg, Johannesburg, 276 pp.
de Kock, M.O., Evans, D.A.D., Dorland, H.C., Beukes, N.J., Gutzmer, J., 2006. Paleomag-netism of the lower two unconformity-bounded sequences of the WaterbergGroup, South Africa: towards a better-defined apparent polar wander path forthe Paleoproterozoic Kaapvaal Craton. South African Journal of Geology 109 (1),157–182.
de Kock, M.O., Evans, D.A.D., Gutzmer, J., Beukes, N.J., Dorland, H.C. (Eds.), 2008.Origin and Timing of BIF-hosted High-grade Hard Hematite Deposits—A Pale-omagnetic Approach. BIF-related High-grade Iron Mineralization, Reviews inEconomic Geology, vol. 15. Society for Economic Geologists, pp. 49–71.
de Kock, M.O., Evans, D.A.D., Kirschvink, J.L., Beukes, N.J., Rose, E., Hilburn, I., 2009.Paleomagnetism of a Neoarchean-Paleoproterozoic carbonate ramp and car-bonate platform succession (Transvaal Supergroup) from surface outcrop anddrill core, Griqualand West region, South Africa. Precambrian Research 169,80–99.
Eglington, B.M., Armstrong, R.A., 2004. The Kaapvaal Craton and adjacent orogens,southern Africa: a geochronological database and overview of the geologicaldevelopment of the craton. South African Journal of Geology 107, 13–32.
England, G.L., et al., 2001. SHRIMP U-Pb ages of diagenetic and hydrothermal xeno-time from the Archean Witwatersrand Supergroup of South Africa. Terra Nova13, 360–367.
Evans, D.A., Beukes, N.J., Kirschvink, J.L., 1997. Low-latitude glaciation in the Palaeo-proterozoic era. Nature 386, 262–266.
Evans, D.A.D., Beukes, N.J., Kirschvink, J.L., 2002. Paleomagnetism of a lateritic pale-oweathering horizon and overlying Paleoproterozoic red beds from South Africa:implications for the Kaapvaal apparent polar wander path and a confirmationof atmospheric oxygen enrichment. Journal of Geophysical Research 107 (No.BN12, 2326), doi:10.1029/2001JB000432.
Evans, D.A.D., Pisarevsky, S.A., 2008. Plate tectonics on the early Earth?—weighingthe paleomagnetic evidence. In: Condie, K., Pease, V. (Eds.), When did PlateTectonics Begin? Geological Society of America, pp. 249–263.
Evans, M.E., McElhinny, M.W., 1966. The Paleomagnetism of the Modipe Gabbro.Journal of Geophysical Research 70, 6053–6063.
Fitzsimons, I.C.W., 2000. Grenville-age basement provinces in East Antarctica: evi-dence for three seperate collisional orogens. Geology 28, 879–882.
Geological Survey Department Lobatse, 1984. Geological Map of the Republic ofBotswana, 1: 1000 000.
Grobler, D.F., Walraven, F., 1993. Geochronology of Gabarone Granite Complex exten-sions in the area north of Mafikeng, South Africa. Chemical Geology 105, 319–337.
Hanson, R.E., et al., 2004. Coeval large-scale magmatism in the Kalahari and Lauren-tian cratons during Rodinia assembly. Science 304, 1126–1129.
Henthorn, D.I., 1972. Paleomagnetism of the Witwatersrand Triad Republic of SouthAfrica and related topics. Unpublished PhD Thesis, The University of Leeds, 103pp.
Jacobs, J., Thomas, R.J., 2004. Himalayan-type indenter-escape tectonics model forthe south part of the late Neoproterozoic-early Paleozoic East African-Antarcticorogen. Geology 32, 721–724.
Jones, C.H., 2002. User-driven integrated software lives: “Paleomag” Paleomagneticanalysis on the MacintoshTM. Computers and Geosciences 28, 1145–1151.
Jones, D.L., Walford, M.E.R., Gifford, A.C., 1967. A paleomagnetic result from the Ven-tersdorp Lavas of South Africa. Earth and Planetary Science Letters 2, 155–158.
Jones, D.L., Bates, M.P., Li, Z.X., Corner, B., Hodgkinson, G., 2003. Palaeomagneticresults from the ca. 1130 Ma Borgmassivet intrusions in the Ahlmannryggenregion of Dronning Maud Land, Antarctica, and tectonic implications. Tectono-physics 375, 247–260.
Kamo, S.L., Reimold, W.U., Krogh, T.E., Colliston, W.P., 1996. A 2.023 Ga age for theVredefort impact event and a first report of shock metmorphosed zircons inpseudotachylitic breccias and granophyre. Earth and Planetary Science Letters144, 369–387.
Kaufman, A.J., et al., 2007. Late Archean biospheric oxygenation and atmosphericevolution. Science 317, 1900–1903.
Kirschvink, J.L., 1980. The least squares line and plane and the analysis of palaeo-magnetic data. Geophysical Journal of the Royal Astronomical Society 62,699–718.
Krapez, B., Barley, M.E., Pickard, A.L., 2003. Hydrothermal and resedimented origin of
the precursor sediments to banded iron formation: sedimentological evidencefrom the Early Paleoproterozoic Brockman Supersequence of Western Australia.Sedimentology 50, 979–1011.Layer, P.W., Kröner, A., McWilliams, M., Clauer, N., 1988. Regional magnetic over-printing of Witwatersrand Supergroup sediments, South Africa. Journal ofGeophysical Research 93 (B3), 2191–2200.

1 rian R
M
M
M
M
M
M
M
M
N
N
P
P
P
R
Zegers, T.E., De Wit, M.J., Dann, J., White, S.H., 1998. Vaalbara, Earth’s oldest assem-
54 M.O. de Kock et al. / Precamb
aier, W.D., Peltonen, P., Grantham, G., Mänttäri, I., 2003. A new 1.9 Ga age for theTrompsburg intrusion, South Africa. Earth and Planetary Science Letters 212,351–360.
cConchie, D., 1984. A depositional environment for the Hamersley Group: palaeo-geography and geochemistry. In: Muhling, J.R., Groves, D.I., Blake, T.S. (Eds.),Archean & Proterozoic Basins of the Pilbara, Western Australia: Evolution & Min-eralization Potential. University Extention, The University of Western Australia,Nedlans, Western Australia, pp. 144–195.
eert, J.G., 2003. A synopsis of events related to the assembly of eastern Gondwana.Tectonophysics 362, 1–40.
ondal, S., Piper, J.D.A., Hunt, I., Banyopadhyay, G., Basu Mallik, S., 2009. Palaeo-magnetic and rock magnetic study of charnockites from Tamil Nadu, India, andthe ‘Ur’ protocontinent in Early Palaeoproterozoic times. Journal of Asian EarthScience 34, 493–506.
oore, M., Davis, D.W., Robb, L.J., Jackson, M.C., Grobler, D.F., 1993. Archean rapakivigranite-anorthosite-rhyolite complex in the Witwatersrand basin hinterland,southern Africa. Geology 21, 1031–1034.
orris, R.C., Horwitz, R.C., 1983. The origin of the iron-formation-rich HamersleyGroup of Western Australia—deposition on a platform. Precambrian Research21, 273–297.
ukherjee, A., Das, S., 2002. Anorthosites, granulites and the supercontinent cycle.Gondwana Research 5 (1), 147–156.
üller, S.G., Krapez, B., Barley, M.E., Fletcher, I.R., 2005. Giant iron-ore deposits ofthe Hamersley province related to the breakup of Paleoproterozoic Australia:new insights from in-situ SHRIMP dating of baddeleyite from mafic intrusions.Geology 33 (7), 577–580.
elson, D.R., Trendall, A.F., Altermann, W., 1999. Chronological correlations betweenthe Pilbara and Kaapvaal cratons. Precambrian Research 97, 165–189.
elson, D.R., Trendall, A.F., De Laeter, J.R., Grobler, N.J., Fletcher, I.R., 1992. A compar-ative study of the geochemical and isotopic systematics of late Archaean floodbasalts from the Pilbara and Kaapvaal cratons. Precambrian Research 54 (2–4),231–256.
ickard, A., 2003. SHRIMP U-Pb zircon ages for the Palaeoproterozoic Kuruman IronFormation, Northern Cape Province, South Africa: evidence for simultaneous BIFdeposition on Kaapvaal and Pilbara Cratons. Precambrian Research 125, 275–315.
oujol, M., Kiefer, R., Robb, L.J., Anhaeusser, C.R., Armstrong, R.A., 2005. New U-Pb data on zircons from the Amalia greenstone belt Southern Africa: insightsinto the Neoarchean evolution of the Kaapvaal Craton. South African Journal of
Geology 108 (3), 317–332.oujol, M., Robb, L.J., Anhaeusser, C.R., Gericke, B., 2003. A review of the geochrono-logical constraints on the evolution of the Kaapvaal Craton, South Africa.Precambrian Research 127, 181–213.
ogers, J.J.W., 1996. A history of the continents in the past three billion years. TheJournal of Geology 104, 91–107.
esearch 174 (2009) 145–154
Rogers, J.J.W., Santosh, M., 2003. Supercontinents in earth history. GondwanaResearch 6 (3), 357–368.
Schmitz, M.D., Bowring, S.A., De Wit, M.J., Gartz, V., 2004. Subduction and terranecollosion stabilize the western Kaapvaal craton tectosphere 2.9 billion years ago.Earth and Planetary Science Letters 222, 363–376.
Shipunov, S.V., Muraviev, A.A., Bazhenov, M., 1998. A new conglomerate test inpalaeomagnetism. Geophysics Journal International 133, 721–725.
Strik, G., Blake, T.S., Zegers, T.E., White, S.H., Langereis, C.G., 2003. Palaeomagnetismof flood basalt in the Pilbara Craton, Western Australia: late Archaean conti-nental drift and the oldest known reversal of the geomagnetic field. Journal ofGeophysical Research 108, doi:10.1029/2003JB002475.
Strik, G., De Wit, M.J., Langereis, C.G., 2007. Palaeomagnetism of the NeoarchaeanPongola and Ventersdorp Supergroups and an appraisal of the 3.0–1.9 Ga appar-ent polar wander path of the Kaapvaal Craton, Southern Africa. PrecambrianResearch 153, 96–115.
Tauxe, L., Butler, R.F., Banerjee, S., Van der Voo, R., 2009. Essentials of Paleomag-netism. University of California, Berkeley.
Thorne, A.M., Trendall, A.F., 2001. Geology of the Fortescue Group, Pilbara Cra-ton, Western Australia, Bulletin 144. Western Australia Geological Survey,249 pp.
Tinker, J., De Wit, M.J., Grotzinger, J., 2002. Seismic stratigraphic constraints onNeoarchean-Paleoproterozoic evolution of the western margin of the KaapvaalCraton, South Africa. South African Journal of Geology 105, 107–134.
Trendall, A.F., 1968. Three great basins of Precambrian iron formation deposition: asystematic comparison. Geological Society of America Bulletin 79, 1527–1533.
Tyler, I.M., 1991. The Geology of the Sylvania Inlier and the Southeast Hamersly Basin.Bulletin, vol. 138. Geological Survey of Western Australia, Perth, 108 pp.
Van der Voo, R., 1990. The reliability of paleomagnetic data. Tectonophysics 184, 1–9.Van Kranendonk, M.J., Smithies, R.H., Hickman, A.H., Champion, D.C., 2007. Review:
secular tectonic evolution of Archean continental crust: interplay between hor-izontal and vertical processes in the formation of the Pilbara Craton, Australia.Terra Nova 19, 1–38.
Wingate, M.T.D., 1998. A palaeomagnetic test of the Kaapvaal–Pilbara (Vaal-bara) connection at 2.78 Ga. South African Journal of Geology 101 (4),257–274.
Wingate, M.T.D., 1999. Ion microprobe baddeleyite and zircon ages for Late Archaeanmafic dykes of the Pilbara craton, Western Australia. Australian Journal of EarthSciences 46 (4), 493–500.
bled continent? A combined structural, geochronological, and palaeomagnetictest. Terra Nova 10, 250–259.
Zhao, G., Sun, M., Wilde, S.A., Sanzhong, L., Jian, Z., 2006. Some key issues in recon-structions of Proterozoic supercontinents. Journal of Asian Earth Sciences 28,3–19.