validating dynamic tensile mechanical properties of sheet
TRANSCRIPT

6th European LS-DYNA Users’ Conference
2.2.1 2.33
VALIDATING DYNAMIC TENSILE MECHANICAL PROPERTIES OF SHEET STEELS FOR AUTOMOTIVE CRASH
APPLICATIONS
AUTHORS: P.K.C. Wood, University of Warwick C.A. Schley, University of Warwick M. Buckley, Jaguar and Land Rover
B. Walker, ARUP T. Dutton, Dutton Simulation
CORRESPONDENCE: Dr. Paul Wood
University of Warwick, 2nd Floor IARC, Coventry, CV4 7AL Tel 02476 575379
Email [email protected]
ABSTRACT
A thin-wall open channel beam, fabricated from high strength Dual Phase sheet steel, subjected to 3-point bending and constant velocity boundary condition, is investigated to validate material performance for automotive crash applications. Specifically quantitative validation of material tensile data determined from high speed tests and component models, and qualitative validation of materials resistance to fracture. The open channel beam is subjected to quasi-static and increasing loading speed and in all cases, large displacement in which deformation involves formation of a plastic hinge. This paper describes development of test procedure, notably beam specimen design, measurement system and boundary conditions, using both experimental and numerical techniques. The new test procedure, as a compliment to crush testing, will increase confidence in the modeling and application of new advanced higher strength materials in automotive crash structures.
KEYWORDS: Material Characterisation, Strain Rate, Material Validation, Crash Material Data

6th European LS-DYNA Users’ Conference
2.34 2.2.1
INTRODUCTION
An improved understanding of the behaviour of automotive materials at high velocity is driven by the challenges of diverse crash legislation and competition amongst car manufacturers. In a round robin study involving ten leading international testing laboratories reported in 2006[1], uncertainty in material tensile data increases with strain rate, and particularly in the design range for automotive applications. The cost of generating material tensile data with strain rate dependency is high. A cost survey conducted as part of this study, and involving both academic and industry sources suggest a factor of typically fifty times higher than the cost to generate quasi-static tensile data to Euronorm[2] requirements.
The high cost and uncertainty in the quality of material strain rate sensitivity data is the motivation for this project. The aim of this study is to investigate a thin-wall open channel beam, fabricated from high strength Dual Phase sheet steel, subjected to 3-point bending and constant velocity boundary condition, to validate material strain rate sensitivity data which will be used to develop Premium automotive crash safety structures. This study forms part of larger body of work, which considers the requirements for the generation of strain rate sensitivity data for ferrous and non-ferrous materials, together with the processes to transform, model, and to format this data for input to crash simulation tools, and finally to validate this data in representative crash structures.
EXPERIMENTAL INVESTIGATIONS
In the current test arrangement it was desirable to investigate a beam under simple 3-point bending rather than fix or constrain the ends of beam. Constraining the beam ends may be desirable to increase stiffness and hence natural frequency of beam. But uncertainty in the restraints (or end fixings) would probably yield more uncertainty in measurements relating to material performance. There is concern that loading at the four support contact points of beam may induce beam collapse at one or more of the supports.
Experimental Equipment: The equipment at the IARC is a high speed servo-hydraulic machine[3] with a stiff four column load frame capable of 160kN maximum dynamic loading, see figure 1. The actuator delivers constant velocity in the range 1 to 1000 mm/s under closed loop control, and 1000 through to 20000mm/s under open loop control. The shaft connecting impactor (tup) to the actuator is instrumented with a transducer configured as a full bridge strain gauge circuit. Actuator stroke position is measured using a Linear Variable Differential Transducer (LVDT). Guides constrain tup movement to the loading axis, to minimise bending moment transfer to instrumented shaft, and suppress rotation of tup during loading cycle. Hydraulic oil is wiped along the inner slides of the guides to minimize friction.

6th European LS-DYNA Users’ Conference
2.2.1 2.35
Figure 1: Test arrangement
The actuator develops a full working stroke of 300 mm under open loop control which includes the distance required to accelerate actuator to constant velocity, and distance to decelerate actuator. The distance available for applied constant velocity during loading cycle decreases on demand for higher constant velocity. A further safety measure is the incorporation of shear pin connecting tup shaft to actuator, so designed to protect equipment should the inertia force exceed 60kN. Two hardened steel supports are designed to provide an adjustment to beam span depending on test requirements.
Specimen Design: The nominal outer dimensions of beam specimen are 60 mm wide x 60 mm deep x 1.5mm gauge x 700 mm long. The nominal corner radius is 3.5 mm to mid-plane of section, which is typical of an automotive steel structure. The beam span between supports is maximised at 500 mm, to promote tensile (or direct) stress in side walls of beam rather than shear deformation. Specimens are fabricated from high strength Dual Phase sheet steel using a CNC folding machine with spring back compensation, to produce U-section specimens of high accuracy with consistency. Preliminary CAE suggested dynamic loading would not exceed 30kN at high speed.
Experimental Set-up: To delay initiation of plastic hinge and hence premature bending collapse a large tup radius seems to be desirable to maximise contact area between tup and top surface of beam. But size of tup is restricted to a smaller dimension to limit inertia force during deceleration phase of actuator.

6th European LS-DYNA Users’ Conference
2.36 2.2.1
The current set up is designed to deliver a constant velocity over at least 50 mm from tup initial contact with beam. A larger displacement range could be used but requires a modification to fixture arrangement. A limit of 50 mm range is necessary because at 20 m/s the actuator requires a minimum 55 mm working stroke for deceleration.
Experimental Results: A velocity sweep was conducted through 10, 100, 800, 2000 and 5000 mm/s. The measured velocity profiles are shown in the graph in left figure 2. It is noted that deviation from target velocity value appears to increase with speed. The deviation between target and measured value for a given velocity is shown in right figure 2. At lower velocity the average relative deviation is below 3% and is positive meaning the measured velocity is greater than target value. At higher velocity, the relative deviation rises to near 7% at 2000 mm/s and is negative, meaning the measured velocity is smaller than target value. The machine control ‘velocity profile correction’ may be applied under open loop control which would reduce the error between target and measured velocity, but increasing overall set up time and complexity of test.
Figure 2: Measured velocities (left). Measured velocity deviation from target (right)
The target velocity values will be used however as boundary condition inputs to finite element models. For convenience the target values are referred to as nominal values from hereon.
Figure 3: U-section collapse mode for all impact velocities
As beam deflection increases during loading cycle, the side walls start to move inward at the centre of the beam, so reducing the moment of inertia (MOI) in the section at the
1
10
100
1000
10000
0 10 20 30 40 50 60
Actuator Displacement (mm)
Mea
sure
d Sp
eed
(mm
/s).
(Sca
le lo
g ba
se 1
0)
5000 mm/s (4787 mm/s measured average)2000 mm/s (1865 mm/s measured average)800 mm/s (773 mm/s measured average)100 mm/s (103 mm/s measured average)10 mm/s (10.0 mm/s measured average)
0.2%
3.0%
-3.4%
-6.7%
-4.3%
2.3%
4.0%
-6.4%
-10.8%
-7.9%
-12%
-9%
-6%
-3%
0%
3%
6%
10 100 800 2000 5000
Target Velocity Setting (mm/s)
Rel
ativ
e D
evia
tion
(%)
average deviationmax deviation

6th European LS-DYNA Users’ Conference
2.2.1 2.37
beam centre. A hinge develops as deflection increases still further. The load carrying capacity of the beam reduces as plasticity develops across the depth of the beam at the hinge, and load is at a maximum before a reduction in MOI occurs. Local deformation at the four support contact points is barely visible on the edge of beam – almost a witness mark. Measurements suggest local edge compression is typically less than 0.2 mm displacement, and extending over an arc length of less than 5 mm, although a lateral bulge is just visible. There was no evidence of edge cracking induced by tensile strain in any of the specimens for the Dual Phase steel tested across all velocities. Increasing measured load oscillation accompanies higher velocity, hence quantitative load measurement is restricted to 5000 mm/s velocity, see figure 4 below.
Figure 4: C60 SAE Filter applied to raw test data derived at nominal velocity 2000mm/s (left). C180 SAE Filter applied to raw test data derived at nominal velocity 5000 m/s.
A ringing frequency common to velocities 2000 and 5000 mm/s is observed at 1 kHz, shown in figure 4. The first natural frequency of a simply supported beam with overhang symmetry[4] is calculated at 1 kHz. At 2000 mm/s (left figure) a lower frequency of 200 Hz is observed. The lower frequency appears to be excided at the start of the acceleration phase to reach constant velocity, before contact between tup and beam is initiated as shown in the transducer signal response, see figure 5 below left.
Figure 5: Measured load from transducer (left). Strain rate dependency (right)
0
2
4
6
8
10
12
14
16
0.09 0.1 0.11 0.12 0.13 0.14
Time (s)
Forc
e (k
N)
Raw dataFiltered data
0
5
10
15
20
25
0.044 0.046 0.048 0.05 0.052 0.054Time (s)
Forc
e (k
N)
Raw dataFiltered data
-4
0
4
8
12
16
0.02 0.04 0.06 0.08 0.1 0.12
Time (secs)
Forc
e (k
N)
0
2
4
6
8
10
12
14
0 10 20 30 40 50Actuator Displacement (mm)
Mea
sure
d Fo
rce
(kN
)
5000 mm/s2000 mm/s800 mm/s100 mm/s10 mm/s

6th European LS-DYNA Users’ Conference
2.38 2.2.1
The lower ringing frequency of 200Hz is most likely inertial induced rather than friction resistance between tup and fixture guides; observe decay in oscillation at time 50msecs (left figure 5) following initial acceleration phase. The lowest natural frequency of longitudinal vibration of tup shaft modelled as a simple spring mass assembly is around 2 kHz; note strain gauges circuit is mounted on tup shaft and this dictates frequency response of load measurement transducer. The lowest natural frequency of tup shaft in flexure is around 500Hz. The transducer strain gauges mounted on the shaft however, are configured as a full bridge circuit to compensate for flexing of shaft. Currently the source of the lower ringing frequency of 200Hz has not been identified.
The force versus displacement curves in figure 5 right show velocity rate dependency. At the higher velocities of 2000 and 5000 mm/s initial stiffness (i.e. rate of change of force) reduces as force increases to its peak value resulting from use of filter.
Characterising Performance Measures: Suggested performance measures to enable quantitative validation of material model with strain rate dependency are identified using the force-displacement curve, see left figure 6; for example, energy to peak force, peak force and energy post-peak force up to 50 mm total displacement (limit for constant velocity boundary condition for the current fixture arrangement is 50 mm total displacement from initial tup contact with beam). For simplicity, peak force and total energy at 10 mm and 50 mm increments are easier to compute.
Figure 6: Characterising force-displacement curve (left). Each force-displacement curve set to zero displacement at peak force (right)
Notice in right figure 6 the post-peak force curves for 10, 100, 800 mm/s are consistent in the displacement range of constant velocity (note there is less than 50mm of constant velocity post-peak force, although 40 mm is conservative). The measured force increases with velocity, suggesting a measurable strain rate effect in this relatively low velocity range. At 2000 and 5000 mm/s, the curve shape changes resulting from filtering the measured load oscillations, but a measurable strain rate effect is still observed.
6th European LS-DYNA Users’ Conference
2.2.1 2.39
Although no quantitative performance data may be obtained above 5000 mm/s, the test is useful in providing a qualitative measurement of material performance, specifically its ability to resist fracture in the design range of interest.
NUMERICAL INVESTIGATIONS
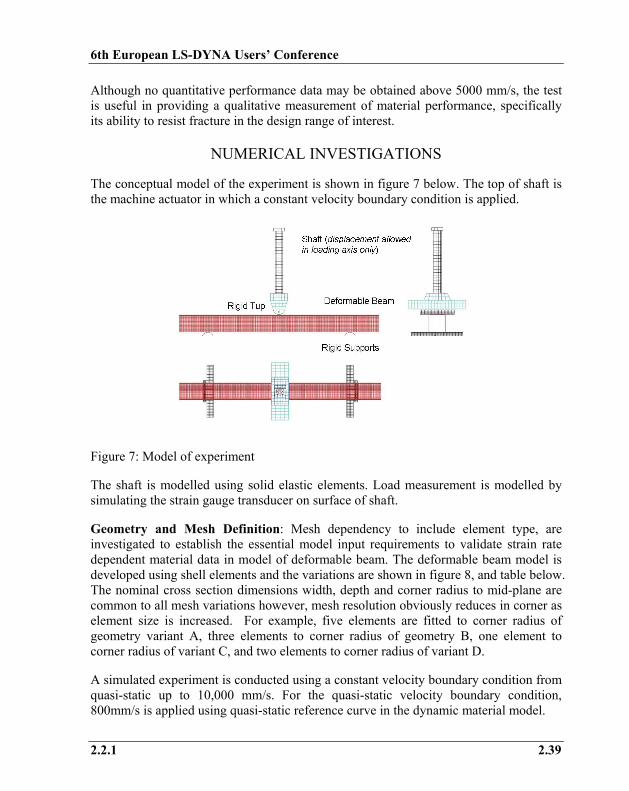
The conceptual model of the experiment is shown in figure 7 below. The top of shaft is the machine actuator in which a constant velocity boundary condition is applied.
Figure 7: Model of experiment
The shaft is modelled using solid elastic elements. Load measurement is modelled by simulating the strain gauge transducer on surface of shaft.
Geometry and Mesh Definition: Mesh dependency to include element type, are investigated to establish the essential model input requirements to validate strain rate dependent material data in model of deformable beam. The deformable beam model is developed using shell elements and the variations are shown in figure 8, and table below. The nominal cross section dimensions width, depth and corner radius to mid-plane are common to all mesh variations however, mesh resolution obviously reduces in corner as element size is increased. For example, five elements are fitted to corner radius of geometry variant A, three elements to corner radius of geometry B, one element to corner radius of variant C, and two elements to corner radius of variant D.
A simulated experiment is conducted using a constant velocity boundary condition from quasi-static up to 10,000 mm/s. For the quasi-static velocity boundary condition, 800mm/s is applied using quasi-static reference curve in the dynamic material model.

6th European LS-DYNA Users’ Conference
2.40 2.2.1
A B C DSide and Top 2.5 5 5 5Corner Radius 1 2 5 3.5
2, 16 2, 16 16 16QS, 800,
2000, 5000
800, 5000 800, 5000Constant velocity BC (mm/s)
Element Size (smallest dimension)
QS, 800, 2000, 5000
Element Type
Figure 8: Model variations to be tested
Material Model: Strain rate dependent material tensile data and material model are developed following Ford Premium Automotive procedures[5] using IARC high speed precision servo-hydraulic test machine and model fitting routine. Raw high speed tensile data is generated across a spectrum of strain rates to create a set of material flow curves with strain rate dependency, see left figure 9.
Figure 9: Raw strain rate tensile test results (left). Fitted material model (right)
The raw tensile data of figure 9 is pre-processed to create true plastic data for the region of uniform plastic elongation, and a surface model with two dependencies, stress as function of strain and strain rate, fitted to the raw plastic data to create a family of flow curves, see right figure 9. Finally, the surface model is formatted using LS-DYNA MAT24[6] with table definition for strain rate dependency.
300
400
500
600
700
800
900
1000
0.00 0.05 0.10 0.15 0.20
True Plastic Strain (mm/mm)
True
Stre
ss (M
Pa)
SR = 0.001/s REMSR = 0.13/s REMSR = 1.2/s REMSR = 6.4/s REMSR = 65/s REMSR = 168/s REMSR = 420/s REMSR = 0.001/s Test Data
REM = Reduced Error Model

6th European LS-DYNA Users’ Conference
2.2.1 2.41
Model Results: The solver LS-DYNA 970 6763 SMP and 4-way IBM set at double precision was used in computations, and OASYS[7] Pre and Post-processing to support analyses. The deformed shape of simulated beam is consistent with the experiment, see figure 10 for all model mesh and velocity variants.
Figure 10: Typical response of deformable structure
Frequency Response Analysis: The frequency response of the load measurement is computed using geometry variant A and element type 16, and is shown in left figure 11. At velocities 5000 and 10000 mm/s the dominant frequencies are 1 and 2 kHz; respectively these correlate to beam natural frequency and frequency response of load measurement transducer. At velocity 2000 m/s, a lower frequency is observed at 200 Hz; the source of this has not yet been identified.
Figure 11: Load oscillation frequency response (left). Modelling dynamic effect using quasi-static material curve (right)
Dynamic Effect: The dynamic effect on material strain rate sensitivity measurements is investigated using the quasi-static material curve in the dynamic model together with geometry variant A and element type 16, as shown in right figure 11. Constant velocity boundary conditions of 800, 2000 and 15000 mm/s are applied in turn. High measured load oscillation is observed at 15000 mm/s. Comparing filtered results at different velocities, peak loads are broadly consistent, but displacement to peak force is not reliable at higher velocities resulting from application of filter, and consequently will influence energy calculations to peak force and post-peak force. It is verified that velocity is limited to a maximum of 5000 mm/s for the current test arrangement.

6th European LS-DYNA Users’ Conference
2.42 2.2.1
Mesh Dependency: Results of all model calculations for the variations described in figure 8 is shown in figure 12 below. Middle and lower graphs compare model and experiment results at 800 and 2000 mm/s.
Figure 12: Upper left model variant A and element type 16. Upper right model variant B and element type 16. Middle left model variant A and type element 2. Middle right model variant type B and element type 2. Lower left model variant C and element type 16. Lower right model variant type D and element type 16.

6th European LS-DYNA Users’ Conference
2.2.1 2.43
Tabulated Results: Relative errors computed between model and experiment results are shown in the tables below. Relative error is computed by subtracting experiment result from model result and dividing by experiment result, and given as percentage.
Model Variant elem type QS 800 2000 500016 -5% -1% -2% -3%2 NT -5% -5% NT16 -1% 2% 0% 1%2 NT -4% -4% NT
C 16 NT -8% -10% NTD 16 NT 38% 37% NT
+ = model result greater than experiment- = model result smaller than experiment
Velocity (mm/s)
A
B
NT model not tested
Table 1: Relative difference between model and experiment for peak force
Model Variant elem type QS 800 2000 500016 -4% 1% -4% -2%2 NT -2% -7% NT16 -1% 3% -2% 1%2 NT -2% -6% NT
C 16 NT -5% -2% NTD 16 NT 38% 44% NT
+ = model result greater than experiment- = model result smaller than experiment
NT model not tested
Velocity (mm/s)
A
B
Table 2: Relative difference between model and experiment for energy at 10mm total displacement
Model Variant elem type QS 800 2000 500016 1% 3% 3% 4%2 NT 0% 0% NT16 8% 11% 9% 10%2 NT 4% 4% NT
C 16 NT 9% 8% NTD 16 NT 26% 25% NT
+ = model result greater than experiment- = model result smaller than experiment
NT model not tested
Velocity (mm/s)
A
B
Table 3: Relative difference between model and experiment for energy at 50mm total displacement

6th European LS-DYNA Users’ Conference
2.44 2.2.1
Concluding Summary: The test procedure is capable of generating meaningful data in the velocity range 10 mm/s through to 5000 mm/s. Quantitative measurements from test include force, time and displacement, from which the developed velocity may be derived during loading cycle. Under open loop control (velocity above 1000 mm/s), average relative deviation from the target velocity is measured at -7%. The measured velocity is however repeatable for the same test conditions, hence if necessary velocity profile correction may be used to compensate velocity reduction by tuning flow through machine hydraulic valves, and reduce measured deviation from target velocity. Under closed loop control (velocity below 1000 mm/s) the average relative deviation from target velocity is measured at +3%.
Although no quantitative performance data may be obtained above 5000 mm/s, the test is useful in providing a qualitative measurement of material performance, specifically its ability to resist fracture in the design range of interest for crash structures. For the material tested, edge cracking was not visible in the material; note the open channel beam was fabricated by folding hence the developed forming strains are restricted to the corners. It may be important to test a materials resistance to fracture using a beam channel with modest thinning strain in side walls resulting from press-stretch forming.
Modelling and experiments have shown a measurable strength hardening effect in the material in the velocity range 10 to 5000 mm/s, which is attributed to material strain rate sensitivity.
The modelling study has established the essential model input requirements to validate material strain rate sensitivity data for use in crash simulation tools. The quality of model fit to experimental result is dependent on mesh resolution, especially at corner radius together with element type. For the three validation metrics considered e.g. peak force, total energy at 10 mm and 50 mm displacements, the best model fit is variant A with type 16 element; this mesh uses a 2.5 mm element size and 5 corner elements (~ 1 mm); typical error of the order of a few percent for all three validation metrics. Although element type 2 together with 5 mm element size and 3 corner elements (~ 2 mm) gives a similar level of error. Type 2 elements however, are prone to hourglassing and this will affect local model property measurements such as strain and strain rate. Generally increasing element size delivered an increasingly stiffer response. Of particular interest are model variants C and D, respectively one corner element at 45 degree and two corner elements (each 3.5 mm) at 90 degree. The 45 degree corner element model is a poor fit to the experimental result, giving an error of the order ten percent for two of the validation metrics. The 90 degree corner element model is a very poor fit, giving an error of the order tens of percent for all three validation metrics.
6th European LS-DYNA Users’ Conference
2.2.1 2.45
Acknowledgements: To thank Mike Bloomfield for his assistance in setting up and running models at Jaguar and Land Rover. To thank the industrial partners CORUS AUTOMOTIVE, RICARDO, ARRK and MIRA, in addition to those named authors and companies, for supporting and engaging in this collaborative research project.
REFERENCES
1. http://www.worldautosteel.org/pdf_hsrt/RptRndRobResults.pdf
2. BS EN 10002-1:2001 (low speed tensile testing of metallic materials and mechanical property characterisation)
3. VHS 160/100-20 High Strain Rate Test System and Accessories, Instron Ltd, Coronation Rd, High Wycombe, Bucks, England
4. Murphy J. F. “Transverse Vibration of a Simply Supported Beam with Symmetric Overhang of Arbitrary Length,” Journal of Testing and Evaluation, JTEVA, Vol.25, No. 5, September 1997, pp. 522-524
5. P.K.C.Wood et. al., “An Improved Test Procedure for Measurement of Dynamic Tensile Mechanical Properties of Automotive Sheet Steels,” SAE International 2007-01-0987, Detroit, April 2007.
6. Hallquist, J. O., LS-DYNA. Keyword User’s Manual. Version 971, Livermore Software Technology Corporation, Livermore, 2007.
7. OASYS LS-DYNA ENVIRONMENT, The Arup Campus, Blythe Valley Park, Solihull, West Midlands, B90 8AE

6th European LS-DYNA Users’ Conference
2.46 2.2.1