v. environmental scan - antelope valley college · avc emp- ch. v. a. environ scan external draft...
TRANSCRIPT

AVC EMP- Ch. V. A. Environ Scan External draft 121015.docx Working Paper Draft
Working Paper Draft 11
V.EnvironmentalScan
A.ScanofConditionsExternaltotheCollege The College in Context to its Environment The official Antelope Valley Community College District boundaries cover some 1,945 square miles of semiarid land located north of the San Gabriel Mountains that separate the Antelope Valley from the Los Angeles basin and southeast of the Tehachapi Mountains that define the southern border of the San Joaquin Valley. The District represents 40 percent of the land within Los Angeles County plus a small portion of the southwestern part of Kern County. The District consists of two campus locations. The main College campus is located in Lancaster on 135 acres at 3041 W. Ave. K. A second site is located on the third floor of 1529 E. Palmdale Avenue at 15th Street East in Palmdale. The two principle cities in the Antelope Valley region are Lancaster and Palmdale. Over eighty percent of the Antelope Valley population resides in the two cities. Distances from the main campus location to neighboring community colleges are found in Appendix A. Economy and Employment The California economy is expected to continue its expansion and growth. State revenue has been greater than projections in 2014 or 2015. The Legislative Analyst’s Office estimated that the State would likely receive another $3.6 billion more revenue in 2015-16 than the Governor had predicted.1 For K-14 public education the adverse economic circumstances of the Great Recession seem to have come to a conclusion. Although the State economy appears to be on the mend and unemployment levels continue to diminish, a recent report from the Public Policy Institute of California (PPIC) observed that if recent trends in higher education and the economy were to continue, by 2025 the State is likely to face a greater shortage of workers who have some college education but less than a bachelor’s degree. Their projections are that the shortfall of workers with some college education may be as high as 1.4 million, even larger than the projected one-million-worker shortage of college graduates with a bachelor’s degree.2 The analysis affirms that training beyond high school has become increasingly valuable in the labor market. The State’s economic upturn has been slow to reach the Antelope Valley where the key industrial clusters of logistics, construction and manufacturing were particularly hit hard in the downturn. The subprime mortgage crisis and related wave of foreclosures and collapsing home prices only added to the misery. At its worst, residents living in the cities of Lancaster and Palmdale witnessed over 7,300 foreclosures in 2008. For much of
1 Jim Miller. “Legislative Analyst Predicts California Revenue Will Exceed Revised Budget Estimate by $3 Billion,” Sacramento Bee. May 18, 2015 2 Sarah Bohn, “California’s Need for Skilled Workers,” Public Policy Institute of California, September 2014 and “California’s Future-Higher Education.” February 2015.

AVC EMP- Ch. V. A. Environ Scan External draft 121015.docx Working Paper Draft
Working Paper Draft 12
the period from 2008 to 2013 much of the Antelope Valley region was declared a Labor Surplus Area (LSA) by the U.S. Department of Labor. The average unemployment rate was at least 20% higher than the national unemployment rate for a period of two calendar years.3 But, the future is looking brighter. Between 2012 and 2022 the California Employment Development Department (EDD) projects a 12.8% increase in jobs in Los Angeles County. Twelve of the thirteen non-farm industrial sectors will contribute to that growth. The greatest growth is concentrated in four industrial sectors: (1) educational services (private), health care, and social assistance; (2) professional and business services; (3) leisure and hospitality; and (4) retail trade. The following table documents the projections in Los Angeles County for employment opportunities by industry category. Table __: Los Angeles County Projected Job Openings by Industry
Source: California Employment Development Department, Labor Market Information; analysis by Cambridge West Partnership, LLC The greater Antelope Valley region, east of the Tehachapi Mountains into the southeastern portion of Kern County up to Ridgecrest, has long been recognized for aerospace manufacturing, defense industry, and research and development. It seeks to become known for developing advanced materials, building clean transportation, crafting high-precision parts, generating fresh, green energy and adding value to innovative agricultural products.4 A comprehensive assessment of the regional labor market and
3 Meeta Goel and Svetlana Deplazes, Department of Institutional Effectiveness, Research, and Planning, Antelope Valley College. 2014 Antelope Valley Labor Market Study. Greater Antelope Valley Economic Alliance; Southern California Association of Governments. 2015 Local Profiles Reports- Cities of Lancaster and Palmdale. May 2015. 4 Greater Antelope Valley Economic Alliance. 2015 Economic Roundtable Report
North American Industry Classification System (NAICS) Categories
Employment Change 2012
to 2022Annual Job
OpeningsPercent Change
Annual Average %
ChangeSelf Employed 23,900 2,390 8.4% 0.84%Unpaid Family & Private Household 300 30 -1.5% -0.15%Farm 300 30 5.6% 0.56%Mining and Logging 400 40 9.3% 0.93%Construction 32,900 3,290 30.2% 3.02%Manufacturing -52,000 -5,200 -14.2% -1.42%Trade, Transportation, Utilities 97,000 9,700 12.7% 1.27%Information 20,300 2,030 10.6% 1.06%Financial Activities 15,500 1,550 7.4% 0.74%Professional & Business Services 105,900 10,590 18.6% 1.86%Education (Private), Health Care, & Social Assistance 191,300 19,130 28.4% 2.84%Leisure and Hospitality 80,600 8,060 19.4% 1.94%Other Services 16,300 1,630 11.5% 1.15%Government 20,800 2,080 3.7% 0.37%
Total 553,500 55,350 12.8% 1.28%

AVC EMP- Ch. V. A. Environ Scan External draft 121015.docx Working Paper Draft
Working Paper Draft 13
economy can be found in the 2014 Antelope Valley Labor Market Study.5 A listing of major employers in the greater Antelope Valley region is found in Appendix B. The workforce, by industry, in the more immediate area served by the College is described in the following two tables. The tables account for 233,516 working adults in the workforce who are age 16 or older. Table __: Antelope Valley College Effective Service Area 2015 Employment by Industry
Source: Environmental Systems Research Institute, Market Profile, 2015; analysis by Cambridge West Partnership, LLC
5 Meeta Goel and Svetlana Deplazes, Department of Institutional Effectiveness, Research, and Planning, Antelope Valley College. 2014 Antelope Valley Labor Market Study. Greater Antelope Valley Economic Alliance.
North American Industry Classification System (NAICS) Category
% Employed
Agriculture/Mining 1.3%Construction 7.4%Manufacturing 10.9%Wholesale Trade 2.1%Retail Trade 12.3%Transportation/Utilities 5.1%Information 3.0%Finance/Insurance/Real Estate 5.1%Other Services 45.2%Public Administration 7.6%
AVC EMP- Ch. V. A. Environ Scan External draft 121015.docx Working Paper Draft
Working Paper Draft 14
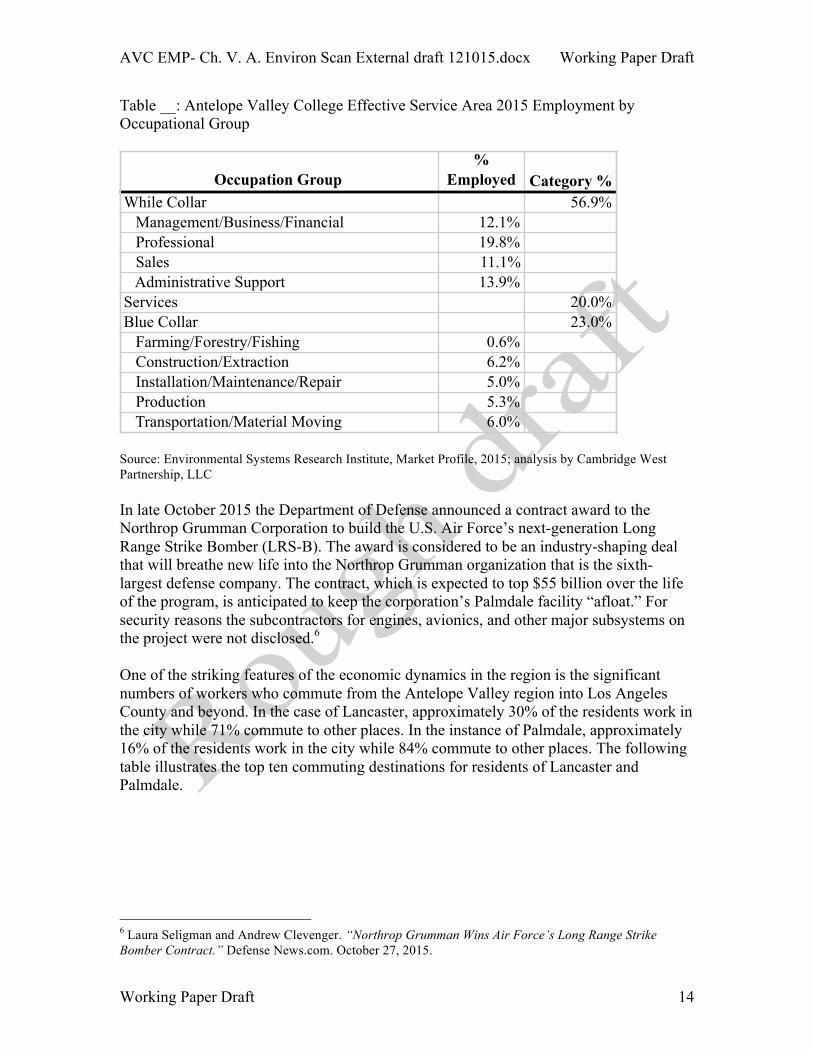
Table __: Antelope Valley College Effective Service Area 2015 Employment by Occupational Group
Source: Environmental Systems Research Institute, Market Profile, 2015; analysis by Cambridge West Partnership, LLC In late October 2015 the Department of Defense announced a contract award to the Northrop Grumman Corporation to build the U.S. Air Force’s next-generation Long Range Strike Bomber (LRS-B). The award is considered to be an industry-shaping deal that will breathe new life into the Northrop Grumman organization that is the sixth-largest defense company. The contract, which is expected to top $55 billion over the life of the program, is anticipated to keep the corporation’s Palmdale facility “afloat.” For security reasons the subcontractors for engines, avionics, and other major subsystems on the project were not disclosed.6 One of the striking features of the economic dynamics in the region is the significant numbers of workers who commute from the Antelope Valley region into Los Angeles County and beyond. In the case of Lancaster, approximately 30% of the residents work in the city while 71% commute to other places. In the instance of Palmdale, approximately 16% of the residents work in the city while 84% commute to other places. The following table illustrates the top ten commuting destinations for residents of Lancaster and Palmdale.
6 Laura Seligman and Andrew Clevenger. “Northrop Grumman Wins Air Force’s Long Range Strike Bomber Contract.” Defense News.com. October 27, 2015.
Occupation Group%
Employed Category %While Collar 56.9% Management/Business/Financial 12.1% Professional 19.8% Sales 11.1% Administrative Support 13.9%Services 20.0%Blue Collar 23.0% Farming/Forestry/Fishing 0.6% Construction/Extraction 6.2% Installation/Maintenance/Repair 5.0% Production 5.3% Transportation/Material Moving 6.0%

AVC EMP- Ch. V. A. Environ Scan External draft 121015.docx Working Paper Draft
Working Paper Draft 15
Table __: Top Ten Commuting Destinations, 2011
Source: U.S. Census Bureau, 2014, Longitudinal-Employer Household Dynamics Program, LODES Data, 2011 as cited in the Southern California Association of Governments. 2015 Local Profiles Reports- Cities of Lancaster and Palmdale. May 2015. Much of the Antelope Valley falls within the jurisdiction of Los Angeles County. The Board of Supervisors approved an Antelope Valley Area Plan for the long-term development of the region in June 2016. The plan excludes the cities of Lancaster and Palmdale. It seeks to preserve the rural character of the region while fostering rural town centers and areas of economic opportunity along two proposed major transportation corridors. The first proposed corridor is a high desert multi-purpose transportation link between state roads 14 and 18 to connect Lancaster to the town of Apple Valley through Palmdale, Adelanto and Victorville. The second proposed corridor is a substantial upgrade to state route 138 between Interstate 5 and state route 14. Although it is not operational at this time, the Palmdale Airport is envisioned to become a regional commercial facility. Until the airport is developed, the Area Plan calls for industrial and commercial development on land that would not conflict with the eventual airport development. The east valley areas of economic opportunity are described in the Area Plan as being along the high desert corridor in the existing communities of Lake Los Angeles, Sun Village, Littlerock, Pearblossom, Llano, and Crystalaire. The central valley, north of Fox Air Field along Avenue D and state route 14, is the site of the second economic opportunity area. The third economic opportunity area is found along the state route 138 upgrade in the west valley where a very large master-planned housing development is proposed. The Area Plan acknowledges that this portion of the valley will need a specific
Jurisdiction # Commuters% of Total
Commuters#
Commuters% of Total
CommutersLancaster 11,608 29.16% 4,950 11.76%Los Angeles 8,575 21.54% 12,221 29.03%Palmdale 3,886 9.76% 6,583 15.64%Burbank 1,643 4.13% 1,586 3.77%Santa Clarita 1,089 2.74% 1,952 4.64%Glendale 415 1.04% 563 1.34%Simi Valley 409 1.03% 402 0.96%Long Beach 415 0.99%Pasadena 391 0.93%El Segundo 406 1.02%Unincorporated 391 0.98%San Diego 347 0.87% 386 0.92%All Other Jurisdictions 11,033 27.72% 12,642 30.03%
Total 39,802 42,091
Lancaster Palmdale
AVC EMP- Ch. V. A. Environ Scan External draft 121015.docx Working Paper Draft
Working Paper Draft 16
sub-area development plan.7 However, the environmental group, Center for Biological Diversity, filed a lawsuit to block the implementation of the Area Plan. The Center has concerns about the environmental impact from the large master-planned housing development proposal which the Tejon Ranch Company has suggested would eventually create a 20,000-home community called Centennial along the Los Angeles and Kern County line.8 Apart from the mobility, land use, conservation, and open space elements of the Antelope Valley Area Plan, the Los Angeles County Department of Regional Planning and the Greater Antelope Valley Economic Alliance, a public-private partnership dedicated to facilitating economic growth in the region, are promoting economic development in the following focused areas:
• High-tech manufacturing • Transportation and logistics • Agriculture • Renewable energy • Construction and housing • Recreation, tourism, filmmaking
One of their major goals is to improve the jobs and housing ratio in an effort to curtail the volume of home-to-work commuting noted earlier. Implications for the College
1. Future job opportunities, economic growth in construction, and health care/social assistance industries, plus a much improved real estate market with affordable housing characterize the future of the region. The College can contribute to the economy of the region by preparing students for transfer to four-year institutions and by equipping with the job skills in demand those students who want to “transfer to the workplace” upon completing a certificate or Associate Degree.
2. Reasonable employment opportunities in several industry categories (trade, transportation, utilities; professional and business services; health care and social assistance; leisure and hospitality; and construction) are projected to continue into the future. Although entry-level preparation for many jobs in some of these industries commonly does not require education beyond high school, there may openings for which the College needs to prepare individuals with career and technical certificates and Associate Degrees.
3. The distinctive mix of advanced manufacturing and research and development employers in the region places a premium on Science, Technology, Engineering, Mathematics, and Medicine (STEMM) fields of study. The College has well-established programs of study in these disciplines but will be called upon to increase the numbers of graduates.
7 Los Angeles County Department of Regional Planning. Antelope Valley Area Plan: Town and Country. June 2015. 8 Leon Worden. “Los Angeles County Sued Over Antelope Valley Growth Plan.” Santa Clarita Valley News. July 17, 2015.

AVC EMP- Ch. V. A. Environ Scan External draft 121015.docx Working Paper Draft
Working Paper Draft 17
Higher Education Policy Several key policy decisions will influence the California Community College system in the coming years. These public policies both provide opportunities for the colleges but in some cases impose constraints. The Completion Agenda In July 2009, President Obama articulated that the American Graduation Initiative (AGI) has a goal of increasing the percentage of U.S. residents who earn high quality degrees and credentials from the present rate of 39 percent to a rate of 60 percent by the year 2025. The goal is to make the U.S. competitive in the global marketplace. In the private sector, employers have been increasingly screening applicants for employment by requiring college degrees for positions that previously did not require a degree.9 While President Obama has pushed to increase college graduation rates across the nation, Complete College America, a non-profit organization, was formed to advance this mission. It has enlisted support from leaders in 34 states to ensure greater numbers of students acquire degrees. The President’s challenge to the nation has not been ignored in California. The Community College League of California (CCLC) launched an “alternative futures” project, 2020 Vision for Student Success, to respond to the national graduation goal by identifying policy and practice changes that could be implemented to increase student achievement. To contribute its part toward achieving the national graduation goal, California needs to produce a total of 1,065,000 degrees or certificates per year to 2025. That translates to producing an additional 23,000 degrees and certificates per year, a 5.2% annual increase.10 In August, 2014, the Board of Governors for the California community college system joined in the completion effort by announcing a goal to increase the numbers of students earning certificates, degrees, or transferring to four-year institutions by nearly a quarter of a million over the next ten years. For academic year 2013-14 the system awarded 190,314 certificates and degrees, a 40 percent increase from 2009-10 and an all-time high for the system. The Gates, Ford, Lumina, and Kellogg Foundations as well as the Carnegie Corporation of New York fund their collective work and the efforts of others to promote more college graduates. Collectively, there are more than two-dozen major entities that have sponsored initiatives to promote college completion.11 Federal Policy and Funding Initiatives The White House convened a series of higher education summits in order to promote change in higher education policy and practice. Attention was given to greater access, 9 Doug Lederman. “Credential Creep Confirmed” Inside Higher Education. September 9, 2014; Karin Fischer. “A College Degree Sorts Job Applicants, but Employers Wish It Meant More,” Chronicle of Higher Education. March 8, 2013 p. 26-29 10 2020 Vision: A Report of the Commission on the Future, (Sacramento, CA: Community College League of California, 2010) 11 Alene Russell. “A Guide to Major U.S. College Completion Initiatives,” American Association of State Colleges and Universities, October 2011.

AVC EMP- Ch. V. A. Environ Scan External draft 121015.docx Working Paper Draft
Working Paper Draft 18
particularly for low-income students, the completion agenda, college outcome performance measures, constraints to the ever-rising costs of high education, and other topics of interest to the federal government. To encourage more participation in postsecondary education the President used his 2015 state of the union address to offer a proposal, along the lines of the current policy in Tennessee, that the federal government help each state to make attendance at a community college free of tuition. While it has been announced that some new federal resources will be allocated for use by community colleges, the Congress is currently also struggling to restrain spending and to reduce debt levels. The long-term impact remains to be seen, but federal aid now has a lifetime limit and is also limited to a maximum number of credit hours represented by 150% of the credits required for the program of study the student is pursuing. For a community college associate degree 150% would equate to 90-semester credit hours. Veterans on the G.I. Education Bill may be more limited in the credit hours funded by that program. In the FY2016 budget the President proposed that the maximum award under the Pell Grant program would increase and new rules would require students to make progress in their programs by passing an increasing percentage of their total course load. President Obama has signed an executive order to align the monthly repayment rate of federal loans to the level of future wages earned by the student. That may ease the burden of debt for students and make the act of borrowing for a college education more feasible for prospective students. The President has also declared a policy to not enforce deportation on children of illegal immigrants meeting certain conditions and to provide work permits for those children. The Obama administration and the U.S. Department of Education have announced a new emphasis for their involvement with career and technical education through a transformation of the Carl D. Perkins Career and Technical Education Act of 2006 as it comes due for renewal. Although the Act has not yet been renewed, the desired new directions will promote greater alignment between CTE programs and labor market needs as well as collaboration with K-12 and employers. Differences in the current provisions of the Perkins Act and the proposed changes were announced as long ago as April 2012.12 In July 2014 the Congress enacted the Workforce Innovation and Opportunity Act (WIOA) by a wide bipartisan majority as the first legislative reform in 15 years of the public workforce system. This legislation took effect on July 1, 2015 with regulatory rules to be written by the Departments of Labor (DOL), Education (DOE), and Health and Human Services (HHS). In general, the legislation focuses on streamlining programs, reporting, and administration and eliminates 15 existing federal training programs. WIOA keeps the basic structure of the prior legislation with components covering occupational training, adult basic education, literacy and English language acquisition, vocational rehabilitation, and the national system of public employment offices and services. Key features and opportunities of the WIOA legislation include more unified planning between state and local authorities to address regional labor markets, a common set of
12 U.S. Department of Education, Office of Vocational and Adult Education. Investing in America’s Future: A Blueprint for Transforming Career and Technical Education. April 2012.

AVC EMP- Ch. V. A. Environ Scan External draft 121015.docx Working Paper Draft
Working Paper Draft 19
performance measures, and promotion of best practices including contextualized adult basic education, ESL, and attainment of industry-recognized certificates. The Congress passed the Higher Education Opportunities Act in 2008. Subsequently, a series of new federal regulations have been issued to improve program integrity where Title IV financial aid funds are involved. Regional accrediting bodies are now expected to provide closer scrutiny of member institutions on a range of new topics. Regional Accreditation Initiatives In part, stimulated by prior federal government actions, regional accrediting bodies are insisting that greater attention be given to student learning outcomes. These new areas are in addition to the traditional goals of accreditation that are:
1. Providing assurance to the public that the education provided by the institution meets acceptable levels of quality
2. Promoting continuous institutional improvement 3. Maintaining the high quality of higher education institutions in the region
Implementation of the new 2014 accreditation standards has introduced a number of changes, including the requirement to create a quality focus essay to guide future improvement efforts. 13 The changes also echoe some of the national discussions about educational quality and accreditation. California Community College Initiatives for Student Success The following State initiatives are intended to increase student success rates:
• The Board of Governors’ basic skills initiative seeks to enable more students to overcome their academic deficiencies.
• Additional legislation, SB1440 Student Transfer Achievement Reform or STAR Act in 2010, simplified the process of transferring from a community college to a school in the California State University (CSU) system. This program provides a pathway for students to follow so that they can be admitted to a CSU with junior status. It has been complemented by SB440 in 2013, which further incentivizes transfer students to complete an associate degree.
Perhaps the most potentially far-reaching set of recommendations for change in policy and practice were included in the report from the California Community College Chancellor’s Office Student Success Task Force. The group proposed eight areas of focus with 22 recommendations. The Legislature passed the Student Success Act (SB 1456) in August 2012 and the governor signed it shortly thereafter. The measure did the following:
• Commissioned the development of a uniform placement exam for students; • Directed colleges to provide students with orientation, assessment, placement and
counseling services;
13 Accrediting Commission for Community and Junior Colleges. Preparing for A Comprehensive Visit. Workshop materials presented on October 15, 2014.

AVC EMP- Ch. V. A. Environ Scan External draft 121015.docx Working Paper Draft
Working Paper Draft 20
• Required students to identify an educational goal (such as degree or certificate for transfer to a four-year university) and complete an educational plan;
• Required colleges that receive student support service funds to complete and post a student success scorecard showing how well the campus is doing in improving completion rates, especially by race, ethnicity, gender, and income;
• Established minimum academic progress standards for students to receive Board of Governors fee waivers, but also developed an appeal process.
The Task Force recommendations came in the wake of a severe shortfall in resources for California’s public higher education institutions. Therefore, implementation of these ideas was delayed. Funds allocated for 2015-16 now enable the Chancellor’s Office to provide support to colleges that develop a student success and support plan (formerly matriculation) built around some of the recommendations arising from the Student Success Task Force. The provision of effective core services (orientation, assessment and placement, counseling, academic advising, and early intervention or follow-up for at-risk students) has been found to improve students’ ability promptly to define their educational and career goals, complete more of their courses, persist to the next term and achieve their educational objectives in a timely manner.14 As new priority enrollment rules were made effective in fall 2014, one of the incentives for students to complete the core services is the potential loss of priority enrollment or withholding of an enrollment opportunity. One Student Success Task Force recommendation was the development of a robust common assessment instrument. The assessment services will also include data collection and course placement guidance, but the placement cut scores will remain a local decision. Working groups of faculty from the disciplines of English, Math and ESL have been involved in drafting competencies that address the full range of prerequisite skills found in the curriculum. The common assessment initiative has a “go live” target of the 2016-17 academic year, pending a successful pilot experience. The effort to exploit technology to support student success blossomed into the Educational Planning Initiative that was launched to help colleges meet the requirements for student success and support program funding by providing an individual comprehensive educational plan for all students. The initiative is also intended to enhance the counseling experience by inducing students to take more responsibility for their educational program plans and to have counseling expertise used only to verify the planning. A degree audit system to provide transcript, articulation and curriculum inventory elements is to be provided to help both students and counselors. As a by-product, it is hoped that the numbers of unnecessary units accumulated by students will be reduced. A single sign-on portal is intended to be the student’s point of access to this system that is described as a service-oriented experience in which some existing services will be complemented by new services yet to be produced. The project has a “go live” target of the 2015-16 academic year, pending a successful pilot experience. 14 Eva Schiorring and Rogeair Purnell. Literature Review Brief: What We Know About Student Support 2nd Ed. Research and Planning Group of the California Community Colleges. Fall 2012.

AVC EMP- Ch. V. A. Environ Scan External draft 121015.docx Working Paper Draft
Working Paper Draft 21
The legislation implementing some of the recommendations of the Student Success Task Force, SB 1456, requires the coordination of student equity plans and student success and support programs. Student equity identifies groups of students needing more help and focuses on services and instruction for new and continuing students through to completion whereas student success and support programs focus on services for entering students and identifies individual students who need more help. Interest in student equity is not new as the Board of Governors adopted a student equity policy in 1992, but financial support for planning and interventions has not always been available or adequate. In 2014 the Legislature appropriated $70 million for student equity purposes, added foster youth, veterans, and low-income students as target populations, and required specific goals and activities to address disparities and coordination of them with other categorical programs. The traditional populations or variables researched for student equity planning are: age, disability status, gender and ethnicity. Unlike the student success and support program funding, dollars for student equity interventions do not require a match of funds or in-kind effort from the colleges. Funding for both efforts was increased for 2015-16 after the May 2015 budget revision. The governor’s interest in online education garnered an appropriation of $56.9 million over 55 months to launch the Online Education Initiative for the community colleges. The initiative is intended to increase access to more online courses created by community college faculty members and to provide students well-designed resources that will improve their chances of a successful learning experience. Part of the work in this initiative is to improve student readiness to engage in the learning experience through online instruction and to provide tutoring support for those students. Those two components have had a successful pilot project “go live” in spring 2015. A common course management system launched among the pilot colleges in fall 2015. Within the initiative are efforts to assist faculty in several professional development ways- creating of online course content, teaching strategies for the online environment, course design standards, and course review training. Adult Education Initiative The governor’s initial proposal for the adult education programs to be absorbed into the community colleges met with stiff opposition in the Legislature. A compromise was fashioned to improve and expand the provision of adult education through regional consortia that would eliminate redundancy and craft pathways into higher education for interested students. Instruction in parenting, home economics and classes for older adults were explicitly excluded from this funding. The 2015 AB104 legislation provided a block grant of funds to support action plans to close gaps for adult learners in four areas: (1) elementary and secondary basic skills; (2) ESL and citizenship for immigrant populations; (3) adults with disabilities; and (4) short-term career and technical education. Career and Technical Education Initiatives In 2012 the Legislature passed SB 1402 which the Governor signed to signal intent to recast and rewrite the economic and workforce education division programs and services.

AVC EMP- Ch. V. A. Environ Scan External draft 121015.docx Working Paper Draft
Working Paper Draft 22
The new direction implements industry sector strategies that align with labor markets on a regional basis and to do so in a collaborative fashion. The Chancellor’s Office has translated these policy directions into a four-part initiative called Doing What Matters (DWM) for Jobs and the Economy. The colleges in the Los Angeles consortium as a whole selected the three priority sectors or clusters and two emerging sectors as described in the table below. Table __: Los Angeles Consortium Priority Sector Choices
Source: California Community Colleges, Los Angeles Regional Consortium. Extracted from doingwhatmatters.cccco.edu/ResourceMap/Los Angeles The initial phase of DWM was designed to dovetail with the State Workforce Plan created by the California Workforce Investment Board. Some funding from the DWM initiative was awarded to the regions to enhance existing CTE programs and to support regional collaborative work. The second phase of this initiative applies common accountability metrics to gauge the extent to which the efforts have “moved the needle.” A system of common metrics was then developed that includes student momentum points and leading indicators of success. A third phase promotes bringing innovation and best practices to scale. The overriding message of the DWM initiative is to prompt collaborative action within regions to prepare students for work in critical industry sectors. The 2014-15 State budget provided a one-time pool of $50 million that helped the DWM initiative incentivize the colleges to develop, enhance, retool, and expand CTE offerings in response to regional labor market needs and to stimulate additional regional collaboration. In 2013 SB 1070 (California Partnership Academies) was enacted to establish an economic and workforce development program for the community colleges. It requires the Board of Governors, Chancellor’s Office staff and the colleges to assist economic and workforce regional development centers and consortia to improve, among other things, career-technical education pathways between high schools and community colleges. Contracts and competitive grants funded by the program through 2015 were jointly administered to improve linkages and CTE pathways between high schools and community colleges.
Priority Sectors/ClustersAdvanced ManufacturingAdvanced Transportation & RenewablesHealth
Emergent Sectors/ClustersEnergy (Efficiency) & UtilitiesInformation & Communications Technologies (ICT)/Digital Media

AVC EMP- Ch. V. A. Environ Scan External draft 121015.docx Working Paper Draft
Working Paper Draft 23
Additional efforts to promote career pathways from high schools to the community colleges were enshrined in the 2014-15 budget as it passed the California Career Pathways Trust Act. Some $250 million was provided in the form of one-time competitive grants. These funds were made available to school districts, county superintendents of schools, directly-funded charter schools, regional occupational centers or programs operated by a joint powers authority, and community college districts. The Legislature allocated a second round of funding for the Trust with applications for competitive grants to be implemented in academic years 2015-16 and 2016-17. The most recent legislation to promote collaboration, AB 288, signed into law on October 8, 2015, authorizes the governance board of a community college district to enter into a College and Career Access Pathways (CCAP) partnership with the governing board of a school district to offer or expand dual enrollment opportunities for students who may not already be college bound or are from underrepresented groups in higher education. The goal is to develop a seamless pathway from high school to community college for career-technical education or preparation for transfer, improving high school graduation rates, or helping high school students achieve college and career readiness. Inmate Education Initiative Senate Bill 1391, Hancock, which became law in September 2014 made a number of changes to rules that apply to inmate education. The Hancock bill permanently waived the open course provisions for inmates in state correctional facilities. Previously districts offering inmate education had to accept funding at the noncredit rate, regardless of the nature of the course of instruction. SB1391 revised that method of compensation to allow an apportionment claim at the corresponding funding rate for credit and CDCP noncredit instruction and relieved the districts from using only positive attendance procedure to keep track of instructional time. The legislation further required an interagency agreement between the Chancellor’s Office and the Department of Corrections. Approved in January 2015, funds for pilot projects to expand access to courses that lead to degrees and certificates were created. That pilot project identified re-entry hub correctional facilities where community colleges with one of those institutions in its district could seek one-time funding for program development and implementation of inmate education geared toward improving inmates’ ability to find employment upon release and to reduce recidivism. The emphasis was upon face-to-face instruction, rigorous assessment, and student services. Four colleges (Lassen, Chaffey, Antelope Valley, and Folsom Lake) were granted a one-year award. Antelope Valley has had a long-standing relationship to the California State Prison of Los Angeles County, located in Lancaster. Although they are not higher education policy topics, the State of California has made a number of changes to it policies and practices pertaining to corrections institutions, those incarcerated, and those accused of criminal wrong doing. The policy changes to reduce the State prison population noted below may have implications for future enrollments from incarcerated individuals.
AVC EMP- Ch. V. A. Environ Scan External draft 121015.docx Working Paper Draft
Working Paper Draft 24
Dual Enrollment The most recent legislation to promote collaboration, AB 288, signed into law on October 8, 2015 to take effect in January 2016, authorizes the governing board of a community college district to enter into a College and Career Access Pathways (CCAP) partnership with the governing board of a school district. The partnerships are to offer or expand dual enrollment opportunities for students who may not already be college bound or are from groups underrepresented in higher education. The goal is to develop a seamless pathway from high school to community college for career-technical education or preparation for transfer, improving high school graduation rates, or helping high school students achieve college and career readiness. The following are the highlights of the legislation:
• Community colleges can assign priority enrollment and registration to high school students in a CCAP with no fees to pay;
• Courses during the regular high school day can be restricted to high school students and do not have to meet the normal open enrollment standard;
• Courses with no open seats on campus cannot be offered at high schools through the CCAP;
• Basic skills math and English can be offered through CCAP but only for students who are not at grade level in that subject; and
• Community colleges can claim FTES if the high school student is qualified for full high school apportionment without using hours of the college course.
New Growth Funding Formula Apart from targeted funds described above, the SB 860 legislation from 2014 will impact the allocation of apportionment funds for growth to the districts by using a new formula starting in 2015-16. The legislation directed that growth would be based on each community’s need for access to their community college as determined by local demographics. Need within each district’s official boundaries is to be determined by these primary factors: number of people within each district who are without a college degree, and the number of individuals who are disadvantaged as evidenced by unemployment and measures of poverty.15 The AVCCD is projected to have a constrained apportionment growth rate of 2.76% The General Neighborhood The policies and priorities discussed above impact colleges differently. The Antelope Valley CCD is not the only opportunity for a postsecondary education experience open to California residents of this region. The geography of the Tehachapi Mountains to the north and the San Gabriel Mountains to the south create some natural barriers that both help to form the Antelope Valley and also make the College somewhat isolated. The nearest community college facilities are presently extension operations. To the south, Canyon Country Campus, located in Santa Clarita, is well along in its development as a potential second institution for the College of the Canyons. To the north and east, Cerro Coso College operates through four high schools (California City, Tehachapi, Monroe, 15 Day Toy, Vice Chancellor for Finance. “Growth Funding Allocation Formula,” Consultation Digest. November 20, 2014. “California Community Colleges Growth Funding Allocation Model” power point presentation to the Association of Chief Business Officers Conference. October 27, 2014.

AVC EMP- Ch. V. A. Environ Scan External draft 121015.docx Working Paper Draft
Working Paper Draft 25
and a small building on Edwards Air Force Base. The College has a partnership with Cerro Coso College to collaboratively serve the residents of southeastern Kern County. The table below lists the community colleges that are in “close proximity” to the AVCCD. Table__: Public Community Colleges Around the Antelope Valley Community College District
Source: California Community College Chancellor’s Office Implications for the Colleges:
1. A broad array of governmental and private organizations is promoting the urgency for postsecondary institutions to produce more graduates. It has been estimated that the State economy will be short in excess of two million graduates with a bachelor’s degree or postsecondary education short of the bachelor’s degree by 2025. As a public agency the College should embrace that public agenda with vigor.
2. As the federal government seeks to achieve a more balanced budget there is still financial support for students and incentives for institutions to increase student success and prepare more students to compete in a global economy. However, these incentives come with performance expectations. The College may have opportunities to enhance resources and they should act upon those opportunities.
3. The regional accrediting commission, ACCJC, is following federal direction with requirements it has imposed on member institutions. Recent state legislation intended to induce intentionality into institutional planning and to hold public colleges accountable for performance on state priorities are in a similar spirit to the accreditation expectations. Attention should be given to tracking student achievement and learning performance and acting upon areas were performance does not meet ACCJC expectations.
4. Starting three years ago State legislation (SB 1440) created a remarkable framework to facilitate transfer to a campus within the California State University (CSU). Community college and CSU faculty throughout the state have risen to the occasion to forge transfer model curriculums (TMCs).
Institution City Drive Time* Miles*College of the Canyons Canyon Country Campus Santa Clarita 49 min. 42Cerro Coso College East Kern Center Edwards AFB Edwards AFB 47 min. 32 Tehachapi Ed Center Tehachapi 48 min. 48
*Google Maps, AVC Lancaster campus to these other college locations.

AVC EMP- Ch. V. A. Environ Scan External draft 121015.docx Working Paper Draft
Working Paper Draft 26
Antelope Valley College achieved its expected target, but there may be more that could be done to facilitate transfer.
5. Particular state attention has been given to re-crafting matriculation and other student services along the lines of recommendations from the Student Success Task Force. Although matching funds are required, attention must be given to student success concerns. Participating institutions will be required to use a common placement assessment instrument when it is developed if funds are accepted. The College has a series of opportunities to improve services and student success by participating in these new state programs.
6. A serious revisiting of online instruction as a delivery mode is being funded in the State. While the College has been building an array of online classes, the online education initiative is a promising opportunity in which the College should consider participating.
7. Adult education has long been neglected as a public service in the state. The AB86/Adult Education Block Grant AB104 legislation provides fresh funding to promote regional cooperation and elimination of redundancy with incentives to focus the instruction on preparing vulnerable citizens for more effective participation in the workforce. This legislation, combined with the promise to raise the funding level for selective noncredit curriculum to equal the level of credit instruction starting in FY 2015-16, presents a unique opportunity to make a very substantial difference in the service area. The College should grasp the opportunity to implement the planning work done by the regional consortium.
8. Several opportunities are unfolding for career and technical education both within and outside of the Doing What Matters for Jobs and the Economy initiative from the Chancellor’s Office. Several dedicated funding sources are promoting inter-segmental cooperation and regional approaches to this type of instruction. The College should position itself to fully engage the various opportunities in this curriculum.

AVC EMP- Ch. V. A. Environ Scan External draft 121015.docx Working Paper Draft
Working Paper Draft 27
Population Served: AVCCD Effective Service Area Within Los Angeles and Kern Counties, the official boundaries of the AVCCD include the zip code areas described in this graphic. Chart__: Official AVCCD District Boundaries
Source: AVCCD Institutional Effectiveness, Research, and Planning Office Geographically, the District covers 1,945 square miles. In 2010 the area population numbered approximately 420,000 people. The estimate for 2015 was roughly 437,000. The official District service area population is projected to become approximately 453,200 by 2020. Of the nineteen zip codes, five zip codes largely overlap into the services areas of adjacent community college districts (Kern, Pasadena, College of the Canyons, and Citrus). Those zip codes were excluded from the definition of the official service area. Two additional zip codes are largely within the AVCCD official area but small portions are shared with College of the Canyons and the Kern District. Those two zip codes were included in the geographic definition.

AVC EMP- Ch. V. A. Environ Scan External draft 121015.docx Working Paper Draft
Working Paper Draft 28
Effective Service Area Based upon an analysis of residential zip codes reported by enrolled students over the last five fall terms, the effective service area for Antelope Valley College encompasses 27 zip codes. Individuals from these zip codes account for 98% of the students participating at the College in the fall terms from 2010 to 2014. Ninety-five percent of the student headcount comes from the zip codes that are inside the official District area. Table __: Antelope Valley College, In-District vs. Outside-District Origination
Source: California Community College Chancellor’s Office, MIS Referential Files; analysis by Cambridge West Partnership, LLC
Category 2010 2011 2012 2013 2014 5-Yr Total% In-District 95% 97% 97% 97% 97% 95%% Outside-District 5% 3% 3% 3% 3% 5%

AVC EMP- Ch. V. A. Environ Scan External draft 121015.docx Working Paper Draft
Working Paper Draft 29
Table__: Antelope Valley College, Key Zip Codes for Student Origination
Source: California Community College Chancellor’s Office, MIS Referential Files; analysis by Cambridge West Partnership, LLC
In Dist Zip State 2010 2011 2012 2013 2014 Total
% of Total
Cum %
Y 93535 CA 2,625 2,624 2,690 2,816 2,880 13,635 18.90% 18.9%Y 93536 CA 2,805 2,730 2,558 2,617 2,668 13,378 18.55% 37.5%Y 93550 CA 2,181 2,201 2,251 2,353 2,321 11,307 15.68% 53.1%Y 93551 CA 1,992 1,819 1,698 1,740 1,771 9,020 12.51% 65.6%Y 93534 CA 1,476 1,529 1,457 1,584 1,581 7,627 10.57% 76.2%Y 93552 CA 1,137 1,130 1,182 1,222 1,312 5,983 8.30% 84.5%Y 93560 CA 572 516 492 486 515 2,581 3.58% 88.1%Y 93543 CA 390 366 332 342 337 1,767 2.45% 90.5%Y 93591 CA 178 167 166 165 170 846 1.17% 91.7%
93505 CA 137 177 136 142 162 754 1.05% 92.8%Y 93539 CA 156 158 141 126 110 691 0.96% 93.7%
93561 CA 142 140 144 125 128 679 0.94% 94.7%93501 CA 82 90 85 82 72 411 0.57% 95.2%
Y 93510 CA 84 73 70 62 60 349 0.48% 95.7%Y 93590 CA 59 55 65 52 43 274 0.38% 96.1%Y 93532 CA 65 53 50 54 42 264 0.37% 96.5%Y 93553 CA 57 50 44 46 43 240 0.33% 96.8%
93523 CA 23 25 22 20 27 117 0.16% 96.9%91387 CA 21 25 18 15 18 97 0.13% 97.1%
Y 93584 CA 25 17 16 18 15 91 0.13% 97.2%Y 91390 CA 25 16 16 11 9 77 0.11% 97.3%Y 93586 CA 13 21 14 9 9 66 0.09% 97.4%
93516 CA 28 12 6 10 9 65 0.09% 97.5%91351 CA 9 9 15 12 12 57 0.08% 97.6%
Y 93544 CA 12 10 7 9 13 51 0.07% 97.6%93581 CA 12 14 8 8 8 50 0.07% 97.7%93504 CA 12 10 9 5 5 41 0.06% 97.8%

AVC EMP- Ch. V. A. Environ Scan External draft 121015.docx Working Paper Draft
Working Paper Draft 30
These zip codes represent a limited number of cities as shown on the following table. Table __: Antelope Valley College, Key Cities for Student Origination
Source: California Community College Chancellor’s Office, MIS Referential Files; analysis by Cambridge West Partnership, LLC In fall 2014 the attendance draw area for the curriculum offered at the Palmdale Center is described in the following table.
Table __: Palmdale Center Student Participation, Fall 2014
Source: California Community College Chancellor’s Office, MIS Referential Files; analysis by Cambridge West Partnership, LLC Demographic attributes for the effective service area associated with the AVCCD are provided in the following table. Population growth between the year 2010 and 2020 for the AVC effective service area is estimated to be 7.87%. The projected annual rate of
In Dist City 2010 2011 2012 2013 2014
5-Yr Total
% of Total
Cumu-lative
% Average
2010 vs. 2014 % Change
Y Lancaster 7,100 7,079 6,876 7,170 7,263 35,488 49.20% 49.2% 7,098 2.30%Y Palmdale 5,547 5,372 5,362 5,532 5,617 27,430 38.03% 87.2% 5,486 1.26%Y Rosamond 572 516 492 486 515 2,581 3.58% 90.8% 516 -9.97%Y Littlerock 390 366 332 342 337 1,767 2.45% 93.3% 353 -13.59%
California City 149 187 145 147 167 795 1.10% 94.4% 159 12.08%Tehachapi 154 154 152 133 136 729 1.01% 95.4% 146 -11.69%Mojave 87 90 88 88 76 429 0.59% 96.0% 86 -12.64%
Y Acton 84 73 70 62 60 349 0.48% 96.5% 70 -28.57%Y Lake Hughes 65 53 50 54 42 264 0.37% 96.8% 53 -35.38%Y Pearblossom 57 50 44 46 43 240 0.33% 97.2% 48 -24.56%
Los Angeles 36 46 43 53 43 221 0.31% 97.5% 44 19.44%Canyon Country 33 36 34 27 30 160 0.22% 97.7% 32 -9.09%
Fall Term Unduplicated Headcounts
CityIn
DistrictFall 2014
Headcount% of Total
Cumulative %
Palmdale Y 1,633 71.72% 71.72%Lancaster Y 421 18.49% 90.21%Littlerock Y 93 4.08% 94.29%Rosamond Y 31 1.36% 95.65%Acton Y 10 0.44% 96.09%Pearblossom Y 8 0.35% 96.44%Tehachapi 8 0.35% 96.79%California City 9 0.40% 97.19%Others 64 2.81% 100.00%
Total 2,277

AVC EMP- Ch. V. A. Environ Scan External draft 121015.docx Working Paper Draft
Working Paper Draft 31
population growth in the next several years (2015 to 2020) is 0.76%. The median age, in the low 30s, will be relatively young.
Table___: Antelope Valley College Effective Service Area Demographics
Source: Environmental Systems Research Institute, Demographic and Income Profile and Market Profile; analysis by Cambridge West Partnership, LLC An extended population projection for the effective service area is illustrated on the following table. Table __: Antelope Valley College Effective Service Area, Extended Population Projections
Source: Environmental Systems Research Institute, Market Profiles; analysis by Cambridge West Partnership, LLC Within the effective service area 45% of the residents have either less than a high school diploma or only a high school diploma. Another one-fourth completed some college but did not complete an Associate Degree. These residents are prime candidates for the instruction offered by the College.
2015-2020 2015-2020 2010-2020Variable 2000 2010 2015 2020 Annual Rate % Change % Change
Population 440,886 558,614 580,437 602,897 0.76% 3.87% 7.93%Group Quarters 17,035 Median Age 32.8 33.2 33.7Households 140,002 170,292 175,848 182,263 0.72% 3.65% 7.03%Average HH Size 3.05 3.17 3.20 3.21Median HH Income $60,179 $69,842 3.02% 16.06%Per Capital Income $24,713 $27,913 12.95%
Annual RateArea 2021 2022 2023 2024 2025 of Change
AVC ESA 607,479 612,096 616,748 621,435 626,158 0.76%
Extended Population Projection

AVC EMP- Ch. V. A. Environ Scan External draft 121015.docx Working Paper Draft
Working Paper Draft 32
Chart __: Effective Service Area, Educational Attainment in 2015 for Adults Age 25 or Older
Source: Environmental Systems Research Institute, Market Profile; analysis by Cambridge West Partnership, LLC In response to the AB86 Adult Education legislation, educational need indicator data was assembled to facilitate adult education program planning in the regional consortia area. A dean at the College co-chaired the planning efforts with a senior administrator from one of the two public school districts. The socio-economic data they received to support planning is displayed in the following table representing the educational needs of the most vulnerable citizens in the larger region. Table__: Educational Needs of Adults in the Antelope Valley Region
Sources: U.S. Census Bureau American Community Survey and U.S. Department of Education, National Center for Educational Statistics- National Assessment on Adult Literacy; analysis by the AB86 Work Group
LessThanHighSchool19%
HighSchoolGraduate
26%SomeCollege,No
Degree27%
AssociateDegree9%
Bachelor'sDegree12%
GraduateDegree7%
Regional Consortia Poverty
No High School
Diploma Unemploy-
ment
ESL (English Language Learners)
Adults with
Disabilities No
Citizenship No
Literacy Antelope Valley 119,412 90,400 47,933 174,895 42,560 60,068 66,718 % of 2010 Population 28.4% 21.5% 11.4% 41.6% 10.1% 14.3% 15.9%

AVC EMP- Ch. V. A. Environ Scan External draft 121015.docx Working Paper Draft
Working Paper Draft 33
Within the official District boundaries alone there are three zip codes where 20% or more of the households reported to the U.S. Census that they spoke English less than very well. Collectively, these cases account for 24,400 people age 5 or older. The largest concentration of limited English-speaking people is in zip code 93550, but all three are within the city of Palmdale as illustrated in the following chart. Chart __: Areas Where 20% or More of the Households Speak English Less Than Very Well
Sources: U.S. Census Bureau American Community Survey, Environmental Systems Research Institute. Market Profile; analysis by Cambridge West Partnership, LLC Just over 21,600 (13.6%) of the residents in Lancaster reported being foreign-born whereas Palmdale reported almost double that amount with approximately 40,300 (25.8%). In Lancaster 96.7% of the foreign-born residents and 98% in Palmdale indicated they had entered the United States before 2010. Both in Lancaster and Palmdale the majority of foreign-born residents are from Latin American countries. Across the AVCCD official service area there were a limited number of languages other than English reported as being spoken at home. In both Lancaster and Palmdale those languages were Spanish or Asian/Pacific Island languages. Through the 2010-2014 American Community Survey process the Census Bureau estimated that approximately 51% of the Lancaster foreign-born population age five or older, reported that they spoke

AVC EMP- Ch. V. A. Environ Scan External draft 121015.docx Working Paper Draft
Working Paper Draft 34
English less than “very well” at home. In contrast, approximately 60% of the foreign-born population in Palmdale reported that they spoke English less than “very well” at home.16 The initial work of the AB86 Consortium and the U.S. Census data pointed to significant English language learning educational needs, primarily in Palmdale, to which the College may want to respond. Six zip codes within the official District boundaries have 20% or more of the households living below the 2015 federal poverty level for a family of four. Collectively, there are 19,000 households that meet the criteria. There are two zip codes in Lancaster and one each in Palmdale, Rosamond, Littlerock, and Pearblossom. Chart __: Areas Where 20% or More of the Households Have an Income Below the Federal Poverty Level for a Family of Four
Sources: U.S. Census Bureau American Community Survey, Environmental Systems Research Institute. Market Profile; analysis by Cambridge West Partnership, LLC Within the official District boundaries three zip codes 30% or more of the adults attained less than a high school diploma or equivalency. These residents account for 23,000 people in the College’s official service area. The zip codes are represented in the following chart.
16 U.S. Census Bureau. American Communities Survey 2010-2014.

AVC EMP- Ch. V. A. Environ Scan External draft 121015.docx Working Paper Draft
Working Paper Draft 35
Chart __: Areas Where 30% or More of the Adult Attained Less Than a High School Diploma or Its Equivalent
Sources: U.S. Census Bureau American Community Survey, Environmental Systems Research Institute. Market Profile; analysis by Cambridge West Partnership, LLC When these three socioeconomic variables, limited English proficiency, income below the federal poverty level, and deficiency in education, are taken together they create a portrait that provides a sense of where the educational needs are the greatest within the official District boundaries. The composite of this data is captured in the following table.

AVC EMP- Ch. V. A. Environ Scan External draft 121015.docx Working Paper Draft
Working Paper Draft 36
Table __: Zip Codes Where Educational Need is the Greatest Within the Official AVC District Boundaries
Sources: U.S. Census Bureau American Community Survey, Environmental Systems Research Institute. Market Profile; analysis by Cambridge West Partnership, LLC From the 2010 census to 2020 the age group in AVC effective service area that will increase the most in proportion to the overall population is the 65+ seniors. Out to 2020, the groups of recent high school graduates, late teenagers, and traditional college-agers or early 20s (career choice) is projected to decrease by 2.4%, but will continue to represent a substantial proportion of the overall population. Table__: AVE Effective Service Area Age Range Projections
Source: Environmental Systems Research Institute, Market Profile; analysis by Cambridge West Partnership, LLC Across the State, participation rates in the community college system are traditionally the highest among the younger adults, ages 18 to 24. In recent years 60% of the enrolled students at the College fall into the traditional college-age range of 18 to 24 years of age. The size of that group within the effective service area is critical to future enrollments. Over a long period of time, 1996 to 2014, the College annually enrolled 50 or more students per high school that are the primary pathway and 20 to 49 students per each additional high school. From 2010-11 to 2014-15 the annual and average yield rates are shown in the following table. The yield is calculated from the count of graduates (denominator) divided into the count of students who enroll at AVC the following year (numerator).
Socioeconomic Variable93560,
Rosamond93534,
Lancaster93535,
Lancaster93550,
Palmdale93552,
Palmdale93591,
Palmdale93543,
Littlerock93553,
Pearblossom20% + Households Speak English Less Than Very Well X X X
20% + Household, Family of Four, Below Federal Poverty Level X X X X X X30% + Adults, Less Than High School Graduate X X X
Total 1 1 1 3 2 1 2 1
Zip Codes and City
2010 to 2020Age Category 2010 2015 2020 Absolute Chanage
under 15 23.6% 22.0% 21.8% -1.8%Career Choice (15-24) 16.4% 16.3% 14.0% -2.4%
Career Start (25-34) 12.7% 14.1% 16.2% 3.5%Career Middle (35-44) 13.7% 12.2% 12.5% -1.2%Career Finish (45-64) 25.1% 25.5% 23.9% -1.2%
Retirement (65+) 8.5% 9.9% 11.5% 3.0%
AVC EMP- Ch. V. A. Environ Scan External draft 121015.docx Working Paper Draft
Working Paper Draft 37
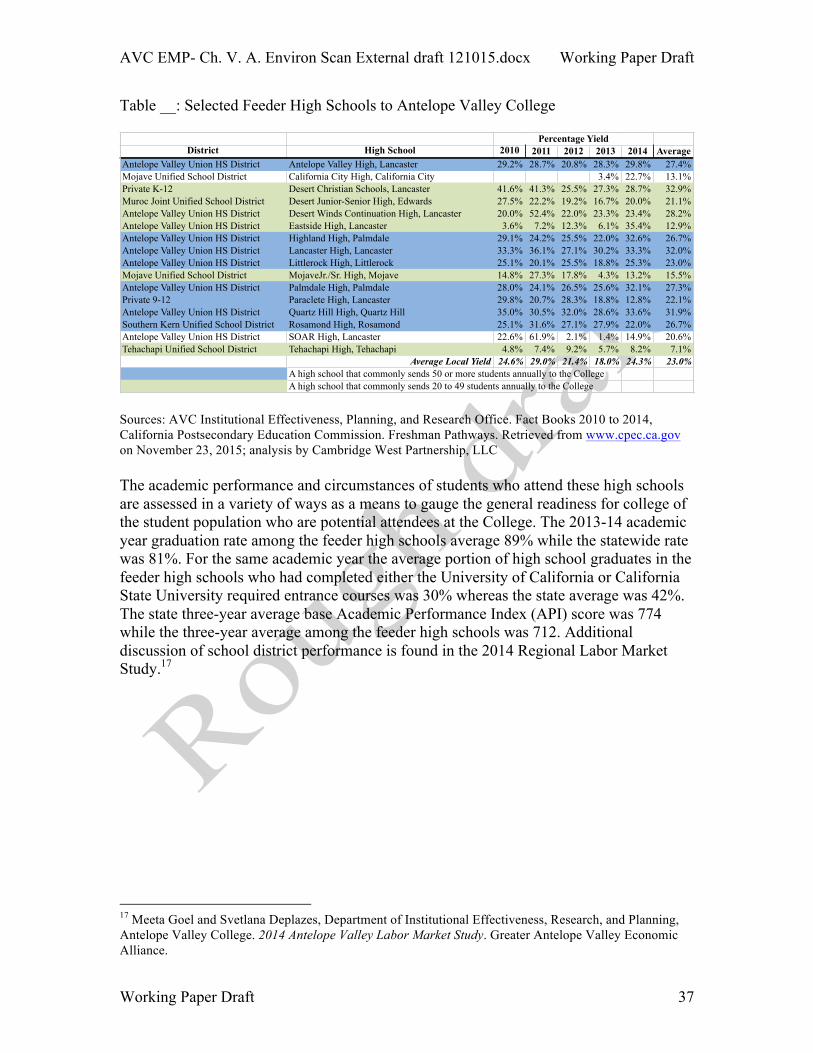
Table __: Selected Feeder High Schools to Antelope Valley College
Sources: AVC Institutional Effectiveness, Planning, and Research Office. Fact Books 2010 to 2014, California Postsecondary Education Commission. Freshman Pathways. Retrieved from www.cpec.ca.gov on November 23, 2015; analysis by Cambridge West Partnership, LLC The academic performance and circumstances of students who attend these high schools are assessed in a variety of ways as a means to gauge the general readiness for college of the student population who are potential attendees at the College. The 2013-14 academic year graduation rate among the feeder high schools average 89% while the statewide rate was 81%. For the same academic year the average portion of high school graduates in the feeder high schools who had completed either the University of California or California State University required entrance courses was 30% whereas the state average was 42%. The state three-year average base Academic Performance Index (API) score was 774 while the three-year average among the feeder high schools was 712. Additional discussion of school district performance is found in the 2014 Regional Labor Market Study.17
17 Meeta Goel and Svetlana Deplazes, Department of Institutional Effectiveness, Research, and Planning, Antelope Valley College. 2014 Antelope Valley Labor Market Study. Greater Antelope Valley Economic Alliance.
District High School 2010 2011 2012 2013 2014 AverageAntelope Valley Union HS District Antelope Valley High, Lancaster 29.2% 28.7% 20.8% 28.3% 29.8% 27.4%Mojave Unified School District California City High, California City 3.4% 22.7% 13.1%Private K-12 Desert Christian Schools, Lancaster 41.6% 41.3% 25.5% 27.3% 28.7% 32.9%Muroc Joint Unified School District Desert Junior-Senior High, Edwards 27.5% 22.2% 19.2% 16.7% 20.0% 21.1%Antelope Valley Union HS District Desert Winds Continuation High, Lancaster 20.0% 52.4% 22.0% 23.3% 23.4% 28.2%Antelope Valley Union HS District Eastside High, Lancaster 3.6% 7.2% 12.3% 6.1% 35.4% 12.9%Antelope Valley Union HS District Highland High, Palmdale 29.1% 24.2% 25.5% 22.0% 32.6% 26.7%Antelope Valley Union HS District Lancaster High, Lancaster 33.3% 36.1% 27.1% 30.2% 33.3% 32.0%Antelope Valley Union HS District Littlerock High, Littlerock 25.1% 20.1% 25.5% 18.8% 25.3% 23.0%Mojave Unified School District MojaveJr./Sr. High, Mojave 14.8% 27.3% 17.8% 4.3% 13.2% 15.5%Antelope Valley Union HS District Palmdale High, Palmdale 28.0% 24.1% 26.5% 25.6% 32.1% 27.3%Private 9-12 Paraclete High, Lancaster 29.8% 20.7% 28.3% 18.8% 12.8% 22.1%Antelope Valley Union HS District Quartz Hill High, Quartz Hill 35.0% 30.5% 32.0% 28.6% 33.6% 31.9%Southern Kern Unified School District Rosamond High, Rosamond 25.1% 31.6% 27.1% 27.9% 22.0% 26.7%Antelope Valley Union HS District SOAR High, Lancaster 22.6% 61.9% 2.1% 1.4% 14.9% 20.6%Tehachapi Unified School District Tehachapi High, Tehachapi 4.8% 7.4% 9.2% 5.7% 8.2% 7.1%
Average Local Yield 24.6% 29.0% 21.4% 18.0% 24.3% 23.0%A high school that commonly sends 50 or more students annually to the CollegeA high school that commonly sends 20 to 49 students annually to the College
Percentage Yield

AVC EMP- Ch. V. A. Environ Scan External draft 121015.docx Working Paper Draft
Working Paper Draft 38
Table__: 2013-14 Performance Data for Primary Feeder High Schools to Antelope Valley College
Source: California Department of Education. DataQuest; analysis by Cambridge West Partnership, LLC The largest racial group in the AVC effective service areas has been White. But, the portion of the self-reported White group is expected to shrink 2.5% by 2020 while the portion of the self-reported Some Other Race group is anticipated to increase 1.8% by 2020. Hispanic ethnic residents currently constitute 39.3% of the population. The Hispanic ethnic group is estimated to continue increasing by 4.5% to become 43.8% by 2020. Chart __: 2015 Antelope Valley College Effective Service Area, Racial and Ethnic Composition
Source Environmental Systems Research Institute, Market Profile; analysis by Cambridge West Partnership, LLC
District High SchoolGraduation
Rate
English Language Learners
Grads with UC/CSU Required Courses
3-Yr API
Average
Percent Free
Lunch
Percent Language
Arts Proficient*
Percent General
Math Proficient**
Antelope Valley Union HS District Antelope Valley High, Lancaster 81.8% 13.6% 25.1% 623 77.7% 20% 13%Mojave Unified School District California City High, California City 85.2% 5.8% 25.0% 675 68.9% 30% 1%Private K-12 Desert Christian Schools, Lancaster - - - - - - -Muroc Joint Unified School District Desert Junior-Senior High, Edwards 98.0% 1.3% 47.5% 798 9.9% 29% 32%Antelope Valley Union HS District Desert Winds Continuation High, Lancaster - 16.2% 0.0% 499 55.8% 9% 3%Antelope Valley Union HS District Eastside High, Lancaster 86.5% 10.2% 37.6% 709 74.5% 27% 6%Antelope Valley Union HS District Highland High, Palmdale 88.1% 8.5% 28.3% 739 55.9% 34% 15%Antelope Valley Union HS District Lancaster High, Lancaster 89.5% 7.1% 31.7% 728 54.5% 33% 19%Antelope Valley Union HS District Littlerock High, Littlerock 83.3% 17.0% 26.4% 659 78.6% 26% 13%Mojave Unified School District MojaveJr./Sr. High, Mojave 86.4% 14.4% 10.5% 625 80.9% 10% 2%Antelope Valley Union HS District Palmdale High, Palmdale 81.8% 15.9% 23.2% 677 74.8% 27% 10%Private 9-12 Paraclete High, Lancaster - - - - - - -Antelope Valley Union HS District Quartz Hill High, Quartz Hill 91.3% 2.9% 37.4% 793 31.8% 34% 13%Southern Kern Unified School District Rosamond High, Rosamond 87.9% 9.1% 12.8% 704 74.8% 29% 10%Antelope Valley Union HS District SOAR High, Lancaster 100.0% 0.2% 93.2% 941 60.2% 35% 58%Tehachapi Unified School District Tehachapi High, Tehachapi 93.7% 2.6% 26.8% 791 30.2% 31% 14%
Averages 88.7% 8.9% 30.4% 712 59.2% 26.7% 14.9%
2013-2014 Performance Data
2010 to 2020Race 2010 2015 2020 Absolute Change
White 58.5% 57.0% 56.0% -2.5%Black 12.5% 12.3% 11.9% -0.6%Asian 4.6% 4.9% 5.3% 0.7%
Some Other 18.1% 19.2% 19.9% 1.8%Two or More 5.1% 5.5% 5.7% 0.6%
Am Indian, Pacific Is. 1.1% 1.2% 1.1%Total 99.9% 100.1% 99.9%
EthnicityHispanic Origin 39.3% 41.5% 43.8% 4.5%

AVC EMP- Ch. V. A. Environ Scan External draft 121015.docx Working Paper Draft
Working Paper Draft 39
Across the State, participation in the community college system varies among ethnic and racial groups. However, young people of Hispanic heritage have been historically underrepresented in higher education Implications for Antelope Valley College:
1. The population in the effective service area is projected to continue growing with a 7.9% change between 2010 and 2020 or a 0.76% annual change rate between 1015 and 2020. Extrapolating to 2025 the population will become approximately 622,000.
2. Data assembled for the adult education consortium activities indicate that within the official District service area there are a number of families living at or below the poverty level and a significant segment are English language learners. These data present profound implications and opportunities for the College.
3. Since 2010, fall term enrollments declined to a low point in 2012. However, since that point, enrollments have been increasing. To some extent, the decline in enrollments is related to the significant shortfall in state resources that accompanied the Great Recession. The College has reversed the decline and has been preparing a larger Center facility in Palmdale. Attention to additional facility capacity is warranted.
4. Throughout the effective service area, the portion of adult residents age 25 or older that have no high school diploma is 19%. There are ample residents who could benefit by attending the institution and completing a certificate or degree.
5. Over the next five years the portion of teenagers and very young adults in the effective service area who are making career choices will continue to represent a substantial segment of the population. Several public high schools have been the primary providers of students to the College. These data underscore the importance of outreach efforts the College might wish to continue in order to sustain enrollment volumes.
6. Several zip codes in the official District service area were identified in which 20% or more of the households reported speaking English less than very well. Other zip codes were identified where 20% or more of the households reported an income that is below the 2015 federal poverty level for a family of four. The large portion of low income of households and households where English is spoken less than very well in the College’s official service area provide an opportunity for the College to be a “merchant of hope” by recruiting students whose lives will be transformed from their success at the institution.
7. The portion of District residents who self-reported as Hispanic was 39% in 2015 but will grow to 44% by 2020. Traditionally, that group has had a lower participation rate in higher education. That trend presents a particular recruiting challenge to the College.