uw-milwaukee cfa competition paper
TRANSCRIPT

CFA Institute Research Challenge
Hosted in
Milwaukee, Wisconsin University of Wisconsin - Milwaukee

1
Bear Base Bull P/E P/S
$24.14 $31.84 $41.66 $29.98 $25.80
Valuation Results
DCF Results Summary Relative Summary
5 Year
Current High Low Avg
P/E (LTM) 15.6 136.8 14.8 56.3
P/E (NTM) 12.8 21.4 11.3 16.1
PEG (NTM) 1.7 2.1 0.8 1.2
P/Bk 18.5 528.7 16.8 97.4
P/CF 3.0 29.0 2.8 8.5
P/Sales 1.3 6.6 1.0 1.8
Div Yld 7.8% 8.4% 0.0% 2.8%
Valuation Summary
Fund Status Current AUM (Mil.)
Global Equity Team
Non-U.S. Growth Closed 30187
Non-U.S. Small Cap Growth Closed 1323
Global Equity Team Open 786
Global Small Cap Open 138
U.S. Value Team
U.S. Mid-Cap Value* Closed 7959
Growth Team
U.S. Mid- Cap Growth Closed 15103
U.S. Small Cap Growth Closed 2270
Global Opportunities Strategy Open 7556
Global Value
Non-U.S. Value Closed 16257
Global Value Open 13925
Emerging Markets
Emerging Markets Open 571
Credit Team
High Income Open 989
Developing World
Developing World Open 374
Total 99848
*Closed to new investors as of February 1st, 2016
Artisan Partners Product Summary
Artisan Partners Asset Management
Ticker: APAM
Exchange: NYSE
Market Cap: 1,181
Sector: Financial
Industry: Asset Management
Current Price: $29.98 (1/29/16)
Target Price: $29.00 (3% downside)
Highlights
We initiate coverage on Artisan Partners Asset Management (APAM) with a
SELL recommendation based on a one-year target price of $29.00 from a
price of $29.98 as of January 29, 2016.
Sell Thesis:
Artisan trades at premium P/E and P/S multiples compared to other equity
based asset managers. We believe Artisan does not justify higher multiples
because of declining growth due to a large percent of funds closed to new
investors, declining performance, higher than average fees, and a relative
lack of investment in marketing and distribution. We project margins to
decrease due to lower revenue from declining assets under management and
a more lucrative compensation structure than peers. Finally, Artisan
possesses more risk than peers due to higher leverage and a lack of product
diversification.
Recommendation: SELL
Driver Preview
Industry
Increasing competition from passive strategies are beginning to
compress the fees active managers are able to charge
Growth opportunities include alternative investments and international
exposure
Company
Worsening performance relative to peers will affect APAM’s ability to
attract and retain assets
Limited growth opportunities; 75% of AUM resides in closed funds
Lack of investment in sales and distribution will inhibit net inflows

2
Source: Company Data
Business Description
Founded in 1994, Artisan Partners Asset Management (APAM) is a boutique investment
management firm with approximately $97B in assets under management (AUM) (Figure 1).
AUM grew at a CAGR of 18% from 2009 – 2014; the S&P 500 grew at a CAGR of 13%
during the same time period. As of September 30, 2015, APAM offered 15 actively-managed
investment strategies, overseen by six independent investment teams (Figure 2). (Appendix
A-U). Investment teams are autonomous from the day-to-day business operations and each
other. APAM believes this unique structure elevates investment results through the
promotion of original and independent investment ideas.
Products
APAM’s product offerings consist of 14 long-equity strategies and one fixed income
strategy; approximately 99% of its AUM is in long-equity holdings. Strategies are composed
of domestic and international securities. As of December 31, 2014, approximately 45% of
APAM’s AUM was invested in securities of non-U.S companies. In addition, approximately
42% of its AUM was invested in securities denominated in currencies other than the U.S
dollar. Currently, 59% of APAM’s funds are closed to most new investors and client
relationships. APAM will be closing its non-U.S. Growth strategy as of February 2016,
resulting in 72% of its AUM being closed (Appendix V).
Performance
Strong performance relative to peers is often necessary to attract & retain AUM. The
performance of APAM’s mutual funds has been declining relative to its peers on a five, three,
and one year basis (Figure 3). The alpha generation of the funds has been deteriorating in a
similar fashion (Figure 3).
Product Types
APAM provides two investment types as a median for clients to access its investment teams:
mutual funds (55% of AUM) and separate accounts (45% of AUM) (Figure 4). Separate
accounts are utilized by institutions and high net worth clients and tend to have lower fees.
Separate accounts tend to have a longer average duration than fund holdings. Artisan’s
mutual fund offerings include Artisan Funds and Artisan Global Funds. Artisan Funds is
available to domestic clients and Artisan Global Funds is available to investors abroad.
Unlike some mutual funds, investors are not required to pay 12b-1 fees, which are annual
marketing or distribution expenses charged to clients. Assets in the Artisan funds paid a
weighted average fee of 93 basis points for the three months ended September 30, 2015.
Assets in separate accounts paid a weighted average of 54 basis points.
Distribution Channels
APAM reaches its client base through all major distribution mediums, including institutional,
intermediary, and retail channels. The institutional channel includes traditional institutional
clients and is offered directly to clients and the investment consultants that advise them.
Intermediary channel clients include major brokerage firms, larger private banks, and
financial advisory firms. Intermediaries aim to offer “best-in-breed” funds; best-in breed
includes funds with strong relative performance and comprehensive customer service and
support. Retail investors can invest through mutual fund supermarkets and also prefer best-
in-breed products. Rankings from firms such as Morningstar and Lipper are often used to
identify such funds.
Ownership Structure
IPO Reorganization
APAM completed its initial public offering in March 2013, resulting in it becoming the sole
general partner of Artisan Partners Holdings, LP. Artisan Partners Holdings is the holding
company for the business operations of APAM; all revenue and expenses flow through it. As
sole general partner of Artisan Partner Holdings, APAM is responsible for all business
decisions, subject to voting rights of limited partners. Net profits and losses are allocated
based on ownership units of Artisan Partners Holding (Appendix AC).
Global Equity
Team
31%
Growth Team
24%
Global Value
Team
31%
U.S. Value
Team
12%
Emerging
Markets Team
1% Credit Team
1%
Developing
World
Team
0%
Figure 2: APAM Investment Teams by AUM
Source: Company Data
Figure 3: Performance (L) and Alpha Generation (R) Trends
80%
48% 45%
1.35%
-0.15% -0.28% -50%
0%
50%
100%
150%
5 Year 3 Year 1 Year
% of APAM Mutal Funds in the Top 50% of Performance
Weighted Average Alpha Generation
Source: Company Data
74,334
7,178
23,965
105,477
787
1,651
107,915
(3,833)
(7,114)
96,968
60,000
70,000
80,000
90,000
100,000
110,000
120,000
Beg
. A
UM
Net
Flo
ws
Mar
ket
Ap
pre
ciat
ion
Beg
. A
UM
Net
Flo
ws
Mar
ket
Ap
pre
ciat
ion
Beg
. A
UM
Net
Flo
ws
Mar
ket
Dep
reci
atio
n
Q3 E
nd
. A
UM
2013 2014 2015
Figure 1: APAM AUM 2013-2015
Source: Company Data

3
Associated Risks
APAM’s ownership structure is unique to the asset management industry and presents risks
unrelated to its business operations. Associated risks include: approximately 69% of the
voting power allocated to a “stockholders committee” consisting of Eric Colson (CEO),
Charles Daley (CFO), and Gregory Ramirez (Senior VP), the stockholders committee
influence on dividend policy, and taxation issues due to the partnership status of Artisan
Partner Holdings.
Industry Overview and Competitive Positioning
In the asset management industry, revenue is derived primarily from management fees
generated as a percentage of AUM. As a result, changes in AUM or fee structures will
significantly impact a firm’s future revenues. Other components of revenue include: net
flows, market returns, distribution, and product mix.
Fees and Trend Towards Passive Management
Fee Structure
In accordance with the industry, Artisan Partners derives approximately 99% of its
revenue from management fees. In 2014, APAM’s mutual funds had an average
weighted fee of 93 basis points, which is 8% higher than the industry average of 86
basis points. Furthermore, the average weighted prospectus fee of Artisan’s funds is
1.19%. According to a 2015 Morningstar study, 91% of all investor assets were held in
funds with an expense ratio less than 1.19%. Clients who invest their assets at such a
significant premium will expect APAM to continuously outperform its peers.
Passive Management
An industry trend that has been developing over the past decade has been the growth of
low-fee, passive management strategies. During a period of high market growth, it is
extremely difficult for an active management strategy to beat the market. According to
a study published on CNN, 86% of active large-cap fund managers failed to beat their
benchmarks in 2014. A study conducted by Morningstar showed that only 18% of
active large-cap funds beat the market on a 10-year basis at the end of 2014. Although
actively managed funds have continuously underperformed their passive benchmarks
over longer time horizons, they still charge a significant premium. Passively managed
products charge a smaller fee because investors are not paying for added alpha
generation. In addition to lower fees, passive management strategies have become more
attractive recently due to broadening product offerings and expanding distribution
opportunities. If this trend continues, the asset management industry should see
consolidation among firms. However, the few remaining actively managed funds that
are able to consistently beat the returns of the market will benefit as other firms exit.
Fee compression
As investors switch to passively managed products which offer lower fees, active fund
managers have begun to experience fee compression. According to an ICI Research
study, the average expense ratio for all equity funds (active and passive) has been on a
steady decline, falling from 99 basis points in 2000, to 70 basis points in 2014. During
the same time, actively managed equity funds fell from an average weighted fee of
1.06% to 0.86%. Also, the 2015 ICI Investment Company Fact Book shows that the
majority of fund flows in 2014 went into funds with expense ratios in the lowest
quartile. This comprises 70% of total active fund assets (Figure 7). With over 99% of
Artisan’s revenue generated from management fees, this trend could significantly
impact earnings if Artisan is forced to reduce fees.
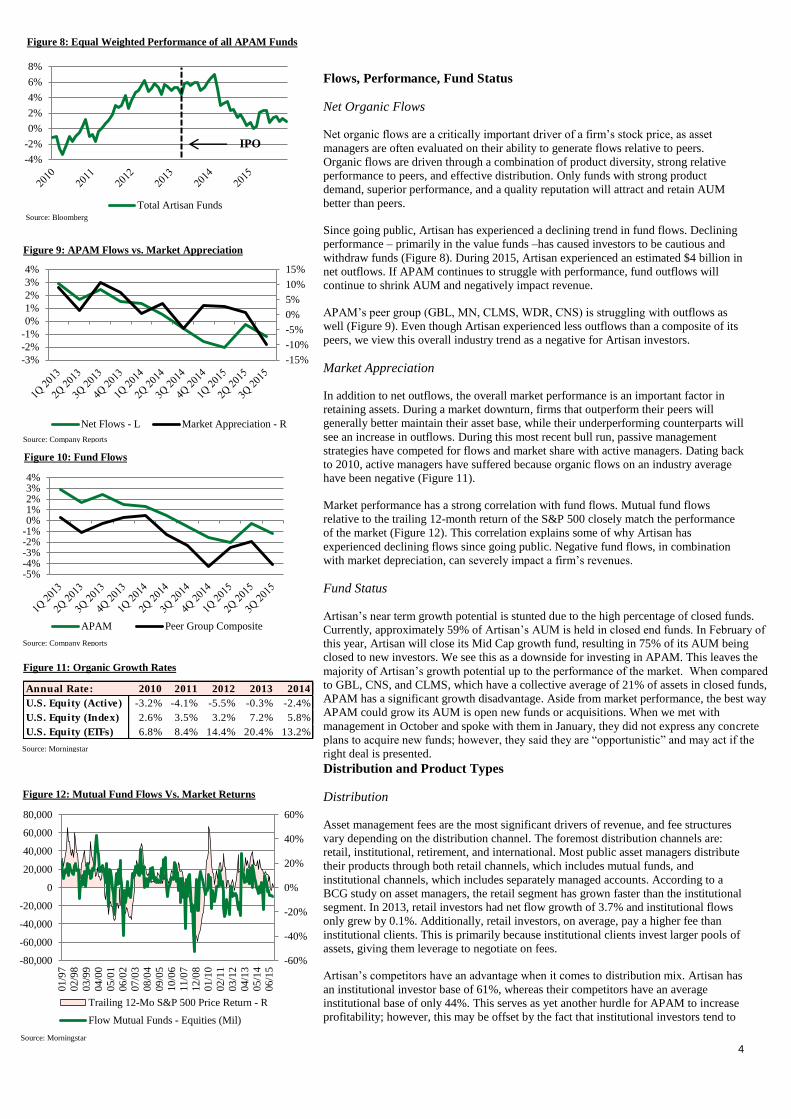
Artisan has not yet experienced fee compression from this trend; however, it is crucial
that that the funds outperform their benchmarks and peers, or investors will not be able
to justify paying an above average fee. Since its IPO in 2013, Artisan’s total average
outperformance relative to each fund’s respective benchmark has been on a decline
(Figure 8). If performance continues to decline, this could ultimately put pressure on
the fees they are able to charge investors and deter future inflow of funds.
F
i
S
o
Figure 5: Industry Revenue Breakout
81%
12%
4% 3% 1%
ManagementFees
Distribution
Service Fees
Other
Source: Bank of America Merrill Lynch
Figure 6: Active and Passive AUM
0
2
4
6
8
10
12
19
90
19
92
19
94
19
96
19
98
20
00
20
02
20
04
20
06
20
08
20
10
20
12
20
14
Active Passive
Source: Bank of America Merrill Lynch
26 30
15
74 70
85
0
20
40
60
80
100
All equity funds Actively managed
equity funds
Index equity funds
Funds with expense ratios in the upper three quartiles
Funds with expense ratios in the lowest quartile
Source: ICI Research
Figure 7: Funds Flows by Quartile
68% 55%
67% 54%
68% 53%
70% 57% 67% 55%
0%
25%
50%
75%
100%
Rev
enu
e
AU
M
Rev
enu
e
AU
M
Rev
enu
e
AU
M
Rev
enu
e
AU
M
Rev
enu
e
AU
M
2011 2012 2013 2014 2015
Q3
Mutual Funds Separate Accounts
Figure 4: Mutual Funds v. Separate Accounts
Source: Company Data
4
Flows, Performance, Fund Status
Net Organic Flows
Net organic flows are a critically important driver of a firm’s stock price, as asset
managers are often evaluated on their ability to generate flows relative to peers.
Organic flows are driven through a combination of product diversity, strong relative
performance to peers, and effective distribution. Only funds with strong product
demand, superior performance, and a quality reputation will attract and retain AUM
better than peers.
Since going public, Artisan has experienced a declining trend in fund flows. Declining
performance – primarily in the value funds –has caused investors to be cautious and
withdraw funds (Figure 8). During 2015, Artisan experienced an estimated $4 billion in
net outflows. If APAM continues to struggle with performance, fund outflows will
continue to shrink AUM and negatively impact revenue.
APAM’s peer group (GBL, MN, CLMS, WDR, CNS) is struggling with outflows as
well (Figure 9). Even though Artisan experienced less outflows than a composite of its
peers, we view this overall industry trend as a negative for Artisan investors.
Market Appreciation
In addition to net outflows, the overall market performance is an important factor in
retaining assets. During a market downturn, firms that outperform their peers will
generally better maintain their asset base, while their underperforming counterparts will
see an increase in outflows. During this most recent bull run, passive management
strategies have competed for flows and market share with active managers. Dating back
to 2010, active managers have suffered because organic flows on an industry average
have been negative (Figure 11).
Market performance has a strong correlation with fund flows. Mutual fund flows
relative to the trailing 12-month return of the S&P 500 closely match the performance
of the market (Figure 12). This correlation explains some of why Artisan has
experienced declining flows since going public. Negative fund flows, in combination
with market depreciation, can severely impact a firm’s revenues.
Fund Status
Artisan’s near term growth potential is stunted due to the high percentage of closed funds.
Currently, approximately 59% of Artisan’s AUM is held in closed end funds. In February of
this year, Artisan will close its Mid Cap growth fund, resulting in 75% of its AUM being
closed to new investors. We see this as a downside for investing in APAM. This leaves the
majority of Artisan’s growth potential up to the performance of the market. When compared
to GBL, CNS, and CLMS, which have a collective average of 21% of assets in closed funds,
APAM has a significant growth disadvantage. Aside from market performance, the best way
APAM could grow its AUM is open new funds or acquisitions. When we met with
management in October and spoke with them in January, they did not express any concrete
plans to acquire new funds; however, they said they are “opportunistic” and may act if the
right deal is presented.
Distribution and Product Types
Distribution
Asset management fees are the most significant drivers of revenue, and fee structures
vary depending on the distribution channel. The foremost distribution channels are:
retail, institutional, retirement, and international. Most public asset managers distribute
their products through both retail channels, which includes mutual funds, and
institutional channels, which includes separately managed accounts. According to a
BCG study on asset managers, the retail segment has grown faster than the institutional
segment. In 2013, retail investors had net flow growth of 3.7% and institutional flows
only grew by 0.1%. Additionally, retail investors, on average, pay a higher fee than
institutional clients. This is primarily because institutional clients invest larger pools of
assets, giving them leverage to negotiate on fees.
Artisan’s competitors have an advantage when it comes to distribution mix. Artisan has
an institutional investor base of 61%, whereas their competitors have an average
institutional base of only 44%. This serves as yet another hurdle for APAM to increase
profitability; however, this may be offset by the fact that institutional investors tend to
-4%
-2%
0%
2%
4%
6%
8%
Total Artisan Funds
IPO
Figure 8: Equal Weighted Performance of all APAM Funds
Source: Bloomberg
-15%
-10%
-5%
0%
5%
10%
15%
-3%
-2%
-1%
0%
1%
2%
3%
4%
Net Flows - L Market Appreciation - R
Figure 9: APAM Flows vs. Market Appreciation
Source: Company Reports
-5%-4%-3%-2%-1%0%1%2%3%4%
APAM Peer Group Composite
Figure 10: Fund Flows
Source: Company Reports
Annual Rate: 2010 2011 2012 2013 2014
U.S. Equity (Active) -3.2% -4.1% -5.5% -0.3% -2.4%
U.S. Equity (Index) 2.6% 3.5% 3.2% 7.2% 5.8%
U.S. Equity (ETFs) 6.8% 8.4% 14.4% 20.4% 13.2%
Figure 11: Organic Growth Rates
Source: Morningstar
-60%
-40%
-20%
0%
20%
40%
60%
-80,000
-60,000
-40,000
-20,000
0
20,000
40,000
60,000
80,000
01
/97
02
/98
03
/99
04
/00
05
/01
06
/02
07
/03
08
/04
09
/05
10
/06
11
/07
12
/08
01
/10
02
/11
03
/12
04
/13
05
/14
06
/15
Trailing 12-Mo S&P 500 Price Return - R
Flow Mutual Funds - Equities (Mil)
Figure 12: Mutual Fund Flows Vs. Market Returns
Source: Morningstar

5
be stickier, meaning they are likely to have a longer holding period than retail
investors.
Growth Opportunities
Product Mix
APAM’s peer group consists of fund managers with a high concentration of equity
investments. APAM, GBL, CNS, WDR, CLMS, and MN have an average equity asset
weighting of 91%; APAM and GBL are the only two firms with less than 1% of fixed
income investments. In the event of an equity downturn, APAM’s competitors could
benefit from having a more diversified portfolio because they won’t be as impacted
from a decline in a single asset class. Equity funds have a higher fee structure, so this
also means that more of APAM’s earnings are at risk than other firms. In addition,
APAM’s valuation multiples could be impacted from their lack of product growth
opportunities. Artisan’s comparable Calamos (CLMS) trades at premium valuation to
its peers due to products in rapidly growing areas, such as their long/short strategy.
Artisan also trades at a premium, despite not having products in rapidly growing asset
classes. If APAM continues to have below average growth opportunities, investors may
not be able to justify paying an above average valuation.
Alternative Investments
According to a study conducted and published by McKinsey in 2013, alternative
investments hit an all-time high at $7.2 trillion. Figure 15 shows how alternative
investment AUM has grown relative to traditional investment AUM between 2005 and
2013. Over this time, alternative investment AUM has grown at a compound annual
growth rate of 9.4%, which is roughly twice the growth rate of traditional investments.
Because these are nontraditional strategies, they often are associated with premium fees
as compared to other types of investment vehicles. As a result, 30% of the asset
management industry’s revenues came from alternatives in 2013, even though they
only comprised 12% of the industry’s assets. This is an enormous growth opportunity
in the asset management industry, as it is currently underdeveloped and delivers a risk
and return objective that is unattainable in traditional investment strategies.
Asia-Pacific Region
At the start of 2015, the Asia-Pacific region represented about a third of the world
economy and global finance. In addition, Asia-Pacific has three of the worlds’ most
populous regions which, altogether, make up about 56% of the world’s population.
Despite this position, this region represents only 15% of global AUM, which has
remained relatively unchanged since 2007. Considering the fact that asset management
is a relatively mature industry in the United States, firms will surely be looking to grow
in this underserved market over the next decade, especially as regulations in these
regions continue to be lifted.
Investment Summary
We issue a SELL recommendation on Artisan Partners Asset Management (APAM)
with a target price of $29 using a discounted cash flow analysis and two relative
multiple valuations. Our valuation is supported by the following industry and company
drivers:
Industry Driver 1
Competition from passive strategies may compress fee levels of active
strategies.
Artisan maintains a higher fee structure relative to competitors. Active managers can
justify a larger fee if they are able to generate better performance over time relative to
peers and the selected benchmark. While some of Artisan’s funds have alpha
generating performance records that can command premium fees, funds with less than
stellar performance may have to lower fees in order to remain competitive with passive
funds or risk continued outflows. The Value team is especially at risk of losing assets
due to the prior poor performance (Figure 16). This underperformance no longer
justifies the premium fees charged.
3.2 4.1 5 5 5.3 5.9 6.3 6.8 7.2
37.1
42.8 46
37.9
42.8 45.7 45.7
50.2 56.7
0
10
20
30
40
50
60
70
Alternative Traditional
Figure 15: Global AUM 2005-2013
Source: McKinsey Analysis: Hedge Fund Research
59%
15% 19% 28%
41%
85% 81% 72%
0%
20%
40%
60%
80%
100%
Closed Open
Figure 13: APAM vs. Peer Fund Status
Source: Company Reports
39%
88%
51% 58% 49%
34%
61%
12%
49% 42% 51%
66%
0%
20%
40%
60%
80%
100%
APAM CLMS CNS GBL MN WDR
Retail Institutional
Figure 14: APAM vs. Industry Distribution Mix
Source: Company Reports
Figure 16: U.S. Value Team Performance
U.S. Value Team 1 yr 3 yr 5 yr
U.S. Mid-Cap Value
Net Performance -9.89 7.50 8.05
Russell Midcap Value -4.78 13.40 11.25
Underperformance -5.11 -5.90 -3.20
U.S. Small-Cap Value
Net Performance -12.50 0.96 1.13
Russell 2000 Value -7.47 9.06 7.67
Underperformance -5.03 -8.10 -6.54
Value Equity
Net Performance -9.10 6.26 7.54
Russell 1000 Value -3.83 13.08 11.27
Underperformance -5.27 -6.82 -3.73
Avg. Underperformance 5.14 6.94 4.49
Source: Company Data

6
Source: Company Data
Source: Company Data
Industry Driver 2
Product Mix
Alternative strategies and passive funds are growing at a faster rate than traditional
equity strategies. Investors are demanding differentiated products not easily replicated
through passive strategies. Additionally, investors are seeking greater diversification to
mitigate risk. This has increased the popularity of funds investing in alternative asset
classes. Examples of alternatives include funds that invest in real estate, commodities,
or long-short strategies. Other examples also include funds that provide solutions such
as target-date funds. Passive strategies such as ETFs and index funds have also grown
rapidly. While Artisan has a large portion of funds with a global or international
strategy, they have low exposure to strategies classified as alternative or passive.
Company Driver 1
Declining Performance Hampers Net Asset Inflows
Artisan prides itself on the ability to generate alpha on a consistent basis. The majority
of APAM’s funds have consistently outperformed peers over the long term; however
the performance for a few teams has suffered in the past few years, which has led to
asset outflows. The U.S. Value team, which represented 19.9% of total firm AUM, as
recently as April 2014, now represents 10.4% of total firm assets as of December 2015.
The three funds managed by the U.S. Value team underperformed its benchmark by an
average of 6.9% on a three-year basis and 4.5% on a five-year basis. Short term, the
value funds will face continued outflows. In the long term, an improved performance
record must be established for assets to grow.
Company Driver 2
High Percentage of Closed Funds Limit Asset Inflows
Currently, 59.3% of assets under management are in funds closed to new investors. On
February 22, the U.S Mid Cap Growth fund closes. After this date, 75% of total AUM
will be in funds closed to new investors. The remaining open funds have poor prospects
for new flow growth. Of the open funds, three have been in existence less than three
full years, and thus have not established performance records conducive to significant
asset inflows. Of the remaining four open funds, only the Global Value fund and the
Global Equity fund have outperformed their listed benchmark in the last three year or
five year time horizons.
Company Driver 3
Lack of Investment in Sales and Distribution
Artisan invests the least amount of revenue in marketing and distribution relative to its
peer group of equity focused asset managers. They only spend 5.4% of revenue on
sales and distribution compared to roughly 13% for the peer group. This is evident in
Artisan’s lack of retail presence. Retail has been growing more quickly industry wide
in the past year. Additionally, higher fees can be commanded in the retail distribution
segment. This is because institutions often invest larger volumes of assets and have
more bargaining power in fee negotiation. Institutional investors also tend to be more
patient than retail investors. Artisan has been losing assets in mutual funds at a quicker
pace than separate accounts (Figure 19). Given the performance struggles in APAM’s
open funds, it is necessary for Artisan to increase its sales and marketing presence to be
able to maintain and attract new retail clients. Many mutual fund managers charge 12b-
1 fees to assist in the selling of mutual funds to retail investors. These fees are used to
pay commission to the financial advisor who sold the product, or to assist in marketing.
Artisan does not charge these fees, which is another reason they struggle to attract retail
assets.
Financial Analysis
Revenue Analysis
Assets under management are driven by growth in organic net flows and market
appreciation. Revenue is derived by multiplying total assets under management by the
average fee level. Figure 20 shows the sensitivity of Artisan’s assets under
Figure 17: Performance of Open Funds
1 yr 3 yr 5 yr
Global Equity
Net 1.13 10.65 10.78
MSCI All Country World-2.36 7.69 6.09
Alpha 3.49 2.96 4.69
Value Equity
Net -9.10 6.26 7.54
Russell 1000 Index-3.83 13.08 11.27
Alpha -5.27 -6.82 -3.73
Global Value
Net -2.87 10.00 9.95
MSCI All Country World-2.36 7.69 6.09
Alpha -0.51 2.31 3.86
Emerging Markets
Net -12.53 -7.32 -7.81
MSCI Emerging Markets-14.92 -6.76 -3.00
Alpha 2.39 -0.56 -4.81
Source: Company Data
5.4%
25%
11% 13%
17%
6%
0%
5%
10%
15%
20%
25%
30%
Figure 18: Peer Marketing and Distribution Expense
Source: FactSet
Figure 19: Artisan Fund Assets vs. Separate Accounts
40
45
50
55
60
65
Separate Accounts Artisan Funds
Source: Company Data
Figure 20: Peer Compensation
Expense
Source: Team Analysis

7
management to organic flow growth and market appreciation. In our base case
projection, we estimate assets under management to be $102 billion in 2016 using a 2%
decline in organic asset flow growth and flat market appreciation. We project negative
asset flow growth due to Artisan’s high proportion of closed funds, declining
performance, and poor market fundamentals for equity based asset managers.
Expense Analysis
Compensation
Artisan currently has a compensation structure that pays employees much higher than
competitors. Each portfolio team earns 25% of all revenue generated through the
team’s funds. This variable structure should allow Artisan to maintain expense
flexibility in down markets. However, this 25% does not include the salaries of the
operations teams or stock based compensation. Salaries and compensation totaled
roughly 42% of revenue in 2014. However, with the addition of pre-offering equity
compensation, the total percent of revenue paid out for compensation is 50%. This
compares to an average compensation of 35% of revenue for the peer group.
Marketing and Distribution
Artisan spends much less on marketing and distribution than competitors. Despite
management priding themselves on the ability to spend less in this area than peers due
to strong brand recognition, we anticipate that in coming years Artisan will bolster
spending in attempt to improve organic investment inflows. As a result, we project
marketing and distribution expense to rise from 5.6% of revenue in 2015 to 6.6% of
revenue in 2017. We then forecast marketing and distribution to peak at 7.6% of sales
in 2023.
Capital Structure
Since 2010, Artisan’s capital structure has changed significantly (Figure 22). Prior to the
firm’s IPO in 2013, it issued $200 million in unsecured notes, which was used to repay the
principal on an existing loan. The interest rates on the loans are based on the leverage ratio
APAM Holdings maintains. Artisan’s current debt to assets is at 20%, which is significantly
higher than the industry average of 12%. Later that year, APAM entered into a $100 million
five-year revolving credit agreement in order to pay off the entire then-outstanding principal
associated with the IPO. Looking forward, Artisan Partners expects to fulfill the debt
obligation by 2023.
Quantifying the Drivers in EPS
Figure 23 on the left graphically quantifies the individual drivers for FY 2016’s diluted EPS.
Using our base case assumptions, we expect Artisan’s diluted EPS to increase from $1.71 in
2015 to $1.80 in 2016. A -2% organic growth estimate for Artisan Partners in 2016 will
deteriorate earnings by $0.15 per share. Organic net outflows in 2016 are being driven by a
combination of APAM’s large portion of soft-closed funds and its poor performing U.S
Value Funds (ARTLX, ARTQX, and ARTVX). We expect the firm’s management fees for
the year to decrease by ½ of a basis point, which subtracts another $0.06 of earnings per
share. As Artisan continues to pay off its outstanding debt, it will pay less in interest
expenses per year. We project this to add $0.30 per share, bringing FY2016 EPS to $1.80
DuPont Analysis
From 2015 to 2016, Artisan’s ROE is projected to fall from 230% to 140%. This decline is
due to a lower projected margin and asset turnover in 2016. The firm’s high leverage relative
to the industry is the driving factor in its high ROE. Artisan has an equity multiplier of 8.8
compared to an average of 1.7 for the industry. The extra leverage and Artisan’s lack of
product diversity makes returns more volatile than the industry (Figure 24).
Valuation
To derive an intrinsic value of $29 per share for APAM, a three-stage discounted free
cash flow model (including a bear, base, & bull case) and a relative valuation using
both price to earnings (P/E) and price to sales (P/S) were utilized. The use of various
valuation methods and techniques eliminated biases that could’ve occurred from the
use of just one method. Figure 25 breaks down the average weight given to each
valuation method and the dollar amount contributed from it.
Exhibit XX: Free Cash Flow to Equity
Source: Company Data
Exhibit XX: Capital Structure
Source: Industry Data
51%
41%
33%
41%
31%
12%
0%
10%
20%
30%
40%
50%
60%
Figure 21: Peer Compensation
Expense
Figure 22: Firm Capital Structure
$(400.00)
$(200.00)
$-
$200.00
$400.00
$600.00
$800.00
$1,000.00
2010 2011 2012 2013 2014 2015 2016 2017
Total Equity Class B Liability Awards LT Debt
Source: Team Analysis
Source: Team Analysis
($0.15) ($0.06)
$0.30
$1.80 $1.71
$0.00
$0.50
$1.00
$1.50
$2.00
$2.50
Figure 23: FY 2015 to FY 2016E EPS Drivers (Base Case)
Source: Company Financials
Figure 24: Three-Stage DuPont Analysis
Source: Team Analysis
Exhibit 25: Weighted Average Valuation

8
3-Stage Discounted Free Cash Flow Model
A three stage discounted free cash flow model was the primary valuation method used
to derive the intrinsic value of $33 for APAM. The main drivers of our valuation model
included fees, flows, and the terminal multiple we applied on 2023’s earnings.
Our three-stage DCF model forecasts FCFE for seven years (stage one: 2016-2017,
stage two: 2018-2023) to reflect the length of a business cycle.
AUM Fee Reductions
Artisan has consistently been able to charge above average fees compared to its
competitors (76 basis points versus an average of 68 basis points) due to the
outperformance of its funds and the level of its portfolio complexity. During a Q&A
session in January 2016, APAM’s management confirmed that the firm has no
intention to significantly reduce its fees from its current average of 76 basis points. The firm’s net outflows will continue to increase in the future if the fees are not backed by
solid alpha generation. A ½ basis point fee reduction for both stages was therefore
incorporated in the model.
Organic Growth & Market Appreciation
To demonstrate APAM’s sensitivity to organic flows growth and market appreciation,
our three-stage model was constructed to allow separate inputs for first and second
stage organic growth and first and second stage market appreciation. We assume
outflows in all first stage scenarios due to the poor performance of funds, but inflows
of 1% in the second stage. Market appreciation ranges from -7% to 7% in stage one but
remains constant at 7% in all stage two scenarios. (Figure 26).
FCFE Estimates and Terminal Value
Our forecasts for discounted FCFE per share for 2016 and 2017 are $4.71 and $3.51
respectively. The ½ basis point fee reduction is the main cause of the decline in FCFE.
For our terminal multiple, we used a P/E of 13.5x, which is significantly below its
current multiple of 15.6x, but closer to the current peer average of 12.6x. With 59.3%
of funds in a soft-closed status, a lack of product breadth, and consequently, low
prospects for organic flow growth going forward, we did not believe that a significantly
larger multiple than its peers was appropriate for Artisan.
Expected Return (Discount Rate)
Utilizing the Capital Asset Pricing Model (Figure 28), we calculated a required rate of
return of 13.25% for APAM. The asset management business is entirely dependent on
the flows and AUM, making it significantly more volatile than the market. Due to its
relatively high leverage, we believed that APAM deserved a higher beta.
Relative Valuation
Artisan Partners was valued on a relative basis using both a previously selected
competitors list of equity focused asset managers, and the asset management industry
as a whole. Due to Artisan’s limited time trading in the public market, we determined it
would not be appropriate to evaluate Artisan on a historical multiples basis. Instead we
evaluate Artisan’s current valuation relative to its peer group and industry as a whole.
Our chosen peer group for Artisan includes publicly traded asset managers that have
over 80% of their assets under management in equity holdings. Currently, the asset
management industry as a whole is trading at a premium compared to both Artisan and
its equity focused peer group. More diversified asset managers command higher
valuations because they have more exposure to different asset types and strategies with
stronger future growth prospects. Additionally, many of the larger companies in the
industry group have more diversified sources of revenue making them less volatile to
market conditions than equity asset managers. The asset management industry has a
five-year beta of 1.20 compared to a five-year beta of 1.43 for the peer group.
Figure 28: Capital Asset Pricing Model
Source: Company Data
Exhibit 27: FCFE Estimates
Exhibit 26: DCF- Bear, Base, and Bull Case
Source: Team Analysis
Figure 29: Asset Management Industry P/E vs. EPS
$-
$1
$2
$3
$4
$5
$6
$7
$8
$9
$10
0
5
10
15
20
25
Price/Earnings (Excluding Negatives) EPS
Source: Company Data

9
Source: FactSet
Source: Company Data and FactSet
P/E P/E FY 16 P/S P/S FY 16 EV/Sales Beta
Artisan Partners 15.64x 16.66x 1.77x 1.71x 2.63x 1.44x
Asset Management Industry average 14.73x N/A 2.70x N/A 5.23x 1.20x
Peer Average 12.58x 13.24x 1.90x 0.89x 1.41x 1.43x
Peer Average excluding outlier 10.95x 11.82x 1.37x 1.32x 1.21x 1.35x
GAMCO Investors (GBL) 7.81x 8.02x 1.75x 1.68x 1.30x 1.43x
Manning & Napier (MN) 5.63x 7.46x 1.81x N/A 0.01x 1.10x
Cohen & Steers (CNS) 17.94x 18.57x 4.13x 0.41x 3.62x 1.36x
Wadell & Reed (WDR) 7.73x 8.41x 1.22x 3.94x 0.88x 1.83x
Calamos Asset Management (CLMS) 23.79x 23.72x 0.71x 1.47x 1.25x 1.42x
Artisan Valuation Multiples Compared to Peers
Price to Earnings
Artisan trades at a P/E LTM of 16.6x which is higher than the peer average of 12.6x.
Since P/E has a direct relationship with earnings growth, this valuation implies that
Artisan has greater growth priced into the stock than peers. Since we project Artisan to
have asset outflows in the next two years, we believe Artisan should trade at a P/E
closer to that of peers. The fair value of APAM would be $23.80 if it traded at the peer
average P/E of 12.6x. Using our earnings estimates, Artisan trades at a 16.6 P/E on
forward year 2016 basis, which is greater than the peer average of 13.0x. Given the
slowing growth projections, we believe Artisan should trade at a P/E closer to peers.
Artisan is worth 23.40 on a forward basis if trading at the peer average P/E. For this,
reason it is reasonable for Artisan to experience.
Price to Sales
Price to sales has a direct relationship with net profit margin. Dividing the P/S multiple
by the current price finds the implied net profit margin Artisan trades at a P/S of 1.77x
compared to 1.90x for peers. However, when excluding Cohen & Steers the peer group
P/S is 1.23x. Artisan trades at a multiple higher than competitors despite having a
lower net profit of 9.6%, which is lower than the peer average of 13%. The P/S
suggests the market expects net profit margin to improve. However, given the poor
fundamentals for client flow growth and a flat expense structure, we forecast margins
to decline to 6.6% in 2016. Using this estimate a P/S FY of 1.71x is obtained at current
prices.
Investment Risks
Regulatory & Economic Risks
Regulatory Environment and Compliance
APAM is subject to comprehensive regulations from domestic and international
authorities which operate with the goal of ensuring the integrity of financial markets
and protecting customers. The financial crisis has resulted in an expansion of financial
regulations, including the Dodd-Frank Act in the United States and the European
Market Infrastructure Regulation in Europe. If APAM were to continue its international
expansion, it would be obliged to comply with international regulations and laws with
which it has little to no experience. Additional regulations and changes in
Source: Company Data
Figure X: Artisan Valuation Ratios Compared to Peer Group
Figure 30: Asset Management Industry P/S vs. Net Margin
0%
5%
10%
15%
20%
25%
0
1
2
3
4
5
Price/Sales Net Margin
Source: FactSet
Figure 31: Peer P/S vs. Net Profit Margin
Source: FactSet
0%
5%
10%
15%
20%
25%
30%
0.0x
1.0x
2.0x
3.0x
4.0x
5.0x
GBL MN CNS WDR CLMS APAM
P/S P/S FY 16 NPM NPM NTM

10
interpretations of current regulations could increase its compliance costs and the
potential for operational errors. The business costs APAM could be responsible for as a
result of systemic regulatory changes are impossible to predict or measure.
International Exposure
As of September 30, 2015, approximately 45% of APAM’s AUM were invested in
Non-U.S. companies, and approximately 42% of its AUM were invested in securities
denominated in currencies other than the U.S. dollar. This allocation exposes APAM to
a variety of uncertainties concerning political, social and economic standings.
Market Risks
Performance Expectations
APAM’s stock price is predicated on future earning potential, which is estimated on its
current ability to garner positive net flow growth. The accumulation of flows has a
well-defined, positive correlation with the past performance of individual funds. As
such, APAM’s net flows will be diminished or turn negative if a significant amount of
its funds are performing poorly relative to their benchmarks and peers. Funds may
perform poorly for reasons including, but not limited to: poor market conditions,
negative investor sentiment and investment style.
Constraints Long-Equity Positioning & Lack of Revenue Diversification
APAM’s current portfolio, with 99.1% of its AUM in long-equity holdings does not
provide flexibility in times of volatile economic conditions and poor investor
sentiment. When the general markets decline in value, it is likey that all 13 of APAM’s
long-equity funds will perform poorly, resulting in net outflows as investors look to
move their money into non-equity holdings. Additionally, the fees APAM earns are
almost entirely based on investment management fees which are calculated as a
percentage of total AUM. AUM and as a result, revenue, will be negatively impacted
with any sustained down markets.
Operational Risks
Concentration of funds
85% of APAM’s AUM are in the Non-U.S. Growth, Non-U.S Value, U.S. Mid-Cap
Growth, Global Value, and U.S. Mid-Cap Value strategies. APAM is extremely
dependent on the performance of these five strategies and the investment professionals
that run them. The combination of tenure and performance history for the investment
professionals that manage the top-five most concentrated funds generally cause clients
to attribute the success of these funds to the portfolio managers. When one of these
portfolio managers eventually leaves their position, or if one of the portfolios
underperform for a significant amount of time, clients may decide to pull their funds.
Instability of contracts
Required by law, APAM’s investment management clients are generally able to
terminate their contracts within 60 days’ of written notice. Additionally, each fund’s
agreement with its clients must be approved and renewed annually. APAM’s accounts
can be terminated for any number of reasons, resulting in an immediate reduction of
investment management fees.
Figure 33: Correlation Matrix – Last 15 Quarters
Source: Company Data, Market Data
S&P 500 AUM IM Fees
S&P 500 1 0.92 0.94
AUM 0.92 1 0.98
IM Fees 0.94 0.98 1
Source: Company Data
Figure 34: Concentration of Funds
15%
9%
14%
15%
17%
29%
0% 10% 20% 30%
Remaining 9
Funds
U.S. Mid-
Cap Value
Global Value
U.S. Mid-
Cap Growth
Non-U.S.
Value
Non-US
Growth
29%
17%
9%
8%
7%
7%
6%
3%
3%
2%
0% 10% 20% 30%
U.K.
Switzerland
Japan
China
Korea
Denmark
Netherlands
Germany
Belgium
Canada
Figure 32: Percentage of Non-U.S. Exposure
Source: Company Data, Market Data

11
Ticker Team Strategy Total AUM (as of December 31, 2015) Availability 1 Yr 3 Yr 5 Yr 10 Yr Inception
ARTIX Global Equity International $18,203 Closed 15th 57th 21st 14th 11th
ARTJX Global Equity International Small Cap $1,001 Closed 91st 6th 4th 13th 7th
ARTHX Global Equity Global Equity $331 Open 39th 27th 4th - 4th
ARTJX Global Equity Global Small Cap $138 Open 8th - - - 63rd
Ticker Team Strategy Total AUM (as of December 31, 2015) Availability 1 Yr 3 Yr 5 Yr 10 Yr Inception
ARTQX US Value Team Mid Cap Value $5,387 Closed 88th 95th 76th 37th 14th
ARTLX US Value Team Value $923 Open 82nd 95th 79th - 61st
ARTVX US Value Team Small Cap Value $396 Closed 88th 98th 99th 89th 38th
Pg Ticker Team Strategy Total AUM (as of December 31, 2015) Availability 1 Yr 3 Yr 5 Yr 10 Yr Inception
ARTRX Growth Team Mid Cap $8,737 Closed 58th 64th 45th 6th 1st
ARTRX Growth Team Global Opportunities $1,529 Open 6th 20th 5th NA 5th
ARTRX Growth Team Small Cap $1,255 Closed 25th 54th 11th 62nd 61st
Ticker Team Strategy Total AUM (as of December 31, 2015) Availability 1 Yr 3 Yr 5 Yr 10 Yr Inception
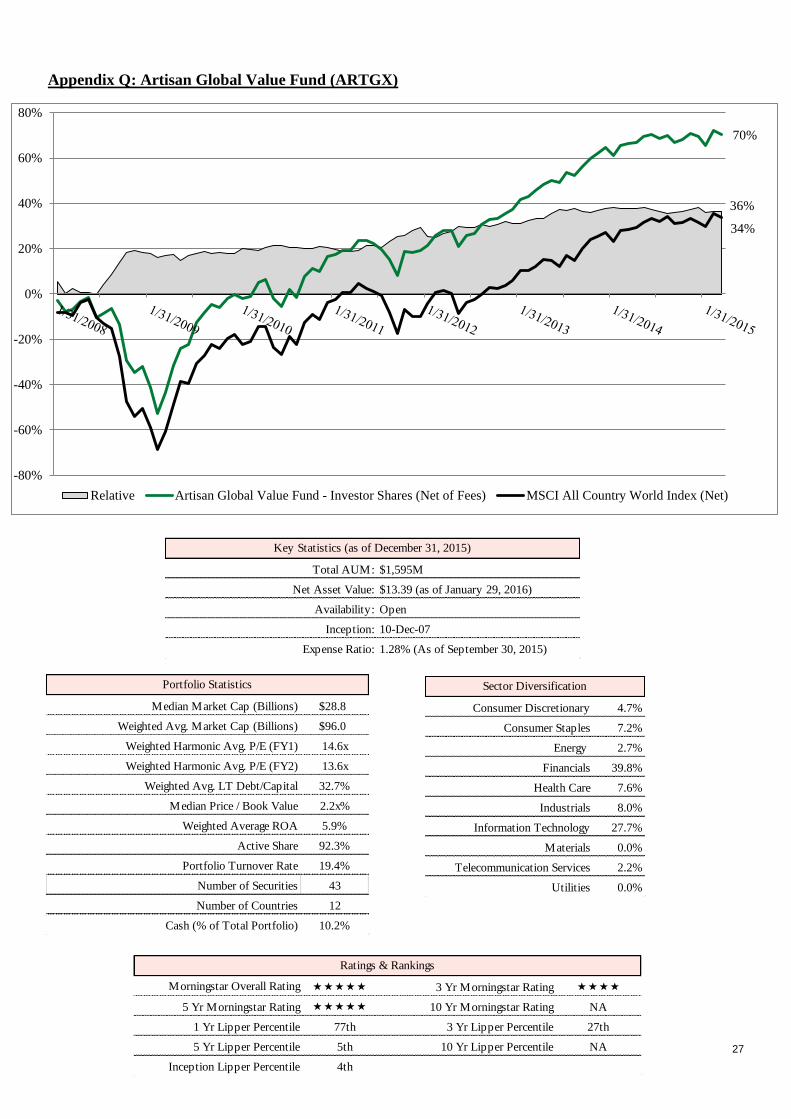
ARTKX Global Value Team International Value $10,696 Closed 40th 1st 1st 2nd 2nd
ARTX Global Value Team Global Value $1,595 Open 77th 27th 5th - 4th
Ticker Team Strategy Total AUM (as of December 31, 2015) Availability 1 Yr 3 Yr 5 Yr 10 Yr Inception
ARTFX Credit Team High Income $989 Open 4th - - - 2nd
Ticker Team Strategy Total AUM (as of December 31, 2015) Availability 1 Yr 3 Yr 5 Yr 10 Yr Inception
ARTFX Developing World Team Developing World $372 Open - - - - 2nd
Ticker Team Strategy Total AUM (as of December 31, 2015) Availability 1 Yr 3 Yr 5 Yr 10 Yr Inception
ARTZX Emerging Markets Team Emerging Markets $56 Open 36th 60th 89th - 91st
Appendix: A: Artisan Global Equity Team Management

12
Mark L. Yockey, CFA, is a managing director of Artisan Partners and a
portfolio manager on the Global Equity team. In this role, he is a portfolio
manager for the Artisan Non-U.S. Growth, Non-U.S. Small-Cap Growth,
Global Equity and Global Small-Cap Growth strategies.
Prior to joining Artisan Partners in December 1995, Mr. Yockey was the
portfolio manager of the United International Growth Fund and vice
president of Waddell & Reed from January 1990 through December 1995.
Before assuming responsibility for the United International Growth Fund,
Mr. Yockey was an analyst for Waddell & Reed from 1986 through 1989.
Mr. Yockey holds a bachelor's degree and a master’s degree in Finance from Michigan State University.
Andrew J. Euretig
Andrew J. Euretig is a managing director of Artisan Partners and a
portfolio manager on the Global Equity team. In this role, he is a portfolio
manager for the Artisan Global Equity strategy, including Artisan Global
Equity Fund, and an associate portfolio manager for the Artisan Non-U.S.
Growth strategy, including Artisan International Fund. He also conducts
research, primarily focusing on companies within the industrials sector.
Prior to joining Artisan Partners in June 2005, Mr. Euretig was a graduate
student at the University of California at Berkeley. He previously served
in the United States Navy as an amphibious operations officer. Mr.
Euretig holds a bachelor's and a master's degree in Business
Administration from the Haas School of Business at the University of
California-Berkeley.
Charles-Henri Hamker is a managing director of Artisan Partners and a
portfolio manager on the Global Equity team. He also conducts research,
primarily focusing on companies within the consumer sector.
Prior to joining Artisan Partners in August 2000, Mr. Hamker worked on
the European Equities Desk in the New York office of Banque Nationale
de Paris. Earlier in his career, he worked in the Paris and London offices
of J.P. Morgan. Mr. Hamker holds a bachelor's degree with a specialization in Finance and Economics from the European Business
School in Paris. He is fluent in French and German.
Mark L. Yockey, CFA
Charles-Henri Hamker
Appendix: B: Artisan Global Equity Team Management

13
Appendix C: Artisan International Fund(ARTIX)
95%
217%
122%
-50%
0%
50%
100%
150%
200%
250%
Relative Artisan International Fund - Investor Shares (Net of Fees) MSCI ACWI Ex USA (Net)/MSCI ACWI Ex USA (Gross) Linked Index
Total AUM: $18,203M
Net Asset Value: $26.84 (as of January 29, 2016)
Availability: Open
Inception: 28-Dec-95
Expense Ratio: 1.17% (As of September 30, 2015)
Key Statistics (as of December 31, 2015)
Consumer Discretionary 20.1%
Consumer Staples 11.7%
Energy 0.0%
Financials 10.8%
Health Care 22.6%
Industrials 10.5%
Information Technology 14.6%
Materials 7.9%
Telecommunication Services 1.6%
Utilities 0.2%
Sector Diversification
Median Market Cap (Billions) $26.2
Weighted Avg. Market Cap (Billions) $65.9
Weighted Harmonic Avg. P/E (FY1) 19.3x
Weighted Harmonic Avg. P/E (FY2) 17.4x
Weighted Avg. LT EPS Growth Rate (3-5 Yr) 13.6%
Weighted Average ROE 17.4%
Active Share 85.2%
Portfolio Turnover Rate 45.0%
Number of Securities 67
Number of Countries 19
Cash (% of Total Portfolio) 4.3%
Portfolio Statistics
Morningstar Overall Rating 3 Yr Morningstar Rating
5 Yr Morningstar Rating 10 Yr Morningstar Rating
1 Yr Lipper Percentile 91st 3 Yr Lipper Percentile 6th
5 Yr Lipper Percentile 4th 10 Yr Lipper Percentile 13th
Inception Lipper Percentile 7th
Ratings & Rankings

14
Appendix D: Artisan Global Equity Fund (ARTHX)
27%
72%
44%
-20%
0%
20%
40%
60%
80%
100%
Relative
Artisan Global Equity Fund - Investor Shares (Net of Fees)
MSCI All Country World Index (Net)
Total AUM: $331M
Net Asset Value: $14.67 (as of January 29, 2016)
Availability: Open
Inception: 29-Mar-10
Expense Ratio: 1.37% (As of September 30, 2015)
Key Statistics (as of December 31, 2015)
Median Market Cap (Billions) $25.3
Weighted Avg. Market Cap (Billions) $74.8
Weighted Harmonic Avg. P/E (FY1) 19.2x
Weighted Harmonic Avg. P/E (FY2) 17.2x
Weighted Avg. LT EPS Growth Rate (3-5 Yr) 14.1%
Weighted Average ROE 19.3%
Active Share 91.0%
Portfolio Turnover Rate 78.4%
Number of Securities 64
Number of Countries 14
Cash (% of Total Portfolio) 2.9%
Portfolio Statistics
Consumer Discretionary 22.4%
Consumer Staples 7.5%
Energy 0.0%
Financials 11.6%
Health Care 28.8%
Industrials 6.8%
Information Technology 14.8%
Materials 5.0%
Telecommunication Services 1.6%
Utilities 1.6%
Sector Diversification
Morningstar Overall Rating 3 Yr Morningstar Rating
5 Yr Morningstar Rating 10 Yr Morningstar Rating NA
1 Yr Lipper Percentile 39th 3 Yr Lipper Percentile 27th
5 Yr Lipper Percentile 4th 10 Yr Lipper Percentile NA
Inception Lipper Percentile 4th
Ratings & Rankings

15
Appendix E: Artisan International Small Cap Fund(ARTJX)
HISTORICAL MOM DATA NOT PROVIDED
-0.09%
6.70% 6.79%
-4%
-2%
0%
2%
4%
6%
8%
10%
12%
14%
Inception 10 Yr 5 Yr 3 Yr 1 Yr YTD QTD
Relative Fund: ARTJX Benchmark: MSCI EAFE Small Cap Index
Total AUM: $1,001M
Net Asset Value: $22.45 (as of January 29, 2016)
Availability: Closed to most new investors
Inception: 21-Dec-01
Expense Ratio: 1.52% (As of September 30, 2015)
Key Statistics (as of December 31, 2015)
Median Market Cap (Billions) $2.9
Weighted Avg. Market Cap (Billions) $3.2
Weighted Harmonic Avg. P/E (FY1) 24.6x
Weighted Harmonic Avg. P/E (FY2) 20.5c
Weighted Avg. LT EPS Growth Rate (3-5 Yr) 16.4%
Weighted Average ROE 15.2%
Active Share 97.2%
Portfolio Turnover Rate 43.8%
Number of Securities 38
Number of Countries 15
Cash (% of Total Portfolio) 9.3%
Portfolio Statistics
Consumer Discretionary 12.9%
Consumer Staples 17.5%
Energy 0.0%
Financials 7.7%
Health Care 8.5%
Industrials 13.7%
Information Technology 15.0%
Materials 5.4%
Telecommunication Services 15.0%
Utilities 4.2%
Sector Diversification
Morningstar Overall Rating 3 Yr Morningstar Rating
5 Yr Morningstar Rating 10 Yr Morningstar Rating
1 Yr Lipper Percentile 15th 3 Yr Lipper Percentile 57th
5 Yr Lipper Percentile 21st 10 Yr Lipper Percentile 14th
Inception Lipper Percentile 11th
Ratings & Rankings

16
Appendix F: Artisan Global Small Cap Fund (ARTWX)
Morningstar Overall Rating 3 Yr Morningstar Rating
5 Yr Morningstar Rating 10 Yr Morningstar Rating NA
1 Yr Lipper Percentile 39th 3 Yr Lipper Percentile 27th
5 Yr Lipper Percentile 4th 10 Yr Lipper Percentile NA
Inception Lipper Percentile 4th
Ratings & Rankings
-5%
14%
19%
-15%
-10%
-5%
0%
5%
10%
15%
20%
25%
30%
Relative Artisan Global Small Cap Fund (Net of Fees) MSCI All Country World Small Cap Index (Net)
Total AUM: $138M
Net Asset Value: $10.12 (as of January 29, 2016)
Availability: Open
Inception: 25-Jun-13
Expense Ratio: 1.50% (As of September 30, 2015)
Key Statistics (as of December 31, 2015)
Median Market Cap (Billions) $1.8
Weighted Avg. Market Cap (Billions) $2.3
Weighted Harmonic Avg. P/E (FY1) 22.4x
Weighted Harmonic Avg. P/E (FY2) 18.8x
Weighted Avg. LT EPS Growth Rate (3-5 Yr) 21.7%
Weighted Average ROE 9.4%
Active Share 99.1%
Portfolio Turnover Rate 89.7%
Number of Securities 48
Number of Countries 17
Cash (% of Total Portfolio) 5.1%
Portfolio Statistics
Consumer Discretionary 25.2%
Consumer Staples 7.7%
Energy 0.0%
Financials 11.8%
Health Care 14.0%
Industrials 8.8%
Information Technology 6.0%
Materials 7.8%
Telecommunication Services 12.3%
Utilities 6.4%
Sector Diversification

17
Appendix: G: Artisan Value Team Management
Portfolio Managers
George O. Sertl, CFA, is a managing director of Artisan Partners and a
portfolio manager on the U.S. Value team. In this role, he is a portfolio
manager for the Artisan Value Equity, U.S. Mid-Cap Value and U.S.
Small-Cap Value strategies, including Artisan Value, Artisan Mid Cap
Value and Artisan Small Cap Value Funds.
Prior to joining Artisan Partners in January 2000, Mr. Sertl was a research
analyst at Schwartz Investment Counsel. Mr. Sertl began his investment
career at Pauli & Company working as a research analyst in 1992. Mr.
Sertl holds a bachelor's degree in Economics and History from the
University of Richmond and a master’s degree in Economics from St.
Louis University.
Daniel Kane, CFA
Daniel L. Kane, CFA, is a portfolio manager on the U.S. Value team. In
this role, he is a portfolio manager for the Artisan Value Equity, U.S.
Mid-Cap Value and U.S. Small-Cap Value strategies.
Prior to joining Artisan Partners in March 2008, Mr. Kane was a senior
small cap investment analyst at BB&T Asset Management, Inc. from
August 2005 to March 2008. Mr. Kane began his investment career as a
domestic equities securities analyst at the State of Wisconsin Investment
Board in 1998. Mr. Kane holds a bachelor's degree in Finance from the
University of Wisconsin-Madison and a Master of Business
Administration from The University of Chicago Booth School of
Business.
Scott C. Satterwhite, CFA, is a managing director of Artisan Partners and
a portfolio manager on the U.S. Value team. In this role, he is a portfolio
manager for the Artisan Value Equity, U.S. Mid-Cap Value and U.S.
Small-Cap Value strategies.
Prior to joining Artisan Partners in June 1997, Mr. Satterwhite was senior
vice president and portfolio manager at Wachovia Corporation
responsible for management of assets of over $1.5 billion. Mr. Satterwhite
managed the Biltmore Special Values Fund from August 1993 through
May 1997.Mr. Satterwhite holds a bachelor's degree in Economics from
The University of the South and a Master of Business Administration
from Tulane University.
James C. Kieffer, CFA, is a managing director of Artisan Partners and a
portfolio manager on the U.S. Value team. In this role, he is a portfolio
manager for the Artisan Value Equity, U.S. Mid-Cap Value and U.S.
Small-Cap Value strategies.
Prior to joining Artisan Partners in August 1997, Mr. Kieffer was a
research analyst at the investment firm McColl Partners. Mr. Kieffer
began his investment career at Wachovia Corporation working with Scott
Satterwhite from 1989 to 1996, initially as a personal trust portfolio
manager and later as a general equities and small-cap value research
analyst in the institutional portfolio group. Mr. Kieffer holds a bachelor's
degree in Economics from Emory University.
George O. Sertl, CFA
Scott C. Satterwhite, CFA
James C. Kieffer, CFA

18
Appendix H: Artisan Mid Cap Value Fund (ARTQX)
4%
160%
156%
-20%
0%
20%
40%
60%
80%
100%
120%
140%
160%
180%
200%
Relative Artisan Mid Cap Value Fund - Investor Shares (Net of Fees) Russell Midcap Value Index With Dividends
Total AUM: $5,387M
Net Asset Value: $17.76 (as of January 29, 2016)
Availability: Closed to most new investors
Inception: 28-Mar-01
Expense Ratio: 1.19% (As of September 30, 2015)
Key Statistics (as of December 31, 2015)
Consumer Discretionary 17.8%
Consumer Staples 1.3%
Energy 6.8%
Financials 25.8%
Health Care 0.0%
Industrials 16.9%
Information Technology 17.3%
Materials 8.6%
Telecommunication Services 0.0%
Utilities 5.5%
Sector Diversification
Median Market Cap (Billions) $7.1
Weighted Avg. Market Cap (Billions) $10.2
Weighted Harmonic Avg. P/E (FY1) 14.3x
Weighted Harmonic Avg. P/E (FY2) 13.4x
Median Price/Book Value 1.6x
Weighted Average ROE 13.1%
Active Share 89.9%
Portfolio Turnover Rate 31.2%
Number of Securities 59
Cash (% of Total Portfolio) 7.2%
Portfolio Statistics
Morningstar Overall Rating 3 Yr Morningstar Rating
5 Yr Morningstar Rating 10 Yr Morningstar Rating
1 Yr Lipper Percentile 88th 3 Yr Lipper Percentile 95th
5 Yr Lipper Percentile 76th 10 Yr Lipper Percentile 37th
Inception Lipper Percentile 14th
Ratings & Rankings

19
Appendix I: Artisan Value Fund (ARTLX)
HISTORICAL MoM DATA NOT PROVIDED
-15%
-10%
-5%
0%
5%
10%
15%
Inception 5 Yr 3 Yr 1 Yr YTD QTD
Relative Fund: ARTLX Benchmark: Russell 1000 Value Index
Consumer Discretionary 11.4%
Consumer Staples 0.0%
Energy 12.4%
Financials 23.0%
Health Care 1.3%
Industrials 11.5%
Information Technology 24.7%
Materials 13.2%
Telecommunication Services 2.2%
Utilities 0.0%
Sector Diversification
Median Market Cap (Billions) $19.9
Weighted Avg. Market Cap (Billions) $71.2
Weighted Harmonic Avg. P/E (FY1) 13.7x
Weighted Harmonic Avg. P/E (FY2) 13.5x
Median Price/Book Value 1.7x
Weighted Average ROE 9.6%
Active Share 89.1%
Portfolio Turnover Rate 74.1%
Number of Securities 40
Cash (% of Total Portfolio) 1.1%
Non U.S. Equities (% of Total Portfolio) 16.2%
Portfolio Statistics
Morningstar Overall Rating 3 Yr Morningstar Rating
5 Yr Morningstar Rating 10 Yr Morningstar Rating NA
1 Yr Lipper Percentile 82nd 3 Yr Lipper Percentile 95th
5 Yr Lipper Percentile 79th 10 Yr Lipper Percentile NA
Inception Lipper Percentile 61st
Ratings & Rankings
Total AUM: $923M
Net Asset Value: $10.25 (as of January 29, 2016)
Availability: Open
Inception: 27-Mar-06
Expense Ratio: 1.00% (As of September 30, 2015)
Key Statistics (as of December 31, 2015)

20
Appendix J: Artisan Small Cap Value Fund (ARTVX)
8%
171%
163%
-50%
0%
50%
100%
150%
200%
250%
Relative Artisan Small Cap Value Fund - Investor Shares (Net of Fees) Russell 2000 Value Index With Dividends
Total AUM: $396M
Net Asset Value: $9.69 (as of January 29, 2016)
Availability: Closed to most new investors
Inception: 29-Sep-97
Expense Ratio: 1.26% (As of September 30, 2015)
Key Statistics (as of December 31, 2015)
Median Market Cap (Billions) $1.3
Weighted Avg. Market Cap (Billions) $1.8
Weighted Harmonic Avg. P/E (FY1) 15.8x
Weighted Harmonic Avg. P/E (FY2) 13.8x
Median Price/Book Value 1.5x
Weighted Average ROE 7.4%
Active Share 93.2%
Portfolio Turnover Rate 39.8%
Number of Securities 92
Cash (% of Total Portfolio) 10.0%
Portfolio Statistics
Consumer Discretionary 7.0%
Consumer Staples 1.8%
Energy 7.6%
Financials 16.6%
Health Care 2.9%
Industrials 37.6%
Information Technology 16.8%
Materials 7.2%
Telecommunication Services 1.1%
Utilities 1.3%
Sector Diversification
Morningstar Overall Rating 3 Yr Morningstar Rating
5 Yr Morningstar Rating 10 Yr Morningstar Rating
1 Yr Lipper Percentile 88th 3 Yr Lipper Percentile 98th
5 Yr Lipper Percentile 99th 10 Yr Lipper Percentile 89th
Inception Lipper Percentile 38th
Ratings & Rankings

21
Appendix: K: Artisan Growth Team Management
Portfolio Managers
James D. Hamel, CFA, is a managing director of Artisan Partners and a
portfolio manager on the Growth team. In this role, he is lead portfolio
manager for the Artisan Global Opportunities strategy, including Artisan
Global Opportunities Fund and portfolio manager for the Artisan U.S.
Mid-Cap Growth and U.S. Small-Cap Growth strategies, including
Artisan Mid Cap and Artisan Small Cap Funds.
Prior to joining Artisan Partners in May 1997, Mr. Hamel was a financial
associate, cost analyst and operations manager of Kimberly-Clark
Corporation from March 1990 to May 1997. He began his career at
Carlson, Posten & Associates.
Craigh A. Cepukenas, CFA
Craigh A. Cepukenas, CFA, is a managing director of Artisan Partners
and a portfolio manager on the Growth team. In this role, he is lead
portfolio manager for the Artisan U.S. Small-Cap Growth strategy,
including Artisan Small Cap Fund and portfolio manager for the Artisan
Global Opportunities and U.S. Mid-Cap Growth strategies, including
Artisan Global Opportunities and Artisan Mid Cap Funds.
Prior to joining Artisan Partners in November 1995 as an analyst, Mr.
Cepukenas was an equity research associate at Stein Roe & Farnham,
where he began his career in 1989. Mr. Cepukenas holds a bachelor’s
degree in Economics from the University of Wisconsin-Madison.
Matthew H. Kamm, CFA, is a managing director of Artisan Partners and a
portfolio manager on the Growth team. In this role, he is lead portfolio
manager for the Artisan U.S. Mid-Cap Growth strategy, including Artisan
Mid Cap Fund and portfolio manager for the Artisan Global Opportunities
and U.S. Small-Cap Growth strategies, including Artisan Global
Opportunities and Artisan Small Cap Funds.
Prior to joining Artisan Partners in May 2003, Mr. Kamm was an
associate equity research analyst at Banc of America Securities. Earlier in
his career, he was a senior operations analyst for NYU Medical Center.
Mr. Kamm holds a bachelor's degree in Public Policy from Duke
University.
Jason L. White, CFA, is a portfolio manager on the Artisan Partners
Growth team. In this role, he is a portfolio manager for the Artisan Global
Opportunities, U.S. Mid-Cap Growth and U.S. Small-Cap Growth
strategies, including Artisan Global Opportunities, Artisan Mid Cap and
Artisan Small Cap Funds.
Prior to joining Artisan Partners in June 2000, Mr. White was a
Lieutenant in the US Navy, serving aboard the USS Lake Erie as the
ship’s fire control officer. Mr. White holds a bachelor’s degree in History
from the United States Naval Academy, where he graduated with
distinction.
Jason L. White, CFA
James D. Hamel, CFA
Matthew H. Kamm, CFA

22
Appendix L: Artisan Mid Cap Fund (ARTMX)
90%
276%
186%
-50%
0%
50%
100%
150%
200%
250%
300%
Relative Artisan Mid Cap Fund - Investor Shares (Net of Fees) Russell Midcap Growth Index With Dividends
Total AUM: $8,737M
Net Asset Value: $35.75 (as of January 29, 2016)
Availability: Closed to most new investors
Inception: 27-Jun-97
Expense Ratio: 1.19% (As of September 30, 2015)
Key Statistics (as of December 31, 2015)
Median Market Cap (Billions) $11.8
Weighted Avg. Market Cap (Billions) $16.7
Weighted Harmonic Avg. P/E (FY1) 24.6x
Weighted Harmonic Avg. P/E (FY2) 22.4x
Weighted Avg. LT EPS Growth Rate (3-5 Yr) 19.7%
Weighted Avg. LT Debt/Capital 32.4%
Active Share 84.4%
Portfolio Turnover Rate 51.4%
Number of Securities 66
Cash (% of Total Portfolio) 4.5%
Portfolio Statistics
Consumer Discretionary 20.2%
Consumer Staples 3.3%
Energy 2.2%
Financials 7.3%
Health Care 24.1%
Industrials 18.7%
Information Technology 21.2%
Materials 1.4%
Telecommunication Services 1.7%
Utilities 0.0%
Sector Diversification
Morningstar Overall Rating 3 Yr Morningstar Rating
5 Yr Morningstar Rating 10 Yr Morningstar Rating
1 Yr Lipper Percentile 58th 3 Yr Lipper Percentile 64th
5 Yr Lipper Percentile 45th 10 Yr Lipper Percentile 6th
Inception Lipper Percentile 1st
Ratings & Rankings

23
Appendix M: Artisan Global Opportunities Fund (ARTRX)
Total AUM: $1,529M
Net Asset Value: $18.19 (as of January 29, 2016)
Availability: Open
Inception: 22-Sep-08
Expense Ratio: 1.19% (As of September 30, 2015)
Key Statistics (as of December 31, 2015)
Median Market Cap (Billions) $16.7
Weighted Avg. Market Cap (Billions) $97.3
Weighted Harmonic Avg. P/E (FY1) 26.6x
Weighted Harmonic Avg. P/E (FY2) 23.6x
Weighted Avg. LT EPS Growth Rate (3-5 Yr) 19.7%
Weighted Avg. LT Debt/Capital 17.0%
Active Share 93.8%
Portfolio Turnover Rate 55.5%
Number of Securities 46
Number of Countries 15
Cash (% of Total Portfolio) 8.1%
Portfolio Statistics
Consumer Discretionary 12.5%
Consumer Staples 5.5%
Energy 0.7%
Financials 11.7%
Health Care 18.6%
Industrials 11.3%
Information Technology 35.9%
Materials 2.2%
Telecommunication Services 0.0%
Utilities 1.6%
Sector Diversification
35%
93%
58%
-60%
-40%
-20%
0%
20%
40%
60%
80%
100%
120%
Relative Artisan Global Opportunities Fund - Investor Shares (Net of Fees) MSCI All Country World Index (Net)
Morningstar Overall Rating 3 Yr Morningstar Rating
5 Yr Morningstar Rating 10 Yr Morningstar Rating NA
1 Yr Lipper Percentile 6th 3 Yr Lipper Percentile 20th
5 Yr Lipper Percentile 5th 10 Yr Lipper Percentile NA
Inception Lipper Percentile 5th
Ratings & Rankings

24
Appendix N: Artisan Small Cap Fund (ARTSX)
11%
211% 201%
-50%
0%
50%
100%
150%
200%
250%
Relative Artisan Small Cap Fund - Investor Shares (Net of Fees) Russell 2000 Growth Index With Dividends
Total AUM: $1,255M
Net Asset Value: $23.79 (as of January 29, 2016)
Availability: Closed to most new investors
Inception: 28-Mar-95
Expense Ratio: 1.23% (As of September 30, 2015)
Key Statistics (as of December 31, 2015)
Median Market Cap (Billions) $2.6
Weighted Avg. Market Cap (Billions) $4.2
Weighted Harmonic Avg. P/E (FY1) 32.9x
Weighted Harmonic Avg. P/E (FY2) 28.7x
Weighted Avg. LT EPS Growth Rate (3-5 Yr) 21.4%
Weighted Avg. LT Debt/Capital 21.4%
Active Share 95.0%
Portfolio Turnover Rate 45.3%
Number of Securities 70
Cash (% of Total Portfolio) 5.0%
Portfolio Statistics
Consumer Discretionary 14.5%
Consumer Staples 1.1%
Energy 1.4%
Financials 0.0%
Health Care 23.7%
Industrials 18.9%
Information Technology 40.4%
Materials 0.0%
Telecommunication Services 0.0%
Utilities 0.0%
Sector Diversification
Morningstar Overall Rating 3 Yr Morningstar Rating
5 Yr Morningstar Rating 10 Yr Morningstar Rating
1 Yr Lipper Percentile 25th 3 Yr Lipper Percentile 54th
5 Yr Lipper Percentile 11th 10 Yr Lipper Percentile 62nd
Inception Lipper Percentile 61st
Ratings & Rankings

25
Daniel J. O’Keefe
Appendix O: Artisan Global Value Team Management
Portfolio Managers
Daniel J. O’Keefe is a managing director of Artisan Partners and founding partner
of the Global Value team.
Prior to becoming portfolio manager in 2006, Mr. O’Keefe was a research analyst
for the Artisan Partners Global Value team since its inception in 2002. Prior to
joining Artisan Partners in May 2002, Mr. O'Keefe was an analyst in international
equities at Harris Associates LP, from July 1997 through May 2002.
Under the management of Mr. O’Keefe and his co-founding partner, David Samra,
the Global Value team has been nominated five times (in 2008 and consecutively
from 2011-2014) for Morningstar, Inc.’s International-Stock Fund Manager of the
Year award in the US. The team won the award for their management efforts in
2008 for Artisan International Value Fund and in 2013 for Artisan International
Value Fund and Artisan Global Value Fund.
Mr. O’Keefe holds a bachelor’s degree in Philosophy from Northwestern University.
Prospectus
Terms & Conditions
Privacy Policy
Proxy Policies & Voting Records
N. David Samra
N. David Samra is a managing director of Artisan Partners and founding partner
of the Global Value team. Prior to joining Artisan Partners in May 2002, Mr.
Samra was a portfolio manager and a senior analyst in international equities at
Harris Associates LP, from August 1997 through May 2002. Earlier in his career,
he was a portfolio manager with Montgomery Asset Management, Global Equities
Division from June 1993 through August 1997.
Under the management of Mr. Samra and his co-founding partner, Daniel
O’Keefe, the Global Value team has been nominated five times (in 2008 and
consecutively from 2011-2014) for Morningstar, Inc.’s International-Stock Fund
Manager of the Year award in the US. Mr. Samra holds a bachelor’s degree in
Finance from Bentley College and a master’s degree in Business Administration
from Columbia Business School.

26
Appendix P: Artisan International Value Fund (ARTKX)
62%
182%
121%
-50%
0%
50%
100%
150%
200%
Relative Artisan International Value Fund - Investor Shares (Net of Fees) MSCI EAFE Value Index (Net)
Total AUM: $10,696M
Net Asset Value: $30.11 (as of January 29, 2016)
Availability: Closed to most new investors
Inception: 23-Sep-02
Expense Ratio: 1.17% (As of September 30, 2015)
Key Statistics (as of December 31, 2015)
Median Market Cap (Billions) $18.0
Weighted Avg. Market Cap (Billions) $43.4
Weighted Harmonic Avg. P/E (FY1) 15.4x
Weighted Harmonic Avg. P/E (FY2) 14.6x
Weighted Avg. LT Debt/Capital 29.9%
Median Price / Book Value 2.1x
Weighted Average ROA 8.0%
Active Share 93.9%
Portfolio Turnover Rate 23.7%
Number of Securities 42
Number of Countries 13
Cash (% of Total Portfolio) 14.5%
Portfolio Statistics
Consumer Discretionary 18.6%
Consumer Staples 9.5%
Energy 3.8%
Financials 27.8%
Health Care 6.4%
Industrials 15.2%
Information Technology 16.5%
Materials 0.0%
Telecommunication Services 2.1%
Utilities 0.0%
Sector Diversification
Morningstar Overall Rating 3 Yr Morningstar Rating
5 Yr Morningstar Rating 10 Yr Morningstar Rating
1 Yr Lipper Percentile 40th 3 Yr Lipper Percentile 1st
5 Yr Lipper Percentile 1st 10 Yr Lipper Percentile 2nd
Inception Lipper Percentile 2nd
Ratings & Rankings
27
Appendix Q: Artisan Global Value Fund (ARTGX)
36%
70%
34%
-80%
-60%
-40%
-20%
0%
20%
40%
60%
80%
Relative Artisan Global Value Fund - Investor Shares (Net of Fees) MSCI All Country World Index (Net)
Total AUM: $1,595M
Net Asset Value: $13.39 (as of January 29, 2016)
Availability: Open
Inception: 10-Dec-07
Expense Ratio: 1.28% (As of September 30, 2015)
Key Statistics (as of December 31, 2015)
Consumer Discretionary 4.7%
Consumer Staples 7.2%
Energy 2.7%
Financials 39.8%
Health Care 7.6%
Industrials 8.0%
Information Technology 27.7%
Materials 0.0%
Telecommunication Services 2.2%
Utilities 0.0%
Sector Diversification
Morningstar Overall Rating 3 Yr Morningstar Rating
5 Yr Morningstar Rating 10 Yr Morningstar Rating NA
1 Yr Lipper Percentile 77th 3 Yr Lipper Percentile 27th
5 Yr Lipper Percentile 5th 10 Yr Lipper Percentile NA
Inception Lipper Percentile 4th
Ratings & Rankings
Median Market Cap (Billions) $28.8
Weighted Avg. Market Cap (Billions) $96.0
Weighted Harmonic Avg. P/E (FY1) 14.6x
Weighted Harmonic Avg. P/E (FY2) 13.6x
Weighted Avg. LT Debt/Capital 32.7%
Median Price / Book Value 2.2x%
Weighted Average ROA 5.9%
Active Share 92.3%
Portfolio Turnover Rate 19.4%
Number of Securities 43
Number of Countries 12
Cash (% of Total Portfolio) 10.2%
Portfolio Statistics

28
Appendix R: Artisan Emerging Markets Team Management
Credit Team Portfolio Manager
Developing World Team Portfolio Manager
Emerging Markets Team Portfolio Manager
Lewis S. Kaufman, CFA
Bryan C. Krug, CFA, is a managing director of Artisan Partners and a
portfolio manager on the Credit team. In this role, he is the portfolio
manager for the Artisan High Income Strategy, including Artisan High
Income Fund
Prior to joining Artisan Partners in December 2013, Mr. Krug was the
portfolio manager of Ivy High Income Fund at Waddell & Reed from
February 2006 to November 2013. Mr. Krug joined Waddell & Reed in
2001 as a high yield investment analyst and was later promoted to
portfolio manager. Earlier in his career, he was affiliated with Pacholder
Associates as the primary analyst for a distressed portfolio. Mr. Krug
holds a bachelor’s degree in Finance from Miami University, Richard T.
Farmer School of Business.
Lewis S. Kaufman, CFA
Lewis S. Kaufman, CFA, is a managing director of Artisan Partners and
founding portfolio manager of the Developing World team. Prior to
joining Artisan Partners in February 2015, Mr. Kaufman was a managing
director and portfolio manager for Thornburg Investment Management,
where he managed the Developing World Strategy from its inception in
2009 through January 2015. Mr. Kaufman also co-managed the
International ADR Strategy from 2007 to 2013, after joining Thornburg in
2005 as an associate portfolio manager. Prior to joining Thornburg, Mr.
Kaufman held various investment-related positions with Morgan Stanley
and Citigroup. Mr. Kaufman graduated cum laude with a bachelor's
degree in English from Colgate University and holds a master's degree in
Business Administration from Duke University Fuqua School of
Business. Lewis S. Kaufman, CFA
Lewis S. Kaufman, CFA, is a managing director of Artisan Partners and
founding portfolio manager of the Developing World team. Prior to
joining Artisan Partners in February 2015, Mr. Kaufman was a managing
director and portfolio manager for Thornburg Investment Management,
where he managed the Developing World Strategy from its inception in
2009 through January 2015. Mr. Kaufman also co-managed the
International ADR Strategy from 2007 to 2013, after joining Thornburg in
2005 as an associate portfolio manager. Prior to joining Thornburg, Mr.
Kaufman held various investment-related positions with Morgan Stanley
and Citigroup. Mr. Kaufman graduated cum laude with a bachelor's
degree in English from Colgate University and holds a master's degree in
Business Administration from Duke University Fuqua School of
Business.
Maria-Negrete-Gruson, CFA
Maria Negrete-Gruson, CFA, is a managing director of Artisan Partners
and a portfolio manager on the Emerging Markets team.
Prior to joining Artisan in April 2006, Ms. Negrete-Gruson was the
portfolio manager for DuPont Capital Management's emerging markets
equity portfolios. Before assuming responsibilities as portfolio manager,
she was an international equity analyst at DuPont covering the developed
Asia-ex Japan region. Earlier in her career, she was a foreign exchange
trader for Banco Ganadero in Bogotá, Colombia. Ms. Negrete-Gruson
holds a bachelor's degree in Finance and International Relations from
Universidad Externado in Colombia and a Master of Business
Administration from Columbia Business School. She is fluent in Spanish
and Portuguese.

29
Appendix S: Artisan High Income Fund
8%
3%
-5%
-6%
-4%
-2%
0%
2%
4%
6%
8%
10%
Relative
Artisan High Income Fund - Investor Shares (Net of Fees)
BofA Merrill Lynch U.S. High Yield Master II Total Return Index
Total AUM: $989
Net Asset Value: $9.01 (as of January 29, 2016)
Availability: Open
Inception: 19-Mar-14
Expense Ratio: 0.93% (As of September 30, 2015)
Key Statistics (as of December 31, 2015)
< 1 year 0.0%
1 - <3 years 0.07%
3 - <5 years 13.4%
5 - <7 years 54.3%
7 - <10 years 27.7%
10+ years 3.9%
Maturity Distribution
Number of Securities 94
Number of Issuers 66
Active Share 7.82%
Active Share 8.06%
Portfolio Statistics
BBB 6.8%
BB 4.9%
B 4.7%
CCC 4.5%
D 4.3%
Unrated 3.6%
Credit Quality

30
Appendix T: Artisan Developing World Fund (ARTYX)
4.5%
-12.1%
-16.6%
-20%
-15%
-10%
-5%
0%
5%
10%
Relative Artisan Developing World Fund - Investor Shares (Net of Fees) MSCI Emerging Markets Index (Net)
Total AUM: $372M
Net Asset Value: $8.30 (as of January 29, 2016)
Availability: Open
Inception: 29-Jun-15
Expense Ratio: 1.50% (As of September 30, 2015)
Key Statistics (as of December 31, 2015)
Median Market Cap (Billions) $9.3
Weighted Avg. Market Cap (Billions) $47.3
Weighted Avg. LIT EPS Growth Rate (3-5 Yr) 17.1%
Weighted Avg. LT Debt/Capital 24.4%
Median Price / Book Value 5.2x
Active Share 91.1%
Number of Securities 53
Number of Countries 24
Cash (% of Total Portfolio) 10.3%
Portfolio Statistics
Consumer Discretionary 27.8%
Consumer Staples 14.0%
Energy 0.0%
Financials 20.3%
Health Care 5.5%
Industrials 7.0%
Information Technology 23.5%
Materials 0.0%
Telecommunication Services 1.9%
Utilities 0.0%
Sector Diversification
Morningstar Overall Rating NA 3 Yr Morningstar Rating NA
5 Yr Morningstar Rating NA 10 Yr Morningstar Rating NA
1 Yr Lipper Percentile NA 3 Yr Lipper Percentile NA
5 Yr Lipper Percentile NA 10 Yr Lipper Percentile NA
Inception Lipper Percentile NA
Ratings & Rankings

31
Appendix U: Artisan Emerging Markets Fund (ARTZK)
-17%
39%
56%
-40%
-20%
0%
20%
40%
60%
80%
100%
Relative Artisan Emerging Markets Fund - Investor Shares Linked (Net of Fees) MSCI Emerging Markets Index (Net)
Total AUM: $56M
Net Asset Value: $9.87 (as of January 29, 2016)
Availability: Open
Inception: 2-Jun-08
Expense Ratio: 1.50% (As of September 30, 2015)
Key Statistics (as of December 31, 2015)
Median Market Cap (Billions) $6.8
Weighted Avg. Market Cap (Billions) $26.8
Weighted Harmonic Avg. P/E (FY1) 13.3x
Weighted Harmonic Avg. P/E (FY2) 12.1x
Weighted Avg. LT EPS Growth Rate (3-5 Yr) 14.4%
Weighted Average ROE 18.1%
Median Price / Book Value 1.8x
Active Share 78.1%
Portfolio Turnover Rate 28.0%
Number of Securities 88
Number of Countries 27
Cash (% of Total Portfolio) 2.6%
Portfolio Statistics
Consumer Discretionary 15.6%
Consumer Staples 5.8%
Energy 6.4%
Financials 23.7%
Health Care 8.0%
Industrials 5.7%
Information Technology 23.6%
Materials 6.2%
Telecommunication Services 2.8%
Utilities 2.1%
Sector Diversification
Morningstar Overall Rating 3 Yr Morningstar Rating
5 Yr Morningstar Rating 10 Yr Morningstar Rating NA
1 Yr Lipper Percentile 36th 3 Yr Lipper Percentile 60th
5 Yr Lipper Percentile 89th 10 Yr Lipper Percentile NA
Inception Lipper Percentile 91st
Ratings & Rankings

32
Appendix V: Monthly Assets under Management by Fund
April '14 May'14 June '14 July '14 August '14 Sept '14 Oct. '14 Nov. '14 Dec. '14 Jan. '15 Feb. '15 March '15 April '15 May'15 June '15 July '15 August '15 Sept '15 Oct. '15 Nov. '15 Dec. '15
Non-U.S. Growth Closed 27464 28295 29121 28411 28740 28069 28669 29808 29392 30254 31213 31470 32289 32939 32348 32274 29683 28178 30396 30872 30187
% of Total 25.7% 25.9% 26.0% 26.1% 25.7% 26.4% 26.5% 27.2% 27.2% 28.4% 28.3% 29.2% 29.3% 29.5% 29.6% 29.7% 29.2% 29.1% 29.4% 30.1% 30.2%
Non-U.S. Small Cap Growth Closed 1699 1683 1665 1526 1497 1413 1385 1337 1247 1251 1293 1289 1425 1413 1372 1321 1263 1254 1334 1324 1323
% of Total 1.6% 1.5% 1.5% 1.4% 1.3% 1.3% 1.3% 1.2% 1.2% 1.2% 1.2% 1.2% 1.3% 1.3% 1.3% 1.2% 1.2% 1.3% 1.3% 1.3% 1.3%
Global Equity Team Open 316 322 328 326 674 653 682 695 680 682 723 716 741 763 762 801 750 718 764 782 786
% of Total 0.3% 0.3% 0.3% 0.3% 0.6% 0.6% 0.6% 0.6% 0.6% 0.6% 0.7% 0.7% 0.7% 0.7% 0.7% 0.7% 0.7% 0.7% 0.7% 0.8% 0.8%
Global Small Cap Open 164 177 186 177 180 166 169 163 133 129 126 126 141 146 143 142 133 130 136 136 138
% of Total 0.2% 0.2% 0.2% 0.2% 0.2% 0.2% 0.2% 0.1% 0.1% 0.1% 0.1% 0.1% 0.1% 0.1% 0.1% 0.1% 0.1% 0.1% 0.1% 0.1% 0.1%
U.S. Mid-Cap Value Closed 15467 15563 15802 15191 15548 14627 14403 14155 13740 13076 13389 12881 12476 12213 11532 10774 9903 9211 9429 8774 7959
% of Total 14.5% 14.2% 14.1% 14.0% 13.9% 13.8% 13.3% 12.9% 12.7% 12.3% 12.1% 12.0% 11.3% 10.9% 10.6% 9.9% 9.8% 9.5% 9.1% 8.6% 8.0%
U.S. Small-Cap Value Closed 3780 3696 3593 3570 3266 2852 2834 2634 2414 2077 2018 1533 1525 1502 1297 1092 1059 1002 968 937 854
% of Total 3.5% 3.4% 3.2% 3.3% 2.9% 2.7% 2.6% 2.4% 2.2% 2.0% 1.8% 1.4% 1.4% 1.3% 1.2% 1.0% 1.0% 1.0% 0.9% 0.9% 0.9%
Value Equity Open 2046 2199 2154 2106 2176 2067 2040 2024 1958 1863 1920 1829 1803 2233 2060 1971 1884 1586 1728 1677 1556
% of Total 1.9% 2.0% 1.9% 1.9% 1.9% 1.9% 1.9% 1.8% 1.8% 1.8% 1.7% 1.7% 1.6% 2.0% 1.9% 1.8% 1.9% 1.6% 1.7% 1.6% 1.6%
Total Team AUM 21293 21458 21549 20867 20990 19546 19277 18813 18112 17016 17327 16243 15804 15948 14889 13837 12846 11799 12125 11388 10369
Team % 19.9% 19.6% 19.2% 19.2% 18.7% 18.4% 17.8% 17.2% 16.8% 16.0% 15.7% 15.1% 14.3% 14.3% 13.6% 12.7% 12.7% 12.2% 11.7% 11.1% 10.4%
U.S. Mid- Cap Growth Closed 15936 16193 16713 15999 16775 16094 16826 16953 16634 16320 16986 16898 16691 16607 16552 16925 15820 15019 15615 15628 15103
% of Total 14.9% 14.8% 14.9% 14.7% 15.0% 15.2% 15.6% 15.5% 15.4% 15.3% 15.4% 15.7% 15.2% 14.9% 15.2% 15.6% 15.6% 15.5% 15.1% 15.3% 15.1%
U.S. Small Cap Growth Closed 2669 2694 2894 2644 2762 2624 2734 2731 2744 2629 2726 1651 2551 2508 2493 2492 2365 2259 2333 2353 2270
% of Total 2.5% 2.5% 2.6% 2.4% 2.5% 2.5% 2.5% 2.5% 2.5% 2.5% 2.5% 1.5% 2.3% 2.2% 2.3% 2.3% 2.3% 2.3% 2.3% 2.3% 2.3%
Global Opportunities Strategy Open 3002 3203 3885 3995 4225 4127 4737 4832 5121 5146 5447 5515 6041 6600 6661 6800 6442 6459 7127 7396 7556
% of Total 2.8% 2.9% 3.5% 3.7% 3.8% 3.9% 4.4% 4.4% 4.7% 4.8% 4.9% 5.1% 5.5% 5.9% 6.1% 6.3% 6.3% 6.7% 6.9% 7.2% 7.6%
Non-U.S. Value Closed 17450 17938 18298 17800 17898 17046 17158 17268 16872 16713 17491 17326 17713 17886 17588 17608 16640 16016 17210 16508 16257
% of Total 16.3% 16.4% 16.3% 16.4% 16.0% 16.1% 15.9% 15.8% 15.6% 15.7% 15.8% 16.1% 16.1% 16.0% 16.1% 16.2% 16.4% 16.5% 16.6% 16.1% 16.3%
Global Value Open 15230 15638 15811 15510 16639 14977 15146 15508 15609 14893 15648 15186 15366 15389 15007 15050 14099 13573 14559 14221 13925
% of Total 14.3% 14.3% 14.1% 14.2% 14.9% 14.1% 14.0% 14.2% 14.5% 14.0% 14.2% 14.1% 14.0% 13.8% 13.7% 13.8% 13.9% 14.0% 14.1% 13.9% 13.9%
Emerging Markets Open 1310 1321 1237 1223 1147 984 858 859 806 798 773 629 683 653 623 597 547 533 600 589 571
% of Total 1.2% 1.2% 1.1% 1.1% 1.0% 0.9% 0.8% 0.8% 0.7% 0.7% 0.7% 0.6% 0.6% 0.6% 0.6% 0.5% 0.5% 0.5% 0.6% 0.6% 0.6%
High Income Open 203 293 311 387 461 505 537 542 565 590 629 674 691 706 726 783 829 912 964 999 989
% of Total 0.2% 0.3% 0.3% 0.4% 0.4% 0.5% 0.5% 0.5% 0.5% 0.6% 0.6% 0.6% 0.6% 0.6% 0.7% 0.7% 0.8% 0.9% 0.9% 1.0% 1.0%
Developing World Open 0 0 0 0 0 0 0 0 0 0 0 0 0 0 10 44 69 118 203 278 374
% of total 0.0% 0.0% 0.0% 0.0% 0.0% 0.0% 0.0% 0.0% 0.0% 0.0% 0.0% 0.0% 0.0% 0.0% 0.0% 0.0% 0.1% 0.1% 0.2% 0.3% 0.4%
Total Team 0 0 0 0 0 0 0 0 0 0 0 0 0 0 10 44 69 118 203 278 374
Total AUM 106736 109215 111998 108865 111988 106204 108178 109509 107915 106421 110382 107723 110136 111558 109174 108674 101486 96968 103366 102474 99848
Global Value
Open/Closed Monthly Assets Under Management
Growth Team
U.S. Value Team
Emerging Markets
Credit Team
Developing World
Global Equity Team

33
2008 2009 2010 2011 2012 2013 2014 2015
Assets Under Management 30577 46788 57459 57104 74334 105477 107915 99848
Growth 53.0% 22.8% -0.6% 30.2% 41.9% 2.3% -7.5%
Net Client Cash Flows -1783 2556 3410 1960 5813 7178 788 -6623
Growth 8% 7% 3% 10% 10% 1% -6.1%
% of AUM -5.8% 5.5% 5.9% 3.4% 7.8% 6.8% 0.7% -6.6%
Appendix X: Total Firm Assets Under Management and Net Client Flows

34
NET FLOWS
Q1 Q2 Q3 Q4 Q1 Q2 Q3 Q4 Q1 Q2 Q3 Q4
Beginning AUM 20092 22082 22189 24761 27317 28604 31300 30301 31452 33601 36774 32429
Net Client Flows 632 32 343 653 1643 1200 596 839 930 1974 194
Market Appreciation (Depreciation) 1358 75 2229 1903 -356 1496 -1595 313 1219 1199 -4539
Ending AUM 22082 22189 24761 27317 28604 31300 30301 31452 33601 36774 32429 32429
Beginning AUM 16722 19248 19582 21421 23024 22051 21549 22701 21267 19398 16175 13085
Net Client Flows 192 98 390 38 -1313 -1106 839 -1705 -2141 -3268 -1636
Market Appreciation (Depreciation) 2334 236 1449 1565 340 604 313 271 272 45 -1454
Ending AUM 19248 19582 21421 23024 22051 21549 22701 21267 19398 16175 13085 13085
Beginning AUM 14692 16893 17766 21044 22503 23414 23605 22957 23440 24005 25212 23243
Net Client Flows 841 394 559 156 492 156 -101 1929 -402 -509 113
Market Appreciation (Depreciation) 1336 503 2719 1303 419 -12 -547 -1446 967 1716 -2082
Ending AUM 16869 17790 21044 22503 23414 23605 22957 23440 24005 25212 23243 23243
Beginning AUM 19886 23214 24659 27976 30887 31925 34039 31953 32411 32442 32556 29550
Net Client Flows 1651 900 781 663 893 239 -240 -67 -524 -683 -324
Market Appreciation (Depreciation) 1677 545 2536 2248 286 1781 -1809 488 555 797 -2682
Ending AUM 23214 24659 27976 30887 31925 34039 31953 32411 32442 32556 29550 29550
Beginning AUM 2942 1765 1595 1729 1746 1327 1237 984 806 629 446 356
Net Client Flows -1130 -10 24 -29 -378 -160 -211 -148 -182 -192 27
Market Appreciation (Depreciation) -47 -160 110 46 -41 70 -42 -30 5 9 -117
Ending AUM 1765 1595 1729 1746 1327 1237 984 806 629 446 356 356
Emerging Markets
Global Value
Growth Team
U.S. Value Team
Global Equity Team
2013 2014 2015
Appendix Y: Net Client Flows by Fund Team

35
2013 2014 2015
Q1 Q2 Q3 Q4 Q1 Q2 Q3 Q4 Q1 Q2 Q3
Artisan Funds
Beginning AUM 39603 45684 47518 54489 59881 62475 64816 65902 65192 65584 65802
Net Client Flows 2348 1352 1921 1508 2324 303 2014 -1580 -1254 -1852 -2520
Market Appreciation (Depreciation) 3733 533 5061 3884 305 2217 -554 1128 1799 2070 -4108
Ending AUM 45684 47518 54489 59881 62475 64816 65902 65192 65584 65802 58916
Separate Account
Beginning AUM 34731 37494 38273 42431 45585 44911 47214 46897 49276 49692 50733
Net Client Flows -162 62 176 -27 -911 255 -688 1042 -974 -680 -1313
Market Appreciation (Depreciation) 2925 666 3982 3181 343 1728 34 1043 1237 1721 -3006
Ending AUM 37494 38273 42431 45585 44911 47214 46897 49276 49692 50733 46672
Total Client Flows -2510 -1290 -1745 -1535 -3235 -48 -2702 2622 280 1172 1207
Appendix Z: Net Client Flows for Artisan Funds and Separate Accounts

36
Appendix AA: SWOT Analysis
Strengths:
1.) Autonomous Structure: Artisan Partners consists of 7 autonomous teams, which implement 15 distinct strategies. The autonomous
structure allows for the company to maintain a “boutique” type structure, which allows for more independence among strategies and originality
in research. Each strategy doesn’t need to handle its own business operations, which allows for the portfolio manager and his or her team to
focus on higher quality research and outperforming the market.
2.) Expense flexibility: During a meeting with company management, Charles Daley, APAM’s CFO, mentioned that 65% of the company’s
expenses are variable. Since revenue is based off of fees on AUM, the majority of the company’s compensation structure is based off of the
previous quarter’s revenues. This offers protection for the company during periods of AUM outflows.
3.) Strong Fund Ratings: Out of Artisan’s 15 strategies, 12 have been rated by Morningstar, 7 of which maintain a rating of 4 or higher.
Two funds were upgraded during 2015: The U.S Small Cap Growth, which was upgraded from three to four stars, and the Emerging Markets
Strategy, which was upgraded from one to two stars.
Weaknesses:
1.) Closed Funds: To protect performance, Artisan will, from time to time, close a fund and restrict new outside investment. As of
February 2016, 75.2% of the company’s AUM is invested in closed funds. This severely restricts any sort of growth potential for the company,
as the only way to increase its AUM in a closed fund is through market appreciation.
2.) Lack of Diversification: Artisan Partners employs a long only strategy, comprised of 99% equity. Post-recession, this strategy has
proven to work remarkably. In 2011, Scott Satterwhite, Jim Kieffer, and George Sertl of the U.S. Value team won Morningstar’s Domestic
manager of the Year award. Since then, the value team has underperformed the market, with the Artisan Value Fund and U.S. Small-Cap Value
Fund underperforming since 2012 and the U.S. Mid-Cap Value Fund underperforming since 2011, with the exception of a slight outperformance
in 2013. When a strategy, or the market as a whole, is out of favor, Artisan doesn’t have a way to combat this; they simply need to ride out the
cycle.
3.) Heavily Weighted in Institutional Distribution: At 61%, institutional investors comprise the largest portion of APAM’s
distribution mix. Compared to the industry average of 37%, Artisan is at a disadvantage to benefit from the recent surge in retail flows.
Considering that retail fees are higher than institutional, this is a field that Artisan should be playing in.
Opportunities:
1.) Alternative Investments: Alternative investments, which include private equity, real estate, hedge funds, etc., perform with a low
correlation to traditional investments, such as stocks and bonds. As a result, premium fees are charged on alternative investments. In 2013, 30%
of the industry’s revenues came from alternatives, even though they only made up 12% of the industry’s assets. Alternatives have been a strong
area of growth in this industry over the last ten years. From 2005 to 2013, AUM in alternative investments has grown at a compound annual rate
of 9.4%.
2.) Asia-Pacific Region: In 2014, this region, excluding Japan, overtook Europe to become the world’s second wealthiest nation. The
Boston Consulting Group reports that this region is expected to surpass North America as the wealthiest region in the world in 2016. Asia-
Pacific has three of the world’s most populous regions, which make up about 56% of the world’s population. However, Asia-Pacific only
represents about 15% of global AUM. This is obviously an underserved market, which should get more attention from asset management firms
in the coming decade.
Threats:
1.) Passive Investing: Indexing strategies and ETFs have grown significantly over the past 15 years, and have consequently gained market
share at the expense of active management strategies. This is a result of active managers charging much higher fees than passive strategies, while
often times failing to outperform the benchmark. Only 18% of active large-cap funds beat the market on a 10 year basis at the end of 2014. If
this trend continues, active asset management will see a period of firm consolidation.
2.) Unforeseen withdrawals: Management fees make up 99% of the firm’s revenues. All of these relationships, however, are terminable by
clients upon short or no notice. While it is unlikely that several institutional clients will pull their money out at once, even a couple doing so
could have a material impact on the firm’s revenues.

37
Appendix AB: Porter’s 5 Forces
Negotiating Power of Buyers: High
Since mutual funds are a pool of assets broken into smaller pieces, they are required by law to offer investors of the same pool the same fee
structure. This is not the case, however, for institutional clients. In fact, because of the massive account size of institutional investors, they are
often able to negotiate the terms of their contracts. During a time when active management fees have been feeling the pressures of passive
management strategies, institutional clients have been adding to the pressure by negotiating lower fees.
Negotiating Power of Suppliers: Low
Supplier power has been under increasing pressure due to the rising popularity of lower fee index funds. Thus, only managers that have a
consistent record of alpha generation are able to justify a fee above the industry average. The threat of passive management will continue to
erode at the negotiation power of suppliers over time. Suppliers that offer products not easily replicated by passive strategies have considerably
more negotiating power than the rest of the industry.
Threat of New Entrants: Medium
The asset management industry is highly regulated, requiring complete legal compliance from all firms. With the legal fees and all other
expenses associated with starting an asset management firm makes the industry quite capital intensive. While building assets under management
and creating a strong track record, it’s common for start-up asset management firms to generate very little revenue for the first few years. To
generate average revenues while charging industry competitive fees, tens of millions of dollars of assets under management are required.
Threat of Substitutes: High
Artisan Partners and other active management strategies have been feeling the pressure of low fee, passive management strategies. This theme
has been developing over the past decade, as fewer active management strategies have been able to beat the market. In fact, only 18% of active
large-cap funds beat the market on a 10-year basis at the end of 2014. Poor active management performance, combined with reduced operating
costs and fees, have led to passive management funds taking a significant share of the market.
Industry Rivalry: High
The performance driven nature of the industry makes competition fierce between industry competitors. In general, firms that have the best
performance relative to peers are able to grow organic assets the fastest. Additionally, all asset managers compete for the same finite pool of
applicable assets. To gain market share an asset manager needs a combination of the following: superior relative performance, effective
distribution channels, brand recognition, product diversity, or competitive fees.

38
Appendix AC: APAM’s Organizational Structure as of December 31, 2014
On March 9, 2015, APAM issued 3,381,550 shares of Class A common stock and used the proceeds to purchase 3,831,550 common units of Artisan Partners Holdings.
During the nine months ended September 30, 2015, limited partners of Artisan Partners Holdings exchanged 805,238 Holdings units for 805,238 shares of common stock. APAM received 805,238 GP units of Artisan Partners Holdings in the exchange.
As a result, APAM’s equity ownership interest in Artisan Partners Holdings increased from 47% at December 31, 2014 to 54% at September 30, 2015.

39
Appendix AD: Discounted Cash Flow Model

40
Appendix AE: Financial Statements First Stage

41
Appendix AF: Financial Statements Second Stage

42
Disclosures: Ownership and material conflicts of interest:
The author(s), or a member of their household, of this report does not hold a financial interest in the securities of this company. The author(s), or a member of their household, of this report does not know of the existence of any conflicts of interest that might bias the content or publication of this report. Receipt of compensation:
Compensation of the author(s) of this report is not based on investment banking revenue. Position as a officer or director:
The author(s), or a member of their household, does not serve as an officer, director or advisory board member of the subject company. Market making:
The author(s) does not act as a market maker in the subject company’s securities. Disclaimer:
The information set forth herein has been obtained or derived from sources generally available to the public and believed by the author(s) to be reliable, but the author(s) does not make any representation or warranty, express or implied, as to its accuracy or completeness. The information is not intended to be used as the basis of any investment decisions by any person or entity. This information does not constitute investment advice, nor is it an offer or a solicitation of an offer to buy or sell any security. This report should not be considered to be a recommendation by any individual affiliated with CFA Society Madison, CFA Institute or the CFA Institute Research Challenge with regard to this company’s stock.
CFA Institute Research Challenge