uvm big data? aggregating campus databases and creating a
TRANSCRIPT

University of Vermont University of Vermont
ScholarWorks @ UVM ScholarWorks @ UVM
UVM Honors College Senior Theses Undergraduate Theses
2015
UVM Big Data? Aggregating Campus Databases and Creating a UVM Big Data? Aggregating Campus Databases and Creating a
Data Warehouse to Improve Student Retention Rates at the Data Warehouse to Improve Student Retention Rates at the
University of Vermont University of Vermont
Emily Bates University of Vermont
Follow this and additional works at: https://scholarworks.uvm.edu/hcoltheses
Recommended Citation Recommended Citation Bates, Emily, "UVM Big Data? Aggregating Campus Databases and Creating a Data Warehouse to Improve Student Retention Rates at the University of Vermont" (2015). UVM Honors College Senior Theses. 86. https://scholarworks.uvm.edu/hcoltheses/86
This Honors College Thesis is brought to you for free and open access by the Undergraduate Theses at ScholarWorks @ UVM. It has been accepted for inclusion in UVM Honors College Senior Theses by an authorized administrator of ScholarWorks @ UVM. For more information, please contact [email protected].
1
UVM Big Data? Aggregating Campus Databases and Creating a Data
Warehouse to Improve Student Retention Rates at the University of Vermont
Undergraduate Honors Thesis in Management Information Systems
University of Vermont, School of Business Administration
Burlington, VT, USA
Emily Bates, Bachelor of Science in Business Administration
May 2015
2
TABLE OF CONTENTS
ABSTRACT ............................................................................................................................................. 3
FIGURES AND TABLES ...................................................................................................................... 4
INTRODUCTION ................................................................................................................................... 5
DATABASE AND DATA WAREHOUSE TERMINOLOGY ........................................................... 8
STUDENT DATA AT UVM ................................................................................................................ 11
STUDENT RETENTION AT UVM .................................................................................................... 13
DATA WAREHOUSES AT OTHER ACADEMIC INSTITUTIONS ............................................ 17
PREPARING FOR A DATA WAREHOUSE AT UVM ................................................................... 19
DATA WAREHOUSE DESIGN AND SCHEMA ............................................................................. 22
FINANCIAL AND LOGISTICAL CONSIDERATIONS ................................................................. 29
OPPORTUNITIES FOR EXPANSION .............................................................................................. 31
RISKS AND OBSTACLES .................................................................................................................. 32
CONCLUSIONS AND DISCUSSIONS .............................................................................................. 33
REFERENCES ...................................................................................................................................... 35

3
ABSTRACT
One of the biggest concerns of universities across the United States is the student retention rate.
Because it is much more cost effective to keep an existing student enrolled than to enroll a new student,
improving a university’s retention rate translates to a saving in costs for that institution. UVM’s first-year
retention rate is currently 85.8%, which places them above many other public universities, but below most
of UVM’s aspirant schools. UVM conducted a study in 2011 in an effort to determine causes of students
leaving after their first year, but retention rates since the study have only marginally increased. Some
universities have been using data mining techniques to determine factors correlated with student retention,
such as living off campus or an income level below the poverty line. This thesis recommends that UVM
create a data warehouse aggregating all student-related data from across campus in an attempt to improve
student retention. There is currently no central repository of student-related data from sources such as
Residential Life, Blackboard, Student Health Services, and Undergraduate Admissions. Data mining
techniques could be used with this data warehouse to discover patterns between different fields of data
and a student’s likelihood to withdraw from UVM. For example, what if there is a correlation between a
student’s dorm view room and their likelihood to leave UVM? How does a student’s frequency of
Blackboard use impact their chance of staying enrolled? This thesis explores the technical and logistical
considerations involved in a large data warehousing project. While building a data warehouse may seem
operationally daunting, the insights it could generate would be very beneficial for decision support for
many years.

4
FIGURES AND TABLES
FIGURES
Figure 1. Data Warehouse Diagram……………………………………………………………………......9
Figure 2. Star Schema Diagram…………………………………………………………………………...11
Figure 3. UVM Data Sources Across Campus……………………………………………………………12
Figure 4. Example of Data Cleansing………………………………………………………………….….22
Figure 5. Entity-Relationship Diagram……………………………………………………………………28
TABLES
Table 1. Student Retention Rates at UVM’s Peer and Aspirant Universities…………………….……….14
Table 2. Preliminary List of Student-Related Data Sources…………………………………………...….20
Table 3. Data Fields to be Included in the Data Warehouse……………………………………………....23
Table 4. Costs Related to a Data Warehouse Solution……………………………………………………29

5
INTRODUCTION
One of the biggest concerns of universities across the United States is the student retention rate.
Keeping first-year students coming back for their second year of college can have a significant impact on
the financial state of the institution. It is much more cost effective for a university to keep an existing
student enrolled than to enroll a new student; in other words, improving a university’s retention rate
translates to a saving in costs for that institution (Culver). While most universities have historically
focused a big portion of their budget on admissions (Raisman), many educational institutions are now
shifting their focus to maintaining their enrollment.
The retention rate at the University of Vermont (UVM) for first-time, first-year students after one
year is approximately 85.8 percent (“Retention Rates”). Compared to the national average for public four-
year institutions, 64.2 percent (“2014 Retention/Completion”), UVM’s retention rate seems promising;
but compared to some higher-ranked public universities, improvements could be made. Boosting student
retention is not only a cost-saving measure for a university - it also influences the school’s rank on lists
released by the U.S. News & World Report and other distinguished organizations.
UVM is currently working to improve its retention rate, and has set a goal to increase its first-year
retention to 92 percent by the year 2020 (Student Success). A study conducted by Art & Science Group,
LLC in 2011 concluded that the biggest factors in students leaving the university were academic and
financial; students who left often expressed dissatisfaction with the rigor of coursework, academic
opportunities in their field, and the financial value of an undergraduate education from UVM (“University
of Vermont Retention Study”). The data collected in the study were self-reported from students who had
already left UVM, so it’s possible that the conclusions were biased and did not capture the whole story of
why a student chooses to leave the school. In response to the study’s findings, UVM has implemented
some new strategies such as an “Engage UVM” program and enhanced career services. Despite these
initiatives, retention rates have only improved marginally since the study was conducted in 2011
(Johnson; “Retention Rates”).

6
This thesis proposes that UVM consider aggregating its various student data into a data
warehouse solution. Currently, student-related data are collected by dozens of offices and departments
across campus, and these data sources operate completely independently of each other. There is no central
repository of student-related data from sources such as Residential Life, Blackboard, Student Health
Services, and Undergraduate Admissions. A data warehouse would integrate much of the student data
across campus into a single centralized data store. Once these data re aggredgated, data mining, the
process of searching for patterns or systemic relationships across large amounts of data (“What is Data
Mining?”), could help UVM determine which factors besides academic and financial standing influence a
student’s likelihood to stay enrolled.
Many universities across the country have been using data mining solutions to improve student
retention (“How Data Mining Helped”). For example, the University of Alabama used data mining
techniques to determine that students who commuted to campus were more likely to withdraw from the
university, and subsequently established a policy requiring all first-year students to live on campus
(“Alabama”). Likewise, Sinclair Community College in Ohio used a data warehouse to determine that a
combination of factors such as an income level below the poverty line, an undeclared major, and full-time
employment made a student more likely to drop out (Little). As a result of these successes, more and
more universities are implementing data warehouses in an attempt to raise their retention rates and lower
their costs.
There is currently no system in place at UVM that helps to answer some of the questions that
other universities have been asking, because UVM cannot easily access all the different sources of
student-related data. There are likely factors that influence student retention at UVM that haven’t been
considered. For example, what if living in a dorm room with a mountain view increases a student’s
chances of returning to UVM their sophomore year? What if students who choose a points-based meal
plan instead of an unlimited access plan are more likely to drop out? What if the number of times a
student logs into Blackboard throughout the semester is directly correlated with retention? A data
7
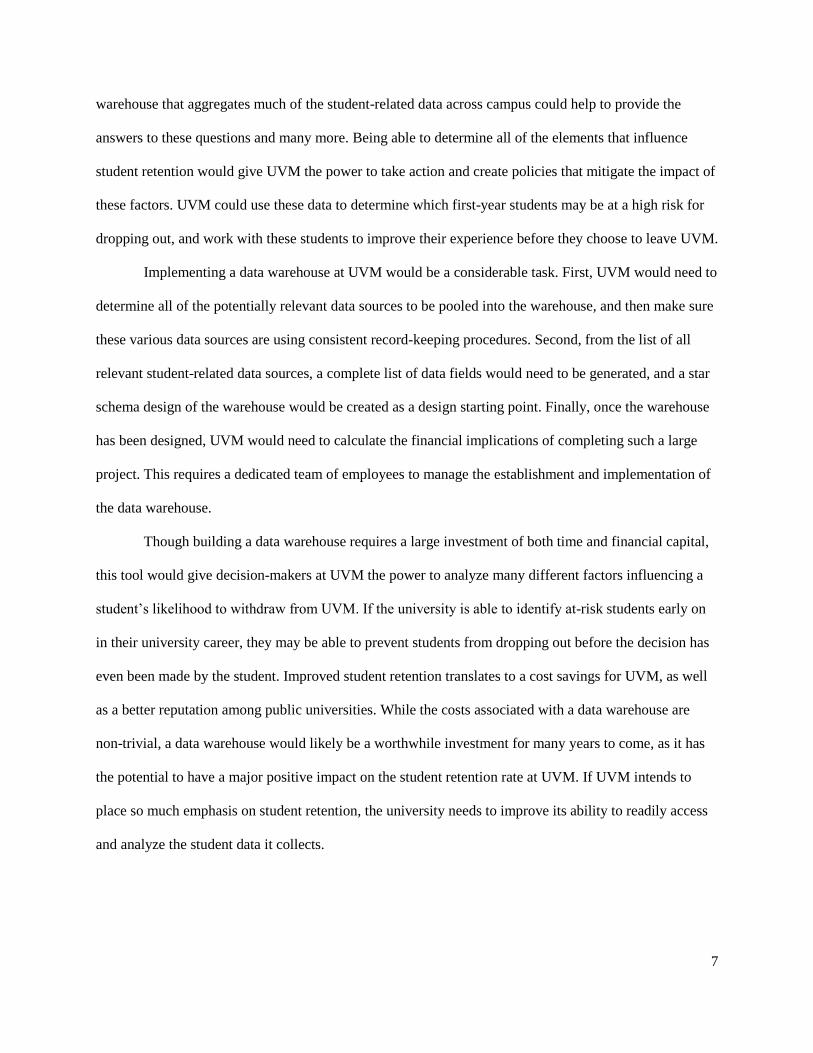
warehouse that aggregates much of the student-related data across campus could help to provide the
answers to these questions and many more. Being able to determine all of the elements that influence
student retention would give UVM the power to take action and create policies that mitigate the impact of
these factors. UVM could use these data to determine which first-year students may be at a high risk for
dropping out, and work with these students to improve their experience before they choose to leave UVM.
Implementing a data warehouse at UVM would be a considerable task. First, UVM would need to
determine all of the potentially relevant data sources to be pooled into the warehouse, and then make sure
these various data sources are using consistent record-keeping procedures. Second, from the list of all
relevant student-related data sources, a complete list of data fields would need to be generated, and a star
schema design of the warehouse would be created as a design starting point. Finally, once the warehouse
has been designed, UVM would need to calculate the financial implications of completing such a large
project. This requires a dedicated team of employees to manage the establishment and implementation of
the data warehouse.
Though building a data warehouse requires a large investment of both time and financial capital,
this tool would give decision-makers at UVM the power to analyze many different factors influencing a
student’s likelihood to withdraw from UVM. If the university is able to identify at-risk students early on
in their university career, they may be able to prevent students from dropping out before the decision has
even been made by the student. Improved student retention translates to a cost savings for UVM, as well
as a better reputation among public universities. While the costs associated with a data warehouse are
non-trivial, a data warehouse would likely be a worthwhile investment for many years to come, as it has
the potential to have a major positive impact on the student retention rate at UVM. If UVM intends to
place so much emphasis on student retention, the university needs to improve its ability to readily access
and analyze the student data it collects.
8
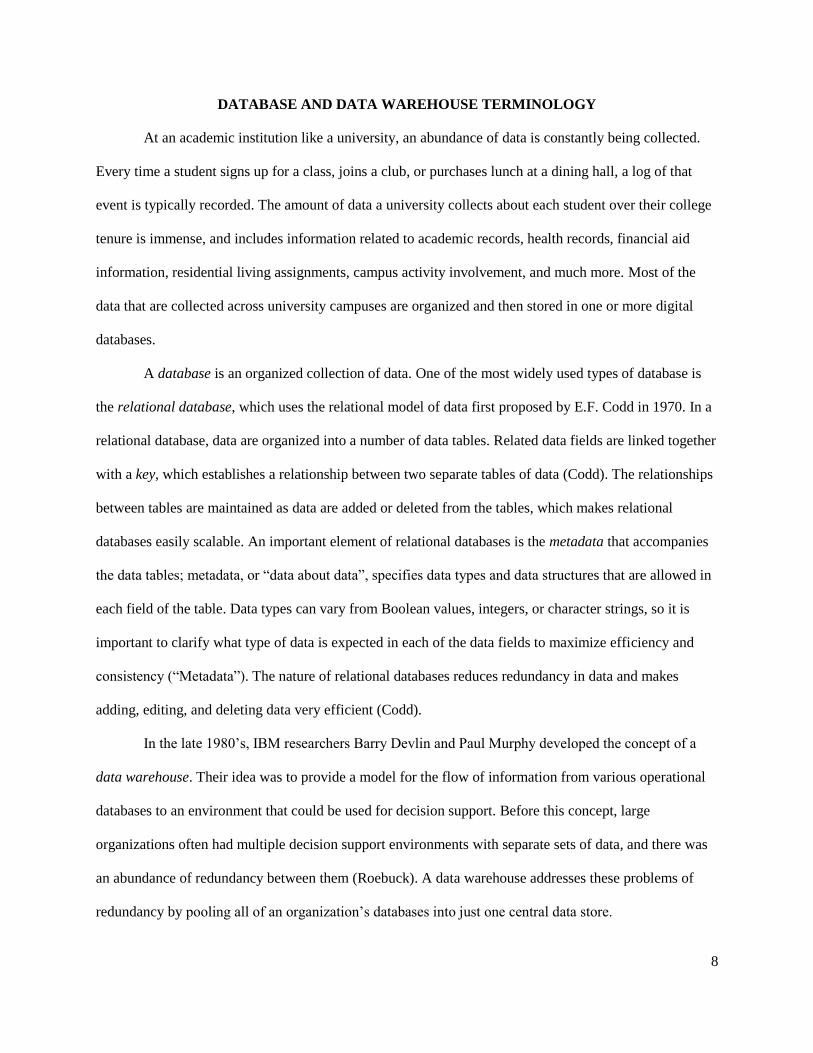
DATABASE AND DATA WAREHOUSE TERMINOLOGY
At an academic institution like a university, an abundance of data is constantly being collected.
Every time a student signs up for a class, joins a club, or purchases lunch at a dining hall, a log of that
event is typically recorded. The amount of data a university collects about each student over their college
tenure is immense, and includes information related to academic records, health records, financial aid
information, residential living assignments, campus activity involvement, and much more. Most of the
data that are collected across university campuses are organized and then stored in one or more digital
databases.
A database is an organized collection of data. One of the most widely used types of database is
the relational database, which uses the relational model of data first proposed by E.F. Codd in 1970. In a
relational database, data are organized into a number of data tables. Related data fields are linked together
with a key, which establishes a relationship between two separate tables of data (Codd). The relationships
between tables are maintained as data are added or deleted from the tables, which makes relational
databases easily scalable. An important element of relational databases is the metadata that accompanies
the data tables; metadata, or “data about data”, specifies data types and data structures that are allowed in
each field of the table. Data types can vary from Boolean values, integers, or character strings, so it is
important to clarify what type of data is expected in each of the data fields to maximize efficiency and
consistency (“Metadata”). The nature of relational databases reduces redundancy in data and makes
adding, editing, and deleting data very efficient (Codd).
In the late 1980’s, IBM researchers Barry Devlin and Paul Murphy developed the concept of a
data warehouse. Their idea was to provide a model for the flow of information from various operational
databases to an environment that could be used for decision support. Before this concept, large
organizations often had multiple decision support environments with separate sets of data, and there was
an abundance of redundancy between them (Roebuck). A data warehouse addresses these problems of
redundancy by pooling all of an organization’s databases into just one central data store.
9
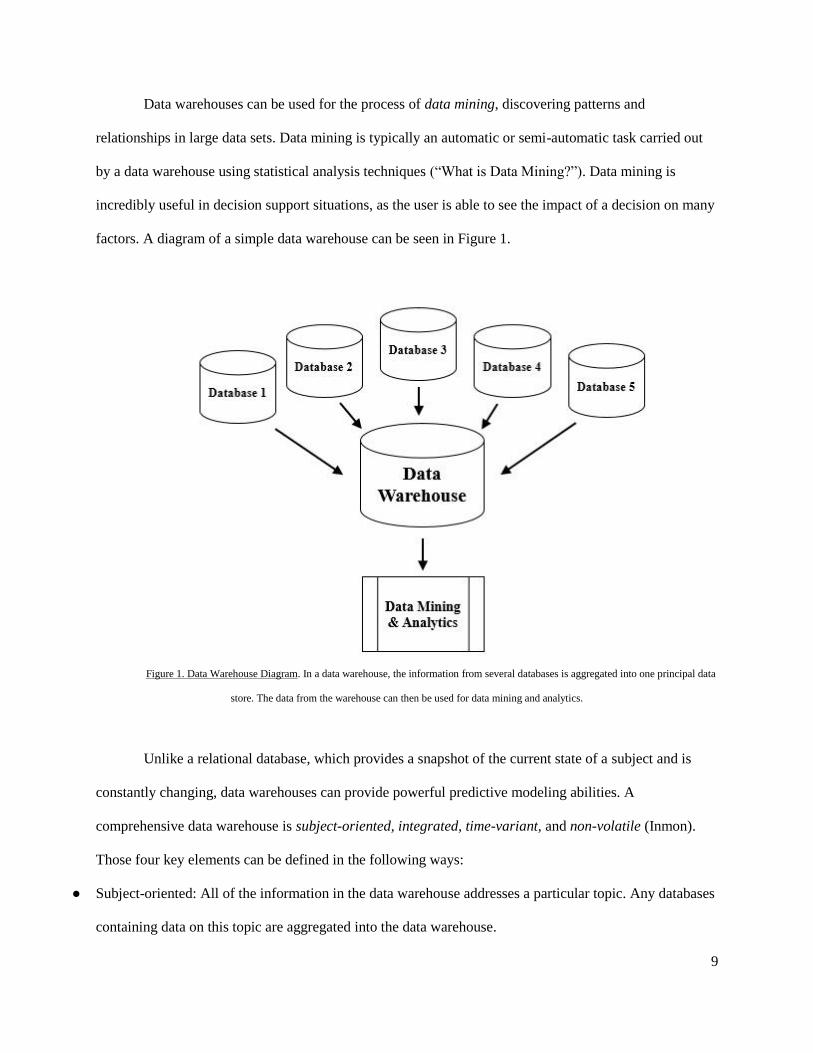
Data warehouses can be used for the process of data mining, discovering patterns and
relationships in large data sets. Data mining is typically an automatic or semi-automatic task carried out
by a data warehouse using statistical analysis techniques (“What is Data Mining?”). Data mining is
incredibly useful in decision support situations, as the user is able to see the impact of a decision on many
factors. A diagram of a simple data warehouse can be seen in Figure 1.
Figure 1. Data Warehouse Diagram. In a data warehouse, the information from several databases is aggregated into one principal data
store. The data from the warehouse can then be used for data mining and analytics.
Unlike a relational database, which provides a snapshot of the current state of a subject and is
constantly changing, data warehouses can provide powerful predictive modeling abilities. A
comprehensive data warehouse is subject-oriented, integrated, time-variant, and non-volatile (Inmon).
Those four key elements can be defined in the following ways:
● Subject-oriented: All of the information in the data warehouse addresses a particular topic. Any databases
containing data on this topic are aggregated into the data warehouse.

10
● Integrated: The data in a warehouse are integrated from many different databases in order to be the most
useful decision-making tool possible.
● Time-variant: The data stored in a warehouse are across a period of time, rather than a snapshot at a
current point in time. Time information can be stored as metadata with each record.
● Non-volatile: A data warehouse is kept separate from the databases it aggregates and does not update as
frequently as an operational database would. Additionally, old data are not erased when new data are
added, unless an expiration rule is configured for that data warehouse.
Although both a database and a data warehouse are collections of data, data warehouses and
databases are structured very differently. This distinction is necessary due to the different purposes of
databases and data warehouses; databases are optimized for adding, editing, and deleting data, as
databases are frequently used in operational contexts. In contrast, data warehouses are mainly used for
decision support, and are therefore optimized for reading and compiling data.
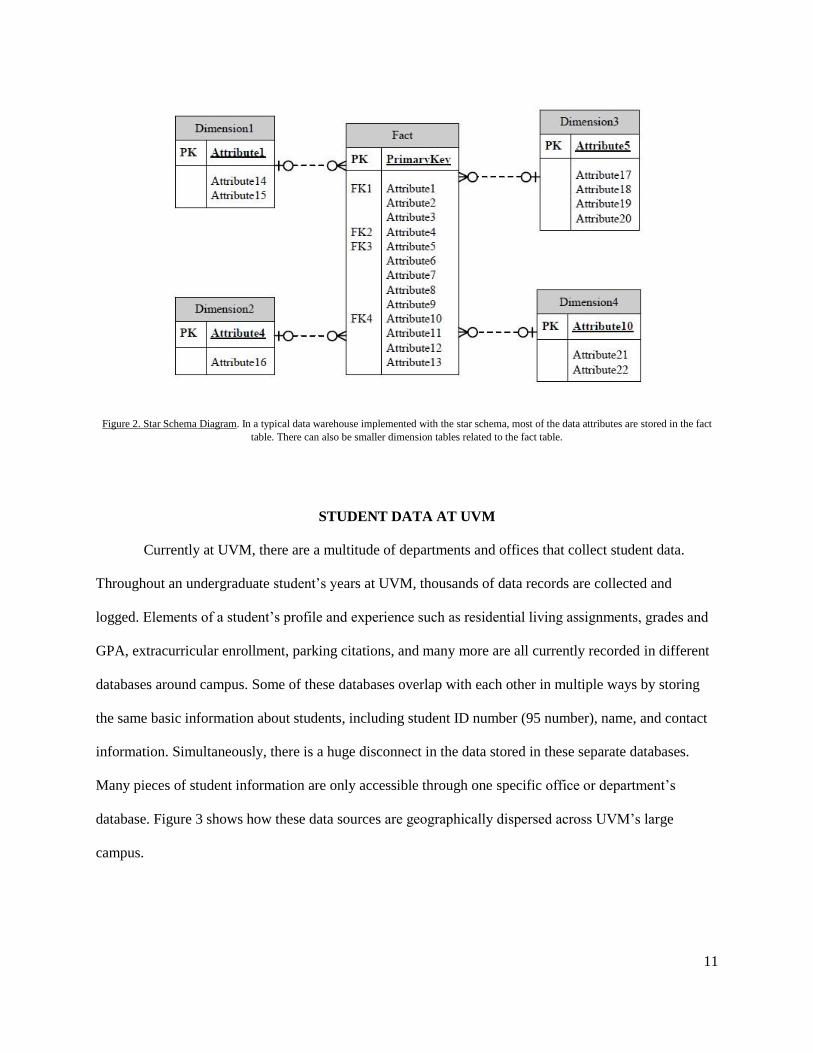
The simplest style of data warehouse schema is the star schema. In a star schema, a data
warehouse aggregates most of the data into one main table, called the fact table. Depending on the nature
of the data warehouse, there may also be several dimension tables related to the fact table; dimension
tables and fact tables are related to each other using keys, in a manner similar to how data tables are
related to each other in a relational database (“Schemas”). Dimension tables are a valuable addition to a
data warehouse when there is a collection of data related to an attribute that does not vary. A star schema
diagram can be seen in Figure 2. A snowflake schema is an extension of the star schema, where each
dimension table can have several more tables related to it. Snowflake schema are more advanced and
require additional maintenance efforts, so they are best suited for situations where the data complexity
levels requires a more expansive architecture (“Snowflake Schema”).
11
Figure 2. Star Schema Diagram. In a typical data warehouse implemented with the star schema, most of the data attributes are stored in the fact
table. There can also be smaller dimension tables related to the fact table.
STUDENT DATA AT UVM
Currently at UVM, there are a multitude of departments and offices that collect student data.
Throughout an undergraduate student’s years at UVM, thousands of data records are collected and
logged. Elements of a student’s profile and experience such as residential living assignments, grades and
GPA, extracurricular enrollment, parking citations, and many more are all currently recorded in different
databases around campus. Some of these databases overlap with each other in multiple ways by storing
the same basic information about students, including student ID number (95 number), name, and contact
information. Simultaneously, there is a huge disconnect in the data stored in these separate databases.
Many pieces of student information are only accessible through one specific office or department’s
database. Figure 3 shows how these data sources are geographically dispersed across UVM’s large
campus.

12
Figure 3. UVM Data Sources Across Campus. This map shows some of the important student-related offices that are currently disjointed and
spread out across campus. While these data sources are widely scattered, there is also plenty of data redundancy present between them.
(“University of Vermont Campus Map”)
Despite the vast amount of student data collected across the UVM campus, there has been little
effort to aggregate these disconnected databases into a centralized data warehouse. There is presently no
decision support environment that allows data mining of all student data at the same time (“UVM
Office”). Due to the extensive volume of student-related data across campus, aggregating these data
would be a major project for UVM to undertake. But the large quantity of data also means there is a big
opportunity for UVM to learn more about how aspects of a student’s time at UVM impact each other. If
UVM were to implement a data warehouse solution, it would give administrators a powerful insight into
the relationships between different pieces of a student’s experience. These insights could help the

13
university improve its reputation, increase student satisfaction, or reduce costs. An ideal application of a
data warehouse would be improving the student retention rate at UVM.
STUDENT RETENTION AT UVM
A university’s retention rate goes beyond student satisfaction – it can also have a significant
influence on a school’s reputation. Retention rates are factored into university rankings by U.S. News &
World Report and other organizations, which are widely regarded as trustworthy and unbiased. The
retention rate is also usually posted on a university’s profile page on websites such as CollegeBoard and
CollegeView (Bigfuture, Collegeview). These rankings and statistics related to retention can be important
considerations for students when they begin to apply for college.
The financial impact of an increase in student retention is also very important. A quick, back-of-
the-envelope calculation using UVM’s current cost of tuition and average financial aid packages can
show just how large the increases in revenue can be. For undergraduate students at UVM, the average
cost of tuition and fees across both in-state and out of state students is approximately $45,862
(“University of Vermont Undergraduate Tuition”). The university also provides an average financial
package of $24,308 to each student (Bigfuture). This means that the average undergraduate student pays
$21,554 to UVM each year. With approximately 2,300 students in the first-year class, this means that an
increase of just 1% in student retention translates to a $495,742 increase in revenue. If UVM were to
achieve retention improvement beyond 1%, the revenues would continue to grow.
To create a benchmark for various college performance factors, UVM has developed a list of self-
identified peer and aspirant public universities based on similarity of academic units (“Academic”). This
benchmark allows UVM to make comparisons to and among other universities on criteria such as
acceptance rate, tuition cost, and retention rate. UVM’s thirteen peer universities are schools with a
similar level of academic quality and reputation to UVM. Its seven aspirant universities were selected for

14
offering a high quality education, having a strong public reputation, and promoting a similar mission to
UVM (“A Benchmarking Study”).
Of UVM’s thirteen self-identified peer institutions, seven have a higher first-year retention rate
than UVM. More importantly, of UVM’s seven aspirant institutions, six have a significantly higher first-
year retention rate. These findings can be seen in Table 1.
Institution Peer/Aspirant First-Year Retention Rate
University of Vermont n/a 85.8%
Clemson University Peer 90.5%
Kansas State University Peer 81.0%
Miami University – Oxford Peer 89.3%
Oklahoma State University-Main Campus Peer 79.0%
SUNY at Albany Peer 84.3%
SUNY at Binghamton Peer 91.0%
University of Connecticut Peer 93.0%
University of Delaware Peer 92.3%
University of Maine Peer 78.5%
University of Massachusetts – Amherst Peer 88.8%
University of New Hampshire - Main Campus Peer 87.0%
University of Rhode Island Peer 81.0%
Washington State University Peer 82.0%
College of William and Mary Aspirant 95.5%
Pennsylvania State University - Main Campus Aspirant 92.0%
University of Colorado at Boulder Aspirant 84.5%
University of Michigan - Ann Arbor Aspirant 96.5%
University of North Carolina at Chapel Hill Aspirant 96.8%
University of Virginia - Main Campus Aspirant 96.8%
University of Wisconsin – Madison Aspirant 94.8%
Table 1. Student Retention Rates at UVM’s Peer and Aspirant Universities. This table includes all of UVM’s thirteen peer and seven aspirant
schools. The gray rows signify universities with a higher first-year retention rate than that of UVM. All retention rate figure were gathered from
U.S. News & World Report.
In 2011, UVM worked with education consulting firm Art & Science Group, LLC to determine
ways in which it could improve its retention rate. The steps in this study included conducting on-campus
interviews with students, faculty, staff, and administrators; conducting twenty-five detailed phone

15
interviews with students who had left the university; collecting key data from various sources on campus;
and compiling the aforementioned information into a report (“University of Vermont Retention”).
The 2011 study concluded that the biggest reasons students withdrew from the university were
academic factors. Students rated the academic factors of UVM as more significant than any other factors.
Academic issues for many students included lack of challenge or rigor in coursework and limited
academic opportunities in their desired field. The study also found that UVM students were generally
satisfied with social and non-academic factors of UVM life, including proximity to nature and outdoor
recreation, access to campus clubs and activities, and quality of life in Burlington (“University of
Vermont Retention”).
Financial considerations also play a part in students leaving the university; the value of a UVM
education was rated very low compared to other criteria, and only one fifth of students stated they could
easily afford UVM’s tuition. The study found additional factors, but attributed most retention issues to
academic and financial considerations.
The study recommended that UVM focus on several action steps moving forward, including:
● Creating a program branded as “Engage UVM” that encourages student and faculty collaboration and
involvement;
● Enhance on-campus career services and integrate these with the Engage UVM program;
● Develop a way to identify at-risk students early on in their college career in order to prevent withdrawals
before they are seriously considered.
Though UVM has followed most of the recommendations of the 2011 study, the university’s
retention rate have only slightly increased over the past four years, and UVM is still lagging with respect
to retention rates behind its aspirant universities. The two biggest factors affecting student retention at
UVM, academic rigor and cost, are not easily rectifiable. An increase in academic quality could translate
to higher costs for the university, and consequently higher tuition. As one of the most expensive public
universities in the country (“10”), UVM knows its students might not stand for an even higher price of

16
education. If UVM is hoping to improve retention without increasing tuition costs, the administration will
have to be creative in its methods.
One obvious bias in the 2011 study was that most of the data compiled were self-reported. While
some of the data were collected from record-keeping databases on campus, this was not the focus of the
data collection effort, and it is not exactly clear which data sources were used. The majority of the
information used by the Art & Science Group was gathered via student interviews and surveys. Because
of inherent biases, self-reported data are not usually as accurate as impartial record-keeping (“The
Dangers”). In a study of this nature, self-reporting is also troubling because it may be difficult for students
to identify exactly what motivated them to withdraw from the university when many factors are at play. It
may also be difficult to know how their feelings would have changed if they had taken different actions
while a student. For example, maybe a student would have ultimately stayed at UVM if they had had
fewer roommates or had visited the gym more frequently; it is often impossible to know how a different
path would have affected their desire to continue at UVM.
One important recommendation of the 2011 study was for UVM to identify at-risk students early,
ideally within their first semester, in order to curb withdrawals before students have already made the
decision to leave (“University of Vermont Retention”). There is currently no system in place at the
university that enables at-risk students to be identified. Establishing a data warehouse of all student-
related data would allow administrators to use data mining to see the patterns in behavior of students who
choose to leave UVM. While students have self-reported that academic and financial considerations were
their biggest reasons for withdrawing, there may be other factors or a combination of factors increasing
their motivation to leave.
Mining several years of student data could help the university to identify patterns or relationships
between different elements of a student’s UVM experience and their choice to stay or leave. There may
be factors that influence student retention related to not only a student’s financial or academic experience,
but also their living arrangement, health center visits, schedule type, athletic facility use, and much more.

17
Creating a comprehensive data warehouse of all student data is the only way to get the complete picture
of what makes a student choose not to return to UVM.
DATA WAREHOUSES AT OTHER ACADEMIC INSTITUTIONS
Multiple universities across the country have started to implement data warehouse solutions for
reporting and decision-making purposes. Many of these schools have found success identifying risk
factors of withdrawal. At the University of Alabama, for example, students in a data-mining course
worked with the data analytics company SAS to improve enrollment rates at the university. One
conclusion of their analysis was that students who commute to campus are more likely to withdraw. The
University of Alabama developed strategies such as requiring all first-year students to live on campus and
reaching out to at-risk students to participate in specialized programs on campus (“Alabama”). The
university is now experiencing all-time high enrollment rates as their graduation rates grow.
Tiffin University in Ohio made similar strides after using data mining to create predictive models.
Tiffin found that it was not just one factor that influenced retention; academic, financial, and social
elements all influenced a student’s choice to leave the university. Their new analytical tools have allowed
them to identify students at risk of dropping out and offer them personal mentors or automated email
messages informing them of on-campus activities. In just five years, Tiffin’s retention rate increased from
51 percent to 63 percent (“How Data Mining Helped”).
Sinclair Community College in Dayton, OH established the Student Success Plan (SSP) in 2004
with the intention of improving student retention, and overall student experience. The SSP is a web-based
management and reporting system that works much like a data warehouse. This system helped
administrators determine four warning signs for at-risk students: placing out of developmental courses,
income level below the poverty line, full-time employment, and an undecided major. When any of these
indicators are triggered, an Individual Learning Plan is automatically generated for the student which
involves course enrollment planning, personality testing, and tutor referrals. The SSP has been incredibly

18
successful, and retention rates at Sinclair are now over 93 percent, a staggeringly high number for a
community college (Little).
Yet another example of utilizing data mining to improve retention can be seen at Purdue
University. The university has developed a program called “Signals” that identifies students at risk of
withdrawal using a number of criteria and notifies the student if they are green (low risk), yellow
(potential risk), or red (high risk). Professors are able to send custom emails to students in each risk
group, helping yellow and red students access campus support services. Unlike other universities who
maintain a student’s withdrawal risk level as confidential, Purdue students can see their signal color
through their Blackboard portal, encouraging them to stay on track (“How Data Mining Helped”).
Like most public universities, UVM has numerous databases across various departments and
organizations. While it is not unusual for universities to have many databases, UVM may be at a
disadvantage in the way it manages its core student data. Most large public universities rely on a single
software system to manage academic and administrative student data. This would mean that information
such as a student’s name, address, and financial aid is accessible through the same user interface as that
student’s GPA, class schedule, and transcript. UVM has a slightly more complicated system, using both
PeopleSoft and their Banner environment for core student data (“UVM Business Process”). Separating
this information, along with many of the other secondary databases on campus, poses a further logistical
hurdle for the university to implement a data warehouse.
As creating a data warehouse can be expensive and time-consuming, many universities are
choosing to use off-the-shelf data warehousing solutions from companies like Oracle or SAS. These
companies are able to offer advanced, thorough solutions that require little customization from the
university. Oracle, for example, offers cloud-based management for the consolidation of many
warehouses. These solutions also pride themselves on being incredibly secure and reliable, with little
downtime for end users. For universities that don’t have a lot of experience with data warehouses and data
mining, and off-the-shelf solution is an easy way to get a warehouse established quickly (“Oracle”).
19
PREPARING FOR A DATA WAREHOUSE AT UVM
Due to the extensive amount of student data collected around UVM’s campus, designing and
establishing a thorough data warehouse would be a very time-intensive project. It’s important for the
university to carefully consider every decision along the way to ensure the success of such a project. One
of the first, and most important, steps in a data warehousing project is to determine the business
objectives of the project (Walls). This thesis focuses on creating a data warehouse for the purpose of
improving student retention, but UVM may decide to utilize the data mining capabilities for other
objectives, too. Some schools, like Ball State University in Indiana, have been using data mining to
reward students who participate in certain on-campus activities tracked by a custom mobile app. Georgia
State University has been using data analysis to run their “major matcher” system, which advises students
which major they may be likely succeed in based on their previous grades (Blumenstyk). Decision-
makers at UVM would need to determine all of their motives for collecting student-related data into a
data warehouse.
The next step in creating a data warehouse at UVM would be to compile a complete list of all of
the offices and departments managing student-related data on campus. As many of the student-related
data sources are spread out across campus, all of the databases containing student data would need to be
compiled to guarantee the completeness of this project. Interviews and consultations with different offices
on campus would likely be required to ensure that no data were missed. After conducting several
interviews and researching the different divisions of UVM, a preliminary list of all student-related offices
has been created, as can be seen in Table 2.

20
Student-Related Data Sources at UVM
Banner Office of the Registrar ACCESS Office
Blackboard Campus Recreation Office CatCard Office
Department of Student Life Police Services Residential Life
Police Services Student Financial Services Student Health Services
Transportation & Parking Services Undergraduate Admissions Office of International Education
Table 2. Preliminary List of Student-Related Data Sources. This table shows a tentative list of all offices and departments at UVM that collect
student-related data. This list would be reviewed by university administration to ensure it is thorough and complete before moving forward with
the creation of the data warehouse. Note: these sources are not listed in any particular order.
Compiling data from so many sources that have been operating independently for many years
would likely present some challenges. To minimize disruption of employees’ normal work flow, the
intention of this project would be to make as few changes as possible to the data entry and management
processes of data managers. The goal of the project is that a data warehouse would provide beneficial data
mining abilities without substantially disrupting the current operations of so many departments. With that
being said, some level of standardization would be required in the data sources before being compiled
into the data warehouse.
One potential major difficulty associated with this project would be the different record-keeping
software that departments currently use to manage their student data. Because all of the student-related
departments have operated independently for so many years, the different departments use a variety of
methods for logging their data. Some departments store their records in a spreadsheet using an application
like Microsoft Excel. Data stored in a spreadsheet or plain text format are sometimes referred to as flat
files due to their lack of structured relationships (“Flat File”). Other departments on campus use Microsoft
Access, a basic database management system, to store their data. Microsoft Access has simple relational
database capabilities, but is not as robust as some enterprise-level database management systems. Some
departments use Banner, an enterprise resources planning system designed by Ellucian specifically for
higher education. Banner has many capabilities beyond a rudimentary database system and even has some
data mining potential built-in (Ellucian).

21
A crucial requirement for moving forward with this project would be to ensure that all of the data
sources feeding into the data warehouse are managing their own data in a somewhat homogenous method,
most likely using a relational database model. It is not possible to aggregate all of the data into a
warehouse if they are being collected in vastly different ways. Proposing a change in data collection
methods for these different student-related departments may be met with resistance from some groups on
campus; this will be discussed in more detail in the Risks & Obstacles section of this thesis.
Beyond ensuring that all of the feeding data sources are recording their data in a consistent
matter, another layer of standardization would have to take place. Data cleansing is a key step in
preparing data for mining in a data warehouse. Data cleansing often takes place after the data have been
collected from the various sources, which means cleansing has little to no impact on the normal routines
of student-related departments. It is possible for a database administrator to cleanse data manually, by
reading through entries in the databases and looking for inconsistencies, mistakes, and redundancies; for
large amounts of data, this is very time consuming. Fortunately, there are software solutions available that
perform the data cleansing automatically, saving a database administrator a lot of time. These software
data cleansers use tools such as rules, algorithms, and look-up tables to correct mistakes in records
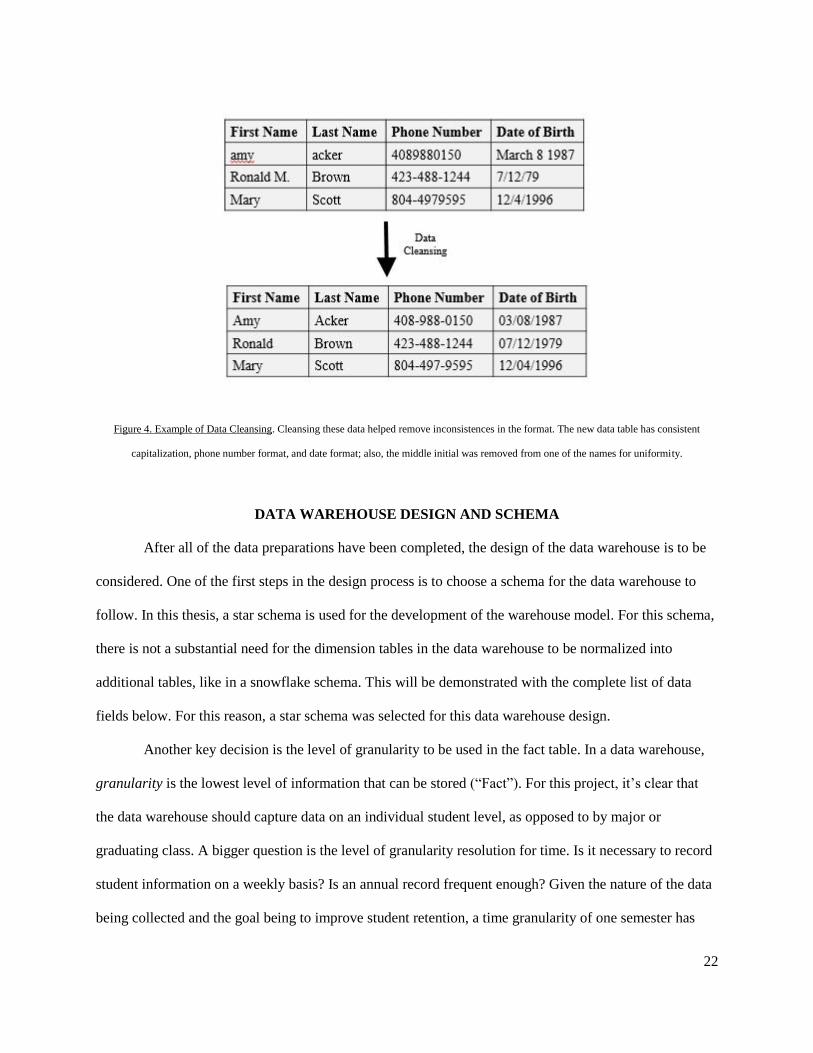
(Rouse). Figure 4 shows a simple example of data before and after cleansing.
22
Figure 4. Example of Data Cleansing. Cleansing these data helped remove inconsistences in the format. The new data table has consistent
capitalization, phone number format, and date format; also, the middle initial was removed from one of the names for uniformity.
DATA WAREHOUSE DESIGN AND SCHEMA
After all of the data preparations have been completed, the design of the data warehouse is to be
considered. One of the first steps in the design process is to choose a schema for the data warehouse to
follow. In this thesis, a star schema is used for the development of the warehouse model. For this schema,
there is not a substantial need for the dimension tables in the data warehouse to be normalized into
additional tables, like in a snowflake schema. This will be demonstrated with the complete list of data
fields below. For this reason, a star schema was selected for this data warehouse design.
Another key decision is the level of granularity to be used in the fact table. In a data warehouse,
granularity is the lowest level of information that can be stored (“Fact”). For this project, it’s clear that
the data warehouse should capture data on an individual student level, as opposed to by major or
graduating class. A bigger question is the level of granularity resolution for time. Is it necessary to record
student information on a weekly basis? Is an annual record frequent enough? Given the nature of the data
being collected and the goal being to improve student retention, a time granularity of one semester has

23
been selected for this data warehouse. Much of the student data such as dining plan, residential hall
assignment, and parking citations change semesterly. There may be benefits to designing the warehouse
on another granularity level, such as further separating records by course, but the student-semester level
of granularity is the most appropriate for the majority of the data being collected. The data warehouse will
partition information based on a specific student/semester combination.
When preparing to create the data warehouse, a preliminary collection of all data sources was
gathered. From this collection, a preliminary list of all relevant data fields to be used in the warehouse can
be developed. This list of data fields includes all of the elements of student-related data (and some
semester-related data) that would be appropriate to include in the data warehouse. Similar to the list of
data sources that was created in the preparation steps, this list of data fields may have some omissions; it
would be important for UVM administrators to validate the completeness of the list of data fields before
moving forward with the data warehouse process. The name, data type, source, and description of each of
the data sources can be seen in Table 3.
Field Name Data Type Data Source Description
Student_ID INTEGER Banner
Student's ID number (often referred to as 95
number)
Semester_ID VARCHAR Office of the Registrar
Alphanumeric indication of the semester
(Example: FA12, SP15)
ACCESS BOOLEAN ACCESS Office
This field will be True if the student utilizes any
of the ACCESS services through the Academic
Success Office, and False if they do not.
Major VARCHAR Banner Student's academic major
Minor VARCHAR Banner Student's academic minor
ACE SMALLINT Banner
A student's ACE score is an estimate of their
ability to succeed in college based on several
factors including high school class rank,
standardized test scores, and high school index.
SAT SMALLINT Banner
Student's SAT score (this field may be blank if
the student did not send SAT scores to UVM)
ACT SMALLINT Banner
Student's ACT score (this field may be blank if
the student did not send ACT scores to UVM)
Home_Zip_Code SMALLINT Banner
Student's home zip code when they first enrolled
at UVM
Cum_Gpa DECIMAL Banner Student's cumulative GPA from all semesters
Semester_GPA DECIMAL Banner Student's semester GPA
Class_Standing VARCHAR Banner
Student's credit-based class standing at the
beginning of the semester (this may be different
from the number of years they have been
enrolled at UVM)
Semester_Credits SMALLINT Banner The number of credits the student is enrolled in

24
As SMALLINT Banner
The number of A’s the student received as final
grades
Bs SMALLINT Banner
The number of B's the student received as final
grades
Cs SMALLINT Banner
The number of C's the student received as final
grades
Ds SMALLINT Banner
The number of D's the student received as final
grades
Fs SMALLINT Banner
The number of F's the student received as final
grades
Ws SMALLINT Banner
The number of courses the student withdrew
from
First_Course_Registration
_Delay INTEGER Banner
The number of minutes after the course
registration period opened that the student
registered for their first course (This value may
be affected by holds on a student's account,
along with a student choosing to register at a
later time)
Schedule_Type_Code SMALLINT Banner
This field expresses the general arrangement of
the student's academic schedule. This field
would require the creation of several classes of
schedule format. Some of these classes could
include:
-Mostly MWF classes
-Mostly TR classes
-Even distribution of classes through the week
Average_Course_Evaluati
on_Ratings DECIMAL Banner
The field is the mean of the average course
evaluation ratings for all of the student’s
currently enrolled classes. It would only be
possible to capture these data if the Banner
system were to offer a standardized course
evaluation system to all first-year students.
Implementing such a system would be of great
value to a data warehousing project like this.
Blackboard_Average_We
ekly_Logins SMALLINT Blackboard
The average number of times per week that the
student logs into their Blackboard portal
Intramural_Sport_Enroll
ment SMALLINT Campus Recreation Office
The number of intramural sports teams the
student is enrolled in
Group_Fitness_Pass BOOLEAN Campus Recreation Office
This field will be True if the student has
purchased a group fitness pass through the
Campus Recreation Office, and False if they
have not.
Athletic_Facility_Use SMALLINT CatCard Office
The number of times a student used their
CatCard to access campus athletic facilities in
the Patrick Gymnasium
Out_Of_Business_Hours_
Academic_Building_Use SMALLINT CatCard Office
The number of times a student used their
CatCard to access campus academic buildings
after hours
Club_Enrollment SMALLINT Department of Student Life
The number of SGA-sponsored clubs a student
is enrolled in
Studied_Abroad BOOLAN Office of International Education
This field will be True if the student has studied
abroad in this or any previous semester at UVM,
and False if the student has not.
Season_Fall BOOLEAN Office of the Registrar
This field will be True if the season of the
semester is fall, and False if the season of the
semester is spring.
Weeks_After_Thanksgivi
ng SMALLINT Office of the Registrar
Due to changes in the Gregorian calendar, some
fall semesters are scheduled so there is one full
week of class between Thanksgiving break and
final exams, and other semesters have two full
weeks between Thanksgiving break and the start

25
of finals. This field expresses how many full
weeks of classes take place between
Thanksgiving break and the start of final exams.
(This field is null if Season_Fall is False).
Start_Before_MLK_Day BOOLEAN Office of the Registrar
Due to changes in the Gregorian calendar, some
spring semesters are scheduled so Martin Luther
King Jr. day takes place before classes start, and
other semesters have Martin Luther King Jr. day
taking place one week after classes start. This
field will be True if classes begin before Martin
Luther King Jr. Day, and False is classes begin
after the holiday. (This field is null if
Season_Fall is True).
Police_Alcohol_Citations SMALLINT Police Services
This field expresses the number of alcohol-
related citations a student has received from
Campus Police Services.
Police_Drug_Citations SMALLINT Police Services
This field expresses the number of drug-related
citations a student has received from Campus
Police Services.
Police_Vandalism_Citatio
ns SMALLINT Police Services
This field expresses the number of vandalism-
related citations a student has received from
Campus Police Services.
Police_Other_Citations SMALLINT Police Services
This field expresses the number of other
citations a student has received from Campus
Police Services.
Meal_Plan_Code INTEGER Residential Life
UVM currently offers three meal plans to on-
campus students:
1. Residential Dining Unlimited Access plus 325
points and 3 guest meals
2. Residential Dining Unlimited Access plus 100
points and 3 guest meals
3. 1366 points and 25 meals at Residential
Dining Facilities
This field expresses which of the three meal
plans the student has purchased with the number
1, 2, or 3. (For students who live off-campus
without a residential dining plan, this field will
hold 0).
On_Campus_Residence BOOLEAN Residential Life
This field will be True if the student lives in a
UVM residence hall, and False if the student
lives off campus.
Roommates SMALLINT Residential Life
The number of roommates a student shares their
room with (this field will be null if
On_Campus_Residence is False)
Residential_Hall VARCHAR Residential Life
The residence hall that a student lives in (this
field will be null if On_Campus_Residence is
False)
Room_Number VARCHAR Residential Life
The room number of the student's residential hall
room (this field will be null if
On_Campus_Residence is False)
Floor SMALLINT Residential Life
The floor of the student's residential hall room
(this field will be null if On_Campus_Residence
is False)
View_Category_Code VARCHAR Residential Life
There is currently no metric in place to assess
the quality of the view from a student's
residential hall room. This field would require
the creation of several classes of a room's view.
Each room on campus would need to be
assigned a view category, such as:
-Mountain View
-Green/Grass View

26
-Parking Lot View
-Building View
etc.
(this field will be null if On_Campus_Residence
is False)
ResLife_Alcohol_Citation
s SMALLINT Residential Life
This field expresses the number of alcohol-
related citations a student has received from
their Resident Advisor or another employee in
their residential hall.
ResLife_Drug_Citations SMALLINT Residential Life
This field expresses the number of drug-related
citations a student has received from their
Resident Advisor or another employee in their
residential hall.
ResLife_Vandalism_Citat
ions SMALLINT Residential Life
This field expresses the number of vandalism-
related citations a student has received from
their Resident Advisor or another employee in
their residential hall.
ResLife_Other_Citations SMALLINT Residential Life
This field expresses the number of other
citations a student has received from their
Resident Advisor or another employee in their
residential hall.
Scholarship_Value INTEGER Student Financial Services
The total monetary value of the student's merit-
based scholarships
Financial_Aid_Value INTEGER Student Financial Services
The total monetary value of the student's
financial aid package
Health_Center_Visits SMALLINT Student Health Services
The number of times the student visited an on-
campus health clinic
Parking_Citations SMALLINT
Transportation & Parking
Services
The number of parking-related citations a
student has received from Transportation &
Parking Services
Parking_Permit BOOLEAN
Transportation & Parking
Services
This field will be True if the student has
purchased an on-campus parking permit from
Transportation & Parking Services, and False if
they have not.
Early_Action_Application BOOLEAN Undergraduate Admissions
This field will be True if the student applied to
UVM by the early action deadline, and False if
the student did not.
Returning BOOLEAN Banner
This field will be True if the student is returning
to UVM the next semester, and False if the
student is not. The value of this field will be
determined by whether or not a student has
notified their academic dean that they are not
returning.
Table 3. Data Fields to be Included in the Data Warehouse. This table contains the name, data type, data source, and a brief description of each of
the data fields to be included in the data warehouse. This list is preliminary, and may be missing some key data fields; it would be important to
ensure the entirety of this list before moving forward.
In creating the list of all data fields, certain fields stand out as making more sense being placed in
a dimension table. There are certain fields related to a semester, such as Start_Before_MLK_Day and
Weeks_After_Thanksgiving that are always constant with a single Semester_ID. Likewise, there are

27
fields related to a student and to a residential room that do not need to be included in every entry to the
data warehouse. For these reasons, this thesis proposes that the data warehouse contain three dimension
tables: dimSemester, dimStudent, and dimRoom. There does not appear to be a need to normalize any
data into additional tables off of the dimension tables, so the design will contain one fact table and three
dimension tables.
Using the list of all data fields and the star schema, an entity-relationship diagram was created to
model this data warehouse, as can be seen in Figure 5. The fact table has two primary keys, Student_ID
and Semester_ID, as this data warehouse operates on a student-semester level of granularity. The three
dimension tables – dimStudent, dimSemester, and dimRoom – include fields that do not change when the
foreign key remains constant.

28
Figure 5. Entity-Relationship Diagram. The ERD for this data warehouse includes a fact table and three dimension tables.
29
FINANCIAL AND LOGISTICAL CONSIDERATIONS
One of the more daunting implications of such a major project is the financial capital required for
such an investment. Creating a data warehouse to improve student retention may have a positive long-
term impact on the financial state of UVM. However, it does not change the fact that a high level of initial
costs, as well as some recurring costs, are expected. Financial limitations are likely a major reason that
UVM has not yet implemented a data warehouse at this time.
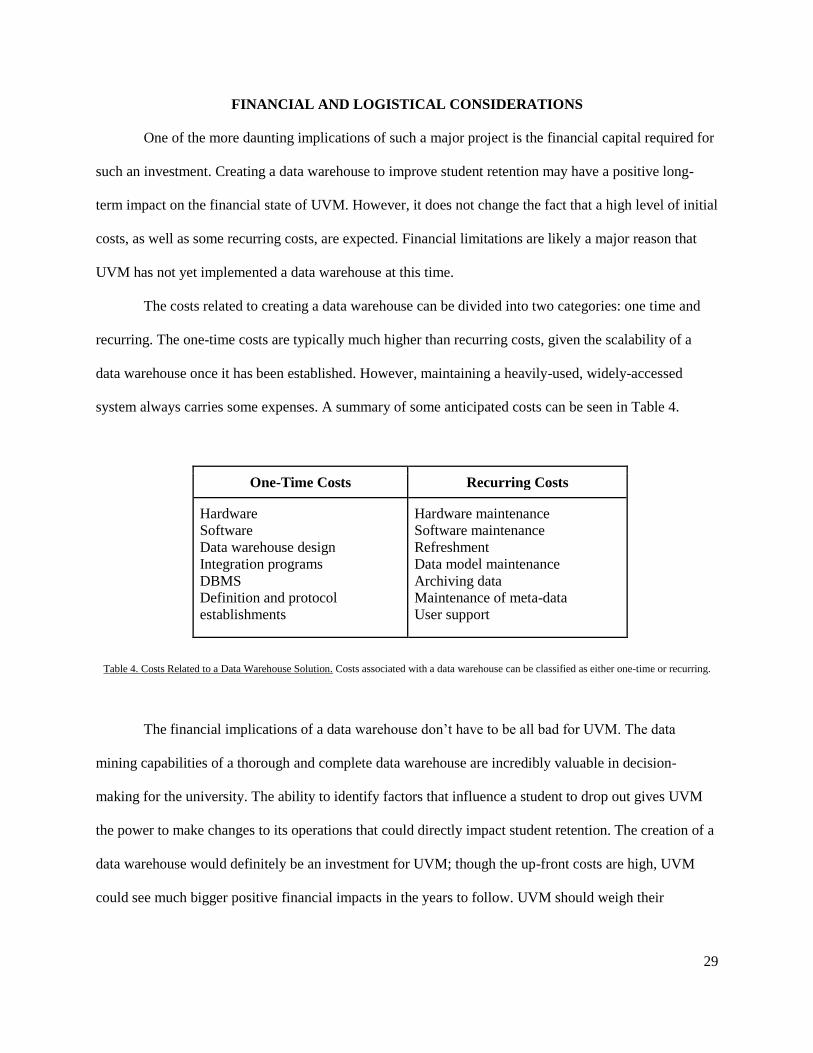
The costs related to creating a data warehouse can be divided into two categories: one time and
recurring. The one-time costs are typically much higher than recurring costs, given the scalability of a
data warehouse once it has been established. However, maintaining a heavily-used, widely-accessed
system always carries some expenses. A summary of some anticipated costs can be seen in Table 4.
One-Time Costs Recurring Costs
Hardware
Software
Data warehouse design
Integration programs
DBMS
Definition and protocol
establishments
Hardware maintenance
Software maintenance
Refreshment
Data model maintenance
Archiving data
Maintenance of meta-data
User support
Table 4. Costs Related to a Data Warehouse Solution. Costs associated with a data warehouse can be classified as either one-time or recurring.
The financial implications of a data warehouse don’t have to be all bad for UVM. The data
mining capabilities of a thorough and complete data warehouse are incredibly valuable in decision-
making for the university. The ability to identify factors that influence a student to drop out gives UVM
the power to make changes to its operations that could directly impact student retention. The creation of a
data warehouse would definitely be an investment for UVM; though the up-front costs are high, UVM
could see much bigger positive financial impacts in the years to follow. UVM should weigh their

30
commitment to student retention versus data warehousing costs when deciding whether or not a data
warehouse is worth the financial investment.
An important logistical matter to consider in this project is the team of people that is required to
create and maintain the data warehouse. A project of this scope would require employees in a variety of
roles, including project managers, database administrators, quality assurance specialists, and IT specialists
to dedicate their time to the data warehouse. UVM could consider three main options for the staffing of
this project:
1. Employing a team from an existing UVM department, like the Office of Institutional Research, to take on
this project;
2. Hiring a new team from outside of UVM to create a new Data Warehouse Management Office;
3. Enlist a third-party company like Oracle to create, maintain, and support the data warehouse environment.
Based on the size of this project, Option 3 may be the best choice for UVM to pursue. Finding a
team with the available resources to manage such a big project would be very challenging, and hiring a
new set of employees to handle the project is another time-consuming task that could lead to a lot of
unknowns. Because UVM’s data warehouse needs are not uncommon or unusual for a well-estbalished
organization specializing in data warehouse applications, this project would be well-suited to a third party
team who could provide a well-tested off-the-shelf solution. This option reduces the stress of this project
for UVM while still ensuring that it will be completed to the highest level of quality possible.
It is of value to note that UVM currently hosts a lot of its data remotely, at a secure off-site data
center. This data center provides a high level of data security and reliability; its geographic location puts it
at low risk for natural disasters, and two underground cable routes lead data from the warehouse safely
back to campus. If UVM chose to manage its own hardware for this project, its current data center would
be a great resource in ensuring the reliability of the data warehouse.

31
OPPORTUNITIES FOR EXPANSION
Although the proposal in this thesis would act as a comprehensive starting point for the
implementation of a data warehouse, there are always ways that the project could be expanded to provide
even more value to UVM. The biggest opportunity to enhance this project would be to design the data
warehouse to operate at a lower level of granularity. The current model proposes that the warehouse
operate at a student-semester level, but additional insights could be gained from data mining if the
warehouse also tracked data on a course level. In other words, the warehouse would operate at a student-
semester-course level.
An additional level of course granularity would be able to determine how a student’s enrollment
or performance in a particular class impacts student retention. The current model is only able to count
how many A’s, B’s, C’s, etc. a student receives throughout a semester. There is not a way to consider the
impact of a precise course on the student’s likelihood to stay at UVM. For example, maybe enrolling in a
particular class makes a student more likely to return to UVM the next semester. Perhaps taking a
different class has the adverse effect, lowering a student’s interest in continuing at UVM. This
information would be incredibly valuable in evaluating the quality of courses offered at UVM, and would
not be available at the semester level granularity.
Working at the course of granularity opens the door for other possibilities, too. Table 3 included a
field entitled “Average_Course_Evaluation_Ratings”, the mean of all of the average course evaluation
scores for a student’s semester. There is currently not a way to capture these data with UVM’s course
evaluation system, as there is no standardized evaluation process for all courses across all departments. If
a standardized course evaluation system were to be implemented, a student-semester-course granularity
level would be able to determine how the individual student’s course evaluation score compared to the
average from all students. Likewise, the “First_Course_Registration_Delay” field could be taken to the
next level, and the data warehouse could capture the registration delay for each individual course, as
opposed to just the first course the student registered for.

32
Adding a course level of granularity could provide important insights, but as discussed earlier, it
does not make sense with the majority of the data fields included in the data warehouse. Fields such as
Semester_GPA, Schedule_Type_Code, Parking_Citations, and Roommates would all remain the same
across multiple courses. This would lead to an increase in redundant data in the warehouse. While it is
recommended that UVM pursue the student-semester level of granularity for this project, additional levels
should be considered for the sake of exhausting all possibilities.
RISKS AND OBSTACLES
In a project as large as this one, there are always risks to consider and obstacles to work around.
To successfully implement this data warehouse, many teams and departments at UVM would need to be
supportive of the project. One of the biggest risks identified would be a result of transitioning to a
relatively standardized method of data collection at the level of the individuals departments or offices.
This standardization is necessary to prepare all of the data across campus to be aggregated into the data
warehouse. It is not possible to combine all of the sending data if they are in drastically different formats.
It’s reasonable to anticipate that some of the data managers of the various departments on campus
would be hesitant to change their normal procedures in order to conform to the new data warehousing
guidelines. If a department had been using Excel to collect and organize their data for many years,
transitioning to a relational database system would be a significant change to their customary routine.
This could lead to a loss in productivity or recording accuracy for that department as they adjust to the
new data standards.
Risks of this nature are certainly typical for projects like this, but there are ways to mitigate the
harshness of the conversion. A key element of this project would be to prioritize communicating with the
relevant departments and offices to make sure all affected employees are informed of what to expect.
Giving staff a generous timeline to adjust to the new systems would also help make the transition go more
smoothly. For employees who are intimidated by learning a new system, training session and support
33
could be made widely available. And while some change in behavior would be required for the
implementation of this warehouse, it would be important to emphasize that the goal of this project is to
affect current operations as little as possible.
Another considerable risk for this project would be gaining student, faculty, and community
support in taking on such a costly endeavor. With one of the highest public university tuition rates in the
country, UVM has faced backlash in the past for expenses seen as frivolous. A massive data warehouse
project would almost certainly raise doubts in the university community about the value of such a large
investment.
In order to gain campus and community-wide support the key again is in communication. While
the establishment of a data warehouse would be an expensive endeavor, many universities have shown
how powerful of a tool it can be in improving student retention, which can lead to cost savings for the
university in the future. Presenting the data warehouse project as a long-term investment for UVM and
the state of Vermont, which could ultimately save the university money and increase student satisfaction,
would emphasize the true value of a project of this nature. It is possible that UVM may be able to reduce
funds to other campus initiatives in order to put more funding toward the data warehouse project if the
administration felt it were a worthwhile endeavor.
CONCLUSIONS AND DISCUSSIONS
The purpose of this thesis was to explore the technical and logistical implications of creating a
data warehouse at UVM in an effort to improve the student retention rate. Though UVM is making efforts
to improve its student retention, the university is struggling to raise their rates to be competitive with that
of their aspirant universities. Initiatives up until this point have focused on collecting self-reported data
from students who have already left the university. This thesis argues that those data may not be telling
the full story of what causes students to withdraw from UVM. In order to consider a wide variety of
factors contributing to student withdrawals, the university should create a data warehouse that combines
data from a variety of databases and data sources across campus. Once these data has been aggregated,

34
data mining techniques can help reveal patterns or systemic relationships between certain elements of a
student’s UVM experience and their likelihood to withdraw.
The proposed solution emphasized the importance of including all student-related databases on
campus in order to be as thorough as possible. The data warehouse cannot be considered complete until
all elements of a student’s time at UVM are collected. Data cleansing would need to take place before the
warehouse is ready to be built. The thesis suggested implementing a star schema data warehouse model to
organize all of the fields of student data across campus; the entity-relationship diagram presented a large
fact table and three smaller dimension tables. UVM would also have to consider the financial implications
and some logistical details of the warehousing process to ensure the procedure runs smoothly.
Though this thesis is purely hypothetical in nature, it can be used as a starting point if UVM
chooses to consider implementing a data warehouse solution. Though establishing such a large data
warehouse would be a major investment, other universities have shown how the power of data mining can
directly translate to an increase in student retention, and ultimately, substantial cost savings for that
school.

35
REFERENCES
"10 Most Expensive Universities for Out-Of-State Students." U.S. News & World Report. N.p., 2 Dec.
2014. Web. 31 Mar. 2015.
"2014 Retention/Completion Summary Tables." ACT. ACT, Inc., 2014. Web. 14 Mar. 2015.
"Academic Calendar Configuration Guidelines Recommendation." University of Vermont. Student Affairs
Committee, Faculty Senate, 12 Mar. 2015. Web. 22 Apr. 2015.
"Alabama Posts Gains with Recruiting, Retention." SAS. N.p., n.d. Web. 13 Mar. 2015.
"A Benchmarking Study Using Peer and Competitive Analysis." University of Vermont. Paulien &
Associates, Inc., Aug. 2005. Web. 22 Apr. 2015.
Blumenstyk, Goldie. "Blowing Off Class? We Know." The New York Times. The New York Times, 02
Dec. 2014. Web. 07 May 2015.
Codd, E. F. "A Relational Model of Data for Large Shared Data Banks." Communications of the ACM
13.6 (1970): 377-87. Web. 6 May 2015.
Culver, Tim. "Is Student Retention an Expense or an Investment?" Noel Levitz. N.p., 24 Mar. 2011. Web.
14 Mar. 2015.
"The Dangers of Self-report." Science for All Brainwaves. British Science Association, 3 Mar. 2012.
Web. 7 May 2015.
Ellucian. BANNER by Ellucian: The World's Leading Higher Education ERP System. N.p.: Ellucian,
2014. Print.
"Fact Table Granularity." 1keydata. N.p., n.d. Web. 6 May 2015.
"Flat File." TechTerms.com. N.p., n.d. Web. 7 May 2015.
"How Data Mining Helped 11 Universities Improve Student Retention Strategies." Hanover Research.
N.p., n.d. Web. 13 Mar. 2015.
Inmon, William H., and Chuck Kelley. Rdb/VMS: Developing the Data Warehouse. N.p.: n.p., 1993.
Print.
36
Johnson, Tim. "Retention and Academic Quality at UVM." Tim Johnson's Vermont Higher Education
Blog. Burlington Free Press, 11 May 2011. Web. 23 May 2015.
Little, Russell. "The Student Success Plan: Case Management and Intervention Software."
EDUCAUSEreview. N.p., 15 Dec. 2011. Web. 2 May 2015.
"Metadata Basics." Dublin Core Metadata Initiative. N.p., n.d. Web. 4 May 2015.
"National University Rankings.” U.S. News & World Report. N.p., n.d. Web. 16 Mar. 2015.
"Oracle Database." Oracle. N.p., n.d. Web. 5 May 2015.
Raisman, Neal. "The Power of Retention." University Business Magazine. N.p., Jan. 2008. Web. 14 Mar.
2015.
"Retention Rates after One, Two, and Three Years for First-Time, Year Year Student Entering Fall 2004
to 2013." Office of Institutional Research. University of Vermont, n.d. Web. 14 Mar. 2015.
Roebuck, Kevin. Data Warehousing: High-Impact Strategies - What You Need to Know: Definitions,
Adoptions, Impact, Benefits, Maturity, Vendors. N.p.: n.p., 2011. Print.
Rouse, Margaret. "Data Scrubbing (Data Cleansing)." Tech Target Search Data Management. N.p., n.d.
Web. 6 May 2015.
"Schemas." Oracle 8i Data Warehousing Guide. Oracle, n.d. Web. 6 May 2015.
"Snowflake Schema." 1keydata. N.p., n.d. Web. 6 May 2015.
"Student Success and Satisfaction at UVM." University of Vermont. N.p., n.d. Web. 23 Mar. 2015.
"University of Vermont." Bigfuture. CollegeBoard, n.d. Web. 05 May 2015.
"University of Vermont Campus Map 2010." University of Vermont. N.p.: n.p., 2010. N. pag. Print.
"University of Vermont." CollegeView. N.p., n.d. Web. 6 May 2015.
"University of Vermont Retention Study." Art & Science Group, LLC, 10 Feb. 2011. Web. 22 Mar. 2015.
"University of Vermont Undergraduate Tuition and Fees." University of Vermont. N.p., n.d. Web. 22 Apr.
2015.
"UVM Business Process Re-Engineering Team on Data Warehousing." Personal interview. 3 Oct. 2014.

37
"UVM Office of Institutional Research and a Potential Enterprise Data Warehouse." Personal interview. 5
Sept. 2014.
Walls, David, and Mark D. Scott. "7 Steps to Data Warehousing." SQL Server Pro. N.p., 20 Dec. 1999.
Web. 4 May 2015.
"What Is Data Mining?" Data Mining Concepts. Oracle, n.d. Web. 2 May 2015.