uva-dare (digital academic repository) human liver cell ... · pdf filetranscript levels of...
TRANSCRIPT
UvA-DARE is a service provided by the library of the University of Amsterdam (http://dare.uva.nl)
UvA-DARE (Digital Academic Repository)
Human liver cell lines for the AMC-bioartificial liver
Nibourg, G.A.A.
Link to publication
Citation for published version (APA):Nibourg, G. A. A. (2012). Human liver cell lines for the AMC-bioartificial liver
General rightsIt is not permitted to download or to forward/distribute the text or part of it without the consent of the author(s) and/or copyright holder(s),other than for strictly personal, individual use, unless the work is under an open content license (like Creative Commons).
Disclaimer/Complaints regulationsIf you believe that digital publication of certain material infringes any of your rights or (privacy) interests, please let the Library know, statingyour reasons. In case of a legitimate complaint, the Library will make the material inaccessible and/or remove it from the website. Please Askthe Library: http://uba.uva.nl/en/contact, or a letter to: Library of the University of Amsterdam, Secretariat, Singel 425, 1012 WP Amsterdam,The Netherlands. You will be contacted as soon as possible.
Download date: 07 May 2018

CHAPTER 6
Increased hepatic functionality of the human hepatoma cell line
HepaRG cultured in the AMC bioreactor
Submitted
Geert A.A. NibourgRuurdtje Hoekstra
Tessa V. van der HoevenMariëtte T. Ackermans
Theodorus B.M. HakvoortThomas M. van Gulik
Robert A.F.M. Chamuleau

R1R2R3R4R5R6R7R8R9
R10R11R12R13R14R15R16R17R18R19R20R21R22R23R24R25R26R27R28R29R30R31R32R33R34R35R36R37R38R39
Chapter 6
106
ABstrACt
Background: The clinical application of a bioartificial liver (BAL) depends on the availability of a human cell source with high hepatic functionality, such as the human hepatoma cell line HepaRG. This cell line has demonstrated high hepatic functionality, but the effect of BAL culture on its functionality in time is not known.
Aim: To study the characteristics of the HepaRG-AMC-BAL over time, and compare the functionality of the HepaRG-AMC-BAL with monolayer cultures of HepaRG cells.
Methods & Results: Histological analysis of 14-day-old BALs demonstrated functional heterogeneity similar to that of monolayer cultures. Hepatic functionality of the HepaRG-AMC-BALs increased during 2-3 weeks of culture. The majority of the measured protein-normalized hepatic functions were already higher in day 14 BAL cultures compared to monolayer cultures, including ammonia elimination (3.2-fold), urea production (1.5-fold), conversion of 15N-ammonia into 15N-urea (1.4-fold), and cytochrome P450 3A4 activity (7.9-fold). Moreover, lactate production in monolayer cultures switched into lactate consumption in the BAL cultures, a hallmark of primary hepatocytes, and protein-normalized cell damage was 4-fold lower in day 14 BAL cultures compared to monolayer cultures. Transcript levels of cytochrome P450 genes and of regulatory genes hepatic nuclear factor 4α and pregnane X receptor increased in time in BAL cultures and reached higher levels than in monolayer cultures. Lastly, metabolism of amino acids, particularly the alanine and ornithine production of HepaRG-AMC-BALs more resembled that of primary hepatocytes than monolayer HepaRG cultures.
Conclusions: We conclude therefore that BAL culture of HepaRG cells increases its hepatic functionality, both over time, and compared to monolayer, and this is associated with a reduction in cell damage, upregulation of both regulatory and structural hepatic genes, and changes in amino-acid metabolism.
R1R2R3R4R5R6R7R8R9R10R11R12R13R14R15R16R17R18R19R20R21R22R23R24R25R26R27R28R29R30R31R32R33R34R35R36R37R38R39
Increased hepatic functionality of the human hepatoma cell line HepaRG cultured in the AMC bioreactor
107
6
iNtrODUCtiON
Bioartificial livers (BALs) have been developed to bridge patients with acute and acute-on-chronic liver failure to liver transplantation or liver regeneration.1 BALs typically comprise a bioreactor loaded with a biocomponent (e.g hepatocytes) and are able to replace the failing liver when connected to the patient’s circulation.
The AMC-BAL that was developed in our laboratory is based on a bioreactor with an internal oxygenator and a spirally wound, non-woven polyester matrix, yielding a three-dimensional culture environment that provides direct cell-plasma contact and optimal oxygenation of the biocomponent.2
BAL therapy should compensate for the loss of liver function that gives rise to hepatic encephalopathy, inflammation, and multi-organ failure. Functionally, this entails, among others, the elimination of ammonia, drug-metabolizing activity (e.g. cytochrome p450 (CYP) activity), lactate elimination, and the synthesis of blood proteins, such as clotting factors and apolipoprotein A-1.3-5
The human hepatoma cell line HepaRG is a promising candidate in this respect. HepaRG is a bipotent liver progenitor cell line that, in monolayer, differentiates into two distinct cell populations in a 28-day period. It differentiates upon reaching confluence, optionally followed by treatment with 2% dimethyl sulfoxide (DMSO) into: 1) hepatocyte-like cells that self-organize into clusters; and 2) cluster-neighboring cells that express biliary duct cell markers.6, 7
We confirmed that DMSO treatment increased the expression of CYP genes 4- to 20-fold in HepaRG monolayers, leading to e.g. a final CYP3A4 activity of 19% of primary human hepatocytes.8 However in the absence of DMSO a high level of ureagenesis, ammonia elimination, and hepatic protein synthesis was reached, partly due to a higher cell mass.8 Moreover, when cultured in the laboratory model of the AMC-BAL without DMSO for 14 days, HepaRG cells not only demonstrated a high level of ammonia elimination and hepatic protein synthesis, but also a relatively high CYP3A4 activity (6β-hydroxylation of testosterone), reaching 31% of primary human hepatocytes.9 The high functionality of this HepaRG-AMC-BAL was proven by significantly improving survival time during treatment of rats with acute liver failure.9
These results led to the hypothesis that culture of HepaRG cells in the AMC-BAL (in the absence of DMSO) increases their functionality. To investigate this hypothesis, we cultured HepaRG in laboratory scale AMC-BALs for 21 days and assessed hepatic functions at different time points. Subsequently, we compared the state of differentiation of 14 day-old HepaRG-AMC-BALs and HepaRG monolayers, both cultured in absence of DMSO, on basis of their protein-normalized functionality. Finally, we investigated the underlying factors for the upregulated hepatic functionality in the BAL related to cell damage, the expression of both structural and regulatory genes, and amino acid metabolism, the last playing an important role in the regulation of metabolic energy and nitrogen metabolism.10, 11
R1R2R3R4R5R6R7R8R9
R10R11R12R13R14R15R16R17R18R19R20R21R22R23R24R25R26R27R28R29R30R31R32R33R34R35R36R37R38R39
Chapter 6
108
metHODs
Monolayer cell cultureHepaRG cells were kindly provided by prof. C. Guguen-Guillouzo (INSERM, Rennes, France).6 HepaRG cells were cultured in 24-well culture plates (Corning, New York, U.S.) on HepaRG culture medium without DMSO but supplemented with 1 mM N-carbamoyl-L-glutamate (Sigma Aldrich, St. Louis, U.S.) to increase urea production.8 Analyses were conducted on monolayer HepaRG cultures of 28 days post-seeding.
AMC-BAL cultureFor BAL cultures, the HepaRG cells were large-scale expanded in Hyperflasks (Corning, New York, U.S.) in HepaRG medium without DMSO.6 Cultures were maintained at 37ºC in a humidified atmosphere (95% air, 5% CO2). Culture medium was refreshed every 3 to 4 days. 14-Day-old Hyperflask cultures were harvested using an Accutase (Innovative Cell Technologies, San Diego, U.S.), Accumax (Innovative Cell Technologies), and phosphate-buffered saline (PBS, Fresenius Kabi GmbH, Bad Homburg vor der Höhe, Germany) mix of 2:1:1 (v/v/v). Prior to loading the AMC-BAL, the isolated cells were centrifuged at 50x g for 5 min and washed twice with HepaRG medium.
A suspension of 2 mL cell pellet of HepaRG cells (~750 million cells) was loaded and cultured in laboratory-scale versions (9 mL) of the third generation AMC-BALs (RanD S.r.l. Medolla, Italy) (HepaRG-AMC-BALs) for maximally 21 days on HepaRG culture medium without DMSO and also supplemented with 1 mM N-carbamoyl-L-glutamate as described.9
Immunohistochemical analysis Day 14 BALs were formaline-fixed, paraplast-embedded, and cut in complete transverse 8 µm sections.12 Sections were stained for glutamine synthetase (GS), carbamoyl phosphate synthetase (CPS) and albumin (ALB) as described.8 In short, sections were incubated with primary antibodies, followed by incubation with alkaline-phosphate labeled secondary antibodies, and visualized using 5-bromo-4-chloro-3’-indolyphosphate p-toluidine and nitroblue. Per staining, all sections were treated similarly and negative controls did not include the primary antibody incubation.
Determination hepatic functions and protein contentHepatocyte function tests were performed on 28-day-old monolayer cultures (monolayer, n = 6-20) and HepaRG-AMC-BALs after 7 days (d7 BAL, n = 4-11), 14 days (d14 BAL, n = 4-12), and 21 days of culture (d21 BAL, n = 4-6).
For monolayer function tests, cultures were washed twice with phosphate buffered saline. Subsequently, HepaRG culture medium was replaced by 1 mL of HepaRG test medium (HepaRG
R1R2R3R4R5R6R7R8R9R10R11R12R13R14R15R16R17R18R19R20R21R22R23R24R25R26R27R28R29R30R31R32R33R34R35R36R37R38R39
Increased hepatic functionality of the human hepatoma cell line HepaRG cultured in the AMC bioreactor
109
6
medium with 1 mM N-carbamoyl-L-glutamate, 1.5 mM 15NH4Cl, 2.27 mM D-galactose, 2 mM L-lactate, 125 µM testosterone, and 2 mM ornithine hydrochloride (all compounds from Sigma Aldrich)). Medium samples were taken at different time points of incubation, maximally after 24 hours. Subsequently, cultures were washed twice with PBS and stored at -20°C for protein determination.
For HepaRG-AMC-BAL function tests, bioreactors were first flushed with 30 mL test medium (see above), followed by a 24-hour period of recirculation with 100 mL of test medium. Samples were taken from the test medium prior to connection and after 0.5, 1, 2, 4 and 24 hours of testing.
Test medium samples of monolayer and d7, d14 and d21 BAL cultures were analyzed for concentrations of ammonia, urea, 15N-urea, 6β-hydroxytestosterone (6β-OHT), apolipoprotein A-1, and lactate as described.8, 13-15 In addition, amino acids concentrations were determined in monolayer and d14 BAL test medium samples.8 Notably, concentrations of ammonia, 6β-OHT and lactate (other compounds not tested) did not change after 24 hours of perfusion through an acellular bioreactor under the same culture conditions (data not shown). Function-parameter rates were determined by calculating the changes in concentration in medium per hour as described.15 Of note, the ammonia elimination rates in the HepaRG-AMC-BAL were calculated over the first two hours of testing in HepaRG-AMC-BALs, during which the elimination rate was not reduced by substrate limitation, as occurring at later time points. Likewise, the increase in 6β-OHT concentration in time was not linear at later time points, probably related to subsequent phase-2 detoxification of 6β-OHT. Therefore, the rate of 6β-OHT production was calculated over the first 30 minutes of testing. All other function rates, including metabolism of the different amino acids, were constant over 24 hours of testing.
To study proliferation of HepaRG cells in the AMC-BAL and normalize function parameters for total protein, we determined the total protein content of monolayer cultures (n = 6-20), of cell suspensions at the time of BAL loading (n = 5) and of d14 BALs (n = 7). We lyzed these cells using 0.2 M NaOH (Merck, Darmstadt, Germany), as described.15 Subsequently, protein analysis was performed using the Coomassie Brilliant Blue G-250 staining kit (Bio-Rad, Hercules, California, U.S.). We normalized hepatic function parameters of monolayer d28 cultures and d14 BAL cultures for protein content.
Determination of cell leakageTo determine cell leakage in monolayer and AMC-BAL cultures of HepaRG, we determined the aspartate aminotransferase (AST) and lactate dehydrogenase (LDH) activity during function tests of monolayer and d14 BAL cultures over a 24-hour period, as described.13 To relate the measured activities to their total cell contents, the AST and LDH activity per g of protein in total lysates of monolayer cultures (n = 3) and of pieces of cell-filled-matrix extracted from d14 BALs (T-bags; n = 4) were determined as described.15
R1R2R3R4R5R6R7R8R9
R10R11R12R13R14R15R16R17R18R19R20R21R22R23R24R25R26R27R28R29R30R31R32R33R34R35R36R37R38R39
Chapter 6
110
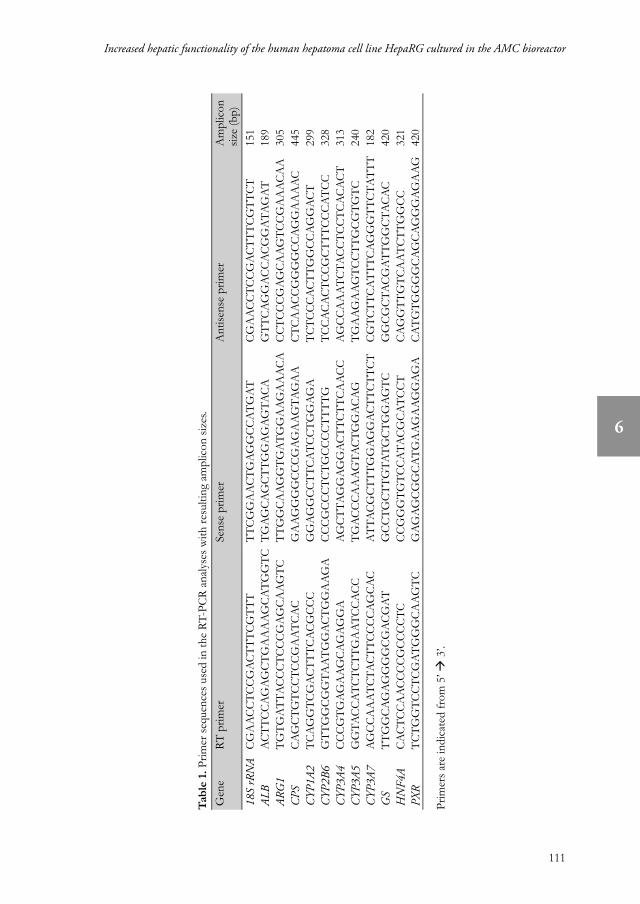
Quantitative reverse transcription-polymerase chain reactionFor gene expression analyses, we isolated RNA samples from (d28) monolayer cultures (n = 3) and from HepaRG-AMC-BAL matrix samples (T-bags) after 7 (n = 3-4), 14 (n = 3-5), and 21 (n = 3) days of BAL culture, using the RNeasy mini kit (Qiagen, Venlo, The Netherlands).12 First strand cDNA was generated as described using gene-specific reverse transcription primers.14 The quantitative reverse transcription polymerase chain reaction was performed as described.15 Transcript levels were normalized for 18S ribosomal RNA and calculated as the mean levels of two human liver samples that were included in the analysis as described.16 These liver samples derived from two female patients, aged 40 and 41 years, with liver adenoma and no elevated liver damage, after obtaining written informed consent. The patients were not on medication and had no history of drug/alcohol abuse. The procedure was in accordance with the ethical standards of the institutional committee on human experimentation (protocol number 03/024) and the Helsinki Declaration of 1975. Primer sequences and amplicon sizes are depicted in Table 1.
Statistical analysisWe compared differences between two experimental groups using unpaired Student’s t-tests. Differences between three or more experimental groups were compared using one-way analysis of variance (ANOVA) with Tukey post-hoc analysis. SPSS 16.0.1 (SPSS Inc., Chicago, IL, USA) was used for statistical analysis. Prism version 4.01 (GraphPad Prism Inc, San Diego, CA, USA) was used for graphical presentation of the data. Data are expressed as means ± standard deviations. Significance was reached if p < 0.05.
R1R2R3R4R5R6R7R8R9R10R11R12R13R14R15R16R17R18R19R20R21R22R23R24R25R26R27R28R29R30R31R32R33R34R35R36R37R38R39
Increased hepatic functionality of the human hepatoma cell line HepaRG cultured in the AMC bioreactor
111
6
Tab
le 1
. Prim
er s
eque
nces
use
d in
the
RT-
PCR
ana
lyse
s w
ith re
sulti
ng a
mpl
icon
siz
es.
Gen
eR
T p
rimer
Sens
e pr
imer
Ant
isen
se p
rimer
Am
plic
on
size
(bp)
18S
rRN
AC
GA
AC
CT
CC
GA
CT
TT
CG
TT
TT
TC
GG
AA
CT
GA
GG
CC
AT
GA
TC
GA
AC
CT
CC
GA
CT
TT
CG
TT
CT
151
ALB
AC
TT
CC
AG
AG
CT
GA
AA
AG
CA
TG
GT
CT
GA
GC
AG
CT
TG
GA
GA
GT
AC
AG
TT
CA
GG
AC
CA
CG
GA
TA
GA
T18
9AR
G1
TG
TG
AT
TA
CC
CT
CC
CG
AG
CA
AG
TC
TT
GG
CA
AG
GT
GA
TG
GA
AG
AA
AC
AC
CT
CC
CG
AG
CA
AG
TC
CG
AA
AC
AA
305
CPS
CA
GC
TG
TC
CT
CC
GA
AT
CA
CG
AA
GG
GG
CC
CG
AG
AA
GT
AG
AA
CT
CA
AC
CG
GG
GC
CA
GG
AA
AA
C44
5C
YP1A
2T
CA
GG
TC
GA
CT
TT
CA
CG
CC
CG
GA
GG
CC
TT
CA
TC
CT
GG
AG
AT
CT
CC
CA
CT
TG
GC
CA
GG
AC
T29
9C
YP2B
6G
TT
GG
CG
GT
AA
TG
GA
CT
GG
AA
GA
CC
CG
CC
CT
CT
GC
CC
CT
TT
TG
TC
CA
CA
CT
CC
GC
TT
TC
CC
AT
CC
328
CYP
3A4
CC
CG
TG
AG
AA
GC
AG
AG
GA
AG
CT
TA
GG
AG
GA
CT
TC
TT
CA
AC
CA
GC
CA
AA
TC
TA
CC
TC
CT
CA
CA
CT
313
CYP
3A5
GG
TA
CC
AT
CT
CT
TG
AA
TC
CA
CC
TG
AC
CC
AA
AG
TA
CT
GG
AC
AG
TG
AA
GA
AG
TC
CT
TG
CG
TG
TC
240
CYP
3A7
AG
CC
AA
AT
CT
AC
TT
CC
CC
AG
CA
CA
TT
AC
GC
TT
TG
GA
GG
AC
TT
CT
TC
TC
GT
CT
TC
AT
TT
CA
GG
GT
TC
TA
TT
T18
2G
ST
TG
GC
AG
AG
GG
GC
GA
CG
AT
GC
CT
GC
TT
GT
AT
GC
TG
GA
GT
CG
GC
GC
TA
CG
AT
TG
GC
TA
CA
C42
0H
NF4
AC
AC
TC
CA
AC
CC
CG
CC
CC
TC
CC
GG
GT
GT
CC
AT
AC
GC
AT
CC
TC
AG
GT
TG
TC
AA
TC
TT
GG
CC
321
PXR
TC
TG
GT
CC
TC
GA
TG
GG
CA
AG
TC
GA
GA
GC
GG
CA
TG
AA
GA
AG
GA
GA
CA
TG
TG
GG
GC
AG
CA
GG
GA
GA
AG
420
Prim
ers
are
indi
cate
d fr
om 5
’ à 3
’.

R1R2R3R4R5R6R7R8R9
R10R11R12R13R14R15R16R17R18R19R20R21R22R23R24R25R26R27R28R29R30R31R32R33R34R35R36R37R38R39
Chapter 6
112
resULts
Heterogeneous distribution of hepatic proteins of HepaRG-AMC-BALsWe stained transverse sections of d14 BALs for the hepatic proteins GS, CPS, and ALB. The HepaRG cells resided in the matrix of the BALs, were all vital, and the three cytosolic proteins were heterogeneously distributed among the cells (Fig. 1A-F), as found previously for -DMSO monolayer cultures.8 Notably, the distribution of ALB concentrated at the rims of cell-clusters, which possibly reflects an accumulation of this protein at the secretion site.
Figure 1. Immunostainings of cross-sections of d14 HepaRG-AMC-BALs. Proteins stained were GS (A) with its negative control (B), CPS (C) with its negative control (D), and ALB (E) with its negative control (F). Fibers of the AMC-BAL’s matrix are indicated with arrows. Bars: 10 µm. For color figure, see page 219.
Hepatic functionality of HepaRG-AMC-BALs increases with timeWe compared various hepatic functions of HepaRG-AMC-BALs during three weeks of culture (Fig. 2). From d7 to d21 the urea production (Fig. 2B), 15N-urea production (Fig. 2C), 6β-OHT production (Fig. 2D), and apolipoprotein A-1 production (Fig. 2E) increased (in most cases gradually) 3.2-, 2.2-, 5.1-, and 2.2-fold, respectively, whereas ammonia (Fig. 2A) and lactate production (Fig. 2F) remained stable.

R1R2R3R4R5R6R7R8R9R10R11R12R13R14R15R16R17R18R19R20R21R22R23R24R25R26R27R28R29R30R31R32R33R34R35R36R37R38R39
Increased hepatic functionality of the human hepatoma cell line HepaRG cultured in the AMC bioreactor
113
6
The increased functionality was (at least for the first 14 days) not due to an increase in proliferation in the AMC-BAL, as the total protein content of the HepaRG-AMC BAL at the time of loading (149 ± 18 mg) was not significantly different from the total protein content after 14 days of BAL culture (163 ± 16 mg) (p = 0.20). This is in line with the finding that the total DNA content neither changes during the first 14 days of BAL culture.9
BAL 7d BAL 14d BAL 21d0
1
2
3
4
5B
*
a
a
Ure
a pr
oduc
tion
(mm
ol× h
-1× B
AL-1
)
BAL 7d BAL 14d BAL 21d0.0
0.1
0.2
0.3
0.4
0.5
0.6 aC
*
a
15N
-ure
a pr
oduc
tion
(mm
ol× h
-1× B
AL-1
)
BAL 7d BAL 14d BAL 21d0
5
10
15 aD
a
*
6b-O
HT
prod
uctio
n(m
mol× h
-1× B
AL-1
)
BAL 7d BAL 14d BAL 21d0
50
100
150
200
250
300
350E ab
*
APO
A1
prod
uctio
n(m
g×h-1
× BA
L-1)
BAL 7d BAL 14d BAL 21d0.0
2.5
5.0
7.5
10.0
12.5F
Lact
ate
elim
inat
ion
(mm
ol× h
-1× B
AL-1
)
BAL 7d BAL 14d BAL 21d05
10152025303540455055
A
Am
mon
ia e
limin
atio
n(m
mol× h
-1× B
AL-1
)
Figure 2. Hepatic functions of d7, d14, and d21 HepaRG-AMC-BALs. Values are expressed as means ± standard deviations. Significance: * above accolade indicates p < 0.05 between all groups, ap < 0.05 versus d7 HepaRG-AMC-BALs, bp < 0.05 versus d14 HepaRG-AMC-BALs.
HepaRG-AMC-BALs reach higher hepatic functionality than HepaRG monolayer culturesWe compared protein normalized functional parameters of HepaRG-AMC-BAL after 14 days of culture with 28-day-old monolayer HepaRG cultures (Fig. 3A-F). All functions assessed were substantially higher in HepaRG-AMC-BALs than in HepaRG monolayer cultures, except for the

R1R2R3R4R5R6R7R8R9
R10R11R12R13R14R15R16R17R18R19R20R21R22R23R24R25R26R27R28R29R30R31R32R33R34R35R36R37R38R39
Chapter 6
114
apolipoprotein A-1 production (Fig. 3E), which was equal. The relative increases were 3.2-fold for ammonia elimination, 1.5-fold for urea production, 1.4-fold for conversion of 15N-ammonia into 15N-urea, and 7.9-fold for CYP3A4 activity. Moreover, lactate production (Fig. 3F) in monolayer cultures had switched into lactate consumption in HepaRG-AMC-BALs, a hallmark of BAL cultures of primary hepatocytes.17
Monolayer 28d BAL 14d0
2
4
6
8
10
12
14a
B
Ure
a pr
oduc
tion
(mm
ol× h
-1× g
of p
rote
in-1
)
Monolayer 28d BAL 14d0.0
0.5
1.0
1.5
2.0
2.5
3.0
3.5 aC
15N
-ure
a pr
oduc
tion
(mm
ol× h
-1× g
of p
rote
in-1
)
Monolayer 28d BAL 14d02468
10121416 a
D
6b-O
HT
prod
uctio
n(m
mol× h
-1× g
of p
rote
in-1
)
Monolayer 28d BAL 14d0
200400600800
100012001400160018002000E
APO
A1
prod
uctio
n(m
g×h-1
× g o
f pro
tein
-1)
Monolayer 28d BAL 14d-300-250-200-150-100
-500
50100
a
F
Lact
ate
elim
inat
ion
(mm
ol× h
-1× g
of p
rote
in-1
)
Monolayer 28d BAL 14d0
50
100
150
200
250
300a
A
Am
mon
ia e
limin
atio
n(m
mol× h
-1× g
of p
rote
in-1
)
Figure 3. Hepatic functions of 28-day monolayer cultures of HepaRG cells and d14 HepaRG-AMC-BALs. Values are expressed as means ± standard deviations. Significance: ap < 0.05 versus monolayer cultures.
Cell leakage in HepaRG-AMC-BALs is lower than in monolayer cultures of HepaRGAs one of factors potentially related to the BAL-culture induced increase in hepatic functionality of HepaRG cells, we compared cell damage in monolayer cultures and d14 HepaRG-AMC-BALs. As markers for cell damage, we measured the amounts of AST and LDH leakage per hour, expressed as a fraction of the total amount of AST and LDH content in the cell cultures. Monolayer cultures and HepaRG-AMC-BALs contained 318 ± 28 and 896 ± 442 U AST/g
R1R2R3R4R5R6R7R8R9R10R11R12R13R14R15R16R17R18R19R20R21R22R23R24R25R26R27R28R29R30R31R32R33R34R35R36R37R38R39
Increased hepatic functionality of the human hepatoma cell line HepaRG cultured in the AMC bioreactor
115
6
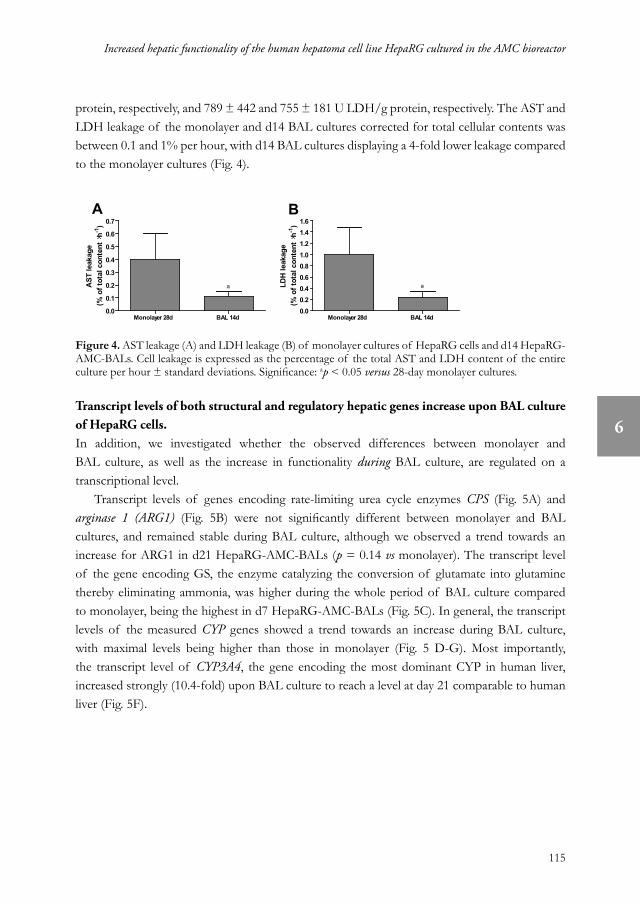
protein, respectively, and 789 ± 442 and 755 ± 181 U LDH/g protein, respectively. The AST and LDH leakage of the monolayer and d14 BAL cultures corrected for total cellular contents was between 0.1 and 1% per hour, with d14 BAL cultures displaying a 4-fold lower leakage compared to the monolayer cultures (Fig. 4).
Monolayer 28d BAL 14d0.0
0.1
0.2
0.3
0.4
0.5
0.6
0.7
a
A
AST
leak
age
(% o
f tot
al c
onte
nt× h
-1)
Monolayer 28d BAL 14d0.00.20.40.60.81.01.21.41.6
a
B
LDH
leak
age
(% o
f tot
al c
onte
nt× h
-1)
Figure 4. AST leakage (A) and LDH leakage (B) of monolayer cultures of HepaRG cells and d14 HepaRG-AMC-BALs. Cell leakage is expressed as the percentage of the total AST and LDH content of the entire culture per hour ± standard deviations. Significance: ap < 0.05 versus 28-day monolayer cultures.
Transcript levels of both structural and regulatory hepatic genes increase upon BAL culture of HepaRG cells.In addition, we investigated whether the observed differences between monolayer and BAL culture, as well as the increase in functionality during BAL culture, are regulated on a transcriptional level.
Transcript levels of genes encoding rate-limiting urea cycle enzymes CPS (Fig. 5A) and arginase 1 (ARG1) (Fig. 5B) were not significantly different between monolayer and BAL cultures, and remained stable during BAL culture, although we observed a trend towards an increase for ARG1 in d21 HepaRG-AMC-BALs (p = 0.14 vs monolayer). The transcript level of the gene encoding GS, the enzyme catalyzing the conversion of glutamate into glutamine thereby eliminating ammonia, was higher during the whole period of BAL culture compared to monolayer, being the highest in d7 HepaRG-AMC-BALs (Fig. 5C). In general, the transcript levels of the measured CYP genes showed a trend towards an increase during BAL culture, with maximal levels being higher than those in monolayer (Fig. 5 D-G). Most importantly, the transcript level of CYP3A4, the gene encoding the most dominant CYP in human liver, increased strongly (10.4-fold) upon BAL culture to reach a level at day 21 comparable to human liver (Fig. 5F).

R1R2R3R4R5R6R7R8R9
R10R11R12R13R14R15R16R17R18R19R20R21R22R23R24R25R26R27R28R29R30R31R32R33R34R35R36R37R38R39
Chapter 6
116
Monolayer BAL 7d BAL 14d BAL 21d0
10
20
30
40
50
60A
CPS
tran
scrip
t lev
els
(% o
f hum
an li
ver)
Monolayer BAL 7d BAL 14d BAL 21d0
5
10
15
20
25
30
35B
AR
G1
trans
crip
t lev
els
(% o
f hum
an li
ver)
Monolayer BAL 7d BAL 14d BAL 21d0
100200300400500600700800900
100011001200
*a
abab
C
GS
trans
crip
t lev
els
(% o
f hum
an li
ver)
Monolayer BAL 7d BAL 14d BAL 21d0.0
0.5
1.0
1.5
2.0
2.5 a
D
CYP
1A2
tran
scrip
t lev
els
(% o
f hum
an li
ver)
Monolayer BAL 7d BAL 14d BAL 21d0
50
100
150
200
250
300
350
E
CYP
2B6
tran
scrip
t lev
els
(% o
f hum
an li
ver)
Monolayer BAL 7d BAL 14d BAL 21d0
25
50
75
100
125
150
175 a *F
CYP
3A4
tran
scrip
t lev
els
(% o
f hum
an li
ver)
Monolayer BAL 7d BAL 14d BAL 21d05
1015202530354045
UD
G
CYP
3A7
tran
scrip
tion
leve
ls(%
of h
uman
live
r)
Figure 5. Transcript levels of various structural hepatic genes of 28-day-old monolayer cultures of HepaRG cells and 7-, 21-, and d14 HepaRG-AMC-BALs. Values are expressed as means ± standard deviations. Abbreviations: ARG1, arginase 1; CPS, carbamoylphosphate synthetase; CYP, cytochrome P450; GS, glutamine synthetase; UD, undetectable. Significance: * above accolade indicates p < 0.05 between all groups, ap < 0.05 versus monolayer cultures, bp < 0.05 versus d7 HepaRG-AMC-BALs.
We determined the transcript levels of two hepatic transcription factors: hepatic nuclear factor 4α (HNF4α; nuclear receptor subfamily 2, group A, member 1), an important regulator of morphological and functional liver development (including drug metabolism) and a repressor
R1R2R3R4R5R6R7R8R9R10R11R12R13R14R15R16R17R18R19R20R21R22R23R24R25R26R27R28R29R30R31R32R33R34R35R36R37R38R39
Increased hepatic functionality of the human hepatoma cell line HepaRG cultured in the AMC bioreactor
117
6
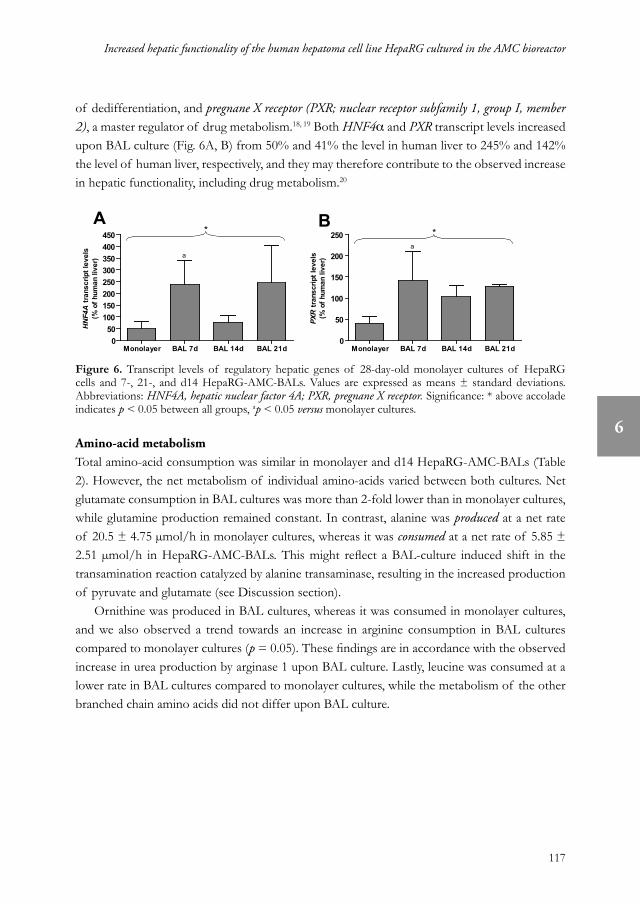
of dedifferentiation, and pregnane X receptor (PXR; nuclear receptor subfamily 1, group I, member 2), a master regulator of drug metabolism.18, 19 Both HNF4α and PXR transcript levels increased upon BAL culture (Fig. 6A, B) from 50% and 41% the level in human liver to 245% and 142% the level of human liver, respectively, and they may therefore contribute to the observed increase in hepatic functionality, including drug metabolism.20
Monolayer BAL 7d BAL 14d BAL 21d0
50100150200250300350400450
*
a
A
HN
F4A
tran
scrip
t lev
els
(% o
f hum
an li
ver)
Monolayer BAL 7d BAL 14d BAL 21d0
50
100
150
200
250 *
a
B
PXR
tran
scrip
t lev
els
(% o
f hum
an li
ver)
Figure 6. Transcript levels of regulatory hepatic genes of 28-day-old monolayer cultures of HepaRG cells and 7-, 21-, and d14 HepaRG-AMC-BALs. Values are expressed as means ± standard deviations. Abbreviations: HNF4A, hepatic nuclear factor 4A; PXR, pregnane X receptor. Significance: * above accolade indicates p < 0.05 between all groups, ap < 0.05 versus monolayer cultures.
Amino-acid metabolismTotal amino-acid consumption was similar in monolayer and d14 HepaRG-AMC-BALs (Table 2). However, the net metabolism of individual amino-acids varied between both cultures. Net glutamate consumption in BAL cultures was more than 2-fold lower than in monolayer cultures, while glutamine production remained constant. In contrast, alanine was produced at a net rate of 20.5 ± 4.75 µmol/h in monolayer cultures, whereas it was consumed at a net rate of 5.85 ± 2.51 µmol/h in HepaRG-AMC-BALs. This might reflect a BAL-culture induced shift in the transamination reaction catalyzed by alanine transaminase, resulting in the increased production of pyruvate and glutamate (see Discussion section).
Ornithine was produced in BAL cultures, whereas it was consumed in monolayer cultures, and we also observed a trend towards an increase in arginine consumption in BAL cultures compared to monolayer cultures (p = 0.05). These findings are in accordance with the observed increase in urea production by arginase 1 upon BAL culture. Lastly, leucine was consumed at a lower rate in BAL cultures compared to monolayer cultures, while the metabolism of the other branched chain amino acids did not differ upon BAL culture.

R1R2R3R4R5R6R7R8R9
R10R11R12R13R14R15R16R17R18R19R20R21R22R23R24R25R26R27R28R29R30R31R32R33R34R35R36R37R38R39
Chapter 6
118
Table 2. Amino acid metabolism of HepaRG monolayer cultures and HepaRG-AMC-BALs.Amino acid HepaRG Monolayer
(µmol·h-1·g of protein-1)HepaRG-AMC-BAL 14d (µmol·h-1·g of protein-1)
ALA 20.5 ± 4.75 -5.85 ± 2.51 a
ARG -1.64 ± 0.90 -3.66 ± 1.26ASN -1.31 ± 0.86 -0.77 ± 0.44ASP N/A N/ACIT -0.15 ± 0.33 -0.24 ± 0.60GLN 7.15 ± 3.19 9.72 ± 2.90GLU -16.14 ± 1.19 -7.13 ± 2.17 a
GLY N/A N/AHIS -1.71 ± 0.91 -1.78 ± 0.73ILE -7.88 ± 1.28 -6.84 ± 2.02LEU -17.55 ± 1.30 -10.66 ± 2.59 a
LYS -10.34 ± 6.13 -9.25 ± 4.59MET -2.06 ± 1.20 -1.68 ± 0.57ORN -8.57 ± 7.98 1.69 ± 1.30 a
PHE -2.82 ± 0.61 -1.25 ± 0.46 a
SER -4.30 ± 3.44 -1.18 ± 7.11TAU -3.73 ± 2.22 -2.70 ± 1.04THR -3.92 ± 2.08 -2.81 ± 1.16TRP -3.45 ± 2.27 -2.58 ± 1.33TYR -0.12 ± 0.16 -0.08 ± 0.07VAL -4.35 ± 1.16 -5.06 ± 1.62Total -62.36 ± 57.04 -54.05 ± 22.35
Amino acid production and consumption are indicated as positive and negative values, respectively. Abbreviations: AMC-BAL, Academic Medical Center-bioartificial liver; N/A, not available. Values are given as averages ± standard deviations (n = 3 to 5). a p < 0.05 versus HepaRG monolayer cultures.
DisCUssiON
In this study, we demonstrate that culturing of the human hepatoma cell line HepaRG in the AMC-BAL increases its hepatic functionality, both over time, and compared to monolayer. The increase in functionality was most prominent after 14 and 21 days of BAL culture and was associated with a reduction in cell damage, upregulation of both regulatory and structural hepatic genes, and changes in amino-acid metabolism. In addition, the HepaRG cells maintain their functional heterogeneity upon BAL culture, as demonstrated by histological analysis.
The cause of this BAL-culture induced increase in hepatic functionality is most likely multi-factorial. Firstly, the AMC-BAL provides a three-dimensional culture environment whereas monolayer is two-dimensional. Three-dimensional cultures of hepatocytes more resemble the in vivo cellular organization in terms of cell-cell contacts, polarity, morphology, and the composition of the extracellular matrix.21, 22 In addition, the AMC-BAL has an internal
R1R2R3R4R5R6R7R8R9R10R11R12R13R14R15R16R17R18R19R20R21R22R23R24R25R26R27R28R29R30R31R32R33R34R35R36R37R38R39
Increased hepatic functionality of the human hepatoma cell line HepaRG cultured in the AMC bioreactor
119
6
oxygenator, providing superior oxygenation of the cells compared to monolayer, known to increase functionality.23-25 Lastly, the AMC-BAL is perfused with culture medium in contrast to the static culture environment of the monolayer cultures, also known to increase functionality.26
Gene expression analysis revealed that the difference in hepatic functionality in d14 HepaRG-AMC-BALs vs HepaRG monolayer cultures may be partially explained by regulation on a transcriptional level. For instance, the 7.9-fold increase in CYP3A4 activity (6β-OHT production) coincided with a comparable 10.4-fold increase in CYP3A4 transcript levels, suggesting a transcriptionally regulated increase of CYP3A4. This may well be caused by the observed upregulation of both PXR and HNF4A expression, both important transcriptional regulators of CYP3A4.20 The increase in ammonia elimination may likewise be regulated on a transcriptional level, as GS transcript levels were significantly higher in the d14 BAL cultures compared to the monolayer cultures. Notably, ammonia elimination in HepaRG cells is mainly realized by fixation into amino acids (initially glutamate and glutamine), and not by conversion into urea. Both 15N-urea production and total urea production increased significantly upon BAL culture of HepaRG cells, notwithstanding the lack of a significant increase in the transcription level of CPS and arginase 1, suggesting regulation at a posttranscriptional level, or regulation by other factors or enzymes involved in the urea cycle.
The amino acid metabolism in HepaRG-AMC-BAL cultures more resembled the metabolism of primary hepatocytes than that of HepaRG monolayer cultures.2 In contrast to monolayer HepaRG cultures, both primary porcine hepatocyte and HepaRG BAL cultures produced alanine and ornithine. However, glutamate metabolism of HepaRG-AMC-BALs (consumption) differs with primary-porcine-hepatocyte-AMC-BALs (production). This difference might be related to the high GS activity in HepaRG-AMC-BALs compared to primary porcine hepatocyte AMC-BALs.2 Furthermore, we observed a substantial decrease in glutamate consumption upon BAL culture of HepaRG cells and a transition from alanine production into consumption. This suggests that the transamination reaction catalyzed by alanine aminotransferase in which glutamate and pyruvate are converted into alanine and α-ketoglutarate and visa versa shifts towards the production of glutamate and pyruvate. This may, in part, explain the discrepancy between a high increase in elimination of ammonia and the limited change in glutamate/glutamine metabolism in HepaRG cells (< 10% of the change in ammonia elimination) of 14d BALs versus monolayers. The higher 15N-urea production in 14d BALs relative to monolayers coincided with a switch from ornithine consumption into production, and a strong trend towards an increase in arginine consumption (p = 0.05), the respective product and substrate of the ARG1 reaction in the urea cycle.
In addition, the amino acid, ammonia, and urea data provide interesting insights in the nitrogen metabolism of the HepaRG-AMC-BAL. The rate of ammonia elimination is 168 µmol per hour per gram of protein. The net total amino acid consumption is 54 µmol per hour per gram of protein. This equates to a total influx of at least 222 µmol of nitrogen per hour per
R1R2R3R4R5R6R7R8R9
R10R11R12R13R14R15R16R17R18R19R20R21R22R23R24R25R26R27R28R29R30R31R32R33R34R35R36R37R38R39
Chapter 6
120
gram of protein – at least, as several amino acids also contain nitrogen atoms in the side chain next to the amine group. However, the rate of total urea production is only 13 µmol per hour per gram of protein, covering the elimination of only 26 µmol of ammonia per hour. The majority of the nitrogen that is taken up by the HepaRG cells must therefore be used for protein synthesis, and as the total protein content in the HepaRG-AMC-BAL does not change during two weeks of culture, this suggests a substantial protein secretion. This would also explain the lack of stoichiometry in the changes in ammonia elimination and urea production by quantitative amino acid analysis in our set-up.9
In monolayer cultures, we observed lactate production, whereas BAL cultures of HepaRG cells consumed lactate. Lactate consumption is a liver-specific function and part of the Cory cycle, in which lactate that is produced by anaerobic glycolysis in the muscles and subsequently transported to the liver where it is converted into pyruvate and later glucose. Lactate consumption is also a hallmark of freshly isolated hepatocytes.17 In contrast, liver cell cultures produce lactate under anaerobic conditions or when the cells have dedifferentiated. The latter effect, known as the Warburg effect, is also a feature of tumor cells as a means of rapid cytosolic energy production.27, 28 Based on the increased hepatic functionality upon culturing the HepaRG cells in the BAL, the shift from lactate production into consumption can probably be attributed to the higher differentiation state of the HepaRG cells rather than to the increased oxygenation in the BAL versus monolayer, however the causal relation between oxygenation, lactate metabolism and hepatic differentiation needs to be further established.
In conclusion, the results of this study contribute to the clinical implementation of a BAL based on the HepaRG cells, as it shows that BAL culture improves its hepatic functionality. Notably, the functionality of a HepaRG-AMC-BAL is higher and more all round than that of a DMSO-treated HepaRG monolayer culture, without the DMSO-associated negative effects as cell damage and repression of particular hepatic functions.8, 9 The d21 BALs functionally outweigh d14 BALs, raising the question whether further extension of the BAL culture period, i.e. 4 weeks and longer, would further increase the hepatic functionality of the HepaRG-AMC-BAL. This also offers high perspectives for BAL therapy, as the d14 HepaRG-AMC-BAL was already effective in the treatment of rats with ALF.9 Finally, this study further encourages clinical studies with the HepaRG-AMC-BAL to evaluate its safety and efficacy in patients with ALF.
ACKNOWLeDGmeNts
The authors express their gratitude to the Subsidy Regulation Knowledge Exploitation (SKE-fund) of the AMC and Hep-Art Medical Devices B.V., Amsterdam, for their financial support and to An Ruiter from the laboratory of Endocrinology of the AMC for performing the 15N-urea and 6β-OHT analyses.

R1R2R3R4R5R6R7R8R9R10R11R12R13R14R15R16R17R18R19R20R21R22R23R24R25R26R27R28R29R30R31R32R33R34R35R36R37R38R39
Increased hepatic functionality of the human hepatoma cell line HepaRG cultured in the AMC bioreactor
121
6
reFereNCes
1. Carpentier B, Gautier A, Legallais C. Artificial and bioartificial liver devices: present and future. Gut 2009;58(12):1690-1702.
2. Flendrig LM, la Soe JW, Jorning GG et al. In vitro evaluation of a novel bioreactor based on an integral oxygenator and a spirally wound nonwoven polyester matrix for hepatocyte culture as small aggregates. J Hepatol 1997;26(6):1379-1392.
3. Butterworth RF. Role of circulating neurotoxins in the pathogenesis of hepatic encephalopathy: potential for improvement following their removal by liver assist devices. Liver Int 2003;23 Suppl 3:5-9.
4. Bjerring PN, Hauerberg J, Jorgensen L et al. Brain hypoxanthine concentration correlates to lactate/pyruvate ratio but not intracranial pressure in patients with acute liver failure. J Hepatol 2010;53(6):1054-1058.
5. Li Y, Dong JB, Wu MP. Human ApoA-I overexpression diminishes LPS-induced systemic inflammation and multiple organ damage in mice. Eur J Pharmacol 2008;590(1-3):417-422.
6. Gripon P, Rumin S, Urban S et al. Infection of a human hepatoma cell line by hepatitis B virus. Proc Natl Acad Sci U S A 2002;99(24):15655-15660.
7. Cerec V, Glaise D, Garnier D et al. Transdifferentiation of hepatocyte-like cells from the human hepatoma HepaRG cell line through bipotent progenitor. Hepatology 2007;45(4):957-967.
8. Hoekstra R, Nibourg GA, van der Hoeven TV et al. The HepaRG cell line is suitable for bioartificial liver application. Int J Biochem Cell Biol 2011;43(10):1483-1489.
9. Nibourg GA, Chamuleau RA, van der Hoeven TV et al. Liver Progenitor Cell Line HepaRG Differentiated in a Bioartificial Liver Effectively Supplies Liver Support to Rats with Acute Liver Failure. PLoS One 2012;7(6):e38778.
10. Meijer AJ. Amino acids as regulators and components of nonproteinogenic pathways. J Nutr 2003;133(6 Suppl 1):2057S-2062S.
11. Xiao F, Huang Z, Li H et al. Leucine deprivation increases hepatic insulin sensitivity via GCN2/mTOR/S6K1 and AMPK pathways. Diabetes 2011;60(3):746-756.
12. Poyck PP, Hoekstra R, Chhatta A et al. Time-related analysis of metabolic liver functions, cellular morphology, and gene expression of hepatocytes cultured in the bioartificial liver of the Academic Medical Center in Amsterdam (AMC-BAL). Tissue Eng 2007;13(6):1235-1246.
13. van de Kerkhove MP, Poyck PP, van Wijk AC et al. Assessment and improvement of liver specific function of the AMC-bioartificial liver. Int J Artif Organs 2005;28(6):617-630.
14. Deurholt T, van Til NP, Chhatta AA et al. Novel immortalized human fetal liver cell line, cBAL111, has the potential to differentiate into functional hepatocytes. BMC Biotechnol 2009;9:89.
15. Nibourg GA, Huisman MT, van der Hoeven TV, van Gulik TM, Chamuleau RA, Hoekstra R. Stable overexpression of Pregnane X receptor in HepG2 cells increases its potential for bioartificial liver application. Liver Transpl 2010;16(9):1075-1085.
16. Hoekstra R, Deurholt T, Poyck PP, ten Bloemendaal L, Chhatta AA. Increased reproducibility of quantitative reverse transcriptase-PCR. Anal Biochem 2005;340(2):376-379.
17. Poyck PP, Hoekstra R, van Wijk AC et al. Functional and morphological comparison of three primary liver cell types cultured in the AMC bioartificial liver. Liver Transpl 2007;13(4):589-598.
18. Parviz F, Matullo C, Garrison WD et al. Hepatocyte nuclear factor 4alpha controls the development of a hepatic epithelium and liver morphogenesis. Nat Genet 2003;34(3):292-296.
19. Santangelo L, Marchetti A, Cicchini C et al. The stable repression of mesenchymal program is required for hepatocyte identity: a novel role for hepatocyte nuclear factor 4alpha. Hepatology 2011;53(6):2063-2074.
20. Tirona RG, Lee W, Leake BF et al. The orphan nuclear receptor HNF4alpha determines PXR- and CAR-mediated xenobiotic induction of CYP3A4. Nat Med 2003;9(2):220-224.
21. Berthiaume F, Moghe PV, Toner M, Yarmush ML. Effect of extracellular matrix topology on cell structure, function, and physiological responsiveness: hepatocytes cultured in a sandwich configuration. FASEB J 1996;10(13):1471-1484.

R1R2R3R4R5R6R7R8R9
R10R11R12R13R14R15R16R17R18R19R20R21R22R23R24R25R26R27R28R29R30R31R32R33R34R35R36R37R38R39
Chapter 6
122
22. Meng Q. Three-dimensional culture of hepatocytes for prediction of drug-induced hepatotoxicity. Expert Opin Drug Metab Toxicol 2010;6(6):733-746.
23. Mareels G, Poyck PP, Eloot S, Chamuleau RA, Verdonck PR. Three-dimensional numerical modeling and computational fluid dynamics simulations to analyze and improve oxygen availability in the AMC bioartificial liver. Ann Biomed Eng 2006;34(11):1729-1744.
24. Poyck PP, Mareels G, Hoekstra R et al. Enhanced oxygen availability improves liver-specific functions of the AMC bioartificial liver. Artif Organs 2008;32(2):116-126.
25. Tilles AW, Baskaran H, Roy P, Yarmush ML, Toner M. Effects of oxygenation and flow on the viability and function of rat hepatocytes cocultured in a microchannel flat-plate bioreactor. Biotechnol Bioeng 2001;73(5):379-389.
26. Shvartsman I, Dvir T, Harel-Adar T, Cohen S. Perfusion cell seeding and cultivation induce the assembly of thick and functional hepatocellular tissue-like construct. Tissue Eng Part A 2009;15(4):751-760.
27. Vander Heiden MG, Cantley LC, Thompson CB. Understanding the Warburg effect: the metabolic requirements of cell proliferation. Science 2009;324(5930):1029-1033.
28. Hirschhaeuser F, Sattler UG, Mueller-Klieser W. Lactate: a metabolic key player in cancer. Cancer Res 2011;71(22):6921-6925.