utmost: unregistered transport { mobility, safety and new
TRANSCRIPT

UTMOST: Unregistered Transport – Mobility,Safety and new Technologies
INF5261 - Autumn 2014
Jon-Robert Skarberg
Kjetil Sletten
Martin Kolbeinsvik
Department of Informatics
University of Oslo
19.11.2014
UiO - INF5261 Fall 2014
Contents
1 Introduction 1
1.1 Motivation . . . . . . . . . . . . . . . . . . . . . . . . . . . . . . . . . . . . . . . . . . . 1
1.2 Background . . . . . . . . . . . . . . . . . . . . . . . . . . . . . . . . . . . . . . . . . . . 1
1.3 Question/Problem/Hypothesis . . . . . . . . . . . . . . . . . . . . . . . . . . . . . . . . 2
1.4 What we are doing, and how . . . . . . . . . . . . . . . . . . . . . . . . . . . . . . . . . 2
2 Theory 3
2.1 GPS and location data . . . . . . . . . . . . . . . . . . . . . . . . . . . . . . . . . . . . . 3
2.2 Other solutions . . . . . . . . . . . . . . . . . . . . . . . . . . . . . . . . . . . . . . . . . 3
2.2.1 Skoleveiagenten . . . . . . . . . . . . . . . . . . . . . . . . . . . . . . . . . . . . . 3
2.2.2 Logging . . . . . . . . . . . . . . . . . . . . . . . . . . . . . . . . . . . . . . . . . 4
2.2.3 Visualization . . . . . . . . . . . . . . . . . . . . . . . . . . . . . . . . . . . . . . 4
2.3 Technical review . . . . . . . . . . . . . . . . . . . . . . . . . . . . . . . . . . . . . . . . 5
2.3.1 Logging . . . . . . . . . . . . . . . . . . . . . . . . . . . . . . . . . . . . . . . . . 5
2.3.2 Visualization . . . . . . . . . . . . . . . . . . . . . . . . . . . . . . . . . . . . . . 6
2.4 Relevant course literature . . . . . . . . . . . . . . . . . . . . . . . . . . . . . . . . . . . 8
2.4.1 CityFlocks . . . . . . . . . . . . . . . . . . . . . . . . . . . . . . . . . . . . . . . 8
2.4.2 Aspects of personal navigation with collaborative user feedback . . . . . . . . . . 8
2.4.3 Negotiating Privacy Boundaries in Social Applications for Accessibility Mapping 8
2.4.4 Location-Based Crowdsourcing of Hyperlocal News . . . . . . . . . . . . . . . . . 8
2.4.5 Mobility in Collaboration . . . . . . . . . . . . . . . . . . . . . . . . . . . . . . . 9
3 Case and method 10
3.1 Users/Stakeholders . . . . . . . . . . . . . . . . . . . . . . . . . . . . . . . . . . . . . . . 10
3.2 Methods to address the questions . . . . . . . . . . . . . . . . . . . . . . . . . . . . . . . 10
3.3 Data collection . . . . . . . . . . . . . . . . . . . . . . . . . . . . . . . . . . . . . . . . . 10
i

UiO - INF5261 Fall 2014
3.4 Data analysis . . . . . . . . . . . . . . . . . . . . . . . . . . . . . . . . . . . . . . . . . . 11
3.4.1 Data collection . . . . . . . . . . . . . . . . . . . . . . . . . . . . . . . . . . . . . 11
3.4.2 Data visualization . . . . . . . . . . . . . . . . . . . . . . . . . . . . . . . . . . . 11
4 Universal design 12
5 Prototype 13
6 Findings 16
6.1 What did we find with our investigation? . . . . . . . . . . . . . . . . . . . . . . . . . . 16
6.2 Conlusion to our findings . . . . . . . . . . . . . . . . . . . . . . . . . . . . . . . . . . . 16
7 Discussion 17
7.1 Discuss the questions from introduction . . . . . . . . . . . . . . . . . . . . . . . . . . . 17
7.2 Connections between own findings and findings of similar studies . . . . . . . . . . . . . 17
8 Conclusion 19
9 Limitations and the work ahead 19
References 20
ii
UiO - INF5261 Fall 2014
1 Introduction
1.1 Motivation
The UTMOST project wants to improve the data on accident exposure in previously unregistered
means of transportation, such as walking, cycling, leisure boating and snowmobiling. In this project
there are three major issues, two of which we are addressing: collecting the data and visualizing it.
This would be useful for several reasons; better knowledge of what activities that are done, where it
happens and how prone the people doing them are to accidents.
In this project, the main goal is to visualise the data from a pilot project by Oslo municipality, by
trying to implement a simple version of a website to represent the data using a heat map, and exploring
other possibilities for visualization as well. The secondary goals are to learn new mobile technologies
and to explore the different approaches of digital logging. Specifically, secondary transport types.
1.2 Background
The main goal of the UTMOST project is to gather data on accident exposure, and we want to
contribute to this. Little is known about how and where people move during leisure activities in
Norway.
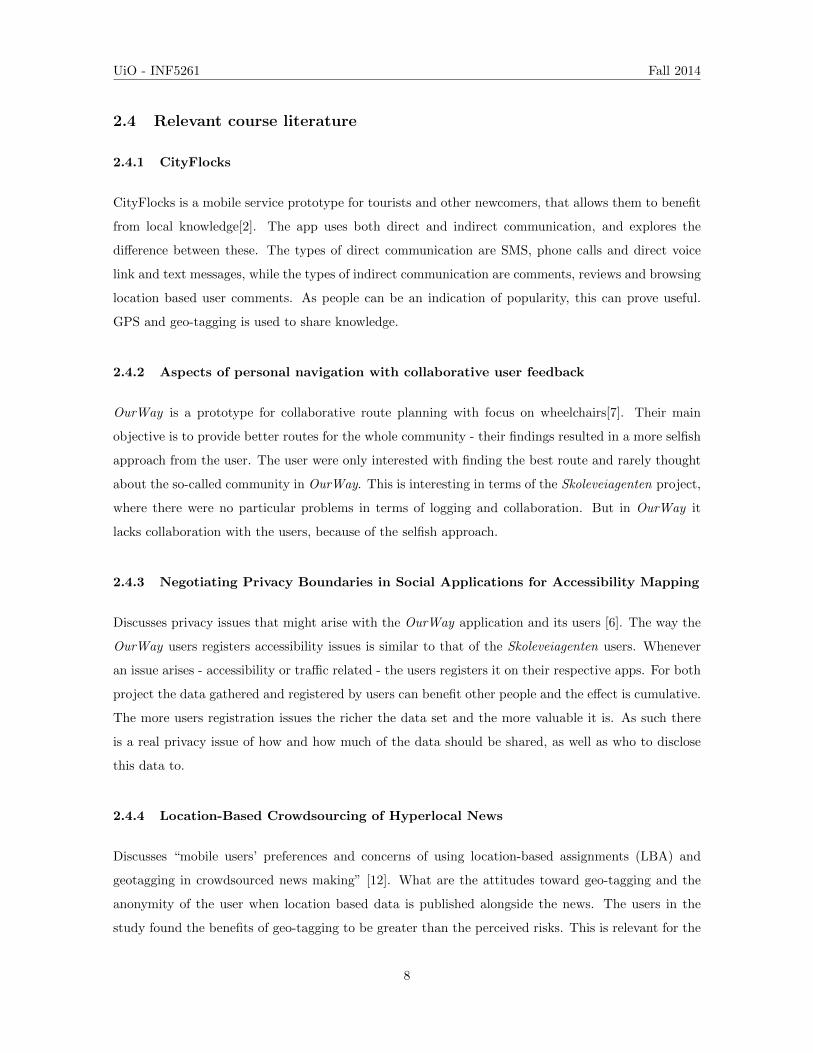
A study made by TØI in cooperation with Oslo municipality collected data from two schools. This
was done by creating an “agent app”, called “Skoleveiagenten”, allowing the school kids to be “secret
agents” and reporting good or bad road conditions to TØI. The gathered data is time and GPS
location data that registers the route travelled to school, as well as traffic issues. These issues are
safety aspected and the “agents” can select issues such as “low visibility” and “lots of traffic”.
Figure 1: Simple use-case diagram of Skoleveiagenten
1

UiO - INF5261 Fall 2014
This app has been used by school children in a few selected Oslo schools, and some pilot data has been
collected. The data collected by this app will be used by us for our representation purposes, but the
app itself is not exactly what we are after.
Cycle routes are somewhat of a hot topic in Oslo this year, and a number of news articles are found
on osloby.no newspaper [1]. In one of the articles a map with more than 2000 reader contributions
as of October 2014 shows where in Oslo the readers feel unsafe when using their bicycle, but it only
shows these single dangerous locations and not their route[14]. These dangerous locations are of course
interesting, but it is not sufficient for mapping dangerous routes.
In Oslo there are city bikes, and early on this was discussed by the group as a way of obtaining travel
data. However, the data is only about departure and arrival locations, and we would be left to guess
what had been done in between. This data is not accurate enough for representing real-world usage
and we abandoned this idea.
1.3 Question/Problem/Hypothesis
As little is currently known about the unregistered types of travel mentioned earlier, one of our main
problems is to obtain travel data. We explore several different possibilities for doing this. Neither
Transportøkonomisk institutt (TØI) or Oslo municipality currently has a good way of visualizing this
kind of big data, and we thus want to find a good option of doing this in a scalable way that allows
for large expansions of data in the future. Our two main questions are as follows:
1. What are the ways of collecting travel data of previously unregistered travel, and is one prefer-
able?
2. Is the data collected by the Skoleveiagenten project representable in a heat map?
1.4 What we are doing, and how
Our project may not be like a lot of other projects with a developed end product, as it does not include
a testing phase. This is because of the nature of our second research question, as we are checking the
possibility of representing the data in a heat map, and then try to implement the solution with the
data we were provided by Skoleveiagenten. Our research with regards to the first research question
will be purely theoretical.
2

UiO - INF5261 Fall 2014
2 Theory
2.1 GPS and location data
Satellite based navigation systems, such as GPS and Galileo, help to pinpoint location based data
based on the time and geological readings (latitude, longitude, elevation/altitude). The accuracy
of such readings by the (GPS) receiver and satellite vary based on weather conditions, inside or
outside position, and by the availability of land or satellite based enhancement/augmentation systems.
GPS can be accurate to within 3 meters without enhancement systems and down to centimeters and
millimeters in conjunction with some such systems[9].
The GPS features in smartphones are manufactured for power consumption above location accuracy.
On a clear sky such receivers can generally identify which road a user is travelling, as well as the
direction and speed (via geospatial calculations). It can not, however, detect with certainty which side
of the road the user is on or if the user is using the sidewalk or is in the street.
If the GPS device is used within the context of a car as a route planner, the device can utilize computer
algorithms to map the car to the correct side of the road based on direction and the legal restrictions
that applies to cars and driving. This solution is not as viable for bikes as cyclists are allowed to ride
their bikes on sidewalks, in bike lanes and on the road.
2.2 Other solutions
2.2.1 Skoleveiagenten
As explained in the introduction, the Skoleveiagenten project uses an app to collect data. This solution
is working well with children, as they think being a secret agent is cool and exciting and thus doesn’t
mind having to interact with their cellphones during the logging session. However, both we and the
people we met with at TØI found this solution to not be very good for adults, as it is quite cumbersome
and require active participation. If it’s hard to use or is just an annoying thing for you to do, you
will most likely not do it. This is why we have decided to look for means of passive collection of data
instead of the app that is already in use. This is further elaborated upon in the technical review.
Today, the data from the Skoleveiagenten project is represented in a map. It is, however a very simple
representation of the raw data. In this solution you can see data logged by each class in each school
separately, but there is no option for combining classes or schools. The data visible is the routes taken
by the children, happy and sad smileys indicating good or bad locations or situations along the route,
and icons displaying what kind of transportations means were used (walking, biking, car).
3

UiO - INF5261 Fall 2014
The first thing you notice about this map is how incredibly visually polluted it is. It is very hard - if
not impossible - to make any sense of this map unless you zoom in quite a lot. In fact, to get the full
information from the different logged sessions, you have to zoom in to such an extent that you lose
most of the big picture and thus this makes it harder to make sense of the data. This encourages us
to make a solution that works well on all relevant zoom levels.
2.2.2 Logging
Mobile exercice apps such as Strava 1 and Endomondo2 are very popular and has a big user base, with
the latter having more than one billion logged miles[5], more than half of which are logged by bike.
These apps are, however, mostly used for logging workouts, and does not provide much data on how
people move in their daily life. For this project we need data on how people get to work, how they
travel to school, and generally patterns of travel all over the city.
2.2.3 Visualization
Strava actually has its own heat map3, but it’s not that good for our purposes, as explained in the
previous section. After doing a fair bit of research, it is evident that there are quite a lot of different
means and possibilities for visualizing the data we got from Skoleveiagenten in a heat map. We are
keeping it simple by explaining the method we decided to use, and this is found in the technical review.
1http://www.strava.com/2https://www.endomondo.com/3http://labs.strava.com/heatmap/#6/-120.90000/38.36000/blue/bike
4

UiO - INF5261 Fall 2014
2.3 Technical review
Figure 2
2.3.1 Logging
In terms of logging there are several applications and different gadgets to log travelling. However,
by relying on user-feedback the data can be error-prone and lacking. It also drains power from the
user’s cellphone quite quickly. Another problem with user-feedback applications is that people tend to
focus on their selfish self, and do not contribute with proper feedback [7]. As for the Skoleveiagenten,
which works as a crowdsourcing application, the participants willingness to collaborate in the project
is similar to that found by [11] for participants in crowdsourced news making. The same applies for
the data collection for ‘Skoleveiagenten’ or similar logging applications. In order to obtain data from
users (crowdsourcing), the user’s affects has to be addressed and privacy issues has to be maintained.
We think therefore, in terms of logging, a more passive approach is more suitable. By doing the data
collection in a passive way, it ensures that the user does not forget to turn on/off the GPS and it is not
dependent on the battery of the user’s cellphone. A passive approach also includes problems regarding
privacy issues. Not everyone wants to log their entire life digitally and “exposing one whereabouts,
preferences, needs and opinions in a more public sphere raises issues not only related to trust, but also
about aspects of privacy” [6].
A solution for an passive approach is by developing a prototype for bicycles with the underlying
technology being Arduino. Arduino is an open-source physical computing platform, which makes it
possible to interact with different sensors, motors, physical outputs, etc. The hardware is cheap for
prototyping (for individuals) and allows for cross-platform development.
5

UiO - INF5261 Fall 2014
Our initial thought was to attach the Arduino-prototype to a bicycle, most preferably on some of the
City bikes in Oslo. This will again rise some problems with regards to privacy, but more important:
how will the data from the bikes be collected?
There are several approaches:
1. Attach an WiFi-shield4 to the Arduino-device.
2. Attach Bluetooth-shield to the Arduino-device.
3. Remove SD-card once a week/month.
(1) The device will consume more power and there is not free WiFi available everywhere. (2) More
power consumption. The thought was to make an app that made the user of the bike share the travels
via bluetooth. This will result in a tedious approach (many steps, no immediate gratification) and
probably not gain many users. (3) A very cumbersome approach as it require physical actions on the
device and a storage unit.
2.3.2 Visualization
Figure 3: Different layers of visualization in our project
The data that is obtained from the Skoleveiagenten project is registered by the “agents” at the school.
The data is stored in the GPX-format, which is served as the de-facto XML-standard for lightweight
interchange of GPS data. Our plan is then to use these data in an single-page web application (webapp).
Our plan on visualizing the data has changed a bit since we first started the project. Originally we
planned on using D3.js for visualizing, but after quite some time spent on making this work, we found
that this was not an optimal solution for the heat map our project, but it is used for our bar charts..
4http://arduino.cc/en/Main/ArduinoShields
6

UiO - INF5261 Fall 2014
We did, however, keep the Polymer library and Bootstrap. In addition, we decided on using Mapbox
combined with open-map, as well as Leaflet with the leaflet-heat plugin.
Polymer5
Polymer is a library for building custom web components[13]. With help of syntactic sugar and polyfills
it makes it possible for older browsers to implement such web components[10]. We wanted to make an
prototype with new technology and using web components falls into that category.
AngularJS6
A framework that is aiming for a more dynamic view of the HTML-content. We have used Angular
in our project to handle the routing and the different data that we’re using.
Bootstrap7
Bootstrap is a css framework that makes it easier to style a webpage with a consistent result. It
provides different sets of buttons, typography, forms, etc.
Mapbox8
Mapbox is a service that allows users to create maps with custom appearances. We have used a
mapbox map as sort of a background for our map. Mapbox allows users to add and remove different
features on the maps by using their web services, but we have decided to do this ourselves to allow for
a more dynamic change of markers etc.
Open-map9
Open-map is simply a polymer element that renders a map. Originally it renders an Open Street
Map, but we are using it with a mapbox map for customizability. Mapbox is using data from several
locations, including OpenStreetMap.
Leaflet and the leaflet-heat.js plugin10
The leaflet-heat.js plugin is used in our project to add a heat map layer on top of our mapbox map.
It is quite easy to use, and we chose to use this plugin because it allows us to read the locations of the
different markers directly from a file instead of being attached to the map itself.
5https://www.polymer-project.org/6https://angularjs.org7http://getbootstrap.com8https://www.mapbox.com/9https://github.com/ruben96/open-map
10https://github.com/Leaflet/Leaflet.heat
7
UiO - INF5261 Fall 2014
2.4 Relevant course literature
2.4.1 CityFlocks
CityFlocks is a mobile service prototype for tourists and other newcomers, that allows them to benefit
from local knowledge[2]. The app uses both direct and indirect communication, and explores the
difference between these. The types of direct communication are SMS, phone calls and direct voice
link and text messages, while the types of indirect communication are comments, reviews and browsing
location based user comments. As people can be an indication of popularity, this can prove useful.
GPS and geo-tagging is used to share knowledge.
2.4.2 Aspects of personal navigation with collaborative user feedback
OurWay is a prototype for collaborative route planning with focus on wheelchairs[7]. Their main
objective is to provide better routes for the whole community - their findings resulted in a more selfish
approach from the user. The user were only interested with finding the best route and rarely thought
about the so-called community in OurWay. This is interesting in terms of the Skoleveiagenten project,
where there were no particular problems in terms of logging and collaboration. But in OurWay it
lacks collaboration with the users, because of the selfish approach.
2.4.3 Negotiating Privacy Boundaries in Social Applications for Accessibility Mapping
Discusses privacy issues that might arise with the OurWay application and its users [6]. The way the
OurWay users registers accessibility issues is similar to that of the Skoleveiagenten users. Whenever
an issue arises - accessibility or traffic related - the users registers it on their respective apps. For both
project the data gathered and registered by users can benefit other people and the effect is cumulative.
The more users registration issues the richer the data set and the more valuable it is. As such there
is a real privacy issue of how and how much of the data should be shared, as well as who to disclose
this data to.
2.4.4 Location-Based Crowdsourcing of Hyperlocal News
Discusses “mobile users’ preferences and concerns of using location-based assignments (LBA) and
geotagging in crowdsourced news making” [12]. What are the attitudes toward geo-tagging and the
anonymity of the user when location based data is published alongside the news. The users in the
study found the benefits of geo-tagging to be greater than the perceived risks. This is relevant for the
8

UiO - INF5261 Fall 2014
Skoleveiagenten project as it uses “agents” - school children - to crowdsource geo-tagging traffic issues
with the intention to make traffic safer for them.
2.4.5 Mobility in Collaboration
The article study communication and collaboration in three different settings; primary health con-
sultations, construction sites and stations in London underground. The article presents three types
of mobility respectively to each study setting; Micro-mobility, remote mobility and remote and local
mobility [8].
The article addresses the micro-mobility with the study of the medical records, which was then written
on paper. This method is engaging, and makes it easier for both the doctor and patient to collabo-
rate. Compared to the desktop computer which is rigid and stationary, thus providing an unengaging
environment for the patient and the doctor. It provides both synchronous and asynchronous commu-
nication. However it lacks mobility in the form of sharing with other specialists in other locations.
The construction site study uses a remote mobility model. The workers are ‘out’ on the site reporting
on a piece of paper of what needs doing on an allocation sheet. This sheet is then handed in to the
‘site hut’ where the foreman passes the information to appropriate channels. These sheets are mobile
in the form of “moving around the site”. A electronic solution was developed and the workers were
then using an electronic device to perform the logging. The vision was to enhance productivity with
the foreman being more proactive and the communication and collaboration to become more efficient.
However, that was not the case since electronic device resulted in a more discussion regarding the
technology rather the problems onsite. This resulted in a person that was employed to handle the new
technology, and the workers used the old, paper way.
The London underground has to deal with thousands of passengers and events that happen along the
subway each day. However, all the bulk information between stations are based through one location;
Station Ops room. In order to remove this bottleneck, the article addresses different technologies that
could solve that particular problem. The staff should have access to portable devices in order see
alarms and events. However, stationary devices is also necessary in order to inform the public. This
is therefore a combination of the two models; remote and local mobility.
9
UiO - INF5261 Fall 2014
3 Case and method
3.1 Users/Stakeholders
The solution we are developing needs a solid foundation of data, as it will not give an accurate picture
of travel patterns unless there are enough data entries to establish these patterns. The Skoleveiagenten
project allows children to be “agents” and report their location and findings, and more of this data
would be helpful in the project. It does, however, need different data in addition to this, and this is
where it would be good to use other means of collecting data as well.
Several stakeholders would be interested in the result; TØI, Oslo municipality, the Norwegian govern-
ment amongst others. The data allows for e.g. accident prevention and planning new cycle routes.
3.2 Methods to address the questions
For quantitative data we will use different sources. For the earlier parts of the project, the Norwegian
national travel survey is used[3]. This is first and foremost used for understanding how much the
Norwegian people walks and use their bicycles, how often they do this, how long an average journey
is, and in what context the travel is made.
After much deliberation, we have decided against interviewing people in this project. We made this
decision because we simply did not see the need for further elaboration of the data we can already get
from the national travel survey. This means we are most interested in quantitative data.
3.3 Data collection
The data we use in this project is data already collected by the Skoleveiagenten project, and we
decided to use this as we have seen it as sufficient for the scope of our project. The amounts of data
are big enough to be represented in heat maps, but they are not so big that the sheer size itself should
represent problems.
The data was downloaded in the GPX format from http://bymkonsept.azurewebsites.net/. We
merged the files for different classes in the same schools because we decided to disregard which school
class the data is collected by and instead collect all data data for all the classes at each school. This
was done manually but as there is not that many classes it was not a very time consuming job. If our
solution were to be used on a larger scale, it would of course be easier to have all the data merged
from the get-go, but this was but a minor hindrance for us.
10
UiO - INF5261 Fall 2014
We have not collected our own data, although we have several proposed ways of doing this. The reason
for this is simply that it would have been too time consuming to do, and would probably have been
more suitable as a separate project. Data gathered by us in the scope of the project would likely not
be very representative of the target audience.
3.4 Data analysis
3.4.1 Data collection
We haven’t found any statistics on which of the data collecting means is the best, so analysis of this
was mostly done in cooperation with the guys at TØI. We discussed pros and cons of several different
ways of doing it, and discovered several points of view and noticeable points that we had not thought
of before.
We did, however, use the national travel survey to understand the way people move around in their
daily life. No specific data analysis tools have been applied to the data, but it has rather been used by
us as a background for our discussions. We have had numerous informal discussions within the group,
with people at TØI, with the teachers and other non-group members, to better understand their views
on the different alternatives.
3.4.2 Data visualization
As the data we base the visualization part of our project on is neither surveys, statistics nor interviews,
but rather on the GPX format, the data analysis in this project was somewhat different than the one
performed in a “normal” project. Our analysis was more the one of getting familiar with formats,
understanding them and learning how to construct them ourselves.
11

UiO - INF5261 Fall 2014
4 Universal design
Universal design has not been within the scope of this project. The graphical design is somewhat
responsive (there is no breakpoints) but falls short in terms of general accessibility. The graphical design
is very minimalistic and colour contrasts regarding the visually impaired has not been considered.
Neither has accessibility for keyboard navigation or users with screen readers.
No guidelines have been consulted regarding universal design and there is also the issue of whether
translating graphical map and bar chart data to a screen reader is feasible. Controls, such as zoom-
level and navigation, can of course be made keyboard accessible but would the data be understandable
in a non-visual environment.
12
UiO - INF5261 Fall 2014
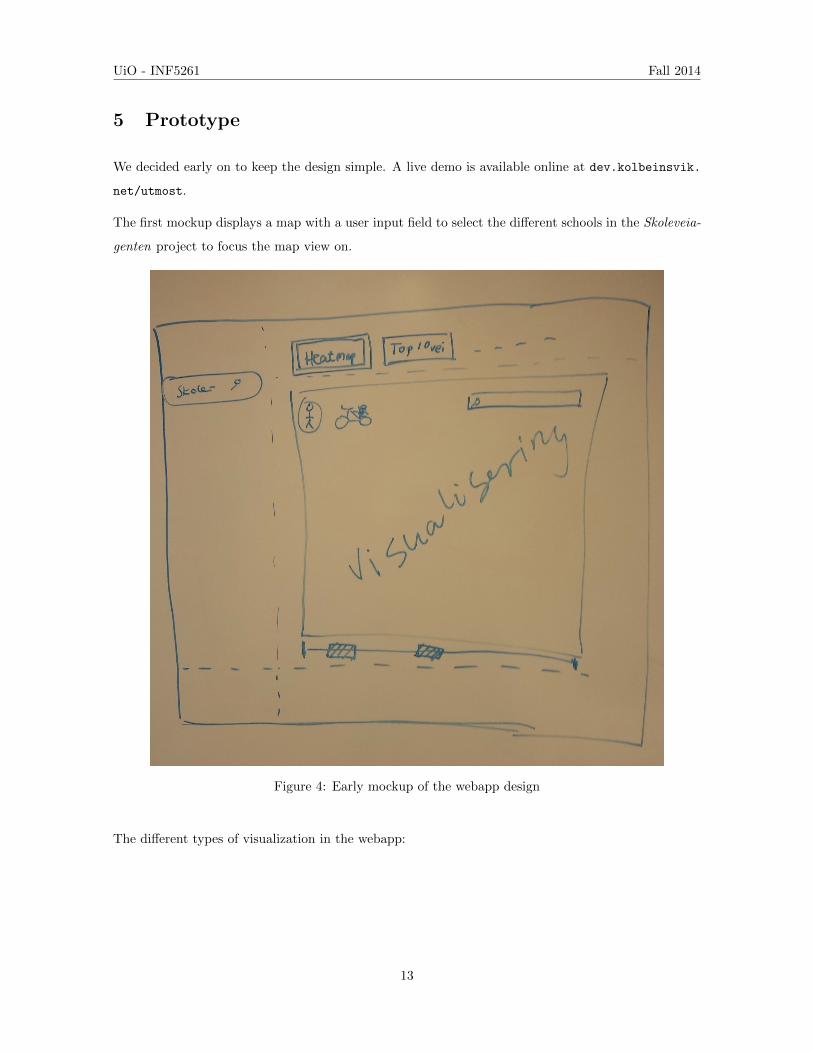
5 Prototype
We decided early on to keep the design simple. A live demo is available online at dev.kolbeinsvik.
net/utmost.
The first mockup displays a map with a user input field to select the different schools in the Skoleveia-
genten project to focus the map view on.
Figure 4: Early mockup of the webapp design
The different types of visualization in the webapp:
13

UiO - INF5261 Fall 2014
Figure 5: Screen capture of the webapp with the ”open map” map type selected
Figure 6: Heatmap
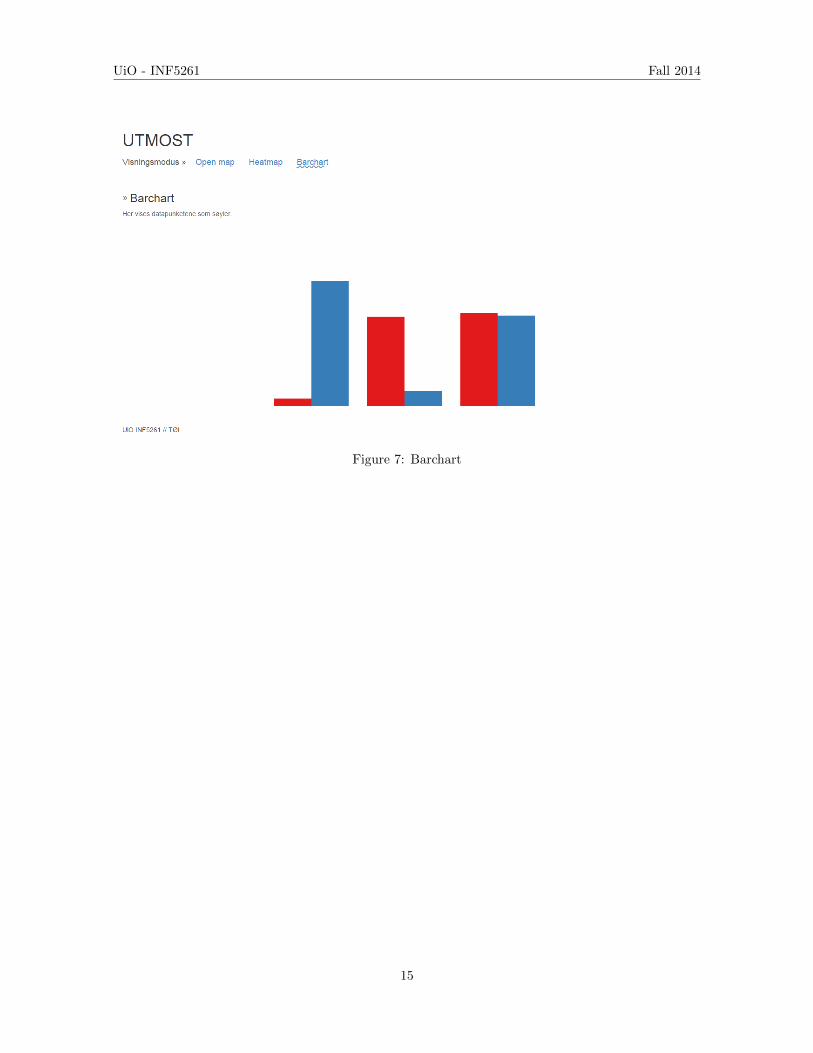
The barchart was meant to use the positive and negative feedback items as the data points but the
technical implementation uses random data due to our lack of experience with the D3 library.
14
UiO - INF5261 Fall 2014
Figure 7: Barchart
15

UiO - INF5261 Fall 2014
6 Findings
In the report about travel habits [4], pedestrians are one of the largest groups where ‘Travels that ends
in Urban areas’. Ranging from 37 - 13 %, the pedestrians are the biggest group represented in this
projects ‘secondary transport’.
6.1 What did we find with our investigation?
There are many tools for making visualising geodata in maps on the web easier. With Polymer and
map plugins such as Mapbox and Leaflet it can be as easy as pointing the plugin or web component to
a data file containing the geodata one wishes to visualise. Options such as visualising the data points
as markers or “heat” in a heat map is supported.
However, there are some issues and limitations. Map technology on the web is advanced and the
different parts is loaded dynamically to reduce latency and bandwidth for the client, which is especially
important on mobile devices. This dynamic nature adds some challenges to the design of the web app
if the different map types are to be loaded dynamically as well.
The benefit of such an approach for the user is reduced bandwidth as only relevant sections of the web
page is loaded and the user experience the transitions between map types as seamless. The downside
with this approach is that the dynamic section loading conflicts with the dynamic nature of the map
technology. We had problems getting the maps to show when we loaded them dynamically with both
Polymer and Angular.js.
There were some issues regarding the validity of some of the data from the Skoleveiagenten project.
Specifically, we found some minor inconsistencies with some of the location data that was reported.
Some of the data connected to one school seemed to belong to a different school and class. It is not
the biggest issue and as data from a pilot project the inconsistencies did not hamper our use.
6.2 Conlusion to our findings
We found that we lacked the technical competence needed to implement a solution that would ad-
equately satisfy the need to visualize big geodata in maps and other visualisation format, such as
barcharts. We managed to build a small webapp but did not have time to focus on the technical
aspects of visualising data on the web.
The application libraries we used in the project are very powerful and flexible but our lack of experience
with them meant that it took a lot of effort to understand how to use them in the way we envisioned.
In addition, it was not always clear how to make them work together with each other.
16

UiO - INF5261 Fall 2014
7 Discussion
7.1 Discuss the questions from introduction
Our research questions:
1. What are the ways of collecting travel data of previously unregistered travel, and is one prefer-
able?
2. Is the data collected by the Skoleveiagenten project representable in a heat map?
Question 1: There are presumably several more ways of collecting the data than the ones we have
listed in particular in section 2.3.1 and in other parts of the report, but we have decided to focus on
the ones we believe are the most relevant and doable. We believe a small device such as an arduino
unit is preferable to passively collect data, but the downside of an arduino device is that it costs money
to develop and buy. It may also be more interesting for thieves to steal than something invisible.
Question 2: Our findings suggests that it is doable, but it is difficult and time consuming. We have
managed to make a heat map with custom locations read from a file, but it proved to be more difficult
to represent the actual data from the files. The solution we finally decided to implement har proven
to not easily translate to lines of points. For single points not related to each other, it has proven to
function just the way we wanted to, such as representing each school in a heat map.
7.2 Connections between own findings and findings of similar studies
In CityFlocks and Aspects of personal navigation with collaborative user feedback we learned that people
are selfish and prefer to think mostly about ourselves. We have drawn a conclusion from this; namely
that it is important that the users do not see the logging device as a burden for them to participate
in a project. It can not come across as an invasion of personal space. Thus it will have to be easy to
use and not require much interaction. We have also made use of the fact that local knowledge seems
to be trusted by the users.
From Negotiating Privacy Boundaries in Social Applications for Accessibility Mapping we’ve learned
that we had to pay attention to who gets access to the data, and what the data actually can tell us.
For the people at TØI it was important that you could not see the home of the people participating,
and thus it is important to make the data abstract enough to accomplish this, while not abstracting
it too much. It’s a fine line, but it’s something we believe the heatmap is well suited for. The article
also showed us that crowdsourcing is a good idea in this kind of project.
17

UiO - INF5261 Fall 2014
Boundaries in Social Applications for Accessibility Mapping made us come to the conclusion that the
benefits of geo tagging outweighs the disadvantages. However we believe, as previously mentioned,
that the degree of abstractification has to be sufficient enough to not identify single participants. As
Negotiating Privacy Boundaries in Social Applications for Accessibility Mapping states, the data gets
more valuable when more rides are added to it. This also helps to make the maps more abstract, and
it would be impossible to identify individual rides quite early on.
In Mobility in Collaboration the remote mobility model is related to our project. The data received from
Skoleveiagenten is collected through an application. Thus the project falls into the ‘Remote mobility’-
model. The users are reporting different events and logs their travel to the school and the data is then
parsed on the server, hence the users are remote and mobile. The case describes an misunderstanding
between the users and the device that it was using, resulting in a stationary approach. It is therefore
important to: “... considering mobility, we need to examine the activities in which people engage, with
others, when they are ‘mobile’, and how various tools and artefacts, features in those activities.” For
Skoleveiagenten, this means that the developers should take account of the users (kids in school) of
what kind of state they are in when they are mobile. Thus, the dataset seemed to include errors and
overly reported events.
18

UiO - INF5261 Fall 2014
8 Conclusion
We have explored several different possible means of collecting data on how people move around in
the city. We have suggested that a small device such as an arduino is a good way of doing this in a
way that is not viewed as a burden by the users.
We have looked at the GPX and geojson formats and how the are used with mapping technologies
on the web. We have tried to implement a heat map visualizing the data we received from the
Skoleveiagenten project, as well as a bar chart. This has proven to be difficult, as single geographical
points from the data seems to be considerably easier to represent than lines of points. We have made
a heat map of school locations but lacked the experience and expertise to implement higher fidelity
heat map.
9 Limitations and the work ahead
We were quite limited by the time we had to do this project in, both because of the short time span
and projects in other courses. There are parts of this project we would have liked to have been
different/better if we had more time. We would have liked the map and barchart to work properly
with the data from Skoleveiagenten instead of dummy data, and we feel we are quite close to this.
We would also have liked to implement new types of visualization, and one of the map types we were
thinking of was a topology map much like the Oslo subway map, showing popular routes.
19
UiO - INF5261 Fall 2014
References
[1] Aftenposten. Sykkelpatruljen. http://www.osloby.no/nyheter/sykkelpatruljen/. [Online;
accessed 02-Oct-2014].
[2] Mark Bilandzic, Marcus Foth, and Alexander De Luca. “CityFlocks: designing social navigation
for urban mobile information systems”. In: Proceedings of the 7th ACM conference on Designing
interactive systems. ACM. 2008, pp. 174–183.
[3] Inge Brechan, Randi Hjorthol, and Liva Vagane. Den nasjonale reisevaneundersøkelsen 2009
-nøkkelrapport. 1130/2011. Transportøkonomisk institutt, 2011.
[4] Petter Christiansen and Øystein Engebretsen. “Bystruktur og transport. En studie av person-
reiser i byer og tettsteder”. In: Den nasjonale reisevaneundersøkelsen 1178/2011 (2011), p. 92.
url: https://www.toi.no/publikasjoner/bystruktur-og-transport-en-studie-av-
personreiser-i-byer-og-tettsteder-article30713-8.html.
[5] Endomondo. Endomondo Fitness App Runs Past 20 Million Users and Reaches Profitability.
http://blog.endomondo.com/2013/10/16/endomondo- fitness- app- runs- past- 20-
million-users-and-reaches-profitability/. [Online; accessed 05-Oct-2014].
[6] Harald Holone and Jo Herstad. “Negotiating privacy boundaries in social applications for accessi-
bility mapping”. In: Proceedings of the 6th Nordic Conference on Human-Computer Interaction:
Extending Boundaries. ACM. 2010, pp. 217–225.
[7] Harald Holone et al. “Aspects of personal navigation with collaborative user feedback”. In:
Proceedings of the 5th Nordic conference on Human-computer interaction: building bridges. ACM.
2008, pp. 182–191.
[8] Paul Luff and Christian Heath. “Mobility in collaboration”. In: Proceedings of the 1998 ACM
conference on Computer supported cooperative work. ACM. 1998, pp. 305–314.
[9] Navigation National Coordination Office for Space-Based Positioning and Timing. GPS Accuracy.
http://www.gps.gov/systems/gps/performance/accuracy/. [Online; accessed 03-Oct-2014].
[10] Remy Sharp. What is a Polyfill? https://remysharp.com/2010/10/08/what-is-a-polyfill.
[Online; accessed 06-Oct-2014].
[11] Heli Vaataja, Teija Vainio, and Esa Sirkkunen. “Introduction”. In: Proceedings of the 17th ACM
international conference on Supporting group work. 2012. Chap. 1, p. 85.
[12] Heli Vaataja, Teija Vainio, and Esa Sirkkunen. “Location-based crowdsourcing of hyperlocal
news: dimensions of participation preferences”. In: Proceedings of the 17th ACM international
conference on Supporting group work. ACM. 2012, pp. 85–94.
20

UiO - INF5261 Fall 2014
[13] W3C. Introduction to Web Components. http://www.w3.org/TR/components-intro/. [Online;
accessed 06-Oct-2014].
[14] Mari Wictorsen Lund and Olav Eggsvik. Sykkelpatruljen. http://www.osloby.no/nyheter/
sykkelpatruljen/Guri- Melby- Her- har- du- en- jobb- a- gjore- 7712699.html. [Online;
accessed 02-Oct-2014].
21