utility utility is a property common to all commodities and services desired by a person utility is...
TRANSCRIPT


UTILITY
• Utility is a property common to all commodities and services desired by a person
• UTILITY is the want satisfying power of a commodity
• It is the psychological feeling of satisfaction, pleasure, happiness or well-being which a consumer derives from the consumption, possession or the use of that commodity
• Utility varies from consumer to consumer, at different times, places, seasons and under different circumstances

Marginal utility is the utility of last unit or the addition to total utility by the consumption of one additional unit of that commodity
Symbolically,
MUn = TUn – TUn-1
Also, MU = Δ(TU) ΔQ

Total Utility (TU)
Total utility presents the sum of all the utilities derived from the total number of units.
Average Utility (AU)
Average utility is obtained by dividing total utility by the number of units of the commodity.
In terms of symbols, we can write AU = TU/Q

Relation among MU, TU and AU
Number of units
Total Utility (TU)
Marginal Utility (MU)
Average Utility (AU)
1 10 10 10
2 18 8 9
3 24 6 8
4 28 4 7
5 30 2 6
6 30 0 5
7 28 -2 4
8 24 -4 3

Relation among MU, TU and AU
• Total utility rises with consumption of additional units of the commodity. However, the increase in TU is not constant, but falls steadily
• When the total utility reaches its maximum value, marginal utility becomes zero
• This is the point of satiety, the total utility stops rising after this stage

The law states that “as the quantity consumed of a commodity increases, the utility derived from
each successive unit decreases, consumption of all other commodities remaining the same.”

No. of Units Consumed
Total Utility Marginal Utility
1 30 30
2 50 20
3 60 10
4 65 5
5 60 -5
6 45 -15

Why Does The MU Decrease?
The utility gained from a unit of commodity depends on the intensity of the desire for it.
When a person consumes excessive units of a commodity, his need is satisfied by degrees in the process of consumption and the intensity of
his need goes on decreasing. Therefore, the utility obtained from each successive unit goes
on decreasing.
Assumptions:
1.The unit of the consumer good must be a standard one
2.The consumer’s taste or preference must remain the same during the period of consumption
3.There must be continuity in consumption

Attributed to Alfred Marshall and his followers, is also called the Neo-classical Approach

Measurement of Utility
• The nineteenth century economists believed that utility was measureable
• The consumer was assumed to have cardinal measure of utility
• Under this, it is possible to estimate the amounts of utility, which a person derives from various units of a commodity in terms of some quantifiable unit (UTILS)

• Under this analysis, it is assumed that
i) One ‘util’ equals one unit of money, and
ii) Utility of money remains constant
• In reality, however, absolute or cardinal measurement of utility is not possible. Numerous factors that affect the state of consumer’s mood, which are impossible to determine and quantify. Utility is therefore immeasurable in cardinal terms.

Pioneered by J.R. Hicks, a Nobel laureate and R.G.D. Allen

On a very hot summer day, while going back home from college, you have the following three options to choose from:
• A cold bottle of Bisleri mineral water• A chilled can of Pepsi• A packet of chocolate
You are required to rank them in the order in which you would buy them

Ordinal Utility
• It is based on the fact that it may not be possible for consumers to express the utility of a commodity in absolute terms
• But it is always possible for a consumer to tell whether a commodity is more or less or equally useful as compared to another

When we study consumption behavior of consumers, the most important postulate is that the consumers – individuals and households – aim at utility maximization and all their decisions and actions as consumers are directed towards utility maximization

Analysis of Consumer Behavior: CARDINAL UTILITY APPROACH
The cardinal utility approach makes the following assumptions:
• Rationality: the consumer is a rational being, i.e., he or she buys that commodity first which yields the highest utility and last which gives the least utility
• Limited money income: along with utility maximization principle, makes choice inevitable
• Maximization of satisfaction
• Utility is cardinally measurable

Analysis of Consumer Behavior: CARDINAL UTILITY APPROACH (contd…)
• Diminishing marginal utility
• Constant marginal utility of money
• Utility is additive


A consumer is said to be in equilibrium when he has:
a) Maximized his satisfaction
b) Spent his entire income
c) Attained optimum allocation of expenditure, and
d) Consumed optimum quantity of each commodity

One - Commodity Model
• A consumer with certain money income consumes only one commodity ‘X’
• Since both, commodity X and his money income have utility for him, he can either spend on commodity X or retain the money as an asset

• If the marginal utility of commodity X, is greater than marginal utility of money (as an asset), a utility maximizing consumer will exchange money for commodity X
• What do you know about the marginal utility of a commodity???
And marginal utility of money???

Therefore, the consumer will exchange his money income on commodity X so long as MUx> Px(MUm)
The utility maximizing consumer reaches his equilibrium, i.e., the level of maximum satisfaction, where
MUx = Px(MUm)

MU
and
Pric
e
Quantity
Px
Qx
MUx
E Px(MUm)

Multiple-Commodity Model : The Law of Equi-marginal Utility
This law states that a rational consumer spends his income on various goods he consumes in such a manner that each rupee spent on each good yields the
same MU

Suppose a consumer consumes only two commodities, X and Y, their prices being Px and Py
The consumer will now distribute his income between commodities X and Y, such that
MUx = Px (MUm)And MUy = Py (MUm)
And, given these conditions, the consumer is in equilibrium where
MUx = 1 = MUy
Px(MUm) Py(Mum)
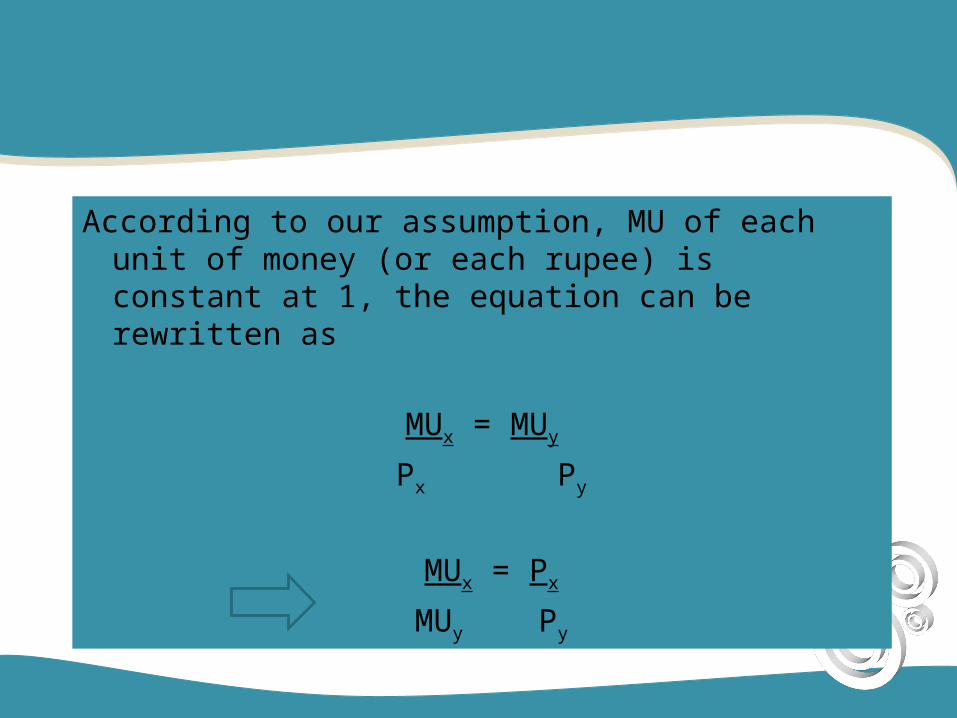
According to our assumption, MU of each unit of money (or each rupee) is constant at 1, the equation can be rewritten as
MUx = MUy
Px Py
MUx = Px
MUy Py

THE LAW OF DEMAND
The law of demand states that the demand for a commodity increases when its price decreases and falls when its price rises,
other things remaining constant.

The Law of Demand explained
• There is an inverse relationship between price and quantity demanded
• This law holds under the condition that “other things remain constant”
• “Other things include other determinants of demand like, consumers’ income, prices of substitute and complimentary goods, tastes and preferences of consumers, etc.

Demand Schedule
Demand schedule is a series of prices and the corresponding quantities which consumers would like to buy per unit of time
Price per cup of Tea (Rs.)
No. of cups of tea demanded per day
7 1
6 2
5 3
4 4
3 5
2 6
1 7

Factors behind the Law of Demand
1) Substitution Effect:
When the price of a commodity falls, prices of its substitutes remaining constant, then the substitutes become relatively costlier. Or, in other words, the
commodity whose price has fallen becomes relatively cheaper.
Since a utility maximizing consumer substitutes cheaper goods for costlier ones, demand for the cheaper
commodity increases.

2) Income Effect:
When the price of a commodity falls, then the real income of the consumer increases. Consequently, his
purchasing power increases since he is required to pay less for a given quantity
Thus, the increase in real income encourages the consumer to demand more of goods and services.

Exceptions to the Law of Demand

Shifts in Demand Curve
When the demand curve changes its position, the change is known as shift in the demand
curve
Caused by any change that alters the quantity demanded at every price
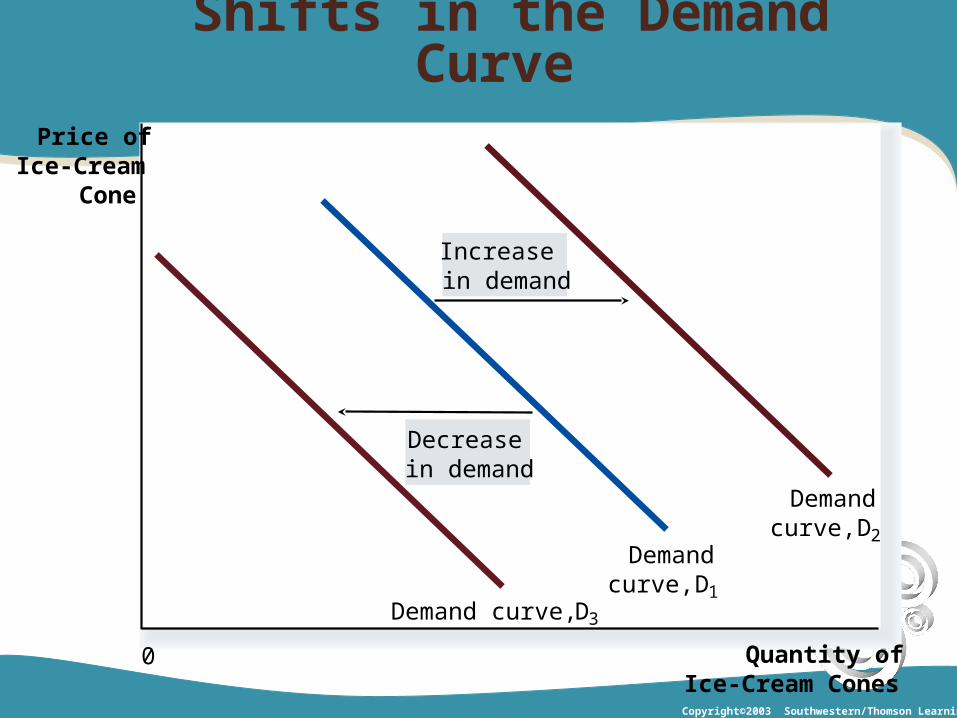
Shifts in the Demand Curve
Copyright©2003 Southwestern/Thomson Learning
Price ofIce-Cream
Cone
Quantity ofIce-Cream Cones
Increasein demand
Decreasein demand
Demand curve, D3
Demandcurve, D1
Demandcurve, D2
0

Shifts in the Demand Curve
• A shift in the demand curve, either to the left or right
• Caused by any change (other than price) that alters the quantity demanded at every price
• Increase and decrease in demand are associated with non price quantity relationships of demand

Reasons for shift in the Demand Curve
1)Income effect
2)Substitution effect
3)Through advertisements, again a substitution effect
4)Change in prices of a complimentary good
5)Change in fashion, technology, season, etc

0
D
Price of Ice-Cream Cones
Quantity of Ice-Cream Cones
A tax that raises the price of ice-cream cones results in a movement along
the demand curve.
A
B
8
Rs. 10.00
Rs. 20.00
4
Changes in Quantity Demanded

Changes in Quantity Demanded
• Extension and contraction of demand are associated with the price-quantity relationship of demand
• Movement is along the demand curve


Assumptions of Ordinal Utility Theory
1) Rationality: A consumer aims at satisfaction given his income and prices of goods and services
2) Ordinal Utility: The consumer is only able to tell the order of his preference for different baskets of goods

Assumptions of Ordinal Utility Theory
3) Transitivity and consistency of choice:
Transitivity: if a consumer prefers A to B and B to C, he must prefer A to C.
Consistency: if he prefers A to B in one time period , he will not prefer B to A in another period nor will he ever treat them as equal

Assumptions of Ordinal Utility Theory
4) Nonsatiety: it is also assumed that the consumer has not reached the point of saturation in case of any commodity. Therefore, a consumer always prefers a larger quantity of all the goods.
5) Diminishing marginal rate of substitution: It is the rate at which the consumer is willing to substitute one commodity (X) for another commodity (Y), so that his total satisfaction remains the same.
This rate is given as Dy/Dx. The ordinal utility approach assumes that Dy/Dx goes on decreasing when a consumer continues to substitute X for Y

INDIFFERENCE CURVE
It is a locus of points, each representing a different combination of two substitute goods, which yield the same utility or level of satisfaction to the consumer.
Therefore, he is indifferent between any two combinations of goods when it comes to making a
choice between them
When such combinations are plotted graphically, the resulting curve is called indifference curve
Marginal Rate of Substitution
The MRS is the rate at which one commodity can be substituted for another, the level of satisfaction remaining
the same
For example, MRS between two commodities X and Y, may be defined as the quantity of X which is required to
replace one unit of Y, in the combination of two goods, so that total utility remains the same

The Diminishing MRS
The quantity of a commodity that a consumer is willing to sacrifice for an
additional unit of another goes on decreasing when he goes on
substituting one commodity for another

Combination Biscuits (Y) Tea (X) MRSx,y
A 12 1 ---
B 8 2 4:1
C 5 3 3:1
D 3 4 2:1
E 2 5 1:1


1. Indifference Curves havea Negative Slope
This implies that
a)The two commodities can be substituted for each other; and
b)If the quantity of one commodity decreases, quantity of the other commodity must increase so that the consumer stays at the same level of satisfaction

2. Indifference Curves are Convex to the Origin
The convexity implies:
a)That the two commodities are imperfect substitutes for one another; and
b)That the MRS between the two goods decreases as a consumer moves along the indifference curve
3. Indifference Curves can neither Intersect nor be Tangent to each other
The intersection/tangency of two indifference curves, reflects two impossible conclusions:
a) That two equal combinations of two goods yield two different levels of satisfaction;
b) That two different combinations – one being larger that the other – yield the same level of satisfaction

4. Upper Indifference Curves Represent a Higher Level of Satisfaction than the Lower Ones
An indifference curve placed above and to the right of another represents a higher level of
satisfaction than the lower one

Slope of Indifference Curve
Slope of indifference curve = ∆Y =
∆X
= MRSx,y Qua
ntity
of
Y
Quantity of X
∆Y
∆X


BUDGET LINE
• The consumer has a given income which is a constraint to his maximizing behavior
• The budget constraint shows that a consumer can choose any bundle as long as it cost less or equal to the income he has, given income and prices of goods

Slope of Budget Line
Slope of budget line measures the amount of change in good Y required per unit change in good X along the budget line
Slope of Budget Line = Px
Py

CONSUMER’S EQUILIBRIUM or OPTIMAL CHOICE
Equilibrium is attained when the consumer reaches the highest possible indifference
curve given his budget constraint
Consumer’s equilibrium point must lie on the budget line and must give the most preferred
combination of goods and services

Qu
anti
ty o
f Y
Quantity of X0
Y*
X*
E
IC1
IC2
IC3
IC4
A
B
Consumer’s Equilibrium

Shifts in Budget Line
1) Change in Price
2) Change in Income