utility maximization and melioration: internalities in … maximization and melioration:...
TRANSCRIPT
Journal of Behavioral Decision Making, Vol. 6, 149-185 (1993)
Utility Maximization and Melioration: Internalities in Individual Choice
R. J. HERRNSTEIN Harvard University, USA
GEORGE F. LOEWENSTEIN Carnegie Mellon University, USA
DRAZEN PRELEC Massachusetts Institute of Technology, USA
WILLIAM VAUGHAN, JR Harvard University, USA
ABSTRACT
How do people go about choosing between alternatives in relatively simple set- tings? This study explores some of the variables that past work suggests may be relevant. Volunteer subjects worked for money in six procedures in which the probability of a payment from either of two alternatives was 1.0, but the rate of pay (i.e. the speed with which a payment was delivered or the size of the payment) interacted with the subjects’ recent allocation of choices, which we define as the ‘internalities’. Because of the internalities, choosing the currently more profitable alternative did not maximize total earnings. Subjects were more likely to fail to maximize when the interaction between present pay and past choices was spread over longer sequences of choices, or when the reward variable was the speed, rather than the value, of each payment. Subjects often disregarded the internalities and were instead guided by the current yields of the two alterna- tives, which is a frequently observed tendency, called ‘melioration’, in experiments on choices by animals. The tendency toward melioration was only partially coun- teracted by explicit instructions on how to maximize earnings. We discuss a theore- tical framework for melioration that postulates both motivational and cognitive sources.
KEY WORDS Choice Utility maximization Melioration Individual behavior Rational choice theory
Some of the fundamental assumptions of rational choice theory have recently been challenged by controlled experiments on judgment and choice. For example, people make systematic errors in estimating probabilities (Camerer, 1987; Tversky and Kahneman, 1974), and they violate such funda- mental choice axioms as transitivity (Tversky, 1969), regularity (Huber et al., 1982), or even dominance (Kahneman and Tversky, 1981). In this paper we illustrate and discuss a possibly related source of human suboptimality in decision making which has been most extensively documented in animal
0894-3257/93/030149-37S23.50 0 1993 by John Wiley 8~ Sons, Ltd.
Received 19 June 1991 Accepted 14 March 1993
150 Journal of Behavioral Decision Making Vol. 6, Iss. No. 3
behavior. The particular source of suboptimality we consider is sometimes called ‘melioration’ (Herrn- stein and Vaughan, 1980), defined below. The experiments reported here seek to uncover some of the empirical conditions that are conducive to utility maximization or to melioration as strategies for human choices, particularly when those strategies are in direct opposition.
Melioration refers to the process of choosing that alternative among a set of alternatives which has the currently higher yield in utility. The process, as observed, is often characterized by a failure to take into account the effect of current choices on future yields. Melioration can thus be thought of as involving a within-person externality, or ‘internality’, which occurs when a person underweighs or ignores a consequence of his or her own behavior for him- or herself. The internality can occur for a variety of reasons: lack of awareness of the consequence, ignorance about how to respond to it, or a motivational downgrading of time deferred or otherwise obscure consequences of action.
Melioration is readily linked with everyday experience. People often seem disposed to ignore the impact of current consumption on future tastes. Consider a hypothetical consumer whose diet consists exclusively of hamburger and caviar, both of which are obtained free of charge. Assume that the consumer’s taste for hamburger is insensitive to the amount of hamburger recently eaten but that the current taste for caviar satiates rapidly as more caviar has been consumed in the recent past. In choosing between the two foods, a maximizing consumer should take account not only of the current utility of each but also of the negative impact of current caviar consumption on utility from future caviar consumption. At equilibrium the maximizer should self-ration caviar so that the current utility from caviar consumption is always greater than that from hamburger, to balance off the loss in future utility (whether discounted or not) associated with current caviar consumption. We can therefore infer that the long-run average utility from caviar must exceed that from hamburger at a maximizing equilibrium. A meliorator, in contrast would ignore the impact of caviar consumption on future tastes, and consume caviar to the point where its current utility was equal to that obtained from hamburger. At a meliorator’s long-run equilibrium, caviar and hamburger would have the same average utility. When so much caviar is consumed that its current utility is no greater than hamburger’s, a source of continual pleasure (i.e. the ‘specialness’ of caviar) has been eroded and utility has been lost.
Analogous internalities may crop up in habits of life and character. These are the suboptimalities likely to be called bad habits or vices. For example, a ‘workaholic’ is a person who may be said to underweigh the impact of habitual extra hours of work on other aspects of life (e.g. relations with family and friends). Granting only that the high level of work creates problems, a person who underweighs these effects may allocate more time to work than called for by utility maximization. The workaholic syndrome and related suboptimalities have another distinctive feature (see Herrnstein and Prelec, 1991, 1992): As the current utility obtained from normal activities, such as time spent with family or friends, declines, the relative attractiveness of work increases. The result is a paradox attributable to melioration: the more harm the bad habit has wrought, the more likely the person is to transfer even more time and effort to it, up to the point at which the melioration equilibrium is reached.
Melioration can be represented analytically as a type of partial maximization in which certain indirect effects are ignored or underweighed. To illustrate, consider a two-period representation of the caviar-hamburger example. Assume that the individual’s consumption of caviar (C) in period 1 influences utility from caviar and hamburger (H) in period 2, but that hamburger has no such effect on tastes. The consumer’s maximization problem is:
Max U,(C,,H,) + U2(C2,H,,C,) subject to (Hi + H2)PH + (C, + C2)P, I W
Assuming an internal solution, the first-order conditions are
R. J. Herrnstein et al. Utility Maximization and Melioration 15 1
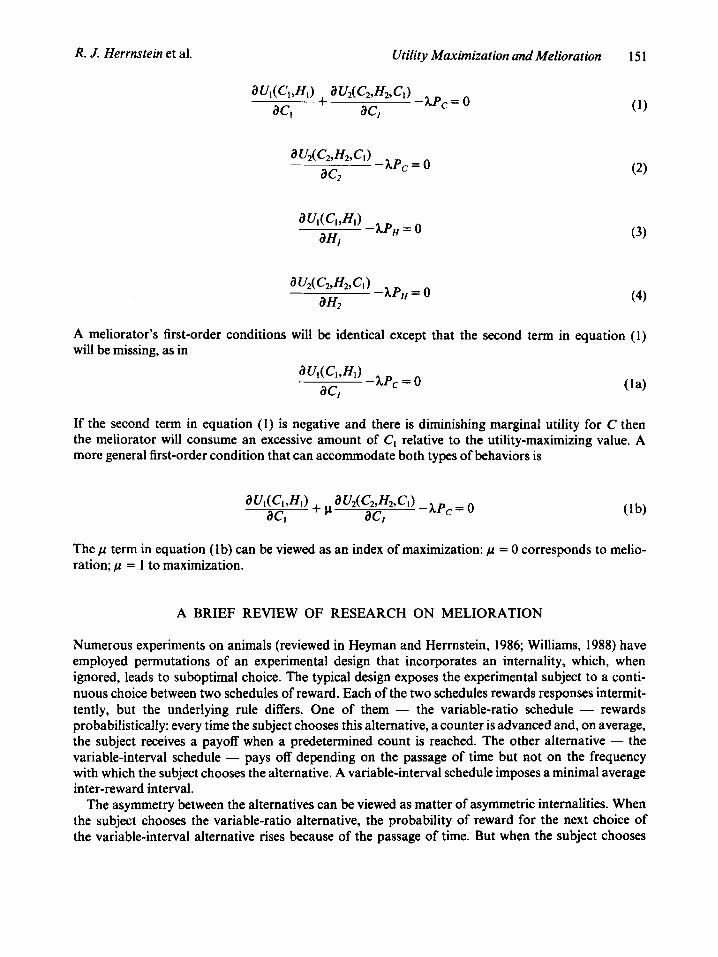
A meliorator’s first-order conditions will be identical except that the second term in equation (1) will be missing, as in
If the second term in equation (1) is negative and there is diminishing marginal utility for C then the meliorator will consume an excessive amount of C , relative to the utility-maximizing value. A more general first-order condition that can accommodate both types of behaviors is
The I( term in equation (1 b) can be viewed as an index of maximization: ,u = 0 corresponds to melio- ration; ,u = 1 to maximization.
A BRIEF REVIEW OF RESEARCH ON MELIORATION
Numerous experiments on animals (reviewed in Heyman and Herrnstein, 1986; Williams, 1988) have employed permutations of an experimental design that incorporates an internality, which, when ignored, leads to suboptimal choice. The typical design exposes the experimental subject to a conti- nuous choice between two schedules of reward. Each of the two schedules rewards responses intermit- tently, but the underlying rule differs. One of them - the variable-ratio schedule - rewards probabilistically: every time the subject chooses this alternative, a counter is advanced and, on average, the subject receives a payoff when a predetermined count is reached. The other alternative - the variable-interval schedule - pays off depending on the passage of time but not on the frequency with which the subject chooses the alternative. A variable-interval schedule imposes a minimal average inter-reward interval.
The asymmetry between the alternatives can be viewed as matter of asymmetric internalities. When the subject chooses the variable-ratio alternative, the probability of reward for the next choice of the variable-interval alternative rises because of the passage of time. But when the subject chooses

152 Journal of Behavioral Decision Making Vol. 6, Iss. No. 3
the variable-interval alternative, the probability of reward for the next response to the variable-ratio alternative remains stationary.
In order to maximize its payoff, a subject should generally spendmore of its time on the variable-ratio alternative than on the variable-interval, which is analogous to the hamburger in our hypothetical example. It would need to choose the variable-interval, the quasi-caviar, only occasionally, often enough so that rewards that are due are promptly collected, but not so often that more time than necessary is lost from working on the variable ratio. Melioration predicts that the subject will oversam- ple the variable-interval schedule, specifically to the point where the time rate of reward it yields (measured in rewards per unit of time sampling the alternative) are equal to the time rate of reward to the variable-ratio alternative (Herrnstein and Heyman, 1979).
The half-dozen or so experiments on rats and pigeons using more or less remote adaptations of this procedure generally support the principle of melioration (for a review of these findings, see Heyman and Herrnstein, 1986). In a typical experiment, the subjects may lose between a quarter and a third of the rewards available to them by approximately meliorating instead of maximizing. But not every finding unanimously supports melioration. Using a novel but related procedure, Green et af . (1983) obtained results with pigeons that fell between melioration and maximization. In place of the variable-interval schedule they employed a variable-ratio schedule with a response-based interna- lity (among other changes). That is, the pigeons chose between two variable-ratio schedules, but one was programmed such that choosing it incremented the response counters that earned rewards for both alternatives. By incrementing both counters, it captures one significant feature of the variable- interval schedule, which is that the likelihood of being rewarded for responding on a variable interval rises as a function of time spent responding elsewhere. The other alternative was programmed in the usual way for variable-ratio schedules. A straightforward application of the melioration principle would predict that the pigeons should, as in the usual procedure, equalize the time rates of reward for the two alternatives, which means oversampling one of the alternatives form the standpoint of maximization. The pigeons did sample the variable-interval-like alternative too much to maximize payoff, but they did not oversample enough to reach the melioration equilibrium point. The reason this procedure gives atypical results is a matter of some dispute (see Green et al., 1983; Heyman and Herrnstein, 1986).
Kagel et al. (1975, 1981), among others, have productively applied standard economic analysis to many experiments on animals choosing among alternatives. It should be noted that when the alternatives are all rewarded on variable-ratio schedules or their close analogues (i.e. schedules in which there are no significant internalities that are being disregarded), the predictions of melioration and maximization converge. That is, in equation (lb) it makes no differences what the value of ,u is, if the term it multiples is 0. Under these conditions, even if animals and humans were more nearly meliorators than maximizers under other circumstances, we would expect the analytic machinery of neoclassical economic theory to be applicable. The successes of experimental economics seem to be concentrated in those situations in which the subjects are either confronted by no significant internalities or are able to respond to them appropriately (see, for example, Kagel et al., 1975; 1981; Rachlin et al., 1981, and associated commentary).
Melioration, at the expense of maximization, has been demonstrated in numerous experiments on animals, but only in a few experiments involving human subjects. In the earliest of them (Herrnstein et al., 1986), subjects were presented with an apparatus consisting of two response keys and a light. They were told that when the light was illuminated they would earn two cents each time they made a choice by depressing one of the two keys, and that they would have a fixed time period during which they could earn as much money as possible. Each choice was separated from the next by an interval (prior to the re-illumination of the light) that depended on the subject’s past history of choices. The interval following a choice of one of the keys (the 1-key) was always two seconds
R. J. Herrnstein et al. Utility Maximization and Melioration 153
shorter than the interval following a choice of the other (the 2-key). However, the interval following either choice was an increasing linear function of the proportion of 1-key choices in the preceding ten choices. Because of this internality, choosing the l-key gave a higher rate of return in the short run but a lower rate in the long run. After being instructed, subjects were given 100 practice choices to familiarize themselves with the procedure, and then were given 10 minutes during which they ‘played for keeps’. They were advised that it was in their best interest to complete as many trials as possible in the 10-minute period, but were told nothing about the specific contingencies.
The maximizing strategy was to choose the 2-key on every choice (disregarding a negligible ‘end effect’, pertaining to the final ten choices of the session). Subjects who ignored the effect of current choices on future delay intervals (pure meliorators) would always select key 1, which provided a shorter immediate delay but a longer delay in the long run. This choice strategy resulted in a longer average delay, and thus an overall payoff from the experiment that was 67% as great as that received by maximizers. None of the 17 subjects maximized and all but one of them chose key 1 more often than key 2; more than 40% chose key 1 at least 90% of the time. Exclusive choice key 1 was the least efficient strategy, but the one dictated by melioration.
In sum, experimental research has shown that animal subjects meliorate in a wide range of settings, frequently at the expense of maximizing the reward typically presumed to be driving the behavior. In addition, human subjects at least sometimes fail to maximize when maximizing violates the principle of melioration.
MAXIMIZATION VERSUS MELIORATION
As a general theory of human choice, melioration as formulated in this paper is clearly inadequate.’ It is easy to think of situations in which people take full (sometimes even excessive) account of the indirect consequences of their behavior. Many people abstain from drugs out of fear of addiction, fast during the day to increase pleasure at dinner, or subject themselves to boring, if not literally painful, exercise. People often have strong intuitions about how their current activities will affect their future tastes (Kahneman and Snell, 1990), and, when making decisions, they may take these consequences into account. On the other hand, the experiment discussed above, and many of the common defects of decision making observed in humans, suggest that humans, too, at least sometimes exhibit choice behavior consistent with melioration.
An appropriate working question, therefore, is not whether people maximize or meliorate in an all-encompassing way, but rather when does behavior conform to each of these patterns in a choice between a pair of alternatives. In this paper, we explore some of the experimental conditions that tip the balance toward maximization or melioration. By uncovering the determinants, we can begin to delineate a theory of how much weight people place on indirect consequences - a theory of p in equation (1 b) - and of how individuals vary in this regard.
The second major issue we address is the source of melioration when it is observed. If we take maximization as normative, as is common in the social and behavioral sciences, then we can identify two broad classes of reasons - the cognitive and the motivational - why behavior may deviate from it and shift toward melioration. A full theory of p may not require any such distinctions among the controlling variables, but no full theory is presently at hand. We distinguish between cognitive and motivational reasons tentatively, in order to make contact with a common distinction made by psychologists rather than because we consider it either necessary or sufficient.
’ More comprehensive formulations of melioration are possible (e.g. Herrnstein, 1988). They would be based on the supposition that the choice set itself is shaped by a meliorative process. However, for present purposes, we take the choice set as a given, comprising the two alternatives.
154 Journal of Behavioral Decision Making Vol. 6 , Iss. No. 3
The set of reasons called ‘cognitive’ focuses on limitations in information processing. People may ignore the remote, indirect consequences of their actions because they are unawure of them. For example, the consumer may not realize that caviar becomes less pleasurable when frequently eaten; a workaholic may not recognize that overwork is adversely affecting his or her home life. Alternately, people may recognize an indirect consequence but fail to understand its implications for optimal behavior. Elsewhere, it has been noted that people are sometimes unable to exploit information about internalities optimally even when the information is explicitly provided (Herrnstein, 1990; Herrnstein and Mazur, 1987).
But ignorance or a failure in inductive inference is not the only possible cause of such lapses in optimality. There also seems to be a qualitatively distinct set of potential causes of melioration, which involve being lured into behavior against one’s own best interests. We call these ‘motivational’ reasons. It is well known, for example, that myopic discounting of the future causes people to over- weight immediate rewards relative to delayed consequences. Since the indirect consequences of decisions are often delayed, time discounting is likely to contribute to melioration. On this view, caviar is chosen because it is currently more appetizing than hamburger, even though one might know that a different distribution of choices would, in time, yield benefits in aggregate utility. Similarly, the workaholic may know that he or she is overworking, but find it irresistible anyway. Time discount- ing may not be the only factor that creates motivational pressures toward the suboptimal choice (see Prelec and Herrnstein, 1991, for some other plausible factors), but it is the one about which the most has been written.
In short, the experiments to follow had three purposes: first, to examine the relevance of the melioration principle to human behavior under controlled conditions; second, to explore some vari- ables that may favor melioration or maximization; and third, to assess some alternative psychological explanations for melioration. The variables chosen for study were dictated largely by a mixture of intuition and a bit of loose theorizing. What, we wondered, might promote or inhibit taking internalities into account? Providing more feedback for choices, using different reward dimensions or different reward functions, internalities with more or less history involved in them, or special instructions to the subjects about the internalities themselves, were the variables we chose.
THE EXPERIMENTS
The studies discussed below are intended to simulate common varieties of consumer choice. Each is designed so that maximization and melioration make divergent predictions of behavior. All studies incorporate monetary incentives for behavior. Subjects earned roughly $10 for a session lasting about an hour or less, but earnings could vary from a low in the region of $5 to a high approximating $1 5, depending on the subject’s choices. 111 the typical experiment, subjects who consistently maximized earned about 50% more than those who consistently meliorated. All subjects were volunteers and all studies were entirely controlled by computer.
The subjects were students and others recruited at the Harvard Psychology Department and the Center For Decision Research at the IJniversity of Chicago Graduate School of Business. Since the qualitative findings from the two groups were equivalent in all experiments, we report data aggregated across the two locations.
EXPERIMENT 1
Subjects sat in front of a computer screen which initially displayed the following instructions:

R. J. Herrnstein et al. Utility Maximization and Melioration 155
In this experiment you operate a ‘money machine’. The amount you earn depends on your skill in controlling the machine. When you have finished reading these instructions, the money machine will appear on the screen.
The machine has left and right coin hoppers. Each coin that drops from a hopper pays the amount in cents designated on the hopper.
To run the machine press either the left or right arrow. After you do so, a coin will drop from either the right or left hopper, depending on which arrow you struck. When the coin finishes dropping, you can earn another coin by operating either the left or right arrow. Each coin that drops belongs to you.
You will be given 150 practice runs. The coins you earn during these trials will not count toward your earnings. After practice, you will run the machine 400 times. Your payment equals the amount earned from both hoppers.
After subjects pressed the space bar to signal that they had read the instructions, a graphic depiction of the ‘money machine’ appeared on the screen. The money machine is illustrated in Exhibit 1. The machine was similar in all experiments but was modified as discussed.
T
Exhibit 1 . Generic view of the computer monitor screen for the experimental procedures
We induced subjects’ utility functions by paying them in coins which dropped from the two hoppers. When the subject hit the left arrow key a coin dropped out of the left-hand hopper; a press of the right arrow key caused a coin to drop from the right-hand hopper. The value of each coin earned was indicated on a hopper after the key was struck to choose that hopper. All coins fell into the collectors at the lower left- and right-hand side of the screen. Coins took slightly less than 2 second to drop from the hopper into the collector. The value of accumulated coins was designated on each collector, so that by adding the numbers on the two collectors subjects could determine how much they had earned at any time.
Subjects were first given 150 practice trials, and then 400 trials were played for money, as indicated in the instructions. In both practice and actual trials, a message at the top of the screen informed them of the number of trials remaining of either of the practice or the experimental phase. When the practice trials were over, a message appeared informing the subjects that from that point on,

156 Journal of Behavioral Decision Making Vol. 6, Iss. No. 3
all rewards were real, the totals on the coin collectors were reset to zero, the session counter reset at 400 trials remaining, and subsequently counted down the number of trials remaining.
Coin values depended on the proportion of times the subjects had hit one key or the other during the last N trials, where N was systematically varied in the experiment. The parameter N is henceforth referred to as the 'averaging window'. When N is small, the average of left (right) key choices in the last N trials rapidly responds to the subject's current behavior. Thus the internality (the effect of current choices on future returns) responds rapidly to the subject's current choices and may, for this reason, be relatively easy to detect. When N is large the subject's current behavior has a small effect on the average behavior over the last N trials, so that the indirect effect of current behavior on payoffs operates more slowly and may be more difficult to detect. It would, however, be inaccurate to say that the internality is less severe with large N than with small because, although the impact of current behavior is smaller at any particular moment with larger N , the impact is experienced in a larger number (N) of periods.
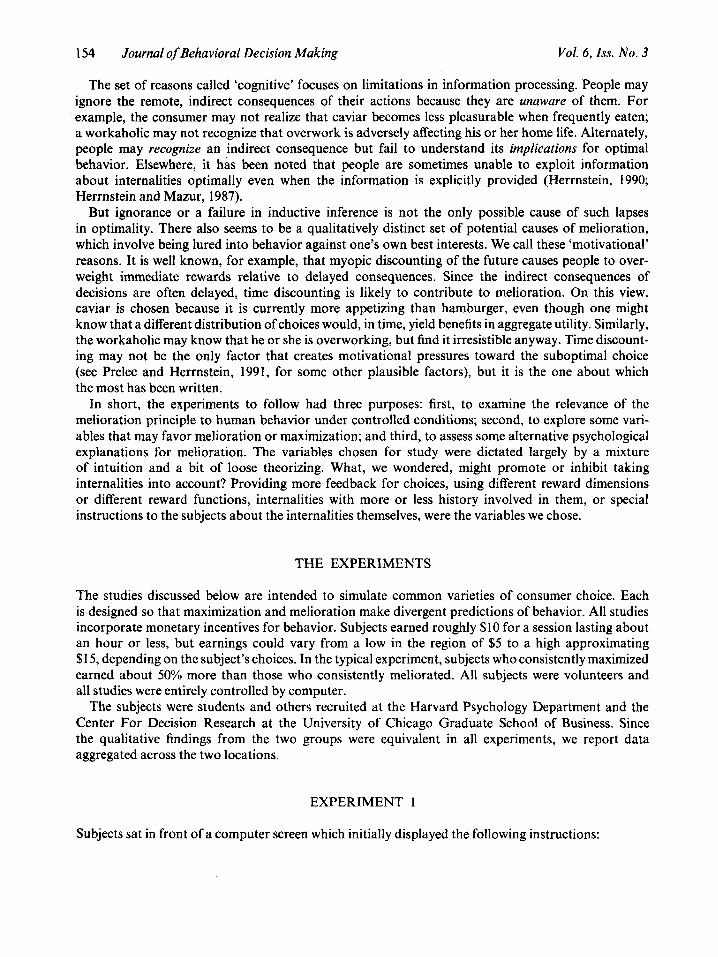
Sixty-four subjects participated in the first experiment, which was intended to capture, loosely, the essence of the workaholic situation described above. The top panel of Exhibit 2 illustrates the payoff from right- and left-key choices as a function of the fraction of right-key choices in the preceding N trials, where N is the averaging window for the prevailing procedure. The equations for these curves are given in the Appendix. Right-key choices are analogous to time spent at home, left-key choices are analogous to work. The steep positively sloped curve indicates the payoff (coin value) from the left hopper as a function of the fraction of right-key presses. Like work after a certain point, the left-key choice yields decreasing returns. The shallow positively sloped curve indicates the payoff to the right-key activity which, in our workaholic analogy, represents the returns to other activities such as time spent at home. The positive slope indicates that there are increasing rewards as one increases the percentage of right-key choices within the averaging window. Both curves decline as one increases the frequency of choosing left, but the utility from the left alternative declines more precipitously.
The curve labeled 0 indicates the weighted average payoff as a function of the fraction of choices allocated to the right-key activity. The maximization point occurs at the fraction of choices correspond- ing to the highest point on this curve and is labeled as such. The melioration point is where the L and R curves intersect, and is likewise labeled. The functions used in the study were selected such that melioration corresponded to approximately 20% right-key choices and maximization occurred at approximately 86% right-key choices.
The payoff for a subject on a single trial (the value of the coin that dropped) was equal tofiR/N) for a right-key choice and g(R/N) for a left-key choice where RIN is the proportion of right-key choices in the last N choices. In the steady state the payoff is equal to:
"I(;) N + (qg (;) First-order conditions for maximization are:
f (:) - f (:) - f' (:) - = g (:) - - ( ? ) . I ( : )
( 5 )
which occurs at the peak of curve 0 in Exhibit 2. Pure meliorators will ignore the impact of their current choices on the R / N ratio. They will therefore choose the right-key option to the point where:
" " " " ' " " I I I I I I
3 -
1 -
Me1 I I I I
-
l I I l I I l l I I 1 I I I I 1 1 1 1 I
15
30
I I I
" ' I ' I I ' ~ ' ' " ' " " ' I
I I
I / (
AV I .l,
N = 20, No Arrow
1 / 1 1 / 1 1 1 1 1 1 1 1 1 1 1 I I I I
I I AV
d, I N = 6, No Arrow I
-
- I I -
-
I N = 6, Arrow c,
% 30
Q) 0,
2
15
I I I
AV I J, l N = 20,Arrow
I
15
0 .1 .2 .3 .4 .5 .6 .7 .8 .9 1
Proportion of right responses Exhibit 2. The top panel presents the reward value curves as a function of the proportion of choices of the right alternative within the averaging window, for Experiment 1. See Appendix for the equations for these and all the subsequent reward curves. The four bottom panels are the frequency distributions for subjects in the four experimental conditions, based on the final half of money-earning trials during a session. Maximization and melioration points, and the observed averages, as indicated
158 Journal of Behavioral Decision Making Vof. 6, Iss. No. 3
Dependent measures The data analyses to be reported in detail for this and the subsequent experiments (excluding the final experiment) were based on the final half of choices made when subjects were earning money (excluding the practice phase of the session). In Experiment 1, this amounted to 200 choices. In addition, for all experiments, the entire money-earning phase was analyzed and the main results presented .
The most straightforward measure of performance during the final half of the money-earning phase of the session is the proportion of right choices made by the subjects. We present these propor- tions below. However, inasmuch as a central issue in these experiments is the extent to which subjects maximized or meliorated, we defined two dependent measures - an index of maximization and an index of melioration. The maximization index is:
(MAX- CHOICE1 \MA X-MELI
MAXINDX = 1 -
where MAX is the proportion of choices on the right corresponding to maximization, MEL is the same but for melioration, and CHOICE indicates the subjects’ actual proportion of right-key choices (RIN). The melioration index is:
IMEL-CHOICE1 (MAX-MEL(
MELINDX = 1 -
Each index defines a scale on which 1 represents perfect maximization or melioration, as the case may be, and deviation from 1 represents deviations from those normative choice strategies. Although, as will become evident, the two measures are strongly and negatively correlated, separate measures of maximization and melioration were necessary because subjects’ responses could fall outside the range between the maximization and melioration point and, for sufficiently extreme responses on the left or right side of the scale, subjects could get low scores on both maximization and melioration. For example, if MAX = 30% and MEL = 70% right-key choices, a subject who selected the right key 10% of the time would score 0.5 on MAXINDX and -0.5 on MELINDX. A subject who selected the right key 50% of the time would score 0.5 on both indices. In the former case, we could say the subject came closer to maximizing than to meliorating; in the latter, the subject showed equivalent inclinations for the two choice strategies.
Experimental conditions
Averaging window The averaging window - the parameter N discussed above - was manipulated across subjects. N was set to 6 for half of the subjects and to 20 for the other half.
Arrow Half the subjects were shown an arrow located on the screen above the left and right hoppers, which indicated by its position the proportion (RIN) of right-key choices in the last N choices, where N refers to the size of the averaging window. For the other half of subjects the arrow was missing. Subjects were not told what controlled the position of the arrow.
For half the subjects, the reward conditions were as shown in Exhibit 2; for the other half, they were reversed, that is, left and right were interchanged. Laterality made no difference in any of the experiments, so the data will be combined and reported as if all subjects had the same side conditions.

R. J. Herrnstein et al. Utility Maximization and Melioration 159
This experiment was, in fact, one of two mini-sessions for all the subjects. The other mini-session, which employed different reward functions from those shown in Exhibit 2 but was otherwise identical, will not be reported here. Half the subjects had the other mini-session first and half had it second.
Results The lower four panels of Exhibit 2 summarize the distributions of choices under the four experimental conditions, as proportions of right-key responses during the final half of the money-earning phase of the session. Each panel presents the proportions for 16 subjects with their averages as indicated. For an averaging window of 6, the averages were between 0.7 and 0.8 choices of the right, closer to the maximization point than they were for an averaging window of 20, for which the averages fell between 0.6 and 0.7. The subjects were more scattered for averaging windows of 20 than of 6. It is not apparent in these panels whether or not the arrow condition had any consistent effect. The statistical significance of these differences are assessed for the data transformed into the two indexes defined above. Note that the averages of the transformed choice proportions, to be presented below, need not equal the transformations of the averaged choice proportions just described.
Exhibit 3 shows the average values and dispersion of MAXZNDX and MELZNDX across subjects for each of the expeiimental conditions defined by averaging window and arrow display, for the last half of all trials following the practice trials. Appendix Exhibit A1 summarizes the analyses of variance on which ensuing statements of statistical significance are based.
Exhibit 3 . Experiment 1 : Means and variability: final half of session
No arrow Arrow MAXINDX N = 6 0.174
N = 2 0 0.666
MELINDX N = 6 0.207
N = 2 0 0.291
(0.152/0.038)21
(0.21 7/0.054)
(0.179/0.045)
(0.276/0.069)
0.847 (0.103/0.026)
0.669 (0.2 1 610.054)
0.123 (0.140/0.035)
0.326 (0.226/0.056)
Standard deviatiodstandard error.
Subjects came significantly closer to the maximization point with an averaging window of 6 (MAX- ZNDX = 0.81) than with a window of 20 (MAXZNDX = 0.67), or, inversely, they came closer to the melioration point with an averaging window of 20 (MELZNDX = 0.31) than with a window of 6 (MELZNDX = 0.17). The presence/absence of the arrow had no significant effect, and neither did the interaction between window size and the arrow. The overall value of MAXZNDX was 0.739; the overall value of MELZNDX was 0.237, indicating that the procedure generally favored maximiza- tion over melioration. For these indexes, as for the simple proportions shown in Exhibit 2, an averaging window of 6 was associated with less intersubject variability than an averaging window of 20.
As a test of learning fron. experience, we divided subjects’ responses for the entire money-earning phase of the session into thirds and compared MAXZNDX and MELZNDX in a second analysis of variance for each index (see Appendix Exhibit A2). Once again, an averaging window has a highly significant effect, but now, with these more complete data,the presence or absence of the
160 Journal of Behavioral Decision Making Vol. 6, Iss. No. 3
arrow, interacting with the averaging window, approaches statistical significance. There is also a highly significant effect of progress through the session (‘thirds’ in Appendix Exhibit A2), indicating learning. Only the main effect of learning is significant. The various effects are illustrated in Exhibit 4, which gives means for both MAXINDX (Exhibit 4(a)) and MELINDX (Exhibit 4(b)).
Consider Exhibit 4(a), which shows the mean values for MAXZNDX, segregated by thirds, arrow (i.e. 2 = no arrow; 3 = arrow), and averaging window. For an averaging window of 6, the presence of the arrow moved the subjects closer to maximization; for a window of 20, no such effect is visible. The complementary effect in Exhibit 4(b) is that subjects without the arrow were closer to melioration than those with it, but only for the averaging window of 6 . The exhibit also shows the clear effects of averaging window per se, and the progressive shift toward maximization (and away from melio- ration) during the course of the session.
Discussion The experimental conditions in the first study were not strongly conducive to melioration, compared to the standards of the experimental literature on animals. Even so, the subjects did not earn as much as they could. A larger averaging window, and a small averaging window in the absence of the arrow, moved behavior away from maximization. Across the session, subjects learned to maxi- mize better. These effects lend support to the cognitive perspective, inasmuch as they show that subjects shift toward maximization as the information about the effects of their choices becomes more accessible, or they simply gain experience with the contingencies of the reward schedule.
Exhibits 2 and 3 both show subjects to be more variable with the larger averaging window. Indeed, a sizable proportion of subjects approximated a 50-50 pattern of allocation. Given such data, a third possible description of behavior, besides maximization and melioration, should be considered. With an averaging window of 20, some subjects may have resorted to essentially random choices between the alternatives. A tentative conclusion, discussed later in the paper, is that for either maximi- zation or melioration to occur, certain conditions must be satisfied. Lacking those, a subject may neither maximize nor meliorate. In the animal literature also, it is well known that, under some conditions, subjects show diminished control of the average rates of reward from competing alterna- tives (e.g. Williams, 1988), so that responding is closer to random than to either melioration or maximization.
EXPERIMENT 2
Sixteen subjects (all at the Harvard laboratory) participated in the second experiment. The setup was similar to the first except that the reward functions were modified, as illustrated in the top panel of Exhibit 5. The payoffs here are intended to represent, again loosely, the hamburgerlcaviar example described in the introduction, that is, choices between differentially satiating goods. The steep negatively sloped curve (R) indicates the payoff to the right key as a function of the fraction of right-key choices. The shallow positively sloped curve (L) indicates the payoff to the left key. The intermediate curve labeled 0 indicates the average, weighted payoff as a function of the fraction of choices allocated to the right key. The maximization point occurs at the fraction of choices corres- ponding to the maximum of curve 0 (at approximately 0.33). The melioration point is indicated by the crossing point of curves L and R (at approximately 0.75). A11 conditions were run without an arrow present in the display.
The averaging window was varied within subjects. Each subject participated in two mini-sessions: one with a window of N = 6 , the other with N = 20. The right- and left-key choices were reversed

R. J. Herrnstein et al. Utility Maximization and Melioration 161
0.85 - 0.8 -
20.75 - 3 0.7- I
3
0.65 - 0.6 -
0.55
4- First 3rd
-3- Second3rd
4- Third 3rd
\ b
I I I
0.45
0.4 - 0.35 -
x 0 0.3- z d0.25 - I
0.2 - 0.15-
0.1
between the two sessions so that subjects dealt with the reward function illustrated in Exhibit 5 in one session, and with its mirror image in the other. All conditions were counterbalanced so that half the subjects began either with the two payoff functions as shown in Exhibit 5 or their mirror images, and half had an averaging window of 6 in the first mini-session and 20 in the second, or
I -0- First 3rd
-3 Second3rd
+ Third 3rd
t /
B I I I

162 Journal of Behavioral Decision Making Vol. 6, Iss. No. 3
I- I I I
15 c I I
0 .1 .2 .3 .4 .5 .6 .7 .8 .9 1
Proportion of right responses
Exhibit 5 . Experiment 2. Top panel gives reward value curves; bottom two panels, the frequency distributions for subjects, as for Exhibit 2
vice versa. The written instructions to the subjects were as in Experiment I , and they were presented prior to each mini-session.
Since all subjects participated in two similar mini-sessions, we can look at their performance in each one for evidence of learning from experience with a change in experimental conditions. Therefore, in the analyses discussed below, we included 'round' (first or second mini-session) and 'order' (N = 6, 20 or 20,6) as independent variabIes.
Results The two bottom panels of Exhibit 5 present the allocations of the 16 subjects, segregated by the size of the averaging window. As in Experiment 1, subjects were, on average, closer to maximization with N = 6 and closer to melioration with N = 20. Subjects were again more scattered with the larger window.
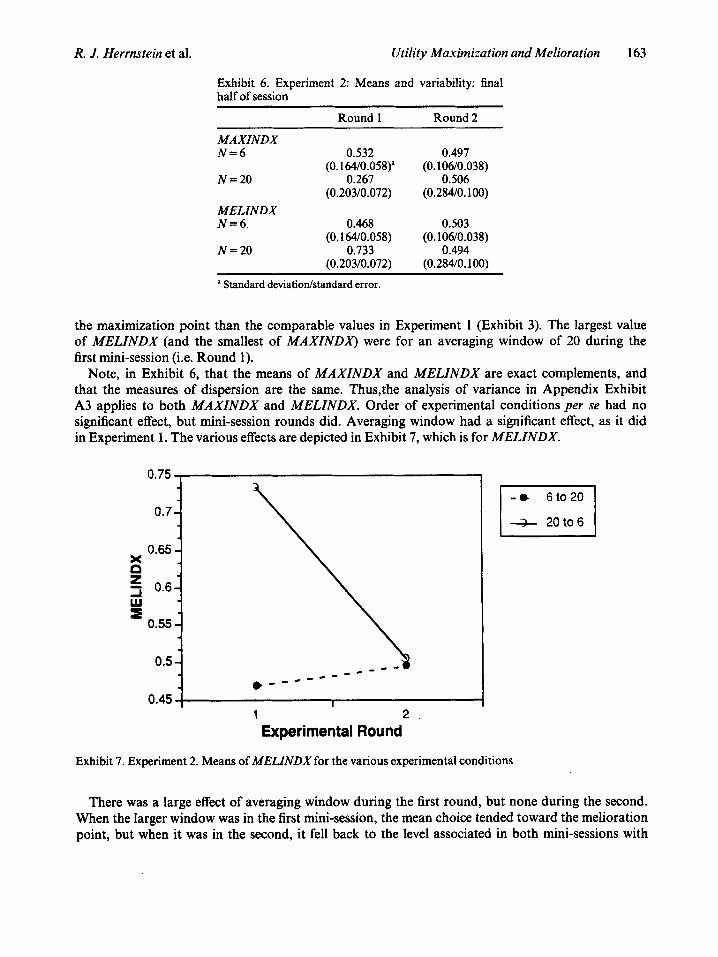
Means and variabilities for MAXZNDX and MELINDX are summarized in Exhibit 6. On the whole, the values in Exhibit 6 are substantially closer to the melioration point and further from
R. J. Herrnstein et al. Utility Maximization and Melioration 163
0.7-
0.65- n z a 0.61 Lu I
0.55 -
0.5 - 7
Exhibit 6. Experiment 2: Means and variability: final half of session
Round 1 Round 2
MAXINDX N = 6 0.532
N=20 0.267
MELINDX N = 6 . 0.468
N = 2 0 0.733
(0.164/0.058)”
(0.203/0.072)
(0.164/0.058)
(0.203/0.072)
0.497 (0.106/0.038)
0.506 (0.284/0.100)
0.503 (0.106/0.038)
0.494 (0.284/0.100)
a Standard deviatiodstandard error.
the maximization point than the comparable values in Experiment 1 (Exhibit 3). The largest value of MELZNDX (and the smallest of MAXZNDX) were for an averaging window of 20 during the first mini-session (i.e. Round 1).
Note, in Exhibit 6, that the means of MAXZNDX and MELZNDX are exact complements, and that the measures of dispersion are the same. Thus,the analysis of variance in Appendix Exhibit A3 applies to both MAXINDX and MELZNDX. Order of experimental conditions per se had no significant effect, but mini-session rounds did. Averaging window had a significant effect, as it did in Experiment 1. The various effects are depicted in Exhibit 7, which is for MELZNDX.
0.45 I I I 1 2 . Experimental Round
Exhibit 7 . Experiment 2. Means of MELINDX for the various experimental conditions
There was a large effect of averaging window during the first round, but none during the second. When the larger window was in the first mini-session, the mean choice tended toward the melioration point, but when it was in the second, it fell back to the level associated in both mini-sessions with
164 Journal of Behavioral Decision Making Vol. 6, Iss. No. 3
the smaller window. On average, subjects were significantly closer to melioration in the first mini- session than the second, but this was entirely due to the difference observed for the larger window.
The entire money-earning phase of each mini-session was again divided into thirds and subjected to analyses of variance, as in Experiment 1. For both MAXINDX and MELINDX, the only significant effects were for round and averaging window, as they were for the final half of the session. In contrast to Experiment 1, no significant within-condition learning effects were observed nor any significant interactions with thirds of the session.’
Discussion The main difference between the first and second experiments was the shape of the reward functions. When the function declined for each alternative with increasing selection of it, as in Experiment 2, subjects appeared to meliorate more and maximize less. In cognitive terms, it is obviously harder to assess the trade-offs between two commodities the values of which change at different rates and opposite signs with changes in allocation (as in Experiment 2) than to detect that both commodities are declining in value as allocation shifts in one direction and increasing as it shifts the other way (as in Experiment 1). In both experiments, however, increasing the averaging window shifts choice toward melioration.
The effects of averaging window and of the shapes of the functions both lend credence to the cognitive perspective, as did the marginally significant effect of the arrow in Experiment 1. It may come as no surprise that making the internality harder to detect interferes with a subject’s ability to maximize. What may be surprising, although it conforms to a large experimental literature on animal behavior, is that, as the internality becomes harder to detect, a subject’s behavior shifts toward melioration. In both experiments the larger averaging window, i.e. 20, not only shifts the average subject toward melioration and away from maximization but also increases the intersubject variability. Exhibit 5 shows that when the window was 20, several of the subjects were closely approxi- mating the melioration point, while others varied around a 50-50 allocation. A 50-50 allocation is, of course, ambiguous, signifying either indifference between the alternatives or some dynamic process that happens to have an equal split as its outcome.
EXPERIMENT 3
A larger averaging window moved subjects closer to the melioration point and further from maximiza- tion in the first two experiments. Lengthening the averaging window may obscure the internality by making it operate more slowly, causing subjects to pay less attention to it or ignore it altogether. The arrow may similarly have promoted maximization, albeit only marginally, by directing attention to the internality.
However, in neither experiment did the average subject meliorate to the degree observed in the human experiment mentioned in the introduction, let alone that in many experiments using animal subjects. There were two main differences between the earlier study and the two experiments so far described. First, the reward functions differed in shape. Second, in the earlier study the reward dimension under subjects’ control was not the value of coins that dropped from hoppers but the time delays between coins.
The purpose of the third study was, first, to compare the effects of functions resembling those
’ Analyses of variance mentioned, but not included here, are available upon request from R. J. Herrnstein.
R. J. Herrnstein et al. Utility Maximization and Melioration 165
in Experiment 2, in which value declines curvilinearly with increasing allocation, with the linear functions used in the experiment described in the introduction (Herrnstein e f al., 1986). The second purpose was to compare coin values and time delays as reward dimensions.
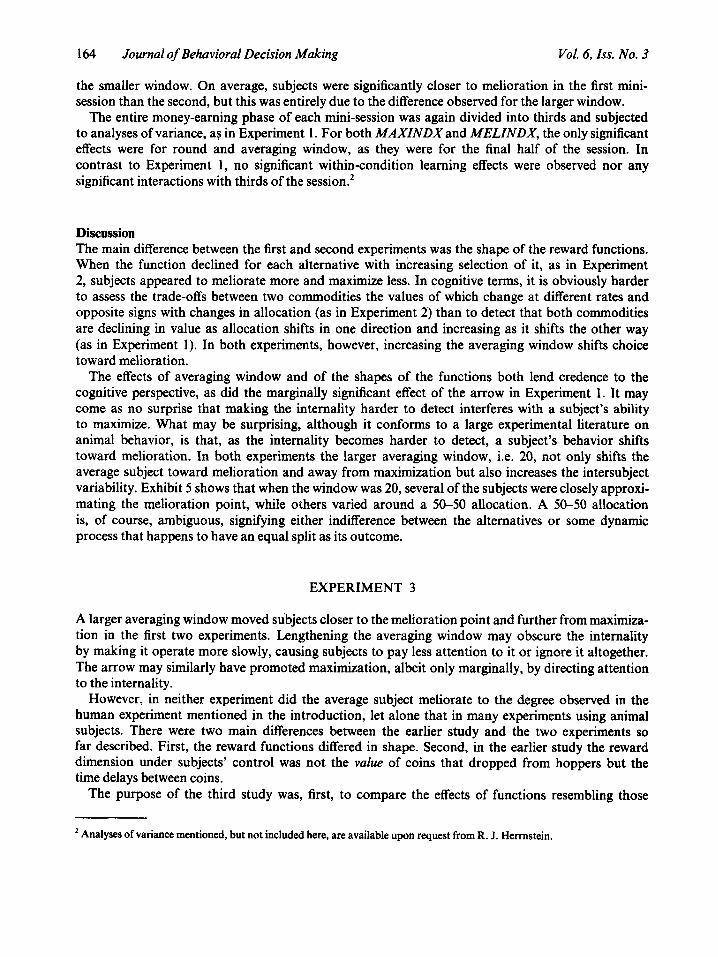
Experiment 3 comprises two subexperiments, in which a total of 44 subjects were run at the Harvard laboratory. The averaging window was 10 and no arrow was displayed in both subexperiments. In the ‘coin-delay’ subexperiment (24 subjects) the reward functions were as shown in Exhibits 8(a) and 8(b). Subjects were given 300 second of practice and 900 seconds for earning money in each of two mini-sessions. Pressing the right or left arrow key produced a coin worth one cent. The time taken for the coin to fall depended on the reward functions in use. No additional coin could be earned until a dropping coin completed its fall.
For the functions in Exhibit S(a), the right coin (R) always took 2 seconds less to fall then the left coin (L), but the time to fall was an increasing linear function of the number of right-key choices in the preceding 10 trials. Disregarding the final 10 choices in a session, the maximum (i.e. the lowest point on 0) is earned by choosing the left key exclusively, while melioration, according to which subjects compare current yields for the alternatives, requires exclusive choice of the right key, For the functions in Exhibit 8(b), the speediest average fall of the coin is obtained with approxima- tely 0.7 of choices being right-key choices, while for melioration the predicted proportion is 0.3.
Subjects worked in two mini-sessions, half with the functions in Exhibit 8(a) first and those in Exhibit 8(b) second and the other half vice versa. In addition, left and right keys were reversed for half of the subjects in each condition, so that maximization and melioration were crossed with laterality. After the two mini-sessions, the subjects received the money they earned plus $2.50. Prior to each mini-session, a subject saw the following instructions:
In this experiment you operate ‘money machine’. The amount you earn depends on your skill in controlling the machine. When you have finished reading these instructions, the money machine will appear on the screen.
The machine has left and right coin hoppers. Each coin that drops from a hopper pays the amount in cents designated on the hopper, which is one cent for all trials. You do best by trying to make the trials come as rapidly as possible.
To run the machine press either the left or right arrow. After you do so, a coin will drop from either the right or left hopper, depending on which arrow you struck. When the coin finishes dropping, you can earn another coin by operating either the left or right arrow. Each coin that drops belongs to you.
You will be given 300 seconds of practice. The coins you earn during these trials will not count toward your earnings. After practice, you can run the machine for another 900 seconds. Your payment equals the amount earned from both hoppers during these 900 seconds, plus the $2.50 for finishing the entire session.
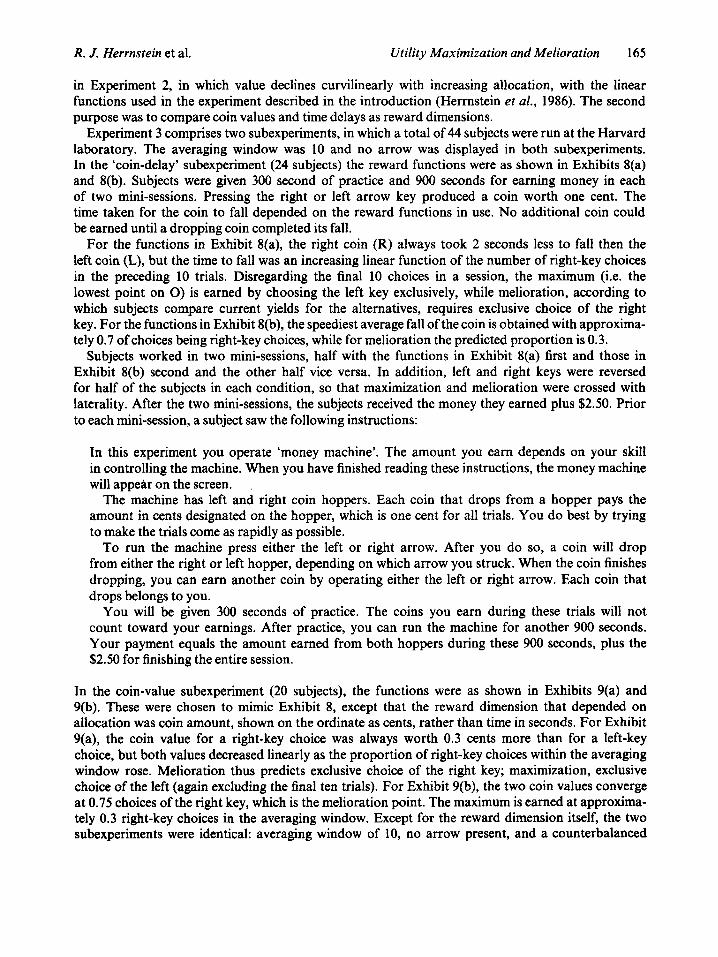
In the coin-value subexperiment (20 subjects), the functions were as shown in Exhibits 9(a) and 9(b). These were chosen to mimic Exhibit 8, except that the reward dimension that depended on allocation was coin amount, shown on the ordinate as cents, rather than time in seconds. For Exhibit 9(a), the coin value for a right-key choice was always worth 0.3 cents more than for a left-key choice, but both values decreased linearly as the proportion of right-key choices within the averaging window rose. Melioration thus predicts exclusive choice of the right key; maximization, exclusive choice of the left (again excluding the final ten trials). For Exhibit 9(b), the two coin values converge at 0.75 choices of the right key, which is the melioration point. The maximum is earned at approxima- tely 0.3 right-key choices in the averaging window. Except for the reward dimension itself, the two subexperiments were identical: averaging window of 10, no arrow present, and a counterbalanced
166 Journal of Behavioral Decision Making Vol. 6, Iss. No. 3
50 c I
A Proportion of right responses - -
I cn I
L
Proportion of right responses B Exhibit 8. Experiment 3. (a) Top panel gives the coin-dropping interval as a function of the proportion of right choices during the averaging window, for one of the two conditions in Experiment 3 in which this interval was varied. Bottom panel, the observed frequency distributions of choices, as for the previous experiments (b) Same as (a) for the other condition
R. J. Herrnstein et al. Utility Maximization and Melioration 167
pair of mini-sessions for each subject. Each subject saw- the following instructions ‘prior to .each mini-session.
In this experiment you operate a ‘money machine’. The amount you earn depends on your skill in controlling the machine. When you have finished reading these instructions, the money machine will appear on the screen.
The machine has left and right coin hoppers. Each coin that drops from a hopper pays the amount in cents designated on the hopper. To run the machine press either the left or right arrow. After you do so, a coin will drop from either the right or left hopper, depending on which arrow you struck. The value of the coin is shown on the hopper immediately after your choice. When the coin finishes dropping, you can earn another coin by operating either the left or right arrow. Each coin that drops belongs to you.
You will be given 150 practice runs. The coins you earn during these trials will not count toward your earnings. After practice, you will run the machine 400 times. Your payment equals the amount earned from both hoppers.
Results The bottom panels of Exhibits 8(a), 8(b), 9(a), and 9(b) show the allocations of subjects for the latter half of the money-earning portion of the session. Let us first consider the reward functions as parallel lines, namely Exhibits 8(a) and 9(a). When the reward dimension was coin delay, the average subject allocated almost 80% of choices to the (nominally) right alternative, coming fairly close to the melioration point and far from maximization. In contrast, when the reward dimension was the coin value, the pattern reverses, with approximately a 30% allocation to the right alternative. When the reward functions were the crossing curves (Exhibits 8(b) and 9(b)), both coin delay and coin value as the reward dimension produced approximately a 50-50 allocation of choices.
Exhibit 10 gives the means and variabilities for MAXZNDX and MELZNDX, subdivided by experi- mental conditions. Coin value and coin delay ( V and D , respectively) were varied across subjects. The average value of MELZNDX for the parallel reward functions was 0.779 for coin delay and 0.308 for coin value; for crossing reward functions, it was 0.525 for coin delay and 0.512 for coin value. Values of MAXZNDX are necessarily perfect complements for the parallel reward condition and close to perfect complements for crossing reward functions.
Analyses of variance for MELINDX and MAXINDX are summarized in Appendix Exhibit A4. Both analyses confirm the main effect of coin delay and coin value, but, surprisingly, they fail to confirm a difference between crossing and parallel reward functions, which is given by the interaction of round and order. The absence of a significant effect here is explained by the highly significant interaction between function type (i.e. interaction of round and order) and reward type (i.e. D/V). For parallel reward functions, subjects tended toward melioration with coin delay and toward maximi- zation with coin value; for crossing reward functions, they hovered around 50-50 with both reward types.
Analyses of variance for MAXZNDX and MELINDX for the complete, money-earning phase of the session divided into successive thirds did not uncover a main effect of practice. However, the interaction of rounds, thirds (i.e. practice) and reward type ( D or V) was significant for both indexes. Subjects did not show a clear practice effect during the second mini-session, but across the thirds of the first mini-session performance moved significantly toward maximization for coin value and toward melioration for coin delay. Subjects, in short, had to learn to maximize, as they tended to do when coin value was the reward dimension, or to meliorate, as they tended to do when coin delay was the reward dimension, but the learning was evidently completed during the first mini-session.

168 Journal of Behavioral Decision Making Vol. 6, Iss. No. 3
I AV I .l, I
0) 3 - >"
r 0
R I
- .
L - - 1
l o l J 0 .1 .2 .3 .4 .5 .6 .7 .8 .9 1
Proportion of right responses A
I
0 .1 .2 .3 .4 .5 .6 .7 -8 .9 1
Proportion of right responses
Exhibit 9. Experiment 3. Same as Exhibit 8, for the conditions in which coin value was varied
B
Discussion The third experiment directs attention to the reward functions (crossing versus parallel) and reward dimension (delay versus coin value) as factors that affect the level of maximization and melioration. Simply put, subjects tended to settle around a 50-50 allocation when the reward functions were

R. J. Herrnstein et al. Utility Maximization and Melioration 169
Exhibit 10. Experiment 3: Means and variability: final half of session Round 1 Round 2
MAXINDX Coin delay Crossing 0.427 0.378
Parallel 0.170 0.273
Coin value Crossing 0.400 0.577
Parallel 0.752 0.633
(0.200/0.058)s (0.235/0.068)
(0.258/0.074) (0.349/0.101)
(0.276/0.087) (0.160/0.050)
(0.25W0.082) (0.276/0.087) MELINDX Coin delay Crossing 0.573 0.476
Parallel 0.830 0.727
Coin value Crossing 0.600 0.423
Parallel 0.248 0.367
(0.200/0.058) (0.388/0.112)
(0.258/0.074) (0.349/0.10 1)
(0.276/0.087) (0.160/0.050)
(0.259/0.982) (0.276/0.087) a Standard deviatiodstnadard error.
the crossing lines, and were more likely to approximate either the maximizing or meliorating allocation when the functions were parallel lines (see Exhibits 8 and 9). Whether they approximated maximization or melioration, however, depended on whether the reward dimension was coin delay or coin value. With coin delay, melioration was the favored choice strategy; with coin value, it was maximization. To understand why these variables have the impact that they do, we need to examine the conditions which must be met for maximization and melioration to occur.
Melioration across a pair of alternatives requires a subject to keep track of only two pieces of information: the current returns to each alternative. Maximization requires keeping track of marginal returns to each alternative and of recalling them as the overall allocation shifts. To maximize, indivi- duals must be aware of, and influenced in their choices by, indirect effects of their choices (i.e. the internalities). At least from this point of view, melioration places smaller cognitive demands on a subject than maximization.
The difference between the current rewards from the two choices is constant across all allocations in the case of the parallel lines, but it diminishes in the vicinity of the melioration point with crossing curves. This suggests that if there is any difficulty in assessing accurately the current rewards it will be more difficult to locate the melioration point in the crossing-curve condition than in the parallel-line condition. Similarly, the maximization point is more sharply located (a larger first deriva- tive) with parallel lines than with crossing curves and is at the presumably more discriminable extreme of the scale. Both considerations imply that melioration and maximization are better tested against each other by the parallel-line condition than by the crossingcurve condition. In the parallel-line condition, maximization prevails with coin value and melioration prevails with coin delay.
Coin value may be an intrinsically ‘easier’ dimension to deal with quantitatively for the simple reason that it is expressed numerically. Knowing the coin values, a subject must still perform a series of calculations before assessing how choice has impacted long-run monetary returns, but at least the first step of the process is provided by the apparatus. For coin delay, the subject must take an extra step before assessing the impact of choice on returns, which is to estimate the time values themselves. In addition, to the extent that the coin-value variable is more ‘compatible’ (Slovic
170 Journal of Behavioral Decision Making Val. 6, Zss. No. 3
et al., 1990) than coin delay with the outcome of behavior, i.e. the monetary maximand in rational choice theory terms, subjects should be better in maximizing the outcome with coin values.
Considering the separate effects of the reward function and the dimension of reward, it is not surprising that there was an interaction between the two variables that led to an especially close approximation to melioration (MELZNDX = 0.78) in the parallel linekoin delay condition. We may conclude that for the conditions so far tested, as it becomes harder to extract the internalities, subjects increasingly fail to maximize, but rather than lapsing into randomness, they sometimes shift toward melioration.
EXPERIMENT 4
Coin delays rather than coin values, larger averaging window, parallel rather than crossing reward functions, and no arrow to signify the current allocation of choices all tend to obscure the internalities in the procedures and, presumably as a result, favor melioration over maximization. The results to this point are thus consistent with a cognitive account of melioration. But this support for the cognitive perspective does not rule out the possibility of motivational factors further luring subjects toward the currently favorable alternative. In Experiment 4 we focus on the possibility that a motivatio- nal factor, namely an impatience to chalk up a count, may have also pushed subjects toward melioration in the condition in which melioration was strongest, that is, the parallel linekoin delay procedure of Experiment 3. Here, in order to maximize, subjects had to be able to resist choosing the more rapid earning of a coin on every trial in a procedure in which there was a time constraint for earning money. It is possible that subjects failed to resist the momentarily quicker coin, not because they did not know about the internality that made this alternative suboptimal but because they were too impatient to do so.
To test whether impatience in this sense was responsible for the observed prevalence of melioration with time delays we ran two conditions in Experiment 4. Both employed the coin delay/parallel-line reward procedure that produced the highest levels of melioration in Experiment 3. In one condition, subjects were told that each coin that dropped was theirs to keep. Impatience therefore favors the choice that leads to the shorter immediate delay, consistent with melioration. In the other condition, subjects were told that each coin that dropped was lost. In this condition, maximization involved minimizing the number of coins that dropped, which meant minimizing the immediate delay between dropping coins because a minimal immediate delay led to the slowest overall rate of coin loss. Here, short-term impatience would work in the subject’s interest.
In addition to varying the gaining or losing of coins we varied the averaging window (N = 3 and N = lo), and introduced another new experimental manipulation: in one condition coins flashed once a second as they dropped, and, in the other condition, they did not flash. We hypothesized that the flashing of coins may help subjects quantify delay and thereby favor maximization at the expense of melioration.
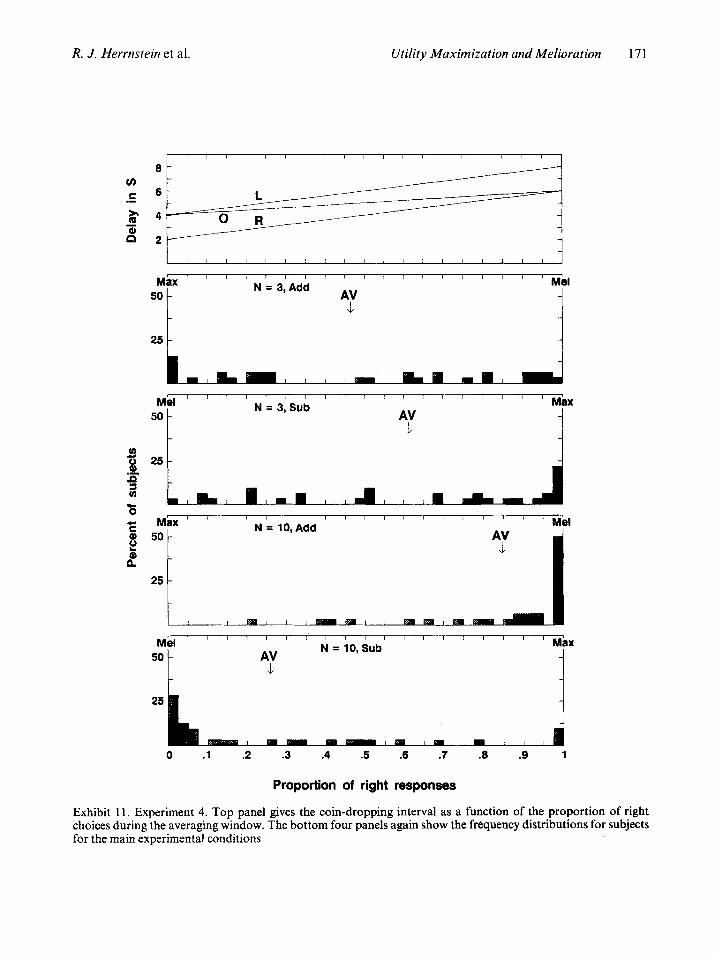
Subjects had 300 second to practice and 900 seconds in which to earn (or lose) money. Time only accumulated while a coin was dropping. Each press of the right or left arrow key produced a coin worth one cent, except that no coin could be earned while a previously earned coin was still dropping. The time taken for the coin to fall depended on the functions, which were the same as the parallel lines in Experiment 3, but are repeated here in the top panel of Exhibit 11. There was no arrow.
Each subject participated in two mini-sessions, one in which coins added to income and one in which coins subtracted from income. The order of mini-sessions and the laterality of the functions
R. J. Herrnstein et al. Utility Maximization and Melioration 17 1
L 1
M 50
f 25
3 u)
0 c M C Q) 50
P
h'
r
i 25
t 1 25
0 .1 .2 .3 .4 .5 .6 .7 .8 .Q 1
Proportion of right responses
Exhibit 11. Experiment 4. Top panel gives the coin-dropping interval as a function of the proportion of right choices during the averaging window. The bottom four panels again show the frequency distributions for subjects for the main experimental conditions
172 Journal of Behavioral Decision Making Vol. 6, Iss. No. 3
were counterbalanced across subjects. Averaging window was varied, at either 3 or 10, between subjects. A subject who completed only one mini-session received a flat payment of $2.00. If both were completed, the payment was $5.00, plus what was earned minus what was lost. A total of 64 subjects ran, half at Harvard and half at Chicago. Subjects were given the following instructions at the beginning of the mini-session in which coins added to income:
In this experiment you operate a ‘money machine’. The amount you earn depends on your skill in controlling the machine. When you have finished reading these instructions, the money machine will appear on the screen. The machine has left and right coin hoppers. Each coin that drops from a hopper pays the amount in cents designated on the hopper, which is one cent for all trials. You do best by trying to make the trials come as rapidly as possible, since in that way the most coins will drop.
To run the machine press either the left or right arrow. After you do so, a coin will drop from either the right or left hopper, depending on which arrow you struck. When the coin finishes dropping, you can earn another coin by operating either the left or right arrow. Each coin that drops belongs to you.
You will be given 300 seconds of practice, but time will only accumulate while a coin is falling. The coins you earn during these trials will not count towards your earnings. After practice, you can run the machine for another 900 seconds. Your payment includes the amount earned from both hoppers during these 900 seconds. The time between coins does not count toward the 900 seconds. If you do not complete the entire session, you will receive a flat payment of $2.00 and none of what was earned during the session.
In the beginning of the mini-session in which coins subtracted from income, subjects were instructed:
In this experiment you operate a ‘money machine’. The amount you lose depends on your skill in controlling the machine. When you have finished reading these instructions, the money machine will appear on the screen.
The machine has left and right coin hoppers. Each coin that drops from a hopper subtracts one cent from your total earnings. You do best by trying to make the trials last as long as possible, since in that way the fewest coins will drop.
To run the machine press either the left or right arrow. After you do so, a coin will drop from either the right or left hopper, depending on which arrow you struck. When the coin finishes dropping, you will lose another coin by operating either the left or right arrow. Each coin that drops represents one cent less for you.
You will be given 300 seconds of practice, but time will only accumulate while a coin is falling. The coins you drop during these trials will not subtract from your earnings. After practice, you will run the machine for another 900 seconds. Your payment will be decremented by the amount lost from both hoppers during these 900 seconds. The time between coins does not count toward the 900 seconds. If you do not complete the entire session, you will receive a flat payment of $2.00 and none of what was earned during the session.
Results Exhibit 11 summarizes the allocations during the final half of the money-earning (or losing) phase of the session for all subjects. The second and third panels are for the subjects for whom the averaging window was 3, separated into the mini-session in which coins were earned (‘Add’) and in which they were lost (‘Sub’). The fourth and fifth panels are the corresponding ones for the averaging
R. J. fferrnstein et al. Utility Maximization and Melioration 173
window of 10. Subjects hovered in the mid-range when N = 3 and were shifted toward the meliorating extremes when N = 10, whether coins were being earned or lost.
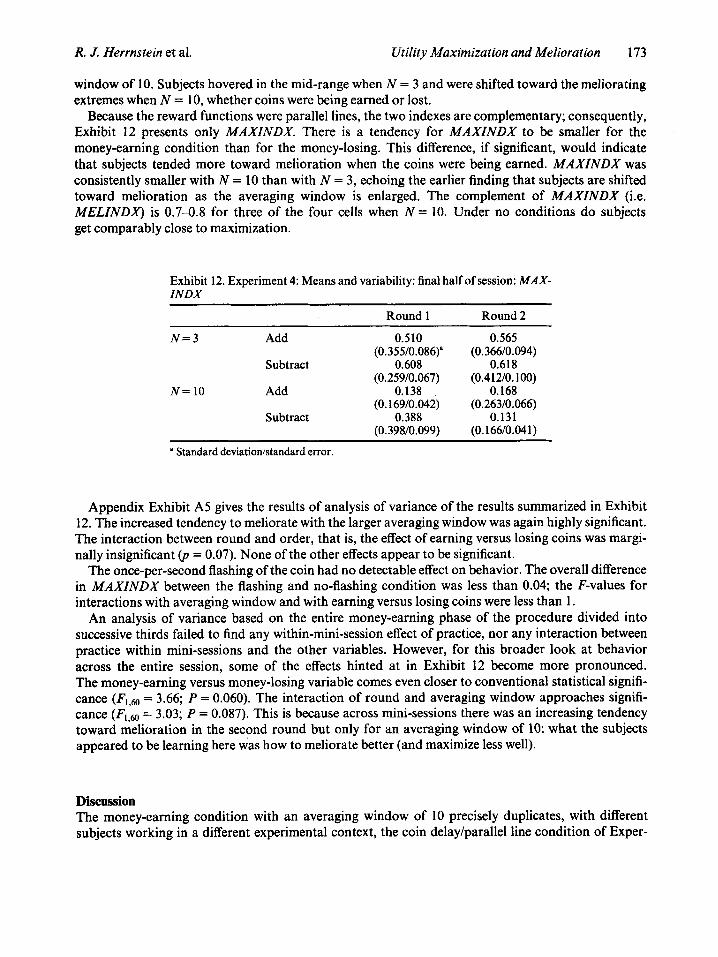
Because the reward functions were parallel lines, the two indexes are complementary; consequently, Exhibit 12 presents only MAXINDX. There is a tendency for MAXZNDX to be smaller for the money-earning condition than for the money-losing. This difference, if significant, would indicate that subjects tended more toward melioration when the coins were being earned. MAXZNDX was consistently smaller with N = 10 than with N = 3, echoing the earlier finding that subjects are shifted toward melioration as the averaging window is enlarged. The complement of MAXZNDX (i.e. MELINDX) is 0.7-0.8 for three of the four cells when N = 10. Under no conditions do subjects get comparably close to maximization.
Exhibit 12. Experiment 4: Means and variability: final half of session: MAX- INDX
Round 1 Round 2
N=3 Add 0.510
Subtract 0.608
N = 10 Add 0.138
Subtract 0.388
(0.355/0.086)”
(0.259/0.067)
(0.169/0.042)
(0.39U0.099)
0.565 (0.36610.094)
0.618 (0.412/0.100)
0.168 (0.263/0.066)
0.131 (0.166/0.041)
a Standard deviatiodstandatd error.
Appendix Exhibit A5 gives the results of analysis of variance of the results summarized in Exhibit 12. The increased tendency to meliorate with the larger averaging window was again highly significant. The interaction between round and order, that is, the effect of earning versus losing coins was margi- nally insignificant (p = 0.07). None of the other effects appear to be significant.
The once-per-second flashing of the coin had no detectable effect on behavior. The overall difference in MAXZNDX between the flashing and no-flashing condition was less than 0.04; the F-values for interactions with averaging window and with earning versus losing coins were less than 1.
An analysis of variance based on the entire money-earning phase of the procedure divided into successive thirds failed to find any within-mini-session effect of practice, nor any interaction between practice within mini-sessions and the other variables. However, for this broader look at behavior across the entire session, some of the effects hinted at in Exhibit 12 become more pronounced. The money-earning versus money-losing variable comes even closer to conventional statistical signifi- cance (F1,60 = 3.66; P = 0.060). The interaction of round and averaging window approaches signifi- cance (F,,60 = 3.03; P = 0.087). This is because across mini-sessions there was an increasing tendency toward melioration in the second round but only for an averaging window of 10: what the subjects appeared to be learning here was how to meliorate better (and maximize less well).
Discussion The money-earning condition with an averaging window of 10 precisely duplicates, with different subjects working in a different experimental context, the coin delay/parallel line condition of Exper-

174 Journal of Behavioral Decision Making Vol. 6, Iss. No. 3
iment 3. The value of MELZNDX here is 0.85 and was 0.78 in Experiment 3, substantiating the tendency to meliorate under these conditions. With an averaging window of 3, MELZNDX falls to 0.46, a significant shift toward maximization. However, this shift may be less noteworthy than the fact that even here, subjects are failing to maximize well. With an averaging window of 3, and a trial duration of'approximately 5 seconds, the entire relevant past history for the current choice is about 15 seconds; it expands to approximately 50 seconds with the larger window. Subjects evidently had difficulty fully taking account of even these rapidly manifested internalities.
The results of Experiment 4 suggest a small motivational component to melioration. Subjects were slightly more prone to maximize in the money-losing condition than in the money-earning condition, which means they managed to drop the average coin more slowly when they were losing the coin than when they were earning it. Presumably, there was no informational difference between the two conditions. Considerations of cognitive complexity per se would, if anything, suggest that keeping track of losing coins, since it involves subtraction, required more mental work than of adding them, yet subjects maximized slightly better when they were losing the coins. But recall that in this experiment, choosing the rapidly falling coin on a given trial means a lower overall rate of fall, because of the internality. Consequently, any tendency toward impatience, if it disposes the subject to choose the rapidly dropping coin on a given trial, would serve self-interest when the coin is being lost and harm it when the coin is being earned.
The ineffective coin-flashing condition gave subjects some additional information about the con- tingencies of reward. We anticipated that this would contribute to their ability maximize. With the benefit of hindsight, however, it becomes clear that the once-per-second flashing of the coin may be as likely to aid melioration as maximization. It could aid maximization by making the internality easier to perceive. But it could equally well aid melioration by helping subjects to compare the current time delays for the two alternatives. This presupposes that learning is no less involved when a subject meliorates as when he or she maximizes. That subject had to learn how to meliorate in this situation is suggested by the nearly significant effect of round.
EXPERIMENT 5
With parallel reward functions and delay as the reward dimension, subjects tend to meliorate, at a cost in money. The failure to maximize presumably has something to do with inadequate extraction or use of information. In the final experiment we alerted the subjects, via their instructions, to the internalities. We also tracked performance during the session and took detailed verbal protocols following the session.
The basic procedure was the parallel line/coin delay condition illustrated in Exhibit 8(a) (or the top panel in Exhibit 1 l), with an averaging window of Each subject had 300 seconds of practice and 900 seconds to earn money. The three groups, each comprising 12 subjects run at the Harvard laboratory, varied only in the instructions they received. The 'no-hint' condition was defined by the following instructions:
In this experiment you operate a 'money machine'. The amount you earn depends on your skill
The display seen by the subject was changed, to accommodate a change from IBM-type PCs to a Macintosh. On the computer screen, the subject saw a pair of boxes, side by side. Choice was made by clicking one or the other box with a computer mouse. The time delay was represented by the blacking out of the boxes, rather than by falling coins. Otherwise the display was as in the earlier experiment. The change is reflected in the wording of the instructions. We detected no effect on choice of this change, despite the fact that with the original display, the subject could estimate the delay from the rate of fall of the coin, whereas in the new display, there was no cue except the darkening of the box.

R. J. Herrnstein et al. Utility Maximization and Melioration 175
in controlling the machine. When you have finished reading these instructions, the money machine will appear on the screen.
The machine has left and right money dispensers. Each payoff is worth the amount designated on the screen. It is one cent for all trials. You do best by trying to make the trials come as rapidly as possible.
To run the machine click on either the left or right dispenser. After you do so, the dispenser you chose will be blacked out as the payoff is collected. When the dispenser comes back on, you can earn another payoff by choosing either the left or right dispenser. Each payoff that you earn belongs to you.
You will be given 300 second of practice. The money you earn during these trials will not count toward your earnings. After practice, you can run the machine for another 900 seconds. Your payment equals the amount earned from both dispensers during these 900 seconds, plus $2.50 for finishing the entire session.
The instructions for the ‘medium-hint’ condition were the same except for the hint, which was as follows: (bold letters as in original)
Hint: Choosing one dispenser or the other repeatedly may increase or decrease the speed of payoff from both dispensers, or it may affect the two dispensers differently.
The ‘strong-hint’ group received the same instructions also, except for an even more explicit hint. Half the subjects received the following hint; for the other half, ‘left’ is substituted for ‘right’ and vice versa.
Hint: Choosing the right dispenser repeatedly increases the speed of payoff from both dispensers; choosing the left dispenser repeatedly decreases the speed of payoff form both dispensers. Each subject was debriefed after the session.
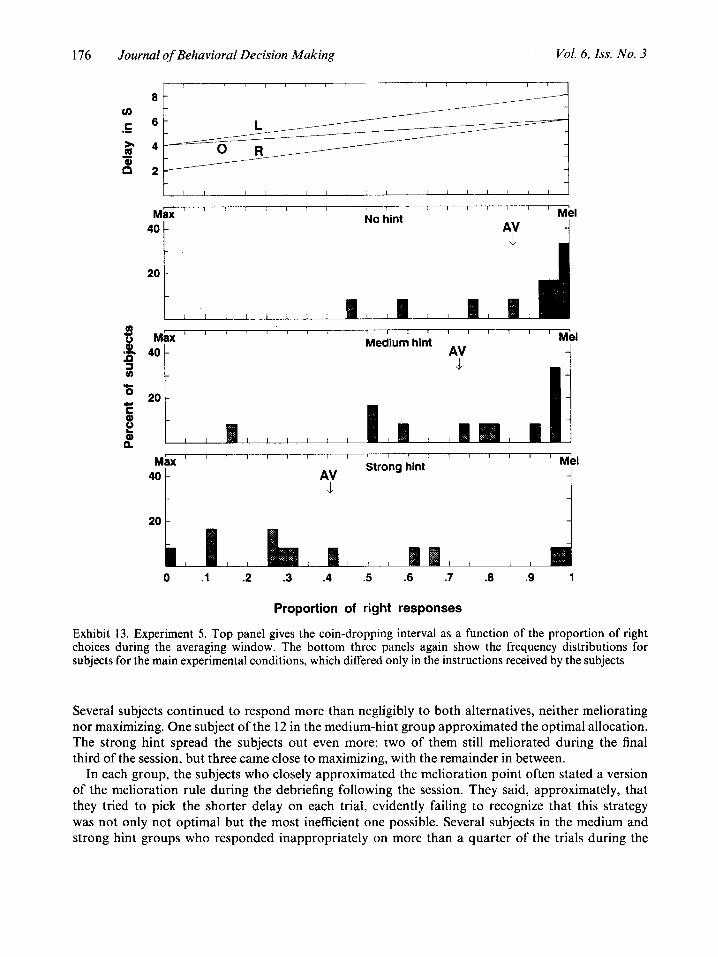
Results Exhibit 13 summarizes the main effects. The upper panel shows the reward functions. The three panels below it present the individual subject data for the final third of the money-earning phase of the session. With no hint, subjects came about as close to meliorating as they did in the previous experiments under comparable conditions, averaging 0.86. With the medium hint, which told the subject that choices may increase or decrease the rate of pay, the index dropped to 0.73. The strong hint told the subjects still more about how their choices affected earnings, and the index fell to 0.40.
According to analyses of variance on either the entire session or on the final third of the choices, instructions had a statistically significant effect beyond the 0.001 level.4 During the final third of the session choices for the medium-hint group were further from maximization than they were at the beginning. For the medium-hint group the proportions of right responses were 0.58 during the first two-thirds of the session and 0.73 during the final third.’
Intersubject variability increased significantly from no hint to medium hint to strong hint.6 With no hint provided, most subjects were crowded near the melioration point; none came close to maximiz- ing. With the medium hint, the preponderant pattern continued to favor melioration, but less so.
‘ ANOVA for the whole session: F,,,, = 9.329; for the final third of the session, F2t33 = 9.635. For the no-hint condition, the proportions were 0.85 during the first two-thirds of the session and 0.86 during the final
third; for the strong hint condition, it was 0.40 throughout the session. ‘ By the Bartlett test for homogeneity of group variance, the increase was significant beyond the 0.05 level for the final third of the session and for the whole session.
176 Journal of Behavioral Decision Making Vol. 6, Zss. No. 3
cn C .-
M b x ' I ' 1 1 " Medium ' ' hint 1 1 I ' 1 J Me1 *
h' ' 40 a v) r
O 20 c, C Q)
; n
20 1 I 0 .1 .2 .3 .4 .5 .6 .7 .8 .9 1
Proportion of right responses
Exhibit 13. Experiment 5 . Top panel gives the coin-dropping interval as a function of the proportion of right choices during the averaging window. The bottom three panels again show the frequency distributions for subjects for the main experimental conditions, which differed only in the instructions received by the subjects
Several subjects continued to respond more than negligibly to both alternatives, neither meliorating nor maximizing. One subject of the 12 in the medium-hint group approximated the optimal allocation. The strong hint spread the subjects out even more: two of them still meliorated during the final third of the session, but three came close to maximizing, with the remainder in between.
In each group, the subjects who clo:jely approximated the melioration point often stated a version of the melioration rule during the debriefing following the session. They said, approximately, that they tried to pick the shorter delay on each trial, evidently failing to recognize that this strategy was not only not optimal but the most inefficient one possible. Several subjects in the medium and strong hint groups who responded inappropriately on more than a quarter of the trials during the
R. J. Herrnstein et al. Utility Maximization and Melioration 111
final third of the session nevertheless expressed a reasonable optimal rule when the session was over.
Those who approximated maximization typically expressed something close to a genuinely optimiz- ing rule, that is, they expressed a grasp of the internalities. In the no-hint group, however, no one stated anything resembling an optimal rule and no one approximated maximization. Those who expressed a meliorating principle, as well as several who did not, in fact had meliorated. By far the most explicit and clear expressions in the no-hint group were by those who responded least efficiently by meliorating. The most efficient subject in the no-hint group, who divided his responses more or less equally between the alternatives, stated no clear rule at all. In all groups, a number of subjects formulated rules that bore no evident relation to the objective conditions, and were, moreover, conceptually more complex than the prevailing contingencies.
An analysis of trial-by-trial choices uncovered no clear patterns or invariances not already implied by the aggregate results presented above. Or, to put it another way, some subjects with essentially the same overall preferences had sharply differing sequential patterns of choices.
Discussion Subjects did not optimize even when their instructions came as close to telling subjects what to do as we have examined. Even more explicit guidance on the optimal strategy is evidently needed by a majority of subjects. Moreover, being able to verbalize the optimal strategy did not necessarily inoculate a subject against responding suboptimally. On the other hand, being told a rule that made the internatility conspicuous or being able to verbalize it moved the average subject closer to maximal earnings. We asked subjects who defied the instructions why they did so. Either they gave no clear answer or they said, in effect, that they did not believe the instructions or believe them fully, or that the feedback from their choices led them to disbelieve the instructions, presumably because the instructions violated the melioration strategy. To the extent that the choices changed over the course of the session, subjects became less efficient as they gained experience, as they moved toward the melioration point.
Changing the instructions moved the average subject toward maximization, consistent with a cogni- tive interpretation. But even the strong hint did not move the subjects to the optimal strategy - of the 12 subjects in the group, only three could be considered to be maximizing. At best, only one subject of the 12 who received the medium hint maximized. Over the course of the session subjects tended to shift away from the optimal strategy and toward the melioration point, particularly for the medium-hint group. The balance between the hint and the principle of melioration shifted toward the melioration point as the subjects experienced the contingencies of reward.’
SUMMARY AND CONCLUSIONS
Given a choice between two alternatives, the requirements for maximization may be represented as follows: the decision-maker must, in some cases, (1) know the current return to each alternative; (2) be aware of the existence and magnitude of the internality affecting future current returns, and (3) use the information in (1) and (2) to find the allocation yielding the long-run maximum. The requirement for melioration is limited to the first of these, that is, to know the current return to
’ The authors agree that the findings of Experiment 5 could be reconciled with cognitive or motivational interpretations, but they disagree about which interpretation, if either, is particularly strengthened by them. This disagreement says more about where each author draws the line between motivational and cognitive interpretations than about any ambiguity in the findings themselves.

118 Journal ofBehaviora1 Decision Making Vof. 6, Iss. No. 3
each alternative. Meeting none of these requirements may account for the 50-50 responding to the alternatives by some subjects throughout the experiments. Conditions that facilitate extraction of current returns, such as the flash of coins in Experiment 4, can promote either maximization or melioration, inasmuch as both strategies depend on that item of information. Factors that influence gaining knowledge of the internality, such as the size of the averaging window or the presence or absence of an arrow indicating RIN, should tip the balance between maximization and melioration one way or the other. In terms of the formal structure presented in the Introduction, all the main results could be epitomized by the magnitude of the parameter, p, ranging between 0 and 1 as subjects approximate melioration or maximization, respectively. We review the effects of several of the variables, examined from the point of view of the experiments as simulations of real-world choice settings.
Reward functions The reward functions illustrated in Exhibit 2 were intended to represent a situation in which there are two goods, consumption of one of which has a negative impact on the future payoff from both goods, but a more negative impact on itself than on the other. Many consumption situations may resemble this. For example, when a dieter increases food intake, the average payoff from eating declines, but the payoff from other activities also declines due to weight gain, albeit less steeply on average.
The reward functions illustrated in Exhibit 5 were intended to represent a situation in which there are two goods, consumption of each of which has a negative impact on the future payoff from itself and, insofar as the two goods are mutually complementary, a positive impact on the future payoff from the alternative good. This situation is representative of a wide range of consumer choices for which there is an inverse relation between level of consumption and utility per item, presumably due to satiation.
Finally, the third reward configuration, represented by the parallel lines of Exhibits 8(a) or 9(a) illustrates a situation resembling that in Exhibit 2, in that the choice of one good causes the future payoffs from both goods to decline, but here the decline is equal and linear for both goods.
As discussed below, melioration was observed almost exclusively in the delay, as distinguished from the coin-value, conditions. Within delay conditions, parallel line reward functions produced melioration, while crossing lines produced seemingly more random behavior. The discussion to Exper- iment 3 provides an explanation for this finding. There, we noted that melioration requires the subject to keep track of the current returns to each alternative. To meliorate, subjects must be able to discriminate between the delays associated with the two alternatives. With parallel reward functions, this is always relatively easy, since the difference in delay remains large, regardless of the subject’s choices. With crossing reward functions, however, discrimination becomes increasingly difficult as the subject approaches the melioration point because the delay difference gradually shrinks. This contrast between the effects of parallel and crossing reward functions lends support to the cognitive interpretation of melioration.
Averaging window Among the most robust findings from these experiments is the role of the averaging window as a determinant of choice, not only in affecting whether subjects maximized or meliorated but also in the variance among subjects. A large averaging window corresponds to a situation in which an internality is relatively unresponsive to current behavior and current returns depend on behavior in the relatively distant past. Examples would be those innumerable vices and bad habits for which payment to the piper is long deferred, and for which redemption is not rapidly achieved.

R. J. Herrnstein et al. Utility Maximization and Melioration 179
A large averaging window for an internality is the sine qua non of ‘distributed choice’ (see Herrnstein and Prelec, 1991), the very situation for which melioration is likely to result in suboptimality. The choice between spending time at work or with the family is a good example of distributed choice with the potential for significant suboptimality. The effect of any one evening spent at the office on either the returns from work or the quality of family life is likely to be small. Over many evenings, however, the effects may be dire and difficult to reverse by a short-term change in behavior. The present results show that, across even the relatively trivial range of averaging windows here explored, small windows favor maximization and large windows favor melioration. Larger averaging windows consistently increased the variance among subjects, perhaps representing the variance in how effectively individuals extract the information relevant to the choice strategies or how susceptible they are to motivational factors.
Presence of arrow The arrow, in Experiment 1, continuously informed subjects of the fraction of right-key choices they had made in the last N trials, where N is the size of the averaging window. To the slight extent that the arrow promoted maximization, it probably did so by identifying RIN as a variable and thereby calling attention to the internality. In the real world, feedback about the variable corres- ponding to RIN varies across settings. One may have abundant information at hand from colleagues and family about how many evenings are being spent at the office rather than at home, less information about one’s current average food intake, and least information of all about such things as how close one is to a serious alcohol-drinking problem.
Coin delay versus coin value Maximization was more pronounced when coin value was the reward dimension, rather than coin delay, and vice versa for melioration. As suggested earlier, coin value is expressed to the subject in numerical form, whereas coin delay requires subjective estimates for the current returns and as well as for the internalities. For that reason, it seems likely that the subjects are more able to extract and retain the information necessary for maximization with coin value as the reward dimension. In addition, however, there may be an additional motivational factor favoring melioration more with coin delay than with coin value. As a reward dimension, delay may include not just its exchange ratio with money but also impatience, as suggested by the results of Experiment 4. Time as a reward dimension is, in that sense, consumed on the spot, whereas the consumption associated with money is deferred to some time after the experimental session. The immediacy of the temporal reward dimen- sion may favor a choice strategy that focuses on a comparison of current returns, as does melioration.
Learning from experience As noted earlier, maximization in the presence of a potential internality involves three preconditions: knowledge of current payoffs and of internalities, and an understanding of how to use the information. Our data suggest that subjects often learn about the current returns from choosing the alternatives, but that their ability to extract the internalities and to perform the computations relevant to maximiza- tion is less well developed and is not much helped by mere exposure to the conditions, at least over the exposures employed here. There was little evidence of learning within mini-sessions and only occasional and slight evidence of learning from one mini-session to the next. Bypassing learning, Experiment 5 provided clues to the subjects for responding efficiently to the internalities. Performance then improved, but still fell well short of optimality.
Outside the laboratory, people learn about internalities and about the proper response to them

180 Journal of Behavioral Decision Making Vol. 6, Zss. No. 3
from other people and from their culture’s teachings (see Herrnstein and Prelec, 1992; Prelec and Herrnstein, 1991). ‘A stitch in time saves nine’ and ‘he who procrastinates is lost’ only seem inconsistent with each other until we see that each is a warning against keeping our eye too much on current returns and ignoring the internalities, as do many other proverbs and maxims. The nine-to-five working day, the daily cocktail before supper, three, and only three, meals a day, even the Saturday night bath at an earlier time, are among the countless customs that serve to impose temporal constraints on choices. We may presume that they exist at least in part because, left to ourselves, our choices have a tendency to go awry. The failure to factor internalities into our choices must be one of the flaws of individual decision making that these customs and maxims are intended to correct.
We also learn from others by observing their bad choices. An individual may fall into the trap of substance abuse or overwork or overeating because choices are being controlled too much by current returns, but, to an observer, the immediacy of the current returns lacks psychological force. In that sense, we can see each other more clearly than we see ourselves. It has been noted that deviant behavior plays an important role in society by defining norms; given the pitfalls posed by being indifferent to internalities, the deviance of others may provide us with vital lessons in how not to live.
Melioration, picoeconomics, and the struggle for self-command Like much recent work on self-control, the concept of an internality applies insights from work on interactions between agents to understanding interactions within agents. Extrapolating from current nomenclature which defines the study of market outcomes as macroeconomics and of individual behavior as microeconomics, George Ainslie (1992) has coined the term ‘picoeconomics’ to refer to the study of interactions among an individual’s behaviors. By this definition, recent examples of picoeconomics include the work of Schelling (1978, 1980, 1984), Ainslie (1975, 1992), and others, on self-control. Both authors have modeled what Schelling calls the ‘intimate contest for self-command’ as a repeated game between alternating selves - one myopic, the other farsighted. Similarly, Thaler and Shefrin (1 98 1) have applied principal-agent theory to understanding savings behavior. In their model a single atemporal principal (the ‘planner’) attempts by various means to regulate the consump- tion of a series of myopic ‘doer’ agents. Their model helps to shed light on a variety of self-control devices used by savers to limit their own consumption expenditures.
The ‘collective action problem’ or ‘n-person prisoners’ dilemma’ has also been used to shed light on the problem of co-ordinating the behavior of successive ‘selves’ (Schelling, 1978; Elster, 1979). Although different from these contributions, in that it does not necessarily involve conflict between quasi-independent ‘selves’, melioration similarly has its analog in the study of multiple agents and may also be considered a form of picoeconomics. Responses, rather than selves, are the relevant entities within the melioration framework. When a person meliorates, his or her response categories are, in effect, in competition for the person’s time or other behavioral investment.
Maximization and melioration represent alternative rules for allocating behavioral investments across competing alternatives. Given the way people evidently extract and use information about the environment, maximization is often more demanding, both cognitively and motivationally, but, by definition, it leads to superior decisions wherever its implications differ from melioration. The two rules thus pit efficiency against simplicity. The approach we have taken in this series of experiments has not been to choose between maximization and melioration as the single principle of human choice but to examine the situational variables that appear to be conducive to one principle or the other, given a pair of alternatives. Our results indicate that the shapes of the reward functions, the character of the reward object itself, and the psychological accessibility of the internality each may tip the balance toward one rule or the other.

R. J. Herrnstein et al. Utility Maximization and Melioration 18 1
APPENDIX
In the following equations, Vi refers to coin value in cents and Di to coin-dropping time in seconds, with i = r, 1, for proportion of right and left choices within the averaging window (0 s r, 1 I 1). The reward functions are for the top panels of Exhibits 2, 5, 8(a), 8(b), and 9(a), as indicated. The reward functions for Exhibit 9(b) are the same as those for Exhibit 5 , and those for Exhibit 1 1, the same as those for Exhibit 8(a).
Exhibit 2:
Exhibits 5 and 9(b):
Exhibits 8(a) and 1 1 :
Exhibit 8(b)
= 2(1.5r-I.7). v - 2(4r-2.2) r 3 I -
V, = 3(-3r+1.9). v - 3(4.6r-3.8) 9 I -
D, = 4r -k 2; DI = 4 r + 4
For 0 I r < 0.3: D, = 5.7; D1 = -5r + 7.2 For 0.3 5 r < 0.7: D , = -5r + 7.2 For 0.7 I r I 1: D, = 2.67r + 3.033; D , = -5r 1- 7.2
D, = -2r + 6.3;
Exhibit 9(a): V, = -0.6r + 1.2 Vl = -0.6r + 0.9
Exhibit A1 . Experiment 1: Analysis of variance: final half of session Source df Sum of squares Mean square F-value Fvalue
MAXINDX Arrow 1 0.02296 0.02296 0.7 1724 0.4004 Window 1 0.32715 0.32715 10.221 15 0.0022 Arrow*Window 1 0.01964 0.01964 0.61369 0.4365 Residual 60 1.92043 0.03201 MELINDX Arrow 1 0.00970 0.00970 0.21704 0.6430 Window 1 0.32715 0.32715 7.32076 0.0089 Arrow*Window 1 0.05695 0.05695 1.27433 0.2634 Residual 60 2.68127 0.04469
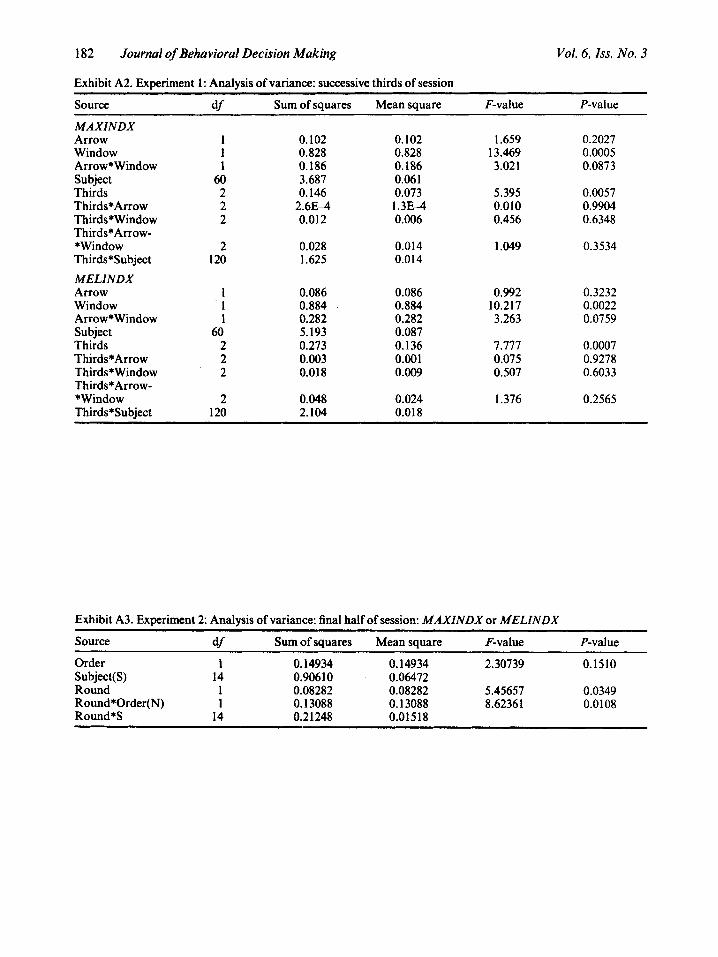
182 Journal of Behavioral Decision Making Vol. 6 , Iss. No. 3
Exhibit A2. Experiment 1: Analysis of variance: successive thirds of session
Source df Sum of squares Mean square F-value P-value
MAXINDX Arrow 1 0.102 0.102 1.659 0.2027 Window 1 0.828 0.828 13.469 0.0005 Arrow*Window 1 0.186 0.186 3.021 0.0873
Thirds 2 0.146 0.073 5.395 0.0057 Thirds*Arrow 2 2.6E-4 1.3E-4 0.010 0.9904 Thirds*Window 2 0.012 0.006 0.456 0.6348 Thirds*Arrow- *Window 2 0.028 0.014 1.049 0.3534 Thirds*Subject 120 1.625 0.014 MELINDX Arrow 1 0.086 0.086 0.992 0.3232 Window 1 0.884 0.884 10.217 0.0022 Arrow*Window 1 0.282 0.282 3.263 0.0759 Subject 60 5.193 0.087 Thirds 2 0.273 0.136 7.777 0.0007 Thirds*Arrow 2 0.003 0.001 0.075 0.9278 Thirds*Window 2 0.018 0.009 0.507 0.6033 Thirds*Arrow- *Window 2 0.048 0.024 1.376 0.2565 Thirds*Subject 120 2.104 0.018
Subject 60 3.687 0.061
Exhibit A3. Experiment 2: Analysis of variance: final half of session: MAXINDX or MELINDX
source df Sum of squares Mean square F-value P-value
Order 1 0.14934 0.14934 2.30739 0.1510 Subject( S) 14 0.90610 0.06472 Round 1 0.08282 0.08282 5.45657 0.0349 Round*Order(N) 1 0.13088 0.13088 8.62361 0.0108 Round*S 14 0.21248 0.01 5 18
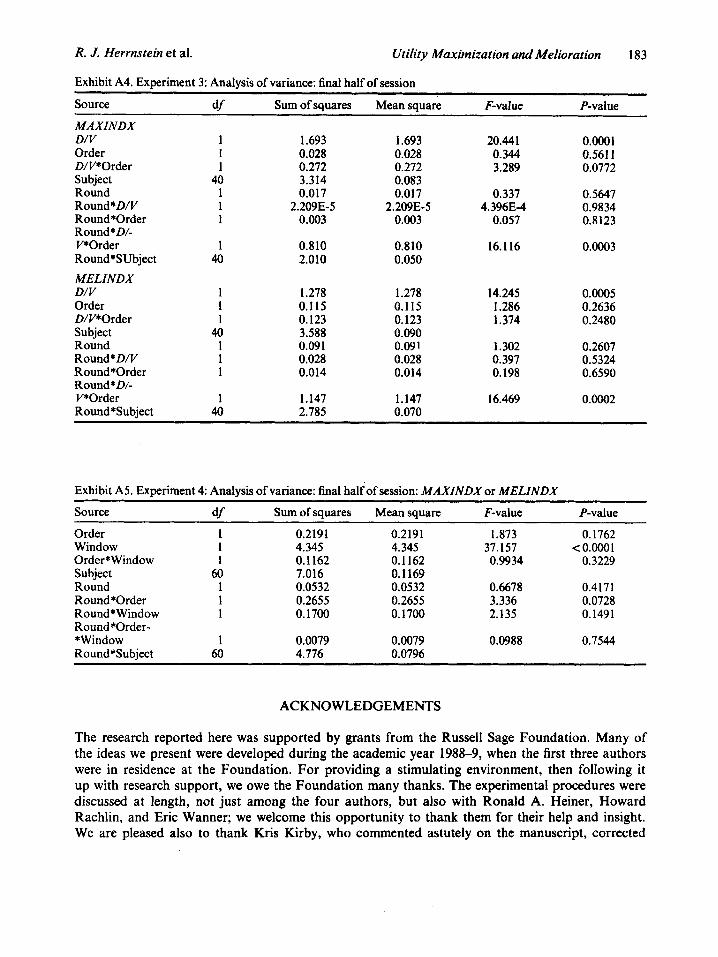
R. J. Herrnstein et al. Utility Maximization and Melioration 183
Exhibit A4. Experiment 3: Analysis of variance: final half of session
Source df Sum of squares Mean square F-value P-value MAXINDX D/V 1 1.693 1.693 20.441 o.Ooo1 Order 1 0.028 0.028 0.344 0.561 1 D/V*Order 1 0.272 0.272 3.289 0.0772 Subject 40 3.314 0.083 Round 1 0.017 0.017 0.337 0.5647 Round*D/V 1 2.209E-5 2.209E-5 4.396E-4 0.9834 Round*Order 1 0.003 0.003 0.057 0.8123 Round*D/- V*Order 1 0.810 0.810 16.116 0.0003 Round*SUbject 40 2.010 0.050 MELINDX D/V 1 1.278 1.278 14.245 O.Ooo5 Order 1 0.115 0.115 1.286 0.2636 D/V*Order 1 0.123 0.123 1.374 0.2480 Subject 40 3.588 0.090 Round 1 0.091 0.091 1.302 0.2607 Round*D/V 1 0.028 0.028 0.397 0.5324 Round*Order 1 0.014 0.014 0.198 0.6590 Round*D/- V*Order 1 1.147 1.147 16.469 0.0002 Round*Subject 40 2.785 0.070
Exhibit A5. Experiment 4: Analysis of variance: final half of session: MAXINDX or MELINDX
Source df Sum of squares Mean square F-value P-value ~ ~ ~~~~~
Order 1 0.2191 0.2191 1.873 0.1762 Window 1 4.345 4.345 37.157 <O.OOol Order*Window 1 0.1162 0.1162 0.9934 0.3229 Subject 60 7.016 0.1169 Round 1 0.0532 0.0532 0.6678 0.4171 Round*Order 1 0.2655 0.2655 3.336 0.0728 Round*Window 1 0.1700 0.1700 2.135 0.1491 Round*Order- *Window 1 0.0079 0.0079 0.0988 0.7544 Round*Subject 60 4.776 0.0796
ACKNOWLEDGEMENTS
The research reported here was supported by grants from the Russell Sage Foundation. Many of the ideas we present were developed during the academic year 1988-9, when the first three authors were in residence at the Foundation. For providing a stimulating environment, then following it up with research support, we owe the Foundation many thanks. The experimental procedures were discussed at length, not just among the four authors, but also with Ronald A. Heiner, Howard Rachlin, and Eric Wanner; we welcome this opportunity to thank them for their help and insight. We are pleased also to thank Kris Kirby, who commented astutely on the manuscript, corrected
184 Journal of Behavioral Decision Making Vol. 6, Zss. No. 3
a number of errors in our initial analyses of variance, and ran Experiment 5. The Associate Editor, Richard Thaler, and two anonymous reviewers made numerous penetrating comments and helpful suggestions. Their generosity deserves acknowledgement and thanks. Needless to say, any remaining errors are our own.
REFERENCES
Ainslie, G. ‘Specious reward: A behavioral theory of impulsiveness and impulse control’, Psychological Bulletin,
Ainslie, G. Picoeconomics: The Strategic Interaction of Successive Motivational States within the Individual,
Camerer, C. ‘Do biases in probability judgment matter in markets? Experimental evidence’, American Economic
Elster, J. Ulysses and the Sirens: Studies in Rationality and Irrationality, Cambridge: Cambridge University
Green, L., Rachlin, H., and Hanson, J. Matching and maximizing with concurrent ratio-interval schedules.
Herrnstein, R. J. ‘A behavioral alternative to utility maximization’, In Maital, S. (ed.), Applied Behavioural
Herrnstein, R.J. ‘Rational choice theory: Necessary but not sufficient’, American Psychologist, 45 (1990), 356.67, Herrnstein, R. J. and Heyman, G. M. ‘Is matching compatible with reinforcement maximization on concurrent
Herrnstein, R. J. and Mazur, J. E. ‘Making up our minds: A new model of economic behavior’, The Sciences,
Herrnstein, R. J. and Prelec, D. ‘Melioration: A theory of distributed choice’, Journal of Economic Perspectives,
Herrnstein, R. J. and Prelec, D. ‘A theory of addiction’, in Loewenstein, G. F. and Elster, J. (eds), Choice
Herrnstein, R. J., Prelec, D. and Vaughan, W., Jr ‘An intra-personal prisoners’ dilemma’, Paper presented
Herrnstein, R. J. and Vaughan, W., Jr ‘Melioration and behavioral allocation’, in Staddon, J. E. R., (ed.),
Heyman, G. M. and Herrnstein, R. J. ‘More on concurrent interval-ratio schedules: A replication and review’,
Huber, J., Payne, J. and Puto, C. ‘Adding asymmetrically dominated alternatives: Violations of regularity and
Kagel, J. H., Battalio, R. C., Rachlin, H. and Green, L. ‘Demand curves for animal consumers’, Quarterly
Kagel, J. H., Battalio, R. C., Rachlin, H., Green, L., Basmann, R. L. and Klemm, W. R. ‘Experimental studies
Kahneman, D. and Snell, J. ‘Predicting utility’, in Hogarth, R. M. (ed.), Insights in Decision Making:Theory
Prelec D. and Herrnstein, R. J. ‘Preferences or principles: Alternative guidelines for choice’, in Zeckhauser,
Rachlin, H., Battalio, R. C., Kagel, J. H. and Green, L. ‘Maximization theory in behavioral psychology’, Beha-
Schelling, T. C. Micromotives and Macrobehavior, New York: W. W. Norton, 1978. Schelling, T. C. ‘The intimate contest for self-command’, The Public Interest, (1980), Summer, No. 60 ,961 18. Schelling, T. C. ‘Self-command in practice, in policy, and in a theory of rational choice’, American Economic
Slovic, P., Griffin, D. and Tversky, A. ‘Compatibility effects in judgment and choice’, in Hogarth, R. M. (ed.),
Thaler, R. and Shefrin, H. ‘An economic theory of self-control’, Journal of Political Economy, 89 (198 I), 392-410. Tversky, A. ‘Intransitivity of preferences’, Psychological Review, 76 (1969) 3 1-48. Tversky, A. and Kahneman, D. ‘Judgment under uncertainty: Heuristics and biases’, Science, 185 (1974), 1124-31,
82 (1979,463-96.
Cambridge: Cambridge University Press, 1992.
Review, 77 (1987), 981-97.
Press, 1979.
Journal of the Experimental Analysis of Behavior, 40 (1983), 217-224.
Economics, Vol. 1, pp. 3-61, Heme1 Hempstead: Wheatsheaf Books, 1988.
variable interval, variable ratio?’ Journal of the Experimental Analysis of Behavior, 31 (1979), 209-23.
(1987), NovemberDecember, 4047.
5 (1991), 137-56.
over Time, pp. 331-60, New York: Russell Sage Foundation, 1992.
at the IX Symposium on the Quantitative Analysis of Behavior, Harvard University, 1986.
Limirs to Action: The Allocation of Individual Behavior, pp. 143-76, New York: Academic Press, 1980.
Journal of the Experimental Analysis of Behavior, 46 (1 986), 33 1-5 1.
the similarity hypothesis’, Journal of Consurner Research, 9 (1982), 90-98.
Journalof Economics66(1981), 1-15.
of consumer demand behavior using laboratory animals’, Economic Inquiry, 13 (1975), 22-38.
and Applications, Chicago: University of Chicago Press, 1990.
R. J. (ed.), The Strategy of Choice, pp. 31940, Cambridge, MA: MIT Press, 1991.
vioraland Brain Sciences, 4 (1981), 371417.
Review, 74(2) (1984), 1-1 1.
Insights in Decision Making: theory and Applications. Chicago: University of Chicago Press, 1990.
R. J. Herrnstein et al. Utility Maximization and Melioration 185
Tversky, A. and Kahneman, D. ‘The framing of decisions and the psychology of choice’, Science, 211 (1981), 453-8.
Williams, B. A. ‘Reinforcement, choice, and response strength’, in Atkinson, R. C., Herrnstein, R. J., Lindzey, G. and Luce, R. D. (eds), Stevens’ Handbook of Experimental Psychology, Vol 2, pp. 167-244, New York: Wiley, 1988.
Authors ’ biographies: R. J. Herrnstein is Professor of Psychology at Harvard University. He has been studying choice within the
framework of reinforcement theory for over three decades.
George Loewenstein is Professor of Economics in the Department of Social and Decision Sciences at Carnegie Mellon University. His research interests include intertemporal choice, psychological aspects of the economics of information, bargaining, psychology and the law, and the psychology of curiosity.
Drazen Prelec is Associate Professor Management Science in the Sloan School of Management at the Massachu- setts Institute of Technology. He holds degrees in applied mathematics and psychology from Harvard Univer- sity, and is currently applying behavioral decision research to topics in marketing.
William Vaughan Jr received his PhD from Harvard University in 1976 and continued to work there for a number of years in the laboratory of R. J. Herrnstein. His work deals primarily with choice and concept formation. He currently does consulting and works on behavior analysis and natural language processing.
Authors ’ addresses: R. J. Herrnstein, Department of Psychology, Harvard University, 33 Kirkland Street, Cambridge, MA 021 38,
USA.
George Loewenstein, Department of Social and Decision Sciences, College of Humanities and Social Sciences, Carnegie Mellon University, Pittsburgh, PA 1521 3-3890, USA.
Drazen Prelec, Sloan School of Management, E56320, Massachusetts Institute of Technology, Cambridge, MA 02 139, USA.
William Vaughan Jr, South Road, Chebeague Island, ME 04017, USA.