utilisation of directors’ remuneration in tax planningrepo.uum.edu.my/8965/1/mmj154.pdf ·...
TRANSCRIPT
http
://m
mj.u
um.e
du.m
yht
tp://
mm
j.uum
.edu
.my
45
Malaysian Management Journal Vol. 15, 45–58 (2011)
Introduction
Issues on the missing link between performance and remuneration have been long discussed as they imply rent diversion by managers (Hassan, Christopher & Evans, 2003; Abdullah, 2006; Desai & Dharmapala, 2006). Managers benefit from remunerations by way of increasing personal wealth and
reputation. In the latter case, in addition to being highly associated with outstanding achievement, it is also achieved through tax-planning activities that in turn signify higher returns to the shareholders. In Malaysia, as there is no limit in claiming directors’ remuneration expense, the tendency to manipulate the directors’ remuneration as a tax-planning technique is higher especially
UTILISATION OF DIRECTORS’ REMUNERATION IN TAX PLANNING
NOR SHAIPAH ABDUL WAHABNUR AZLIANI HANIZA CHE PAK
UUM College of Business Universiti Utara Malaysia
Abstract
Companies involve in tax planning due to its primary benefit of increase after-tax return. However, this activity has been an ongoing discussion as it impairs provision of public goods which indirectly causes social issues. Companies, in conducting tax planning, make use of several techniques to effectively minimise the tax burden, for example, profit sharing, income shifting and change of characteristics of income. Directors’ remuneration is also identified as a tax-reduction strategy. While increasing the wealth of the directors, higher directors’ remuneration expense reduces company taxable income and in turn raises company tax savings. This provides indications about the missing link between directors’ performance and pay. In fact, in Malaysia, this issue has been long debated by the public including academics. Despite this highlight, little attention has been given to the relationship between tax planning and directors’ remuneration. Therefore, this paper reports the results of this study’s focus of attention on whether tax planning activity is significantly related to directors’ remuneration expenses of non-financial Malaysian public-listed companies. The sample period of the study is from 2007 to 2009. The panel dataset is drawn from Datastream and hand-collected tax data from company annual reports. The results derived from the multivariate analyses highlight the extent of the relationship between tax planning and directors’ remuneration and thus enlighten the knowledge on the utilisation of directors’ remuneration as a strategy in tax planning. The results also highlight the policy and reporting implications to the authority.
Keywords: Tax planning, directors’ remuneration, corporate governance, tax rates.
http
://m
mj.u
um.e
du.m
yht
tp://
mm
j.uum
.edu
.my
46
Malaysian Management Journal Vol. 15, 31–43 (2011)
within companies that have lower ceiling limits of remunerations. From a survey on directors’ remuneration by loss-suffering companies, KPMG finds that a significant number of the said type of companies continued to reward their directors well in 2005 (NST, 4 October 2006). This provides indication that performance was not a crucial element for consideration in deciding the directors’ remuneration (Shanmugam, Ming, Tan, Mahmud & Hassan, 25 August 2003).
In terms of an association between directors’ remuneration and tax planning, however, conflating directions may exist in line with the argument on complementary relationship between managers’ concern on diversion and tax sheltering. Evidence from the US highlights findings that managers with higher incentives possess lower intention in corporate tax planning as such incentives reduce managers’ rent diversion that in turn accompanies lower tax sheltering activities and this can further explain variations of undersheltering puzzles within companies (Desai & Dharmapala, 2006). In the Malaysian setting, significance of directors’ remuneration as a tax-motivated expense allocation is documented by Abdul Wahab (2011). The author finds robust results on significance of the component of directors’ remuneration as an expense in corporate effective tax rates (ETR). The results are consistent when testing variations across industries and years of the panel sample period (2007-2009).
Despite the findings, utilisations of directors’ remuneration in tax planning may not hold throughout all individual tax bases as the individual tax rates in Malaysia exceed corporate tax rate when the formers’ taxable income reaches RM100,000. Generally, companies in Malaysia are liable to pay corporate tax at statutory tax rates (STR)
of 20 per cent on chargeable income up to RM500,000 for companies with paid-up capital not exceeding RM2.5 million; and of 25 per cent for other cases. However, variations in ETR are observed due to, among else, utilisation of tax provisions, incentives, and income shifting (Abdul Wahab, 2011). This suggests tax planning existence as ETR explains the tax portion of the reported income (Rego, 2003) and sequentially ETR departures from the STR explain tax saving derived therefrom. This further will lead to lower tax revenue in the hand of the Malaysian tax authority, the Malaysian Inland Revenue Board (IRB).
Therefore, the focus of attention of this research is twofold. Firstly, to what extent is directors’ remuneration related to the tax planning activities? Secondly, do reductions in individual tax rates contribute to variations in corporate tax-planning activities? The findings of this research would enlighten the knowledge on tax-planning activities among the Malaysian public-listed companies. It would also contribute to knowledge in the sense of providing empirical evidence about the influence of directors’ remuneration in tax-planning strategy in Malaysia. Further, this research will also contribute to the taxation literature in explaining the affect of individual tax rate reduction on corporate tax-planning strategy. This research is useful to the authorities to gauge the level of the manipulation of directors’ remuneration in tax computation and hence, highlights policy implication to both companies and authorities.
Directors’ Remuneration in Tax Planning
Directors’ remuneration is the incentive or compensation paid to directors for performing their duties. This payment, as to
http
://m
mj.u
um.e
du.m
yht
tp://
mm
j.uum
.edu
.my
47
Malaysian Management Journal Vol. 15, 31–43 (2011)
reflect the worth of managers’ efforts, needs to be aligned with company performance as such expense is justified as to increase shareholders’ wealth (Jensen & Meckling, 1976). But this premise, practically, is claimed as not holding true due to the lack of congruence between remuneration and performance. This is documented by Firth, Tam and Tang (1999) in their study on the determinants of top management pay. The authors find evidence that instead of performance, company size is a major top-management remuneration determinant.
This performance-pay misalignment issue, although mixed arguments have been put forward, may relate to tax-planning activities. Desai and Dharmapala (2006), in a study on tax avoidance and high-powered incentive, highlight potential implications of remuneration on tax planning. On positive intuitive arguments, higher remuneration is claimed as being able to can align managers-shareholders interests and thus increases tax- planning activities. On the other hand, if the payment is viewed as being able to lower the managerial rent diversion, higher remuneration is likely to reduce tax-planning activities. All these premises support arguments on the association of remuneration and tax planning. Particularly in Malaysia, the opportunity to manipulate the expenses is found to be higher due to unlimited allowable expense of directors’ remuneration in corporate tax computation (Income Tax Act 1967 (With Completed Rules & Regulations), 2008). The specified provision of the Act, Section 33 of the Income Tax Act 1967, stipulates that the allowable expenses are only the expenses that are wholly and exclusively incurred during a basis period, without any reference to the limitations of the deductions. Therefore, as far as the taxable income determination is
concerned, tax planning could also be one of the determinants to the directors’ pay misalignment issue.
In the US, this issue has been in the authority’s attention since early 1990s. The US authority, through Revenue Reconciliation Act 1993, limits the corporate tax deduction for executive compensation to $1 million per individual (Balsam & Ryan, 1996). In addition to benefiting the shareholders in the sense of reducing the gap between performance and pay, it also contributes to tax revenue by way of reducing remuneration manipulation in tax-planning activities. Therefore, based on the above discussions, directors’ remuneration is documented as contributing to the level of corporate tax planning activities. Hence, it is hypothesised that:
H1: There is a significant association between the level of companies’ tax-planning activities and directors’ remuneration.
Reduction in Individual Tax Rates and Directors’ Remuneration
Tax planning, if conducted effectively, will result in tax saving in the sense of higher after-tax return (Scholes & Wolfson, 1992) and higher available cash flow (Jones & Rhoades-Catanach, 2005). These returns can then be channelled to investment either in asset or equity terms. Savings can also be gained through reduction of tax rates. Through US evidence, individual tax rates are found to be associated with capital investment due to the incremental effect on cash flow (Black, Legoria & Sellers, 2000). This finding supports the arguments on the relationship between reduction in individual tax rates and directors’ remuneration in explaining
http
://m
mj.u
um.e
du.m
yht
tp://
mm
j.uum
.edu
.my
48
Malaysian Management Journal Vol. 15, 45–58 (2011)
the extent of tax-planning activities in which theoretically, with the existence of individual tax rates reduction, increments of directors’ remuneration decreases the tax payments by companies and simultaneously increases the managerial personal wealth.
Despite these arguments, reservation should be made based on the tax base of an individual taxpayer. It is important to note that the individual tax rates in Malaysia are lower as compared to the corporate tax rate of up to RM100,000 of the chargeable income of the individual taxpayer. Thus, the direction to the extent which the remuneration may contribute to tax planning depends on the existence of individual tax rate reductions. Malaysia experienced several reductions in individual tax rates i.e. during 1991, 1993, 1995, 1996, 2000, 2002, 2009 and 2010. Therefore during these years, it was expected that the reduction would increase the tax saving and thus it would be channelled to investment in companies (Abdul Wahab, Aripin, Md Idris & Che Ahmad, 2007). In line with the presumption, the level of corporate tax planning was expected to be related to the reduction in the individual tax rates. Thus, it is hypothesised that:
H2: The level of corporate tax planning is associated with the reduction in individual tax rates.
Firm-specific Characteristics
In order to control the firm-specific characteristics, this study includes several variables that have been found by previous researchers to be important in explaining cross-sectional differences in tax planning (Kern & Morris, 1992; Omer, Molloy & Ziebart, 1993; Gupta & Newberry, 1997;
Holland, 1998; Kim & Limpaphayom, 1998; Derashid & Zhang, 2003). The firm-specific characteristics discussed in this study consist of firm size, leverage, capital intensity, foreign sales, earnings management and industry classifications.
Zimmerman (1983) says that size of a company is positively related to the ETR since large firms are exposed to greater public scrutiny and thus, the companies have to incur the political cost. In contrast, Porcano (1986) highlights that there is a negative association between size and ETR due to greater resources by the larger firm to influence the above-mentioned political cost. In line with Porcano (1986), Derashid and Zhang (2003), in the study on a Malaysian sample, find a significant negative association between firm size and ETR. Gupta and Newberry (1997) also find a significant negative relationship between size and ETR among 915 U.S. firms during four years i.e. 1987–1990. However, during 1982–1985, with 823 samples of U.S. firms , the finding presents that there is a significant positive relationship of firm size and ETR.
In line with firm size, Derashid and Zhang (2003) also find similar results among Malaysian companies about the relationship of leverage and ETR. This may be due to tax deduction by interest tax shield.
Another firm-specific characteristic controlled in this study is capital intensity. Capital intensity, which explains the utilisation of property, plant and equipment in the business activity, is highly correlated to the industrial membership. For example, companies in industrial chemicals and electrical machinery tend to have high capital utilisation (Lim, 1976). Gupta
http
://m
mj.u
um.e
du.m
yht
tp://
mm
j.uum
.edu
.my
49
Malaysian Management Journal Vol. 15, 45–58 (2011)
and Newberry (1997) and Derashid and Zhang (2003) find a significant negative relationship between capital intensity and ETR. This shows that companies with a greater proportion of fixed asset utilise the tax deduction in lowering the ETR (Gupta & Newberry, 1997). The deductions include capital allowance and incentive provision.
The next firm characteristic is earnings management. It is important to control this for the manipulation of financial accounting items by managers due to, among other things, the intention that is based on contractual settings, for instance, in terms of leverage, bonus plan and size (Holland & Jackson, 2004). This is in line with Healy and Wahlen’s (1999) explanation that earnings management “occurs when managers use judgement in financial reporting and in structuring transactions to alter financial reports to either mislead some stakeholders about the underlying economic performance of the company or to influence contractual outcomes that depend on reported accounting numbers” (Healy & Wahlen, 1999: 368). Consistent with Healy (1985) and Phillips, Pincus and Rego (2003), earnings management in this study is measured based on total accrual measures which is derived by subtracting nett cash flow from operation from profit before tax. This specifically controls for variation in the tax planning that arises from earnings management (Desai & Dharmapala, 2009).
Further, the extent of foreign sales is also controlled as a proxy for the company’s involvement in multinational business. The extent of foreign sales is important as companies with a high level of multinational business activities may have greater opportunity to plan their tax. This method of tax planning is related to profit or income-
shifting in which, multinational companies may plan their tax by transferring their profit or taxable income to lower tax jurisdictions. The relationship between tax planning and the extent of multinational activities has been empirically verified by previous researchers (for example, Klassen, Lang & Wolfson, 1993; Mills, Erickson & Maydew, 1998; Rego, 2003). Therefore, in order to control the effect of the extent of multinational operations on cross-sectional difference, the extent of foreign sales is included in the testing as a control variable.
In addition to the above firm-specific characteristics, industry classification could also be associated with ETR. For example, manufacturing and hotel industries were found to be negatively related to ETR (Derashid & Zhang, 2003). This is due to different opportunity sets, for example, a different investment incentive which is available for a different industry classification. In other words, it indicates different tax planning opportunities across sectors (Mills et al., 1998). Econometrically, this control variable is important to explain the heterogeneity of the samples.
Research Design
The data of this research is collected from Thomson Financial Datastream and hand-collected tax and remuneration data from company annual reports. The sample consists of non-financial Malaysian public-listed companies (excluding finance, trust and closed-end fund industries as those industries are governed by special rules and regulations). The sample period is from 2007 to 2009 to incorporate the latest available data for panel data analysis. To reflect persistent ability in conducting tax planning
http
://m
mj.u
um.e
du.m
yht
tp://
mm
j.uum
.edu
.my
50
Malaysian Management Journal Vol. 15, 45–58 (2011)
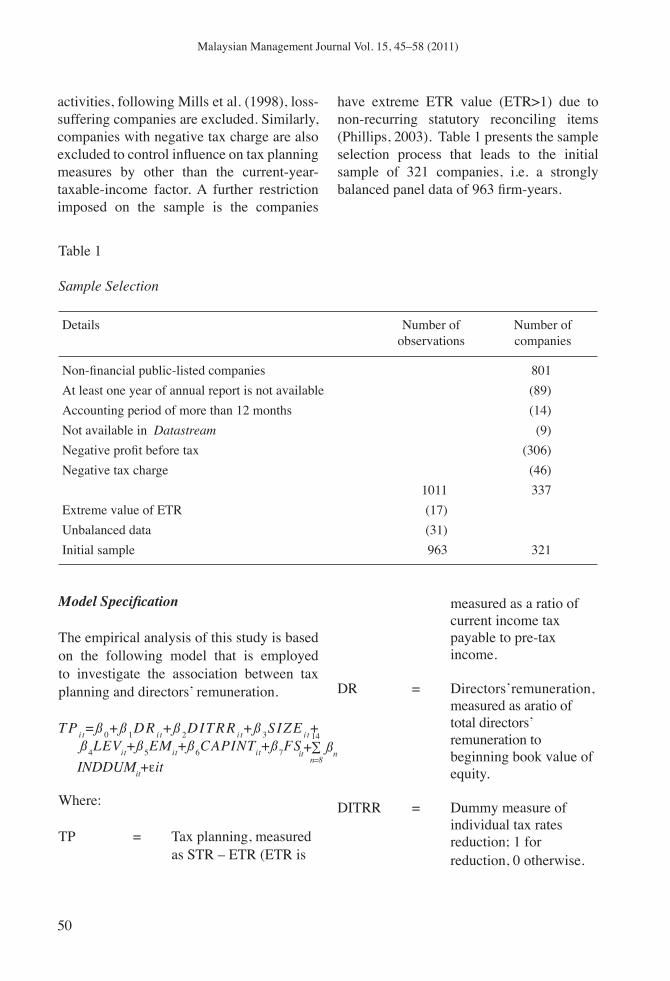
activities, following Mills et al. (1998), loss-suffering companies are excluded. Similarly, companies with negative tax charge are also excluded to control influence on tax planning measures by other than the current-year-taxable-income factor. A further restriction imposed on the sample is the companies
have extreme ETR value (ETR>1) due to non-recurring statutory reconciling items (Phillips, 2003). Table 1 presents the sample selection process that leads to the initial sample of 321 companies, i.e. a strongly balanced panel data of 963 firm-years.
50
Malaysian Management Journal Vol. 15, 45-58 (2011)
ß4LEVit+ß5EMit+ß6CAPINTit+ß7FSit+∑ ßn
14
n=8INDDUMit+εit
activities, following Mills et al. (1998), loss-suffering companies are excluded. Similarly, companies with negative tax charge are also excluded to control influence on tax planning measures by other than the current-year-taxable-income factor. A further restriction imposed on the sample is the companies
have extreme ETR value (ETR>1) due to non-recurring statutory reconciling items (Phillips, 2003). Table 1 presents the sample selection process that leads to the initial sample of 321 companies, i.e. a strongly balanced panel data of 963 firm-years.
Table 1
Sample Selection
Details Number of observations
Number of companies
Non-financial public-listed companies 801At least one year of annual report is not available (89)Accounting period of more than 12 months (14)Not available in Datastream (9)Negative profit before tax (306)Negative tax charge (46)
1011 337Extreme value of ETR (17)Unbalanced data (31)Initial sample 963 321
Model Specification
The empirical analysis of this study is based on the following model that is employed to investigate the association between tax planning and directors’ remuneration.
TP it=ß 0+ß 1DR it+ß 2DITRR it+ß 3SIZE it+
Where:
TP = Tax planning, measured as STR – ETR (ETR is
measured as a ratio of current income tax payable to pre-tax
income.
DR = Directors’remuneration, measured as aratio of total directors’ remuneration to beginning book value of equity.
DITRR = Dummy measure of individual tax rates reduction; 1 for reduction, 0 otherwise.
http
://m
mj.u
um.e
du.m
yht
tp://
mm
j.uum
.edu
.my
51
Malaysian Management Journal Vol. 15, 45–58 (2011)
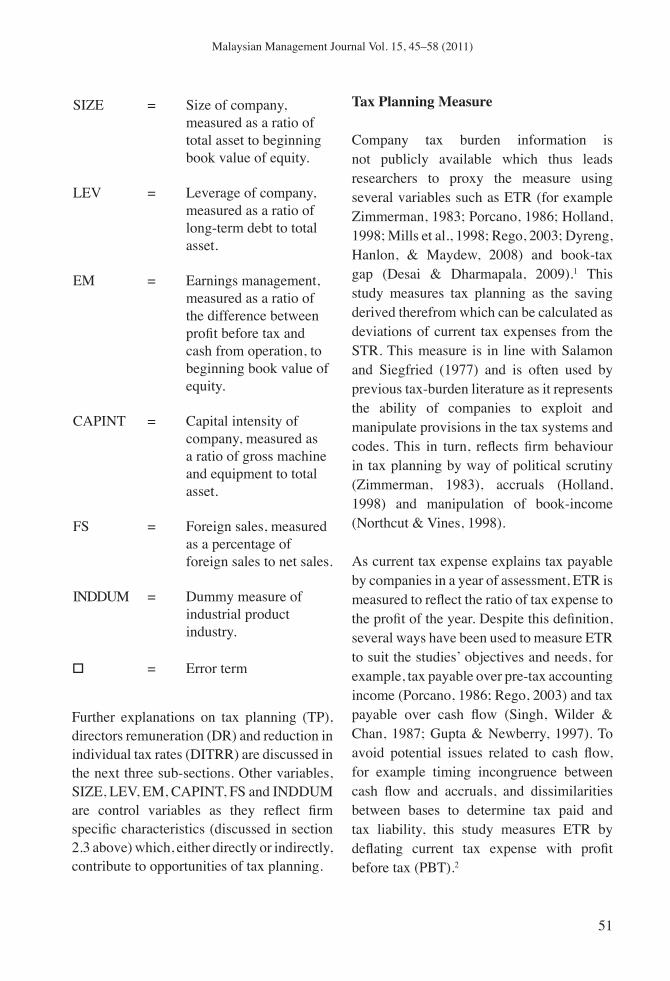
Further explanations on tax planning (TP), directors remuneration (DR) and reduction in individual tax rates (DITRR) are discussed in the next three sub-sections. Other variables, SIZE, LEV, EM, CAPINT, FS and INDDUM are control variables as they reflect firm specific characteristics (discussed in section 2.3 above) which, either directly or indirectly, contribute to opportunities of tax planning.
Tax Planning Measure
Company tax burden information is not publicly available which thus leads researchers to proxy the measure using several variables such as ETR (for example Zimmerman, 1983; Porcano, 1986; Holland, 1998; Mills et al., 1998; Rego, 2003; Dyreng, Hanlon, & Maydew, 2008) and book-tax gap (Desai & Dharmapala, 2009).1 This study measures tax planning as the saving derived therefrom which can be calculated as deviations of current tax expenses from the STR. This measure is in line with Salamon and Siegfried (1977) and is often used by previous tax-burden literature as it represents the ability of companies to exploit and manipulate provisions in the tax systems and codes. This in turn, reflects firm behaviour in tax planning by way of political scrutiny (Zimmerman, 1983), accruals (Holland, 1998) and manipulation of book-income (Northcut & Vines, 1998).
As current tax expense explains tax payable by companies in a year of assessment, ETR is measured to reflect the ratio of tax expense to the profit of the year. Despite this definition, several ways have been used to measure ETR to suit the studies’ objectives and needs, for example, tax payable over pre-tax accounting income (Porcano, 1986; Rego, 2003) and tax payable over cash flow (Singh, Wilder & Chan, 1987; Gupta & Newberry, 1997). To avoid potential issues related to cash flow, for example timing incongruence between cash flow and accruals, and dissimilarities between bases to determine tax paid and tax liability, this study measures ETR by deflating current tax expense with profit before tax (PBT).2
51
Malaysian Management Journal Vol. 15, 45-58 (2011)
Further explanations on tax planning (TP), directors remuneration (DR) and reduction in individual tax rates (DITRR) are discussed in the next three sub-sections. Other variables, SIZE, LEV, EM, CAPINT, FS and INDDUM are control variables as they reflect firm specific characteristics (discussed in section 2.3 above) which, either directly or indirectly, contribute to opportunities of tax planning.
Tax Planning Measure
Company tax burden information is not publicly available which thus leads researchers to proxy the measure using several variables such as ETR (for example Zimmerman, 1983; Porcano, 1986; Holland, 1998; Mills et al., 1998; Rego, 2003; Dyreng, Hanlon, & Maydew, 2008) and book-tax gap (Desai & Dharmapala, 2009).1 This study measures tax planning as the saving derived therefrom which can be calculated as deviations of current tax expenses from the STR. This measure is in line with Salamon and Siegfried (1977) and is often used by previous tax-burden literature as it represents the ability of companies to exploit and manipulate provisions in the tax systems and codes. This in turn, reflects firm behaviour in tax planning by way of political scrutiny (Zimmerman, 1983), accruals (Holland, 1998) and manipulation of book-income (Northcut & Vines, 1998).
As current tax expense explains tax payable by companies in a year of assessment, ETR is measured to reflect the ratio of tax expense to the profit of the year. Despite this definition, several ways have been used to measure ETR to suit the studies’ objectives and needs, for example, tax payable over pre-tax accounting income (Porcano, 1986; Rego, 2003) and tax payable over cash flow (Singh, Wilder & Chan, 1987; Gupta & Newberry, 1997). To avoid potential issues related to cash flow, for example timing incongruence between cash flow and accruals, and dissimilarities between bases to determine tax paid and tax liability, this study measures ETR by deflating current tax expense with profit before tax (PBT).2
SIZE = Size of company,
measured as a ratio of total asset to beginning book value of equity.
LEV = Leverage of company, measured as a ratio of long-term debt to total asset.
EM = Earnings management, measured as a ratio of the difference between profit before tax and cash from operation, to beginning book value of equity.
CAPINT = Capital intensity of company, measured as a ratio of gross machine and equipment to total asset.
FS = Foreign sales, measured as a percentage of foreign sales to net sales.
INDDUM = Dummy measure of industrial product industry.
� = Error term
http
://m
mj.u
um.e
du.m
yht
tp://
mm
j.uum
.edu
.my
52
Malaysian Management Journal Vol. 15, 45–58 (2011)
Thus, as ETR explains the ratio of tax paid by companies to the profit generated in the year, departure of ETR from STR signifies tax saving derived from tax-planning activities. Therefore, in light of this, tax planning in this study is measured as the difference between STR and the firm ETR.3
Directors Remuneration Measure
The directors remuneration variable in this study is defined as remuneration expense to directors (accrual basis). The data is hand-collected data from notes to the accounts from company annual reports. To control bias of inconsistency in reporting remuneration in the forms of benefit-in-kind, the items are filtered out from the measurement. This data is further scaled with beginning book value of equity to control for scale-effect heteroscedasticity (Stark & Thomas, 1998; Akbar & Stark, 2003; Horton, 2008).
Dummy Measure of Reduction in Individual Tax Rates
In assessing whether reductions in individual tax rates contribute to the extent of corporate tax planning activities, a dummy variable of individual tax rates reduction is included in the regression model. The reduction which affects the activity in the sense of increased cash flow, as discussed above, can then be channelled to investment in increasing the personal wealth. In addition, the reduction attracts the managers’ attention to focus more on personal tax planning instead of company tax-planning activities. Throughout the sample period, the tax rates had declined once in 2009 and hence the data is coded as “1” for 2009 and “0” for other cases.
Results
This section discusses the results derived from the analyses. Prior to the analyses, several diagnostic tests had been conducted to analyse the underlying assumption of the tests. Outliers of 40 observations, i.e. observations with studentized residual value of >|2| (Chen, Ender, Mitchell & Wells, 2005), were excluded. As a consequence, a further 62 observations were excluded to ensure a balanced panel dataset. In assessing influential observation, exclusion of 56 observations had been done based on critical value of DEFIT measure, i.e. abs DFIT>2*(P/N)1/2 (Belsley, Kuh, & Welsch, 1980).4 This is further followed by the exclusion of 49 observations to balance the data. These exclusions result in a final sample of 756 observations, i.e. 252 companies. The model was also analysed for multicollinearity using correlation matrices and variance inflation factor (VIF) measure (Hair, Black, Babin, Anderson, & Tatham, 2006), and condition indices (Belsley et al., 1980). The tests indicate insignificant multicollinearity.5
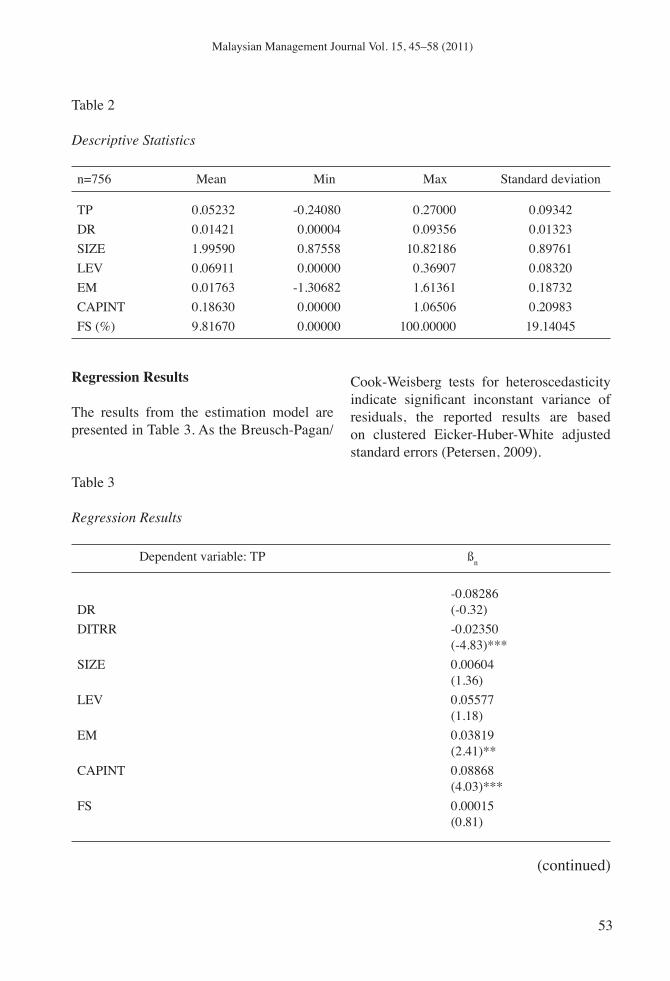
Descriptive Statistics
Table 2 presents descriptive statistics of the final sample utilised in estimating the regression model. Averagely the tax saving derived from the tax-planning activities during the three-year sample period is 5.23 per cent given the STR of 27, 26 and 25 per cents respectively for years 2007 until 2009. This implies the existence of tax-planning activities of large Malaysian public-listed companies. The scaled directors remuneration variable (DR) which indicates an average of 0.01421 represents a higher portion of remuneration than the firm beginning book value of equity.
http
://m
mj.u
um.e
du.m
yht
tp://
mm
j.uum
.edu
.my
53
Malaysian Management Journal Vol. 15, 45–58 (2011)
53
Malaysian Management Journal Vol. 15, 45-58 (2011)
Table 2
Descriptive Statistics
n=756 Mean Min Max Standard deviation
TP 0.05232 -0.24080 0.27000 0.09342DR 0.01421 0.00004 0.09356 0.01323SIZE 1.99590 0.87558 10.82186 0.89761LEV 0.06911 0.00000 0.36907 0.08320EM 0.01763 -1.30682 1.61361 0.18732CAPINT 0.18630 0.00000 1.06506 0.20983FS (%) 9.81670 0.00000 100.00000 19.14045
Regression Results
The results from the estimation model are presented in Table 3. As the Breusch-Pagan/
Table 3
Regression Results
Dependent variable: TP ßn
DR-0.08286(-0.32)
DITRR -0.02350(-4.83)***
SIZE 0.00604(1.36)
LEV 0.05577(1.18)
EM 0.03819(2.41)**
CAPINT 0.08868(4.03)***
FS 0.00015(0.81)
Cook-Weisberg tests for heteroscedasticity indicate significant inconstant variance of residuals, the reported results are based on clustered Eicker-Huber-White adjusted standard errors (Petersen, 2009).
(continued)
http
://m
mj.u
um.e
du.m
yht
tp://
mm
j.uum
.edu
.my
54
Malaysian Management Journal Vol. 15, 45–58 (2011)
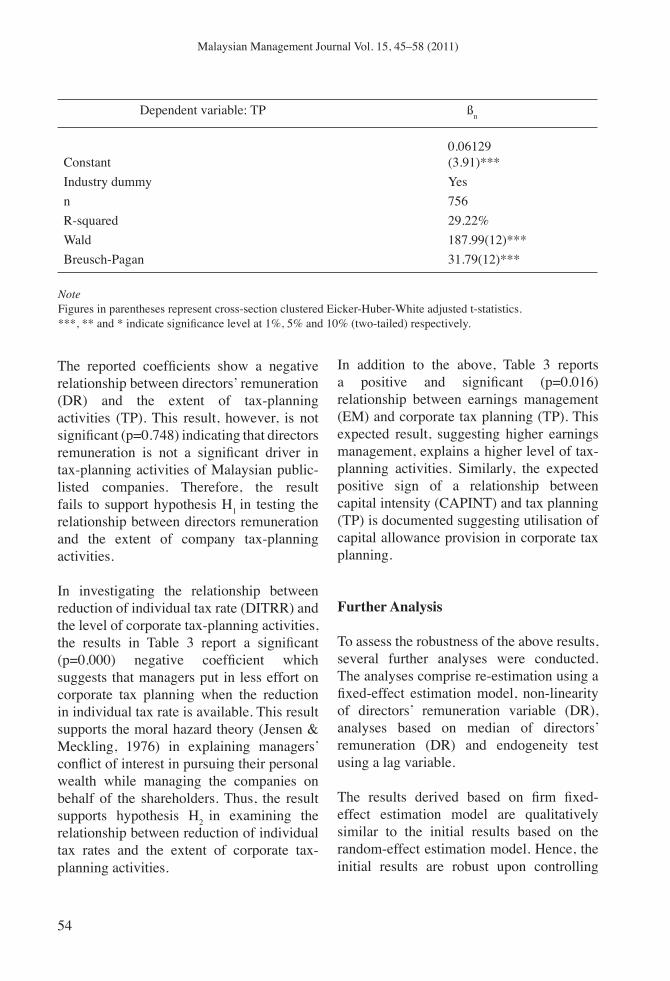
The reported coefficients show a negative relationship between directors’ remuneration (DR) and the extent of tax-planning activities (TP). This result, however, is not significant (p=0.748) indicating that directors remuneration is not a significant driver in tax-planning activities of Malaysian public-listed companies. Therefore, the result fails to support hypothesis H1 in testing the relationship between directors remuneration and the extent of company tax-planning activities.
In investigating the relationship between reduction of individual tax rate (DITRR) and the level of corporate tax-planning activities, the results in Table 3 report a significant (p=0.000) negative coefficient which suggests that managers put in less effort on corporate tax planning when the reduction in individual tax rate is available. This result supports the moral hazard theory (Jensen & Meckling, 1976) in explaining managers’ conflict of interest in pursuing their personal wealth while managing the companies on behalf of the shareholders. Thus, the result supports hypothesis H2 in examining the relationship between reduction of individual tax rates and the extent of corporate tax-planning activities.
In addition to the above, Table 3 reports a positive and significant (p=0.016) relationship between earnings management (EM) and corporate tax planning (TP). This expected result, suggesting higher earnings management, explains a higher level of tax-planning activities. Similarly, the expected positive sign of a relationship between capital intensity (CAPINT) and tax planning (TP) is documented suggesting utilisation of capital allowance provision in corporate tax planning.
Further Analysis
To assess the robustness of the above results, several further analyses were conducted. The analyses comprise re-estimation using a fixed-effect estimation model, non-linearity of directors’ remuneration variable (DR), analyses based on median of directors’ remuneration (DR) and endogeneity test using a lag variable.
The results derived based on firm fixed-effect estimation model are qualitatively similar to the initial results based on the random-effect estimation model. Hence, the initial results are robust upon controlling
54
Malaysian Management Journal Vol. 15, 45-58 (2011)
The reported coefficients show a negative relationship between directors’ remuneration (DR) and the extent of tax-planning activities (TP). This result, however, is not significant (p=0.748) indicating that directors remuneration is not a significant driver in tax-planning activities of Malaysian public-listed companies. Therefore, the result fails to support hypothesis H1 in testing the relationship between directors remuneration and the extent of company tax-planning activities.
In investigating the relationship between reduction of individual tax rate (DITRR) and the level of corporate tax-planning activities, the results in Table 3 report a significant (p=0.000) negative coefficient which suggests that managers put in less effort on corporate tax planning when the reduction in individual tax rate is available. This result supports the moral hazard theory (Jensen & Meckling, 1976) in explaining managers’ conflict of interest in pursuing their personal wealth while managing the companies on behalf of the shareholders. Thus, the result supports hypothesis H2 in examining the relationship between reduction of individual tax rates and the extent of corporate tax-planning activities.
In addition to the above, Table 3 reports a positive and significant (p=0.016) relationship between earnings management (EM) and corporate tax planning (TP). This expected result, suggesting higher earnings management, explains a higher level of tax-planning activities. Similarly, the expected positive sign of a relationship between capital intensity (CAPINT) and tax planning (TP) is documented suggesting utilisation of capital allowance provision in corporate tax planning.
Further Analysis
To assess the robustness of the above results, several further analyses were conducted. The analyses comprise re-estimation using a fixed-effect estimation model, non-linearity of directors’ remuneration variable (DR), analyses based on median of directors’ remuneration (DR) and endogeneity test using a lag variable.
The results derived based on firm fixed-effect estimation model are qualitatively similar to the initial results based on the random-effect estimation model. Hence, the initial results are robust upon controlling
Dependent variable: TP ßn
Constant0.06129(3.91)***
Industry dummy Yesn 756R-squared 29.22%Wald 187.99(12)***Breusch-Pagan 31.79(12)***
NoteFigures in parentheses represent cross-section clustered Eicker-Huber-White adjusted t-statistics.***, ** and * indicate significance level at 1%, 5% and 10% (two-tailed) respectively.
http
://m
mj.u
um.e
du.m
yht
tp://
mm
j.uum
.edu
.my
55
Malaysian Management Journal Vol. 15, 45–58 (2011)
for heterogeneity of firm characteristics. In examining the possibility of non-linearity relationship between tax planning and directors remuneration, the results reported in Table 3 were re-estimated by incorporating quadratic variable of directors remuneration (DR2). The results indicate insignificant change in R-squared (∆F=0.70, p=0.4015) suggesting qualitatively no different than the initial estimation model.
In testing whether a higher level of incentive may influence the extent of tax-planning activity differently than the other counterpart (Desai & Dharmapala, 2006), the data was regressed based on the median of DR. Both estimations (higher and lower than the median of DR) indicate insignificant difference than the combined estimation as reported in Table 3. Further, to investigate the endogeneity issue in the data, the model was re-estimated by the inclusion of lagged variable of DR (Larcker & Rusticus, 2007). This is important in controlling violation of zero-conditional-mean assumption of the regression model (Baum, 2006). The initial results are robust of which the added variable is reported as insignificant (p=0.390) in explaining its relationship with TP.
To assess variations in annual results, the data was annually regressed. The initial results of the panel data are similar to the annual reported regression results. Therefore, the results can be concluded as consistent throughout the sample period.
Conclusions
This study reports an existence of tax-planning activities of the Malaysian public-listed companies. The results of the study find a insignificant relationship between
directors’ remuneration and the extent of corporate tax-planning activities suggesting, unlike the US study (Desai & Dharmapala, 2006), directors’ remuneration is not a significant component in tax-planning decisions. This result is consistent upon controlling several factors; firm fixed-effect, non-linearity of directors’ remuneration variable (DR), analyses based on median of directors’ remuneration (DR) and endogeneity. The result is also qualitatively persistent throughout the years. Further, this study documents an adverse relationship between the availability of individual tax rates reduction and the level of corporate tax-planning activities. This, from agency theory’s point of view (Jensen & Meckling, 1976), indicates managerial intention to pursue personal wealth objective instead of maximising firm value for shareholders.
This study contributes to knowledge by highlighting the corporate tax-planning level in Malaysia. It also contributes to the taxation and corporate governance literature by suggesting further evidence in supporting managerial conflict of interest through tax-planning. The authorities have also been highlighted with the evidence of little consideration of directors’ remuneration in corporate tax-planning activities.
Applying the results to the population, however, is limited due to restrictions applied to the selected sample. Therefore, it may be worth while in future studies to extend this study by employing a larger sample size comprising various categories and sizes of companies.
During the study period (2007–2009), not only the individual tax rate was reduced but the corporate tax rate was also reduced. However, those changes were not taken into
http
://m
mj.u
um.e
du.m
yht
tp://
mm
j.uum
.edu
.my
56
Malaysian Management Journal Vol. 15, 45–58 (2011)
account during this time of analysis. Thus, future study may include this reduction in corporate tax rate in the analysis to see the influence on the results.
It is also important to highlight the limitation of the tax-planning measure as it implies the tax expense disclosed in the financial statement. However, as mentioned above, as the tax burden data is kept confidential, previous literature continues proxying tax planning with ETR measure. Therefore, the result of this study should be interpreted with an acknowledgement of the limitations of the actual tax burden measurement and thus it is essential for authorities to consider limitation in tax disclosure in financial reporting.
Acknowledgements
The authors are respectively a Senior Lecturer, and a Lecturer, in the College of Business, Universiti Utara Malaysia. Address for correspondence: Nor Shaipah Abdul Wahab, College of Business, Accounting Building, Universiti Utara Malaysia, 06010 Sintok, Kedah. E-mail: [email protected] appreciate the financial support of Universiti Utara Malaysia. We thank members of the School of Accountancy, Universiti Utara Malaysia for helpful comments and discussions.
End Notes
1Algebraically, the measure of ETR is equivalent to book-tax gap measure where PBT(ETR-STR)=(taxable income – PBT)STR.2A study by Derashid and Zhang (2003) finds no significant correlation between ETR and cash flow differences between these two measures in reflecting firm tax burden.
3 STR of large companies in Malaysia for years of assessments 2007, 2008 and 2009 were 27, 26 and 25 per cents respectively.4 P is defined as the number of independent variables and N is the number of observations.5 All bivariate correlation coefficients of the variables are below 0.9 and the VIF value is less than 10 (Hair et al., 2006). The maximum condition index is 9.61 that is below that the threshold level of 30 (Belsley et al., 1980).
References
Abdul Wahab, N. S. (2011). Directors pay: Significance as a tax-motivated expense allocation. 2nd International Conference on Business and Economic Research Proceeding.
Abdul Wahab, N. S., Aripin, N., Md Idris, K., & Che Ahmad, A. (2007). The implication of tax rates on corporate capital investment. Malaysian Accounting Review, 6(1), 45–64.
Abdullah, S. N. (2006). Directors remuneration, firms performance and corporate governance in Malaysia among distressed companies. Corporate Governance, 6(2), 162–174.
Akbar, S., & Stark, A. W. (2003). Deflators, net shareholder cash flows, dividends, capital contributions and estimated models of corporate valuation. Journal of Business Finance & Accounting, 30(9–10), 1211–1233.
Balsam, S., & Ryan, D. (1996). Response to tax law changes involving the deductibility of executive compensation: A model explaining corporate behavior. Journal of the American Taxation Association, 18 (Supplement), 1–12.
Baum, C. F. (2006). An introduction to modern econometrics using stata. College Station, Texas: Strata Press.
http
://m
mj.u
um.e
du.m
yht
tp://
mm
j.uum
.edu
.my
57
Malaysian Management Journal Vol. 15, 45–58 (2011)
Belsley, D., Kuh, E., & Welsch, R. E. (1980). Regression diagnostics: Identifying influential data and sources of collinearity. New York: John Wiley & Sons.
Black, E. L., Legoria, J., & Sellers, K. F. (2000). Capital investment effects of dividend imputation. The Journal of the American Taxation Association, 22(2), 40–59.
Chen, X., Ender, P. B., Mitchell, M., & Wells, C. (2005). Stata Web Books: Regression with Stata. Retrieved from http://www.ats.ucla.edu
Derashid, C., & Zhang, H. (2003). Effective tax rates and the “industrial policy” hypothesis: Evidence from Malaysia. Journal of International Accounting, Auditing and Taxation, 12(1), 45–62.
Desai, M. A., & Dharmapala, D. (2006). Corporate tax avoidance and high-powered incentives. Journal of Financial Economics, 79(1), 145–179.
Desai, M. A., & Dharmapala, D. (2009). Corporate tax avoidance and firm value. The Review of Economics and Statistics, 91 (3), 537–546.
Dyreng, S., Hanlon, M., & Maydew, E. L. (2008). Long-run corporate tax avoidance. The Accounting Review, 83(1), 61–82.
Firth, M., Tam, M., & Tang, M. (1999). The determinants of top management pay. Omega, 27(6), 617–635.
Gupta, S., & Newberry, K. (1997). Determinants of the variability in corporate effective tax rates: Evidence from longitudinal data. Journal of Accounting and Public Policy, 16(1), 1–34.
Hair, J. F., Black, W. C., Babin, B. J., Anderson, R. E., & Tatham, R. L. (2006). Multivariate data analysis (6th ed.). New Jersey: Pearson Education.
Hassan, S., Christopher, T., & Evans, R. (2003). Directors’ remuneration and firm performance: Malaysian evidence. Malaysian Accounting Review, 2(1), 57–67.
Healy, P. M. (1985). The effect of bonus schemes on accounting decisions. Journal of Accounting and Economics, 7, 85–107.
Healy, P. M., & Wahlen, J. M. (1999). A review of the earnings management literature and its implications for standard setting. Accounting Horizons, 13(4), 365–383.
Holland, K. (1998). Accounting policy choice: The relationship between corporate tax burdens and company size. Journal of Business Finance & Accounting, 25(3 & 4), 265–288.
Holland, K., & Jackson, R. H. G. (2004). Earnings management and deferred tax. Accounting and Business Research, 34(2), 101-123.
Horton, J. (2008). The value relevance of realistic reporting: Evidence from UK life insurers. Accounting and Business Research, 37(3), 175–197.
Income Tax Act 1967 (with Completed Rules & Regulations). (2008). Selangor: International Law Book Services.
Jensen, M. C., & Meckling, W. H. (1976). Theory of the firm: Managerial behavior, agency costs and ownership structure. Journal of Financial Economics, 3(4), 305–360.
Jones, S. M., & Rhoades-Catanach, S. C. (2005). Advance strategies in taxation (4th ed.). New York: McGraw-Hill.
Kern, B. B., & Morris, M. H. (1992). Taxes and firm size: The effect of tax legislation during the 1980s. Journal of the American Taxation Association, 14(1), 80–96.
Kim, K. A., & Limpaphayom, P. (1998). Taxes and firm size in Pacific-Basin
http
://m
mj.u
um.e
du.m
yht
tp://
mm
j.uum
.edu
.my
58
Malaysian Management Journal Vol. 15, 45–58 (2011)
emerging economies. Journal of International Accounting, Auditing and Taxation, 7(1), 47–68.
Klassen, K., Lang, M., & Wolfson, M. (1993). Geographic income shifting by multinational corporations in response to tax rate changes. Journal of Accounting Research, 31(Supplement), 141–173.
Larcker, D. F., & Rusticus, T. O. (2007). Endogeneity and empirical accounting research. European Accounting Review, 16(1), 207–215.
Lim, D. (1976). Capital utilization of local and foreign establishments in Malaysian manufacturing. The Review of Economics and Statistics, 58(2), 209–217.
Md Noor, R., M Fadzillah, N. S., & Mastuki, N. A. (2010). Corporate tax planning: A study on corporate tax rates of Malaysian listed companies. International Journal of Trade, Economics and Finance, 1(2), 189–193.
Mills, L. F., Erickson, M., & Maydew, E. L. (1998). Investment in tax planning. The Journal of the American Taxation Association, 20(1), 1–20.
Northcut, W. D., & Vines, C. C. (1998). Earning management response to political scrutiny of effective tax rates. The Journal of the American Taxation Association, 20(2), 22–36.
New Sraits Time. (2006, 4 October). Group: Pay according to performance. NST, 36.
Omer, T., Molloy, K., & Ziebart, D. (1993). An investigation of the firm size-effective tax rate relation in the 1980s. Journal of Accounting, Auditing, and Finance, 8(2), 167–182.
Petersen, M. A. (2009). Estimating standard errors in finance panel data sets: Comparing approaches. Review of Financial Studies, 22(1), 435–480.
Phillips. (2003). Corporate tax-planning effectiveness: The role of compensation-based incentives. The Accounting Review, 78(3), 847–874.
Phillips, J., Pincus, M., & Rego, S. O. (2003). Earnings management: New evidence based on deferred tax expense. The Accounting Review, 78(2), 491–521.
Porcano, T. (1986). Corporate tax rates: Progressive, proportional, or regressive. Journal of the American Taxation Association, 7(2), 17–31.
Rego, S. O. (2003). Tax-avoidance activities of U.S. multinational corporations. Contemporary Accounting Research, 20(4), 805–833.
Salamon, L., & Siegfried, J. (1977). Economic power and political influence: The impact of industry structure on public policy. The American Political Science Review, 7(3), 1026–1043.
Scholes, M. S., & Wolfson, M. A. (1992). Taxes and business strategy: A planning approach. New Jersey: Prentice Hall.
Shanmugam, M., Ming, S. C., Tan, K., Mahmud, R., & Hassan, M. (2003, 25 August). The best paymasters. TheEdge Malaysia, 1-6.
Singh, D., Wilder, R., & Chan, K. (1987). Tax rate in small and large firms. American Journal of Small Business, 22, 41–52.
Stark, A. W., & Thomas, H. M. (1998). On the empirical relationship between market value and residual income in the UK. Management Accounting Research, 9(4), 445-460.
Takisaki, A. (2006). New rules on the deductibility of directors’ remuneration. International Tax Review. Retrieved from http://www.internationaltaxreview.com
Zimmerman, J. L. (1983). Taxes and firm size. Journal of Accounting and Economics, 5(2), 11–149.