utic · rat is 0.17 for a low-concentration inhalation exposure ... = 0.568 liter/kg) for tca in...
TRANSCRIPT

UNCLASSIED UTIC F1ILE C PSECURITY CLASSIFICATION OF THIS PAGE E op
Formf App'WiedREPORT DOCUMENTATION PAGE OMB No. 070'-018
it. REPORT SECURITY CLASSIFICATION lb. RESTRICTIVE MARKINGS
a.SfimrIT ri a'cii-- 3. DISTRIBUTION IAVAILABILITY OF REPORT
21 Approved for public release; distribut iIs21 unlimited.
7 AD- A226 465 5. MONITORING ORGANIZATION REPORT NUMBER(S)
______________________ __________ AAMR-T-O-ni;6a. NAME OF PERFORMING ORGANIZAIN 6 b. OFFICE SYMBOL 7a. NAME OF MONITORING RAIMM
H. G. Armstrong Aerospace (Nf appicbe) RANAT~MMedical Research Laboratory -I AAMRL/TH
6C. ADDRESS (City, Stat., and ZIP Code) 7b. ADDRESS (City, Stat, and ZIP L-HSD, AFSC SP I9Wrightt-Patterson AFB OH 45433SE 4;@9
8.. NAME OF FUNDING /SPONSOIRING 8 b. OFFICE SYMBOL 9. PROCUREMENT INSTRUMENT IDVWICATJj BERORGANIZATION (if applikable) it5 U
SL. ADDRESS (City, State, and ZIP Code) 10. SOURCE OF FUNDING NUMBERSPROGRAM PROJECT TASK WORK UNITELEMENT NO NO. NO ACCESSION NO.
I62202F 6302 102 D211. TITLE (Include Security Classification)
Physiologicaily Based Pharmacoinetic Modeling of the Lactating Pat and Nursing Pup% A MultirouteExposure Model for Trichloroethylene, and Its Metabolite, Trlchloroacetic Acid.
12. PERSONAL AUTHOR(S)J.W. Fisher, T.A. Whittaker, D.H. Taylor, H.J. Clewell Ill, and M.E. Andersen
13s. TYPE OF REPORT 13b. TIME COVERED 14. DATE OF REPORT (Year,Mnh ay 15PAGE COUNTFinl I FROM.____ TO March 1990 17
16. SUPPLEMENTARY NOTATION
Toxicology and Applied Pharmacology 102, 497-513 (1990)17. COSATI CODES )-,,UBJECT TERM1 IC xWB~ZVfLe NJIIfIIV8n atnth~W-fU
FIELD GROUP ISUB-GROUP Tdhloroethylene, Trlchloroacetic Acid, Lactation,06 11 1f PB-PK Modeling, Inhalation, Drinking Water Rat 4.
'6 03 1 xABSTRACT (Continue on reverse if necessary and identify, by block num~ber)
A physiologically based pharniacolcinetic (PB-PK) model was developed to describe trichloroethylene(TCE) kinetics in the lactating rat and nursing pup. The lactating dam was exposed to TCE either byinhalation or by ingestion in dining water. T'he nursing pup's exposure to TCE was by ingestion ofmaternal milk containing TCE. The kinetics of trichloroacetic acid (TCA), a metabolite of TCE, weredescribed in the lactating dam and developing pup by a hybrid one-compartment model. The lactatingdam's exposure to TCA was from metabolism of TCE to TCA. The pup's exposure to TCA was frommetabolism of TCE ingested in suckled milk and from direct Ingestion of TCA in maternal milkc. Forthe PB-PK model, partition coefficients (PCs) were determined by vial equilibration, and metaboliccostants for TICE oxidation, by gas uptake methods. i7the blood/air and the fat/blood PCs for the damwere 13.1 and 34.2, and for the pup, 10.6 ad 42.3, resectively. The milk/blood PC for the dam was7.1. In lactating rats and rat pups (19-21 days old) the maximum velocities of oxidative metabolismwere 9.2 * 0.073 anid 12.94 * 0.107 mg/klg/hr. T!he plasma elimiation rate constant (K = 0.063*0.004 1W) and apparent volume of distribution (Vd = 0.568 liter/kg) for TCA in the lactating dam
20. DISTRIBUTION /AVAILABILITY OF ABSTRACT 21. ABSTRACT SECURITY CLASSIFICATIONGO UNCLASSIFIED/UNLIMITED C3 SAME AS RPT. 03 DTIC USERS UNCLASSIFIED
22a. NAME OF RESPONSIBLE INDIVIDUAL 22b. TELEPHONE (Imclde Area C*) 22c. OFFICE SYMBOLJeff W .Fjihe
DD Form 1473, JUN 86 Previous editons are obsolete SECURITY CLASSIFICATION OF THIS PAGE

Item 19 (Continued)
were estimated from both intravenous dosing studies and an inhalation study with TCE. For the pup,K (0.014 W hr 1 ) and Vd (0.511 Uter/kg) were estimated from a single 4-hr inhalation exposure with TCE.The dme-rate-dependent stoichlometric yield of TCA from oxidative metabolism of TCE in the lactatingrat is 0.17 for a low-concentration inhalation exposure (27 ppm TCR) and 0.27 for an exposure abovemetabolic saturation (about 600 ppm TCE). For the pui, the stoichiometric yield of TCA is 0.12. Withchanging physiological values durng lactation for compartmental volumes, blood flows, and milk yielftobtained from the published literature and kinetic parameters and PCs determined by experimentation, aPB-PK model was constructed to predict maternal and pup concentrations of TCE and TCA. To test theruielity of the PB-PK lactation model, a multiday inhalation exposure study was conducted from Days3 to 14 of lactation and a drinking water study, from Days 3 to 21 of lactation. The inhalation exposre was4 hr/day, 5 days/week, at 610 ppm. The TCE concentration in the drinking water was 333 ug/mLPrediction compared favorably with limited data obtained at restricted time points during the period oflactatioL
i DIIC i;. 0
ByDaStrib'JtiOn I
tAvaulj.]!oDist A $: ,.di Or
q~L * Lk.I

.1
AALRL-TR-90-u36
TOXICOLOGY AND APPLIED PHARMACOLOGY 102,497-513 (1990)
Physiologically Based Pharmacokinetic Modeling of the Lactating Rat andNursing Pup: A Multiroute Exposure Model for Trichloroethylene
and Its Metabolite, Thchloroacetic Acid
JEFFREY W. FISHER, TEMISTOCLES A. WHITTAKER, DOUGLAS H. TAYLOR,*HARVEY J. CLEWELL III, AND MELVIN E. ANDERSENt
Hazard Assessment Branch, Toxic Hazards Division, Harry G. Armstrong Aerospace Medical Research Laboratory,Wright-Patterson Air Force Base, Ohio 45433-65 73; *Miami University, Oxford, Ohio 45406; and tChemical
Industry Institute of Toxicology, 6 Davis Drive, Research Triangle Park, North Carolina 27709
Received June 21, 1989; accepted November 2, 1989
Physiologically Based Pharmacokinetic Modeling of the Lactating Rat and Nursing Pup: AMultiroute Exposure Model for Trichloroethylene and Its Metabolite, Trichloroacetic Acid.FISHER, J. W., WHITTAKER, T. A., TAYLOR, D. H., CLEWELL, H. J., Ill, AND ANDERSEN, M. E.(1990). Toxicol. Appl. Pharmacol. 102,497-513. A physiologically based pharmacokinetic (PB-PK) model was developed to describe trichloroethylene (TCE) kinetics in the lactating rat andnursing pup. The lactating dam was exposed to TCE either by inhalation or by ingestion indrinking water. The nursing pup's exposure to TCE was by ingestion of maternal milk contain-ing TCE. The kinetics of trichloroacetic acid (TCA), a metabolite of TCE, were described in thelactating dam and developing pup by a hybrid one-compartment model. The lactating dam'sexposure to TCA was from metabolism of TCE to TCA. The pup's exposure to TCA was frommetabolism ofTCE ingested in suckled milk and from direct ingestion of TCA in maternal milk.For the PB-PK model, partition coefficients (PCs) were determined by vial equilibration, andmetabolic constants for TCE oxidation, by gas uptake methods. The blood/air and the fat/bloodPCs for the dam were 13.1 and 34.2, and for the pup, 10.6 and 42.3, respectively. The milk/blood PC for the dam was 7.1. In lactating rats and rat pups (19-21 days old) the maximumvelocities of oxidative metabolism were 9.26 ± 0.073 and 12.94 ± 0.107 mg/kg/hr. The plasmaelimination rate constant (K = 0.063 ± 0.004 hr- ') and apparent volume of distribution (V= 0.568 liter/kg) for TCA in the lactating dam were estimated from both intravenous dosingstudies and an inhalation study with TCE. For the pup, K (0.014 ± hr - ') and V (0.511 liter/kg) were estimated from a single 4-hr inhalation exposure with TCE. The dose-rate-dependentstoichiometric yield of TCA from oxidative metabolism of TCE in the lactating rat is 0.17 for alow-concentration inhalation exposure (27 ppm TCE) and 0.27 for an exposure above metabolicsaturation (about 600 ppm TCE). For the pup, the stoichiometric yield of TCA is 0. 12. Withchanging physiological values during lactation for compartmental volumes, blood flows, andmilk yields obtained from the published literature and kinetic parameters and PCs determinedby experimentation, a PB-PK model was constructed to predict maternal and pup concentra-tions of TCE and TCA. To test the fidelity of the PB-PK lactation model, a multiday inhalationexposure study was conducted from Days 3 to 14 of lactation and a drinking water study, fromDays 3 to 21 of lactation. The inhalation exposure was 4 hr/day, 5 days/week, at 610 ppm. TheTCE concentration in the drinking water was 333 ,sg/ml. Prediction compared favorably withlimited data obtained at restricted time points during the period of lactation. © 199 AcademicPres. Inc.
Trichloroethylene (TCE), a common envi- posure have been noted in laboratory studiesronmental contaminant, has been listed by with animals and in occupational or solventthe U.S. EPA (1987) as a possible human car- abuse exposures with humans (U.S. EPA,cinogen. In addition to cancer, other impor- 1985). Recently, Taylor et aL. (1985) and No-tant biological effects resulting from TCE ex- land-Gerbec et aL. (1986) reported behavioral
9 l9fil~lS 3.00Yy Academic Prew Inc.
rlh i gmdction in any fon reserve

L
498 FISHER ET AL.
and biochemical effects of TCE in neonatal pregnancy (Fisher et al., 1989) were used for repeated-
rats born to dams exposed to TCE via drink- exposure studies during lactation. Female cesarean-de-rived Fischer-344 rats, obtained from Charles Rivering water during pregnancy and lactation. Breeding Laboratory, Kingston, New York, were used in
The exposure of the neonates to TCE or TCE single-exposure studies for kinetic constant determina-metabolites occurred both during pregnancy tions. All rats were kept in separate cages and allowed
in utero and in the postpartum period by in- access to commercial rat chow (Purina Rat Chow) and
gestion of milk containing these chemicals. water ad libitum.These studies did not establish the fetal or TCE and TCA analyses. TCE (99.9%) and TCA (98%)
were obtained from Aldrich Chemical Company. Meth-neonatal dosimetry for TCE or its metabo- odology for preparation and analyses of TCE in bloodlites. In an attempt to predict fetal and neona- and TCA in plasma is reported in Fisher et al. (1989).tal dosimetry, two generic physiologically Milk samples obtained in this study were analyzed forbased pharmacokinetic (PB-PK) models TCE and TCA using the same assay procedures, except
were developed and applied to study TCE the milk samples were not centrifuged prior to analysis
and its persistent oxidative metabolite tri- for TCA. Lactating rats were anesthetized with a 0.6 mg/kg ip injection of ketamine (42 mg/kg) and xylazine (3.6
chloroacetic acid (TCA). One model was de- mg/kg) and given oxytocin (0.25 ml/kg; 1.0 ml equals 10veloped for the pregnant rat and developing USP units). Within 5 to 8 min, the rat was anesthetized
fetus (Fisher et at., 1989) and another for the and milk release occurred. The rat's teats were massaged
lactating dam and nursing pup. to express milk into 0. 1-ml capillary tubes.Quantitative methodology for estimating TCA kinetic constants by iv dosing. Four jugular-can-
Q t nulated lactating rats (Day 16 or 17 of lactation) were
infant exposure to chemicals as a result of injected in the femoral vein with 4.4 mg TCA/kg in sa-
maternal exposure to chemicals is not well line, and blood (0.1 ml)wascollected from the indwellingdeveloped. Recently Shelley et al. (1989) de- cannulas at 1, 3, 12, and 23 hr postexposure. The plasmascribed a physiologically based lactation elimination rate constant for TCA in the lactating rat was
model for estimating infant exposure to sol- calculated from log-linear regression of the TCA plasmaconcentration over time. Apparent volume of distribu-vents based on the ability of the chemical to tion for TCA was estimated by dividing the dose of TCA
partition into various tissue groups, including by the calculated initial concentration of TCA in the
the milk tissue. Wilson et al. (1980) described plasma.a classical three-compartment model for esti- Single inhalation exposure. A 4-hr inhalation exposure
mating infant exposure to drugs based on to 600.4 ppm TCE (time-weighted average, TWA) was
first-order clearance of the drug from the conducted with six jugular-cannulated adult lactatingrats (Day 12 of lactation). Blood (0.3 ml) was collected
body of the lactating mother. Rodents have from the cannulated rats for analyses of TCE and TCAbeen used as experimental animals for study- at 0.5 and 3.5 hr during exposure and at 0.25, 0.50, 1.0,ing lactational transfer of industrial chemi- and 2.0 hr postexposure. Additional blood samples (0.15
cals such as polychlorinated biphenyls ml) were collected at 5, 21, 29, and 45 hr postexposure
(PCBs) and polybrominated biphenyls (Dent for TCA analysis. Another 4-hr inhalation exposure to
et at., 1978; McCormack el aL, 1979; Spind- 27 ppm TCE (TWA) was conducted with five noncannu-lated lactating rats (Day 15 of lactation). The animals
ler-Vomachka and Vodicnik, 1984). No were killed immediately after exposure and blood was
compartmental or PB-PK models were found collected for TCE and TCA analyses.in the literature for the lactating rodent. Our Two 4-hr 600.0-ppm TCE (TWA) inhalation expo-PB-PK lactation model was developed to de- sures were conducted using 21 rat pups for one exposure
scribe the uptake, disposition, and elimina- and 30 rat pups (20 days of age in both studies) for theother exposure. For the first exposure, blood was coi-
tion of TCE, a well-metabolized, volatile in- lected by heart puncture at 0.5 hr during exposure and
dustrial chemical, and TCA, one of its non- 0.17,0.25,0.50, 1.0, and 2 hr postexposure for TCE anal-volatile metabolites, in both the lactating rat ysis. Three rat pups were killed at each of the first three
and the rat pup (Fig. 1). time periods and four rat pups at the other time periods.For the second exposure, rat pup blood was collected by
METHODS heart puncture at 0.25 hr during exposure and 0. 17, 1, 2,5, 21, 29, and 45 hr postexposure for TCA analysis.
Animals. Adult female cesarean-derived Fischer-344 Three rat pups were killed at each time period except attimed-pregnant rats previously exposed to TCE during 0.17 and 29 hr, at which four rat pups were killed. The

PHYSIOLOGICALLY BASED PHARMACOKINETIC MOL&LING IN LACTATION 499
ADULT PUP
ALVEOLAR ALVEOLARSPACE SPACE
LUNG LOOD LUNG BLOOD
FAT FATGROUP GROUP
SLOWLY SLOWLYPERFUSED PRUE
TCE GROUP GROUP
RICHLYRICHLYPERFUSEDPERFUSED
GROUP H GROUP
L TIVETRC TCA FORMATIONTCA FORMAFMAO
ELIMINATION
TISSUE _IIINATION
t IPA I SUKLN 'I .MILK GI TRACT
I ___
FG. I. A physiologically based pharmacokinetic lactation model was used to describe the disposition ofTCE in the lactating rat and nursing neonate. A compartmental model was used to describe the dispositionof TCA, an oxidative metabolite, in the lactating rat and nursing neonate. TCE enters the dam body byeither inhalation or oral ingestion of drinking water. Rat pups are exposed to TCE and TCA from ingestionof milk containing these chemicals. TCA is formed from metabolism in the liver in both the dam and pup.
inhalation chamber and the atmospheric analysis of TCE dam were killed at the same time as the dam and theirvapor in the chamber have been described (Fisher et al., blood was pooled for TCA analysis.1989). Repeated drinking water exposure. Fourteen lactating
Repeated inhalation exposure. Eleven lactating rats rats, previously maintained on drinking water containingpreviously exposed to 618 ppm of TCE during pregnancy 350 gg TCE/ml water during pregnancy (Fisher et al..(Fisher et al., 1989) were exposed to 610 ppm TCE 1989), were provided drinking water containing 333,0(TWA) for 4 hr/day, 5 days/week for 2 weeks (Days 3 to (SE 12.6) g TCE/ml water, 5 days/week, for 3 weeks.14 of lactation). Three dams were milked and blood was Five control lactating rats received distilled water. Watercollected for TCA analysis 20 hr after exposure on Day consumption of the treated animals increased during lac-I I of lactation. Blood was collected immediately after tation from 24 ml/day/rat for the first week to 37 ml/exposure from three adult rats on Day 12 of lactation and day/rat by the second week and 45 ml/day/rat on theblood and milk were collected immediately after expo- third week of lactation. Control animals showed a similarsure from five rats on Day 14 of lactation for TCE and trend. Decline in the water concentration of TCE in theTCA analyses. Pups (male and female) belonging to each drinking water bottles was monitored and the average

500 FISHER ET AL.
daily loss was described by a first-order process with a using the table function of the simulation software, Ad-rate constant of 0.039 hr'. Fresh TCE-water solutions vanced Continuous Simulation Language (ACSL)were prepared daily. On Days 13 (n = 5), 14 (n = 5), and (Mitchell and Gauthier Assoc., Inc., 1981). All tissues21 (n = 4) of lactation between 10:00 and 11:00 AM, rats were assumed to have unit density.were milked and blood was collected for TCA analysis. Maternal weight gain was measured and representedTCE was assayed in the milk and blood of the dams on in the lactation model as 12 and 16% increases in initialDay 13 of lactation. Pups (male and female) belonging to body weight (Day 3 of lactation) on Days 17 and 23 ofeach dam were killed at the same time as the dam and lactation. Individual pup weight gain was measured fromblood was collected for TCA analysis. Day 3 to Day 23 of lactation, and described as the expo-
Gas uptake. The gas uptake method (Gargas et al., nential function1986) was used to assess total in vivo metabolism of TCEin the lactating rat and in the pup. Experimental expo- BWP (kg) = 0.0045 * EXP[0.0036(t)], (I)
sures for kinetic constant determinations were con-ducted with four lactating adult rats per exposure (Days whr0 54hr(1dy)Mamytisegoh12 to 14 of lactation) and 24 rat pups per exposure (D9yt was based on the experimental findings of Knight et a.21 days old). Lactating rats were exposed to initial TCE (1984). Mammary tissue weight was 4.4, 5.6, 6.3, andconcentrations of 2200, r100, and 110 ppm and rat pups 9.6% of body weight on Days 3, 10, 17, and 23 of lacta-to initial TCE concentrations of 2100, 1250, and 100 tion, respectively. Blood flow to the mammary tissue wastom. initialEpe onmentra tions fof 2100,ductind 1e g 9.0, 10.0, 11.0, 14.0, and 15.0% of cardiac output onppm. Experimental conditions for conducting the gas Days 3, 8, 13, 18, and 23 of lactation, respectively (Han-uptake studies are reported in Fisher et at. ( 1989). well and Linzell. 1973). Depletion of fat tissue which ac-the maximum rate of metabolism (mg/hr) for a 1.0-kg cumulated during pregnancy was described as a linearanimal (allometrically scaled), was estimated by comput- process changing from 12.0% of body weight of Day 3 oferized nonlinear least-squares techniques (Simusolv, lactation to 6% on Day 23 of lactation (Naismith et al.,Dow Chemical Co.). The lactation model for Day 12 of 1982). The pup litter suckling rate was assumed to equallactation was used to obtain the statistical best-fit esti- the milk production rate. Milk production, based on ex-mates of V..,while the four-compartment model struc- perimental findings of Knight et al. (1984), was 0.0009,ture (Ramsey and Andersen, 1984) was used for fitting 0.0016, 0.0018, and 0.00 16 liters/hr on Days 3, 10, 17,V,. with the rat pups. Physiologic parameters for lacta- and 23 of lactation, respectively. The residual volume oftion are reported under Methods and reported in Table milk was assumed to equal 0.002 liter.I TCE kinetic constants are reported in Table 2. Appen- Cardiac output and alveolar ventilation in the lactatingdices Iland 11 contain lactation model nomenclature and rat were 14.0, 18.6, 19.0, and 21.0 liters/hr (allometri-mathematical equations. cally scaled for I-kg animal) on Days 3, 8, 13, and 23 of
Partition coefficients. TCE tissue/air partition coeffi- lactation, respectively (Hanwell and Linzell, 1973). Forcients were determined for blood and milk using Day 14 the rat pup, cardiac output and alveolar ventilation werelactating rats and for blood using rat pups 21 days of age. set to 18.0 and 22 liters/hr (allometrically scaled for I-kgThe vial-equilibration method (Sato and Nakajima, animal), respectively, based on the 4-hr rat pup inhala-1979; Gargas et al., 1989) was used to determine parti- tion exposure to TCE (see Results). Development of thetion coefficients. Tissue/air partition coefficients for mixed function oxidase system in the maturing pup wasother tissue groups were collected using homogenized tis- based on the developmental findings of MacLeod et al.sue from adult naive female Fischer 344 rats (Fisher et (1972) and our metabolic measurements (gas uptake)al., 1989). The tissue/air partition coefficient was divided taken with rat pups 19 to 21 days old. The pup's abilityby the blood/air partition coefficient to obtain the tissue/ to metabolize TCE on a per weight basis was set to 15,blood partition coefficient. Experimental conditions for 24, 94, and 129% that of the lactating dam on Days 3, 9,conducting the vial-equilibration studies are reported in 16, and 23 of lactation.Fisher et al. (1989). Physiologic constants for blood flow to the liver, fat,
TCA is a nonvolatile chemical whose partition coeffi- and slowly perfused tissue groups were given values ofcients cannot be determined by vial equilibration meth- 25, 9, and 15% of cardiac output, respectively, for bothods. TCA tissue/saline partition coefficients were deter- dam and pup. Blood flow to the richly perfused tissuemined for blood and mammary tissue using a centrifuga- ranged from 41 to 36% of cardiac output for the dam andtion technique (Jepson, 1986). The mammary tissue/ 5 1% for the pup. Volumes of the liver and of the slowlysaline partition coefficient was divided by the blood/sa- perfused and richly perfused tissue groups were 4, 62.6-line partition coefficient to estimate the mammary tis- 63.4, and 8% of body weight, respectively, in dams andsue/blood partition coefficient. 4, 76, and 5%, respectively, in pups. The pup fat coin-
Physiological parameters. Certain time-dependent partment was 6% of body weight. For the drinking waterphysiological changes that occur during lactation (Table exposure the lactating rats were assumed to drink the1) were incorporated into the description of the lactating TCE-water mixture over a 6-hr period (2400-0600 hr).rat and nursing pup. These physiological changes were Based on total daily consumption ofthe TCE-water mix-estimated by linear interpolation in the lactation model ture the lactating rats drank an average of 4.0, 6. 1, and

PHYSIOLOGICALLY BASED PHARMACOKINETIC MODELING IN LACTATION 501
TABLE I
PHYSIOLOGICAL CONSTANTS USED IN THE PB-PK MODEL FOR THE LACTATING RAT AND THE NURSING PUP
Lactating dam Pup
Body weight (kg)
Single inhalation 0.192 0.025Repeated inhalation 0.189-0.219' 0.0045-0.0276 b
Repeated drinking water 0.173-0.2010 0.0045-0.0276b
Percentage of body weight
Liver 4.0 4.0Richly perfused 8.0 5.0Slowly perfused 62.6-63.4 76.0Fat 12.0-6.0 6.0Mammary tissue 4.4-9.6
Milk 0.002 kg
Flows (liters/hr)
Alveolar ventilation 14.0-2 1.0* BW 0 74 22.0* BW 0 - 4
Cardiac output 14.0-2 1.0* BW °0 74 18.0 BW 0-74
Percentage of cardiac output
Liver 25.0 25.0Richly perfused 41.0-36.0 51.0Slowly perfused 15.0 15.0Fat 9.0 9.0Mammary tissue 9.0-15.0 w
Measured initial body weight on Day 3 of lactation and predicted body weight on Day 23 of lactation.b Predicted individual pup weight on Days 3 and 23 of lactation. Litter size equals 7.
7.5 ml/hr for a 6-hr period for the first, second, and third est initial concentrations of 100 and 110 ppmweeks of lactation, respectively, for dam and pup, respectively, chamber loss of
TCE was very rapid. Exposures at these con-RESULTS centrations were not included as part of the
analysis. Rapid loss of TCE at low concentra-Partition Coefficients tions in gas uptake chambers may be due to
eblood/air p ncoefficient w complete clearance of inhaled TCE (Gargas etThe l partition ca ., 1986). Values of Km below about 0.5 mg/
slightly higher for the lactating dam (13.1 liter had little effect on the simulations; thus,± 0.35) than for the male and female pups 19 K, was set to 0.25 mg/liter to be consistent withto 21 days of age (10.6 ± 0.79). As expected other gas uptake studies with TCE (Andersenfor a moderately lipophilic chemical (Table et al., 1987; Fisher et al., 1989). As in the preg-2), TCE readily partitioned into fat and milk, nant rat (Fisher et al., 1989) the small value forwhich is about 15% fat (Wilson et al., 1980). Km indicates that TCE metabolism is flow-lim-
ited for these rats at low TCE concentrationsRates of Metabolism (Andersen, 1981). The best-fit estimates for
Vm were 9.26 ± 0.073 mg/kglhr for the lactat-A best-fit estimate for Vm, was obtained by ing dam (Fig. 2A) and 12.94 ± 0.107 mg/kg/hr
varying Vn, with a constant Km. At the low- for the rat pup (Fig. 2B).

502 FISHER ET AL.
TABLE 2 Single 4-hr TCE Inhalation ExposuresKINETIC CONSTANTS FOR MODELING TRICHLORO-
ETHYLENE AND TRICHLOROACETIC ACID IN THE LAC- The PB-PK lactation model (Fig. 1) wasTATING RAT AND NURSING Pup used to predict the TCE blood time courses
in lactating rats on Days 12 and 15 of lacta-Lactating tion and in rat pups 20 days of age following
single 4-hr inhalation exposures to TCE. PB-
Partition coefficients PK modeling of the single inhalation expo-TCE sures for the dam (without pups) was accom-
Blood/air 13.10 10.60 plished by setting the pup litter suckling rateLiver/blood 1.67 2.06 during the exposure period to 0.0. A four-Rapidly perfused/blood 1.67 2.06Slowly perfused/blood 0.53 0.65 compartment PB-PK model (Ramsey andFat/blood 34.20 42.28 Andersen, 1984) was used for the descriptionMilk/blood 7.10 - of TCE kinetics in the pup. Day 12 dams
TCA (without pups) were exposed for 4 hr to 600.4ppm TCE and Day 15 dams (without pups)
Metabolic constants to 27 ppm TCE for4 hr. The predicted mater-TCE nal TCE blood concentration time course for
K (mg/liter) 0.25 0.25 the 600.4-ppm exposure was in close agree-
P0 (unitless) 0.17 or 0.27 0.12 ment with experimental observations (Fig.TCA 3A). For the 27-ppm exposure, the predicted
Vd (liters) 0.114' 0.013 d maternal blood concentration of TCE imme-K(hr-') 0.102' 0.042f diately after exposure was 0.20 jg TCE/mlPA (liters/hr) 0.0005 - blood and the observed concentration was
'Body weight fixed at 0.200 kg, V. (lactating rat) 0.13 ug TCE/ml blood. Rat pups (without= 9.26"BW 74 . dams) were exposed to 600.0 ppm TCE for 4
b Body weight fixed at 0.025 kg, V= (pup) hr. The four-compartment PB-PK model for= 12.94BW0 74 . the pup initially underestimated the rate of
'Body weight fixed at 0.200 kg, Vd (lactating rat) uptake of TCE into the pup's systemic circu-= 0.568"BW.
d Body weight fixed at 0.025 kg, Vd (pup) = 0.511 * BW. lation and overestimated the rate of clearanceBody weight fixed at 0.200 kg, K (lactating rat) from systemic circulation. The cardiac out-
= 0.063/BW0 3. put and alveolar ventilation rates for the pupfBody weight fixed at 0.025 kg, K (pup) = 0.014/ were adjusted from 14 liters/hr to 18 and 22
BW0 3" liters/hr, respectively, to fit simulation with
observation (Fig. 4A). The model then ade-quately predicted the uptake of TCE into sys-
Pharmacokinetics of Intravenously Adminis- temic circulation for the pup, while clearancetered TCA of TCE from systemic circulation was still
somewhat slower than predicted. These val-Elimination of TCA from the plasma of the ues for alveolar ventilation and cardiac out-
lactating rat after intraveneous administra- put were used for estimating the metaboliction of 4.4 mg TCA/kg in saline was ade- constant, Vmax, for the pup (Fig. 2B).quately described by a one-compartment In addition to validation and refinement ofmodel (data not shown). The calculated elim- the TCE kinetics, these 4-hr inhalation exper-ination rate constant (and 95% confidence in- iments provided estimates of the yield ofterval) for TCA in plasma was 0.086 (0.070, TCA from TCE metabolism and of the ki-0. 100) hr'. The apparent volume of distribu- netic characteristics of TCA formed duringtion in the lactating rat was estimated to be these inhalation exposures in both dam (Fig.0.541 (0.449, 0.699) liters/kg. 3B) and pup (Fig. 4B). TCE oxidation results
PHYSIOLOGICALLY BASED PHARMACOKINETIC MODELING IN LACTATION 503
lowOO 10000.
LACTATING RAT !RAT PUP
1100 !10-
00
I000
too o!ooU a
a10 . 0 40. 0
TIME (HOURS) TIME (HOURS)
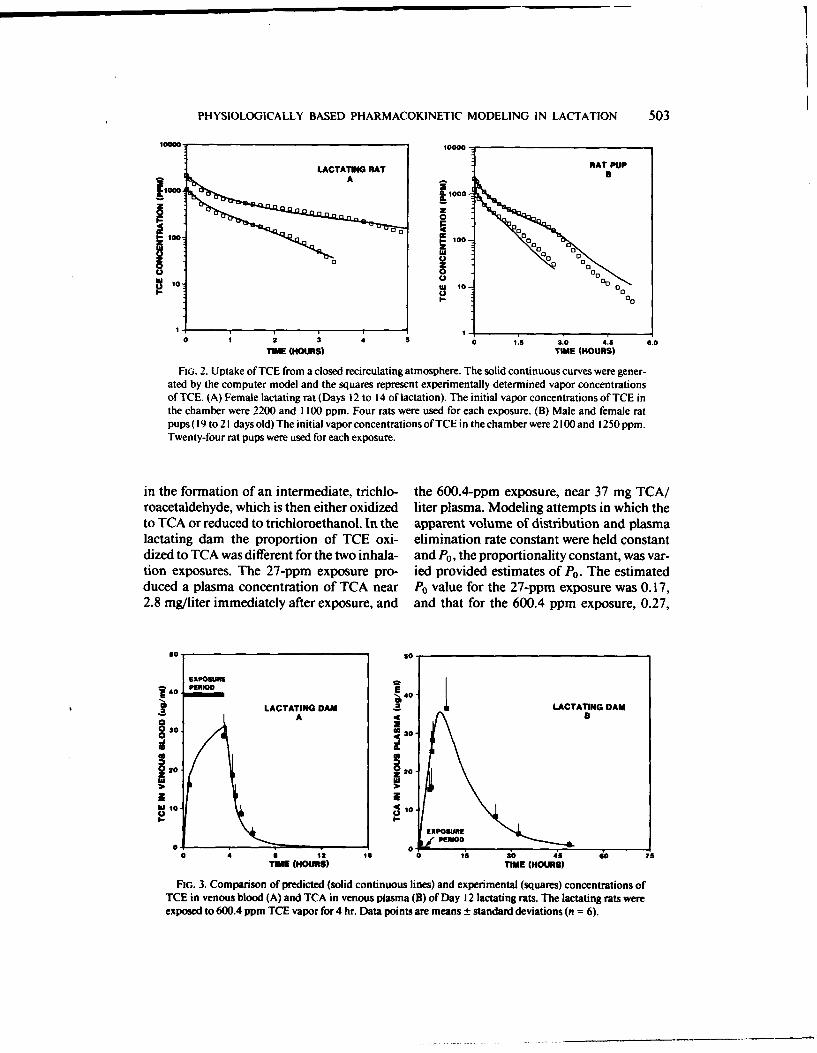
FIG. 2. Uptake of TCE from a closed recirculating atmosphere. The solid continuous curves were gener-ated by the computer model and the squares represent experimentally determined vapor concentrationsof TCE. (A) Female lactating rat (Days 12 to 14 of lactation). The initial vapor concentrations of TCE inthe chamber were 2200 and 1100 ppm. Four rats were used for each exposure. (B) Male and female ratpups( 19 to 21 days old) The initial vapor concentrations of TCE in the chamber were 2100 and 1250 ppm.Twenty-four rat pups were used for each exposure.
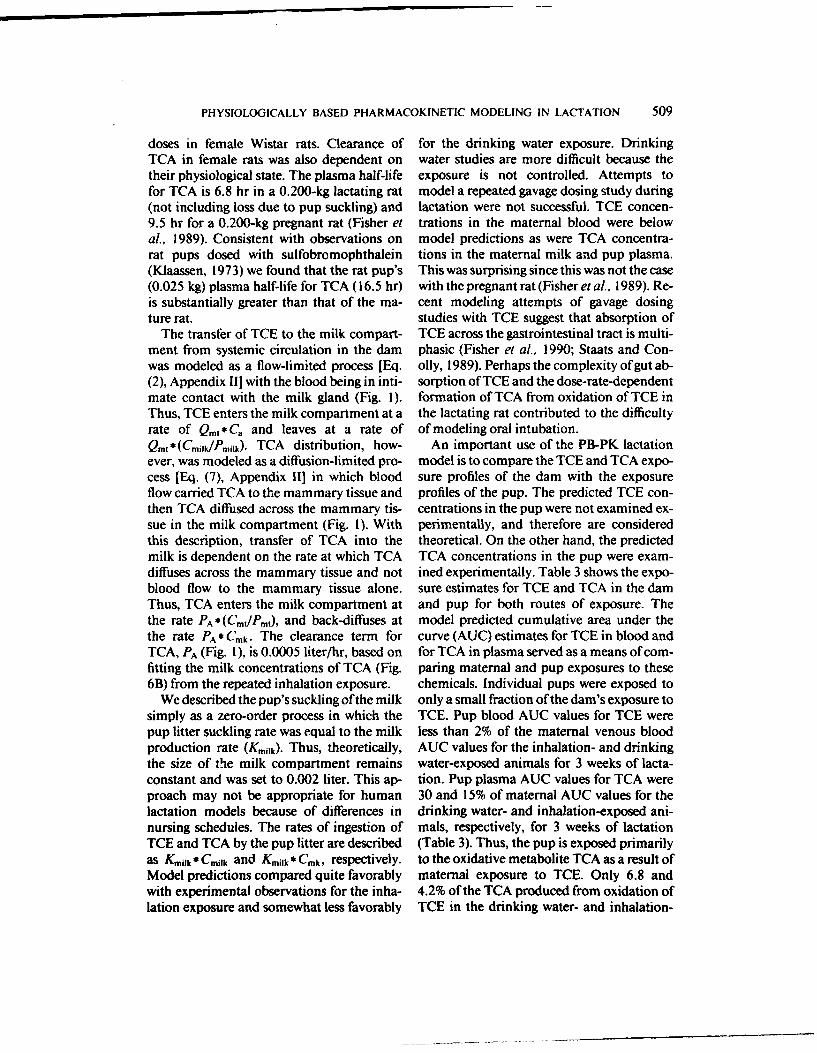
in the formation of an intermediate, trichlo- the 600.4-ppm exposure, near 37 mg TCA/roacetaldehyde, which is then either oxidized liter plasma. Modeling attempts in which theto TCA or reduced to trichioroethanol. In the apparent volume of distribution and plasmalactating dam the proportion of TCE oxi- elimination rate constant were held constantdized to TCA was different for the two inhala- and P0, the proportionality constant, was var-tion exposures. The 27-ppm exposure pro- ied provided estimates of Po. The estimatedduced a plasma concentration of TCA near Po value for the 27-ppm exposure was 0.17,2.8 mg/liter immediately after exposure, and and that for the 600.4 ppm exposure, 0.27,
so so-
EXPOSURE I40. PERIO
0 40 ILACTATING DAM LACTATING DAMI A8
-3S
20 920-
Z Z
PEIOE 0
0 ; 0 Is io4s So 75
TIME (HOMS) TIME (HOURS)
FIG. 3. Comparison of predicted (solid continuous lines) and experimental (squares) concentrations ofTCE in venous blood (A) and TCA in venous plasma (B) of Day 12 lactating rats. The lactating rats wereexposed to 600.4 ppm TCE vapor for 4 hr. Data points are means _ standard deviations (n = 6).

504 FISHER ET AL.
I0 RAT PUP 0 RAT PUP
A
UlU
0 (.0
a 1 0 a s $0 so 75
TE (HOURS) TIOE (HOURS)
FIG. 4. Comparison of predicted (solid continuous lines) and experimental (squares) concentrations ofTCE in blood (A) and TCA in plasma (B) of 20-day-old rat pups. Two groups (n = 21 and 30) of pups wereexposed to 600.0 ppm TCE vapor for 4 hr.
indicating a dose-rate dependence for the mation on the transfer of TCA from the ma-conversion of TCE to TCA. The plasma TCA ternal blood supply to the milk compart-elimination rate constant determined from ment. Consequently, the repeated inhalationthe intravenous dosing studies was optimized exposure with lactating dams served two im-after setting the value of Po to 0.27, and an portant purposes. It was used (1) to test theapparent volume of distribution to 0.568 li- fidelity of the repeated-exposure PB-PKter/kg. The apparent volume of distribution model for predicting both TCE concentra-determined from iv administration was in- tions in the dam (Figs. 5A and B) and TCAcreased slightly from 0.541 to 0.568 liter/kg concentrations in the dam (Figs. 6A and B)for the inhalation exposure. The estimated and pup (Fig. 6B), and (2) to estimate the bi-plasma elimination rate constant, based on directional transfer coefficient for TCA fromthe 600.4-ppm TCE exposure, was 0.063 the maternal blood to the milk (Figs. 6A+ 0.005 hr-'. and B).
Rat pups were not intravenously dosed Under flow-limited conditions, the TCAwith TCA; thus, the value of P0 and kinetic concentrations in the milk were overesti-constants for TCA were estimated from only mated. Thus a diffusion-limited process wasthe 600.0-ppm inhalation exposure. The ap- used to describe the TCA concentration timeparent volume of distribution for TCA in the course in the milk. The TCA transfer coeffi-pup was set equal to that for the naive female cient [PA, Eq. (7), Appendix II] was estimatedFischer 344 rat, 0.511 liter/kg (our unpub- by adjusting the value of PA until an adequatelished data), and modeling attempts allowed correspondence was obtained between pre-either P0 or the plasma elimination rate con- dicted and observed concentrations of TCAstant to vary. The proportion of TCE con- in the milk (Fig. 6B). The PA value, based onvetted to TCA was estimated to be 0.12 by the repeated inhalation exposure of 610 ppmvisual inspection. After setting Po to a value TCE, was 0.0005 liters/hr. The PB-PK lacta-of 0.12, the plasma elimination rate constant tion model with the transfer coefficient al-was optimized to 0.0 14 ± 0.002 hr- '. lowed prediction of the time courses for TCE
and TCA in the dam and pup for the drinkingRepeated TCE Inhalation Exposures water exposure regimen. All TCE and TCA
The single inhalation exposures with the time courses for the repeated inhalation ex-lactating dams did not provide kinetic infor- posure represent predictions of the PB-PK

PHYSIOLOGICALLY BASED PHARMACOKINETIC MODELING IN LACTATION 505
E50
m
04000 A
-- 0 DAY 12 OF DAY 14 OF
* 0LACTATION LACTATION
020Z
I-0
j20
LU
Z- 10EPSR PERIOD
=
0 4 8 1 8 1TIME (HOURS)250
Z 100- DA 'Y 14 OFLACTATION
U 5EXPOSURE PERIOD
4- 8 12TIME (HOURS)
FIG. 5. Comparison of predicted (solid continuous lines) and experimental (squares) concentrations ofTCE in venous blood (A) and milk (B) of lactating rats. Lactating rats were exposed to TCE vapor 4 hr/day, 5 days/week, for 2 weeks. In the upper fight-hand comer is a portion of the 2-week simulation (Days8-12 of lactation); the shaded area represents a tissue collection day. Three dams were milked and bloodcollected for TCA analysis 20 hr after exposure on Day I I of lactation. Blood was collected immediatelyafter exposure (n - 3) on Day 12 of lactation and blood and milk were collected immediately after exposure(n = 5) on Day 14 of lactation for TCE and TCA analyses.
lactation model except for the fitted maternal mation for TCE and TCA in the dam andmilk concentrations of TCA. pup during lactation but, rather, to develop
a generalized PB-PK model structure for theTrichloroethylene Exposure during Lactation lactating rat and nursing pup with limited in
vivo experimentation. Once the PB-PKThe experiments in this study were not de- model structure was in place, the fidelity of
signed to provide detailed time course infor- the PB-PK model could be tested by compar-

506 FISHER ET AL.
so 10.
A
40 S
S a30-
I 20 Z
10 "2,
1 EXPOSURE PERIODS EXPOSURE PERIODS
0 0 "fO I 12 13 14 16 10 11 12 13 14 16
LACTATION DAYS LACTATION DAYS
C
4-
E-a
a
,,J0. 2z4
EXPOSURE PERIODS
10 11 12 13 14 16
LACTATION DAYS
FIG. 6. Comparison of predicted (solid continuous lines) and experimental (squares) concentrations ofTCA in maternal venous plasma (A), milk (B), and pup plasma (C) as a result of maternal vapor exposureto TCE as described in Fig. 5.
ison of predicted concentrations of TCE and The maternal concentration of TCE inTCA in the dam and pup with a limited num- the blood and milk after exposure to TCEber of experimental observations at restricted by inhalation compared very favorablytime periods during lactation. This approach with prediction (Figs. 5A, B). Twenty-fourshould be more economical in its use of ani- hours after maternal exposure to TCE, TCEmals. Even though every attempt was made was not detected in pup blood. This obser-to limit the number of animals involved, sig- vation was consistent with model predic-nificant numbers of pups and several dams tion which was below the limits of detectionwere killed for analyses of TCE and TCA to for TCE (<0.03 ug TCE/ml blood). TCEascertain the PB-PK model's ability to pro- was not detected in maternal blood or milkvide a satisfactory correspondence between or pup blood for the drinking water-ex-predicted and observed concentrations of posed animals. Again, model prediction forTCE and TCA in dam and pup. TCE concentrations in these tissues were

PHYSIOLOGICALLY BASED PHARMACOKINETIC MODELING IN LACTATION 507
also below the limits of detection for the as- plasma and milk of the drinking water expo-say procedure. sures were 2.3 ug TCA/ml plasma and 1.5 ug
TCA/ml milk, and, in the inhalation expo-Trichloroacetic Acid Exposure during Lacta- sures, 33.0 ug TCA/ml plasma and 6.1 Ag
tion TCA/ml milk. Peak measured concentra-tions of TCA in pup plasma were 1.5 ug
The maternal TCA plasma concentrations, TCA/ml plasma for the drinking water expo-predicted on the basis of kinetic experiments sures and 4.8 ig TCA/ml plasma for the inha-with TCA, were in good agreement with ob- lation exposures.served values (Fig. 6A) immediately after ex-posure and within a factor of 2 at 20 hr afterexposure. The simulated TCA concentra- DISCUSSION
tions in the milk of dams exposed to TCE byinhalation (Fig. 6B) are fitted results obtained Determining an infant's exposure to chem-by adjusting the transfer coefficient (PA) and icals from ingestion of milk containing xeno-therefore do not represent model predictions. biotics is of considerable toxicological inter-The model slightly underpredicted the TCA est for ensuring the well-being of the neonate.concentrations in pup plasma, but model Breastfeeding of infants is again popularpredictions and observed values were consid- (Wilson et al., 1980) and there is an increas-ered to be in good agreement (Fig. 6C). For ing number of lactating women occupation-the drinking water study, model prediction ally exposed to chemicals in the workforce.was not quite as good. Maternal TCA plasma Wolff (1983) has reviewed the literature onconcentration predictions were consistently occupational exposure of lactating women tohigh, by a factor of about 2 (Fig. 7A). Pre- metals, solvents, and halogenated hydrocar-dicted TCA concentrations in milk were also bons. Perhaps the most studied class of com-slightly above observed TCA concentrations pounds in breast milk is drugs. Wilson et al.in two of three samplings (Fig. 7B). Predicted (1980) has reviewed the literature on thesepup plasma TCA concentrations were fairly compounds. Unintentional environmentalconsistent with observed values (Fig. 7C). exposure of lactating women to chemicals ap-The maternal yield of TCA from oxidation of pears substantial. Rogen et al. (1987) per-TCE was set to 0.17 for the drinking water formed an epidemiologic study on 853 chil-study because the dose rate of TCE was low dren exposed to PCBs from breast milk. Vol-and was similar to that for the 27-ppm inhala- atile organics are commonly found in thetion exposure study. The predicted venous milk of lactating women living in urban set-blood concentration of TCE in liver based on tings (Pellizzari et al., 1982). In West Ger-a 6-hr zero-order drinking rate was 0.15 and many, Niessen et al. (1984) found many chil-for the 27-ppm inhalation exposure 0.06 mg dren with residues of chlorinated hydrocar-TCE/liter blood. This compares to 30 mg bons and PCBs. In Japan, Tojo et al. (1986)TCE/liter blood for the 600.4-ppm inhala- found chlordane in many milk samples fromtion exposure. The computer-generated dot- nonoccupationally exposed women.ted lines in Figs. 7A, and B and C were gener- Several interesting experimental findingsated assuming that only 10% (Po = 0.10) of resulted from our studies designed primarilythe TCE is oxidized to the acid. This provided for development of the PB-PK model. For ex-better fits for the maternal plasma concentra- ample, metabolic capacities for oxidation oftions of TCA but difficulties are still encoun- TCE are dependent on the dam's physiologi-tered with the milk and pup plasma concen- cal state. The Vm,, value obtained for TCEtrations of TCA. in the lactating female rat (9.26 mg/kg/hr) is
For comparison purposes, peak measured similar to that in the pregnant rat [9.18 mg/concentrations of TCA in the maternal kg/hr (Fisher et al., 1989)]. Both of these Va.

508 FISHER ET AL.
10. 2.0LACTATING DAM B
A
E
( - 2 1.2
. -
Z 0.8
20.
ESPOSRE PEIOCSEXPOSURE PSERSOO0 a 0.0
11 13 15 1 20 22 11 13 15 1 20 22
LACTATION DAYS LACTATION DAYS
2.0
RAT PUP
C
E
1.2-IN
SU-
0.4-
EXPOSURE PERIOUJS
t1 13 1s :8 0 22LACTATION DAYS
FiG. 7. Comparison of predicted (solid and dashed lines) and experimental (squares) concentrations ofTCA in maternal venous plasma (A), milk (B), and pup plasma (C). PO, the proportion of TCE convertedto TCA, equals 0.17 for the solid lines and 0.10 for the dashed lines. Lactating rats were provided dailydrinking water containing an initial mean concentration of 333 jAg TCE/ml water, 5 days/week, for 3weeks. TCE-water consumption increased as lactation progressed. On Days 13 (n = 5), 14 (n = 5), and 21(n = 4) of lactation, maternal blood and milk and pup blood were collected for TCA analysis.
values are less than the Vmax value for TCE in tion of TCA from TCE oxidation is depen-the naive female 110.98 mg/kg/hr (Fisher et dent on the dose rate in the lactating rat. Pro-al., 1989)]. With young male and female rat portionally less TCA is produced at low expo-pups we found a relatively high Vma,, value for sure concentrations of TCE than at highTCE (12.94 mg/kg/hr). The 21-day-old rat exposure concentrations. Conversely, De-pup's ability to metabolize TCE is greater Kant et al. (1986) reported that 17% of a 2than that of the adult female and male [11.0 mg/kg single oral dose of TCE was convertedmg/kg/hr (Andersen et al., 1987)] Fischer to TCA, and a slightly lower yield of TCA344 rat. Another observation was that forma- (14%) was obtained with 20 and 200 mg/kg
PHYSIOLOGICALLY BASED PHARMACOKINETIC MODELING IN LACTATION 509
doses in female Wistar rats. Clearance of for the drinking water exposure. DrinkingTCA in female rats was also dependent on water studies are more difficult because thetheir physiological state. The plasma half-life exposure is not controlled. Attempts tofor TCA is 6.8 hr in a 0.200-kg lactating rat model a repeated gavage dosing study during(not including loss due to pup suckling) and lactation were not successful. TCE concen-9.5 hr for a 0.200-kg pregnant rat (Fisher et trations in the maternal blood were belowal., 1989). Consistent with observations on model predictions as were TCA concentra-rat pups dosed with sulfobromophthalein tions in the maternal milk and pup plasma.(Klaassen, 1973) we found that the rat pup's This was surprising since this was not the case(0.025 kg) plasma half-life for TCA (16.5 hr) with the pregnant rat (Fisher et al., 1989). Re-is substantially greater than that of the ma- cent modeling attempts of gavage dosingture rat. studies with TCE suggest that absorption of
The transfer of TCE to the milk compart- TCE across the gastrointestinal tract is multi-ment from systemic circulation in the dam phasic (Fisher et al., 1990; Staats and Con-was modeled as a flow-limited process [Eq. oily, 1989). Perhaps the complexity of gut ab-(2), Appendix II with the blood being in inti- sorption of TCE and the dose-rate-dependentmate contact with the milk gland (Fig. 1). formation of TCA from oxidation of TCE inThus, TCE enters the milk compartment at a the lactating rat contributed to the difficultyrate of Qmt * Ca and leaves at a rate of of modeling oral intubation.Qmt*(Cmick/Pijk). TCA distribution, how- An important use of the PB-PK lactationever, was modeled as a diffusion-limited pro- model is to compare the TCE and TCA expo-cess [Eq. (7), Appendix II] in which blood sure profiles of the dam with the exposureflow carried TCA to the mammary tissue and profiles of the pup. The predicted TCE con-then TCA diffused across the mammary tis- centrations in the pup were not examined ex-sue in the milk compartment (Fig. 1). With perimentally, and therefore are consideredthis description, transfer of TCA into the theoretical. On the other hand, the predictedmilk is dependent on the rate at which TCA TCA concentrations in the pup were exam-diffuses across the mammary tissue and not ined experimentally. Table 3 shows the expo-blood flow to the mammary tissue alone, sure estimates for TCE and TCA in the damThus, TCA enters the milk compartment at and pup for both routes of exposure. Thethe rate PA* (CmtPmt), and back-diffuses at model predicted cumulative area under thethe rate PA* Cmk. The clearance term for curve (AUC) estimates for TCE in blood andTCA, PA (Fig. 1), is 0.0005 liter/hr, based on for TCA in plasma served as a means of com-fitting the milk concentrations of TCA (Fig. paring maternal and pup exposures to these6B) from the repeated inhalation exposure. chemicals. Individual pups were exposed to
We described the pup's suckling of the milk only a small fraction of the dam's exposure tosimply as a zero-order process in which the TCE. Pup blood AUC values for TCE werepup litter suckling rate was equal to the milk less than 2% of the maternal venous bloodproduction rate (Kmnik). Thus, theoretically, AUC values for the inhalation- and drinkingthe size of the milk compartment remains water-exposed animals for 3 weeks of lacta-constant and was set to 0.002 liter. This ap- tion. Pup plasma AUC values for TCA wereproach may not be appropriate for human 30 and 15% of maternal AUC values for thelactation models because of differences in drinking water- and inhalation-exposed ani-nursing schedules. The rates of ingestion of mals, respectively, for 3 weeks of lactationTCE and TCA by the pup litter are described (Table 3). Thus, the pup is exposed primarilyas Kmilk* Cmilk and Kmik * Cmk, respectively, to the oxidative metabolite TCA as a result ofModel predictions compared quite favorably maternal exposure to TCE. Only 6.8 andwith experimental observations for the inha- 4.2% of the TCA produced from oxidation oflation exposure and somewhat less favorably TCE in the drinking water- and inhalation-

510 FISHER ET AL.
TABLE 3 the oxidative metabolite. These findings sug-
MODEL-DERIVED EXPOSURE ESTIMATES FOR TCE AND gest that TCE exposure during pregnancy isTCA DURING 3 WEEKS OF LACTATION of greater toxicologic concern than during
lactation.Route of exposure This study is an initial attempt at develop-
Drinking ing a generic PB-PK lactation model to de-water Inhalation scribe the lactational transport of a volatile,
lipophilic chemical and its persistent hydro-Dam philic metabolite. This PB-PK lactation
TCE metabolized (mg) 66.7 305.5 model, with its limited experimental observa-TCE exhaled (mg) 2.6 752.5TCE in maternal blood, tions, did predict TCA concentrations in
AUC (mg/hr/liter) 6.5 1,735.3 pups within about a factor of 2, which is con-TCE in milk, AUC 42.2 12,623.7 sidered very good. The PB-PK lactationTCA in plasma, AUC 1946.6 8,798.5 model developed in this study has, perhaps,TCA in milk, AUC 487.6 2,175.6 more important applications with chemicals
Pupa that are nonvolatile, lipophilic, and persistentTCE ingested by each in the environment, such as polychlorinated
pup (mg) 0.010 1.500 biphenyls.TCE metabolized by
each pup (mg) 0.006 0.465TCE exhaled by each APPENDIX I: LACTATION MODEL
pup (mg) 0.004 1.035 NOMENCLATURETCE in pup venous
blood, AUC 0.092 29.092TCA ingested to each TCE and TCA
pup (mg) 0.110 0.499TCA in pup plasma, C, Arterial blood concentration (mg/li-
AUC 584.8 1,316.14 ter)a These exposure estimates are based on a litter size Cv, Venous blood concentration leaving
equal to 7. ith tissue (mg/liter)C Concentration in ith tissue (mg/liter)
exposed dams, respectively, were eliminated Pi Tissue i/blood partition coefficient (li-
by lactational transfer. The calculated contri- ters blood/liters tissue)
bution of TCA exposure from metabolism of Qi Blood flow to ith tissue (liters/hr)TCE in the pup is small, 0.7% for the drinking Vi Volume of ith tissue (liters)
water-exposed rats and I 1% for the inhala- Vd Volume of distribution (liters)
tion-exposed rats. For the drinking water and K Elimination rate constant (per hr)
inhalation exposures the predominant tissue P0 Proportionality constant (unitless)
exposure for the dam and the pup was TCA PA TCA transfer coefficient (liters/hr)
(Table 3). The administered dose of TCE for SC Stoichiometric conversion factor (unit-
the inhalation exposure was about 15 times less)
greater than the drinking water exposure Al Amount in ith tissue (mg)
based on the simulated amounts of TCE ex- Kmilk Zero-order pup litter suckling rate (Ii-
haled and metabolized (Table 3) by the lactat- ters/hr) equals milk production rate
ing rats. During maternal exposure to TCEthe fetus is exposed to both the parent com- Subscripts ipound (TCE) and its oxidative metabolite(TCA), in utero (Fisher et al., 1989), and after 1 liverbirth, the exposure to pups is primarily from mt mammary tissue

PHYSIOLOGICALLY BASED PHARMACOKINETIC MODELING IN LACTATION 511
milk milk for TCE enzymatic conversion of TCE to the oxidizedpla maternal plasma TCA metabolite:mk milk for TCA Vmax*C
dAtcJdtc=P0* Vo m v*SC. (4)Km + C,
APPENDIX II The rate of change in the amount of TCAin the maternal plasma is described by the
TCE Equations production term for TCA [Eq. (4)], a first-or-der plasma elimination term, and a term de-The tissue mass balance equations for TCE scribing the blood flow and partitioning to
in the lactating dam and pup are formulated as the mammary tissue:
outlined in Ramsey and Andersen (1984). The
rate of change in the amount of TCE in the dApaldt = dAtcadt - Vd * K* Ctcamilk compartment of the lactating dam com- - Qmt(Ct. - CmJIP,). (5)prises two terms, one related to the maternalblood circulation and partitioning to the milk The concentration of TCA in the maternalcompartment, and the other, to pup suckling: plasma is
dAmilk/dt = Qmt(Ca - Cmilk/Pnilk) Ctca = Atca/Vd, (6)
- d4ASck/dt. (2) and A,c is the integral of Eq. (5).
The mammary tissue is omitted from this In the mammary tissue, TCA was consid-description; thus the maternal blood supply ered to be flow limited with respect to mater-
is considered to be in intimate contact with nal blood flow perfusing this tissue. Move-
the milk. The second term is identical to the ment of the TCA across the mammary tissuepup litter suckling rate and is used for esti- from the blood supply into the milk compart-mating each pup's exposure to TCE, ment was modeled as a diffusion-limited pro-
cess. The concentration of TCA available fordASUCkdt = Kmilk * Cmilk, (3) diffusion across the mammary tissue is the
where Kmilk is the zero-order pup litter suck- calculated venous blood concentration in theling rate. The concentration of TCE in the mammary tissue. PA, the transfer coefficientmilk (Cmilk) is the integration of Eq. (2) di- for TCA, is initially set to 0.0005 liter/hr andvided by the volume of milk (0.002 liter), increases in value proportionally with the
growth of the mammary tissue during 22days of lactation (9.6%). The equation for the
TCA Equations mammary tissue is
The kinetics of TCA in the dam are de- dAmddt = Qmt(Ctca - Cmt/Pmt)
scribed by a hybrid classical onc-compart- - PA(CmtlPmt - Cmk). (7)ment model (Fisher et al., 1989). The rates The milk compartment is described withof TCA production in the lactating rat and two terms. One term is related to the diffusiondeveloping pup are expressed as a proportion of TCA across the mammary tissue into the(Po) of the rate of TCE metabolism. The P0 milk and the other term is related to loss ofvalue is either 0.27 or 0.17 for the lactating TCA from the milk by suckling:rat, depending on the TCE exposure (see Re-suits), and 0.12 for the rat pup. A stoichio- dAmi./dt = PA(CmdPmt - Cmmetric conversion factor (SC) was used to ad- - dA/d. (8)just the molecular weight for TCA. This in-crease in molecular weight is the result of As with TCE, the second term is identical

512 FISHER ET AL.
to the pup litter suckling rate and is used for Ken Collier for typing the manuscript. Mr. Carlyle Flem-
estimating each pup's exposure to TCA: ming for the statistical support, and Ms. Ellen Goldey forexcellent support in conducting the repeated-exposure
dASU.k/dt = Cmk*Kmilk, (9) studies.
where Cmk is the concentration of TCA in the The animals used in this study were handled in accor-dance with the principles stated in the Guide for the Care
milk. Cmk is the integration of Eq. (8) divided and Use of Laboratory Animals, prepared by the Corn-by the volume of milk (0.002 liter). mittee on Care and Uses of Laboratory Animals of the
The rate of change in the amount of TCA Institute of Laboratory Animal Resources, National Re-in the pup plasma is described in a fashion search Council, DHHA, National Institute of Health
similar to that for the dam [Eq. (5)] except the Publication b6; 23, 1985, and the Animal Welfare Act of
mammary tissue flow term is not included. 1966, as amended.
Equation (9) is used to describe the ingestionof TCA. REFERENCES
Equations for the inhalation exposure are ANDERSEN, M. E. (1981). A physiologically based toxi-
reported in Ramsey and Andersen (1984) cokinetic description of the metabolism of inhaledand for the water drinking exposure in Fisher gases and vapors: Analysis at steady-state. Toxicol.et aL. (1989). For modeling the repeated inha- Appl. Pharmacol. 60,509-526.lation exposures, the suckling rate constant, ANDERSEN, M. E., GARGAS, M. L., CLEWELL. H. J., Ill,
Kmilk, is set to zero during the inhalation ex- AND SEVERYN, K. M. (1987). Quantitative evaluationof the metabolic interactions between trichloroethyl-
posures because the pups are separated from ene and 1,1 -dichloroethylene in vivo using gas uptake
the dams. Also, during the inhalation expo- methods. Toxicol. Appl. Pharmacol. 89, 149-157.sure the maternal milk compartment is as- DEKANT, W., SCHULZ, A., METZLER, M., AND HEN-sumed to increase in a linear fashion: SCHLER, D. (1986). Absorption, elimination and me-
tabolism oftrichloroethylene: A quantitative compari-Vmilk = 0.002 + Kmilk(t), (10) son between rats and mice. Xenobiotica 16, 143-152.
where 0 < t (time) > 4 hr. At the end of expo- DENT, 3. G., MCCORMICK, K. M., RICKERT, D. E., CA-
sure, the rate at which pups suckle milk is as- GEN, S. Z., MELROSE, P., AND GIBSON, J. E. (1978).Mixed function oxidase activities in lactating rats and
sumed to increase exponentially (t = 1 hr) their offspring following dietary exposure to poly-and the volume of milk decreases exponen- brominated biphenyls. Toxicol. Appl. Pharmacol. 46,tially (t = 1 hr) until the suckling rate con- 727-735.stant and volume of milk return to their pre- FISHER, J. W., WHITTAKER, T. A., HINGA, C. D., GAR-exposure values. GAS, M. L., AND ANDERSEN, M. E. (1990). Oral uptake
of trichloroethylene (TCE)-Vehicle effects. Toxicol.The lactating dams used for the repeated- Lett. (abstract), in press.
exposure studies were previously exposed to FISHER, J. W., WHITTAKER, T. A.. TAYLOR, D. H.,TCE during pregnancy (Fisher et al., 1989). CLEWELL, H. J., ill, AND ANDERSEN, M. E. (1989).Residual amounts of TCA in dams and pups Physiologically based pharmacokinetic modeling of
were estimated from the pregnancy and lacta- the pregnant rat: A multiroute exposure model for tri-tion models. On Day 3 of lactation, the begin- chloroethylene and its metabolite, trichloroacetic acid.
Toxicol. Appl. Pharmacol. 99, 395-414.
ning of the lactation exposure studies, the GARGAS, M. L., ANDERSEN, M. E., ANDCLEWELL, H. J..dam's body burden of TCA was estimated to Ill. (1986). A physiologically based simulation ap-be 0.35 mg from inhalation exposure to TCE proach for determining metabolic constants from gas
and 0.10 mg from drinking water exposure uptake data. Toxicol. Appl. Pharmacol. 86, 341-352.GARGAS, M. L., BURGESS, R. J., VOISARD, D. E., CA-to TCE during pregnancy. Each pup's body SON, G. H., AND ANDERSEN, M. E. (1989). Partition
burden of TCA was 0.0069 mg TCA for the coefficients of low-molecular-weight volatile chemi-
inhalation exposure and 0.0022 mg TCA for cals in various liquids and tissues. Toxicol. Appl. Phar-the drinking water exposure. macol. 98, 87-99.
HANWELL, A., AND LINZELL, J. L. (1973). The time
ACKNOWLEDGMENTS course of cardiovascular changes in lactation in the rat.J. Physiol. 223,93-109.
The authors thank Dr. Michael Gargas for the advice JEPSON, G. W. (1986). A kinetic Model for Acetylcholin-on partition coefficients and metabolic constants, Mr. esterase Inhibition by Diisopropylfluorophosphate in
PHYSIOLOGICALLY BASED PHARMACOKINETIC MODELING IN LACTATION 513
Crude Rat brain Homogenate. Master's thesis, Wright AND TULLY, M. (1987). Polychlorinated biphenylsState University, Dayton, Ohio. (PCBs) and dichlorodiphenyl dichloroethene (DDE)
KLAASSEN, C. D. (1973). Hepatic excretory function in in human milk: Effects on growth, morbidity and du-the newborn rat. J. Pharmacol. Exp. Ther. 184. 721- ration of lactation. Amer. J. Public Health 77, 1294-728. 1297.
KNIGHT, C. H., DOCHERTY, A. H., AND PEAKER, M. SATO, A., AND NAKAJIMA, T. (1979). Partition coefli-(1984). Milk yield in rat in relation to activity and size cients of some aromatic hydrocarbons and ketones inof the mammary secretory cell population. J Dairy water, blood, and oil. Brit. J. Ind. Med. 36, 231-234.Res. 51, 29-35. SHELLY, M. L., ANDERSEN, M. E., AND FISHER, J. W.
MACLEOD, S. M., RENTON, K. W., AND EADE, N. R. (1989). A risk assessment approach for nursing infants(1972). Development of hepatic microsomal drug oxi- exposed to volatile organics through the mother's oc-dizing enzymes in immature male and female rats. J. cupational inhalation exposure. Appl. Ind. Hyg. 4,21-Pharmacol. Exp. Ther. 183,489-498. 26.
MCCORMACK, K. M., MELROSE, P., RICKERT, D. E., SPINDLER-VOLMACHKA, M., AND VODICNIK, M. J.DENT, J. G., GIBSON, J. E., AND HOOK, J. B. (1979). (1984). Distribution of 2,4,5,2',4',5'-hexachlorobiphe-Concomitant dietary exposure to polychlorinated and nyl among lipoproteins during pregnancy and lacta-polybrominated biphenyls: Tissue distribution and ar- tion in the rat. J. Pharmacol. Exp. Ther. 230,263-268.ylhydrocarbon hydroxylase activity in lactating rats. STAATS, D. A., AND CONOLLY, R. B. (1989). Gastroin-Toxicol. ,4ppl. Pharmacol. 47, 95-104. testinal absorption of xenobiotics in physiologically-
Mitchell and Gauthier Assoc., Inc. (1981). Advanced based pharmacokinetic models: A two compartmentContinuous Simulation Language (ACSL), 3rd ed. description. Toxicologist 9, 238.Mitchell and Gauthier, Concord, MA. TAYLOR, D. H., LAGORY, K. E., ZACCARO, D. J..
NAISMITH, D. J., RICHARDSON, D. P., AND PRITCHARD, PFOHL, R. J., AND LAURIE, R. D. (1985). Effect of tri-
A. E. (1982). The utilization of protein and energy dur- chloroethylene on the exploration and locomotor ac-
ing lactation in the rat, with particular regard to the tivity of rats exposed during development. Sci. Tot.
use of fat accumulated in pregnancy. J. Nutr. 48, 433- Environ. 47,415-420.
441. Too, Y., WARIISHI, M., SUZUKI, Y., AND NISHIYAMA,
NiESSEN, K. H., RAMOLLA, J. J., BINDER, M., BRUG- K. (1986). Quantitation of chlordane residues in
MANN. G., AND HOFMANN, U. (1984). Chlorinated mother's milk. Arch. Environ. Contain. Toxicol. 15,
hydrocarbons in adipose tissue of infantsand toddlers: U327-332.
Inventory and studies on their association with intake .S. Environmental Protection Agency (U.S. EPA)
of mother's milk. Environ. J. Pediatr. 142,238243. (1985). Health Assessment Document for Trichloroeth-
NOLAND-GERBEc. E. A., PFOHL, R. J., TAYLOR, D.. ylene Final Report E-600/8-82-006B. Office of HealthNAND-RBU ,E.L, R. J. , (1986). D.H.,e uptake inthe and Environmental Assessment, Washington, DC.AND BULL, R. J. (1986). 2-Deoxyglucose uptake in the U.S. Environmental Protection Agency (U.S. EPA)developingrat brain upon pre-and postnatal exposure (1987). Addendum to the Health Assessment Docu-to trichloroethylene. Neurotoxicohogy' 7, I157-164. ment for Trichloroethylene: Updated Carcinogenicity
PELLIZZARI, E. D., HARTWELL, T. D., HARRIS, B. S. H., Assessment for Trichloroethylene. Draft: EPA 1600/8-III, WADDELL, R. D., WHITAKER, D. A., AND ERICK- 22/006FA. Office of Health and Environmental As-SON, M. D. (1982). Purgeable organic compounds in sessment, Washington, DC.mother's milk. Bull. Environm. Contam. Toxicol. 28, WILSON, J. T.. BROWN, D. R., CHEREK, D. R., DAILEY,322-328. J. W., HILMAN, B., JOBE, P. C., MANNO, B. R.,
RAMSEY, J. C., AND ANDERSEN, M. E. (1984). A physio- MANNO, J. E., REDETZKI, H. M., AND STEWART, J. J.logically based description of the inhalation pharma- (1980). Drug excretion in human breast milk. Princi-cokinetics of styrene in rats and humans. Toxicol. pies, pharmacokinetics and projected consequences.Appl. Pharmacol. 73, 159-175. Clin. Pharmacokinet. 5, 1-66.
ROGEN, W. J., GLADEN, B. C., MCKINNEY, J. D., CAR- WOLFF, M. S. (1983). Occupationally derived chemicalsRERAS, N., HARDY, P., THULLEN, J., TINGELSTAD, J., in breast milk. Amer. J. Ind. Health 4,259-281.
Reprinted from Toxicology and Applied Pharmacology 102, 497-513 (1990)Copyright C 1990 Academic Press, Inc. Printed in U.S.A.