utah housing corporation 2006 housing credit conference james wood bureau of economic and business...
TRANSCRIPT

UTAH HOUSING CORPORATION
2006 HOUSING CREDIT CONFERENCE
JAMES WOOD
BUREAU OF ECONOMIC AND BUSINESS RESEARCH
DAVID ECCLES SCHOOL OF BUSINESS
UNIVERSITY OF UTAH
April 6, 2006

GOLDEN AGE FOR HOME BUILDING AND REAL ESTATE SALES
Record for single-family homes – 20,000 units; 17% above previous high.
New condo units double number of new apartments units Record for total residential units of 28,000 and value $4.6
billion. Sales of existing homes in Wasatch Front Counties hits all-
time record with 29,000 sales worth $6.0 billion versus 2004 of 24,200 and $4.5 billion. Respective increases of 20% and 35%.
Four housing booms since 1970, current level is close to the 1977-1978 boom.

Sales of Existing Homes as Percent of Owner Occupied Inventory in Salt Lake CountyHistoric Avg. 5.3%
0.0%
1.0%
2.0%
3.0%
4.0%
5.0%
6.0%
7.0%
8.0%19
70
1972
1974
1976
1978
1980
1982
1984
1986
1988
1990
1992
1994
1996
1998
2000
2002
2004
Existing Homes Sales as % of Owner Occupied Inventory

New Residential Construction as Percent of Residential Inventory
0.0
1.0
2.0
3.0
4.0
5.0
6.0
1970
1973
1976
1979
1982
1985
1988
1991
1994
1997
2000
2003
Percent of Inventory

FAVORABLE MARKET CONDITIONS FOR HOME BUILDING
Interest Rates Overbuilding Historical Context Employment Net In-Migration Population Age Structure Housing Prices

EXISTING HOUSING PRICES IN UTAH
OFHEO
1980 to 2005 – rank 30th
2000 to 2005 – rank 41st
2005 – rank 18th
Last qtr – rank 16th WFRMLS - 2005
Davis $195,661 11.2%
Salt Lake $224,470 14.0%
Utah $217,159 14.1%
Weber $151,741 11.1%

HOUSING PRICE INDEX – Existing Homes (Source: Office of Federal Housing Enterprise Oversight)
0
50
100
150
200
250
300
350
400
1980
1982
1984
1986
1988
1990
1992
1994
1996
1998
2000
2002
2004
National Index Utah Index

Change in Sales Price of Existing Homes in Utah, Metro. Area and Salt Lake County
Data
Source
1980 1990 2000 2005 Average Annual Growth Rate for Period
1980-1990
1990-2000
2000-2005
1980-2005
Office of Federal Housing Oversight
(Statewide Index)
100.0 117.5 236.9 286.5 1.6% 7.3% 3.9% 4.3%
National Assoc. of Realtors
(Salt Lake MSA)
$65,800 $69,400 $141,500 $181,400 0.9% 7.4% 3.7% 5.1%
Wasatch Front Reg.
MLS
(Salt Lake County)
$67,949 $83,951 $176,479 $224,470 2.1% 7.7% 4.9% 4.9%

NEW HOME SOLD AND PERCENT SOLD FOR LESS THAN $150,000 – 2005(NewReach)
County New Homes Sold <$150K
Total Homes
Sold
% Sold
< $150K
Davis 253 1,967 12.9%
Salt Lake 250 4,098 6.1%
Tooele 152 304 50.0%
Utah 444 3,522 12.6%
Weber 64 662 9.7%
Total 1,163 10,553 11.0%

NEW CONDOMINIUMS SOLD AND PERCENT SOLD FOR LESS THAN $150,000 – 2005(NewReach)
County New Condos Sold < $150K
Total New Condos Sold
% Sold
<$150 K
Davis 220 287 76.6%
Salt Lake 542 1,444 37.9%
Tooele 83 83 100.0%
Utah 914 1,256 72.8%
Weber 209 248 84.3%
Total 1,968 3,318 59.3%

EXISTING HOMES SOLD FOR LESS THAN $160,000 – 2005(WFRMLS)
County Existing Homes Sold
<$160K
Total Homes Sold
% Sold
<$160K
Davis 1,773 4,397 40.3%
Salt Lake 5,473 15,317 35.7%
Tooele 777 1,082 71.8%
Utah 2,079 5,348 38.8%
Weber 2,641 3,777 69.9%
Total 12,743 29,921 42.5%

SALT LAKE METROPOLITAN AREA OPPORTUNITY INDEX(Source: National Home Builders Association)
Year Opportunity Index
(% Homes Sold Affordable to Family with Median Income)
Median Sales Price
of Home
National Rank – Most Affordable
1993 75.5% $100,000 81
1994 65.3% $116,000 126
1995 49.6% $129,000 164
1996 47.5% $143,000 176
1997 47.6% $151,000 184
1998 51.1% $155,000 171
1999 58.9% $147,000 148
2000 57.8% $149,000 129
2001 62.5% $155,000 134
2002 72.7% $159,000 116
2003 82.3% $153,000 27
2004 74.9% $173,000 51
2005 58.7% $210,000 59

WHAT ABOUT LOW INCOME RENTERS?
Rental subsidy programs provide assistance for about 37,000 households: LIHTC (17,000), HUD (16,000), RD (1,500), Public Housing (2,500).
Estimated 65,000 very low income (50% AMI) renter households with no assistance.
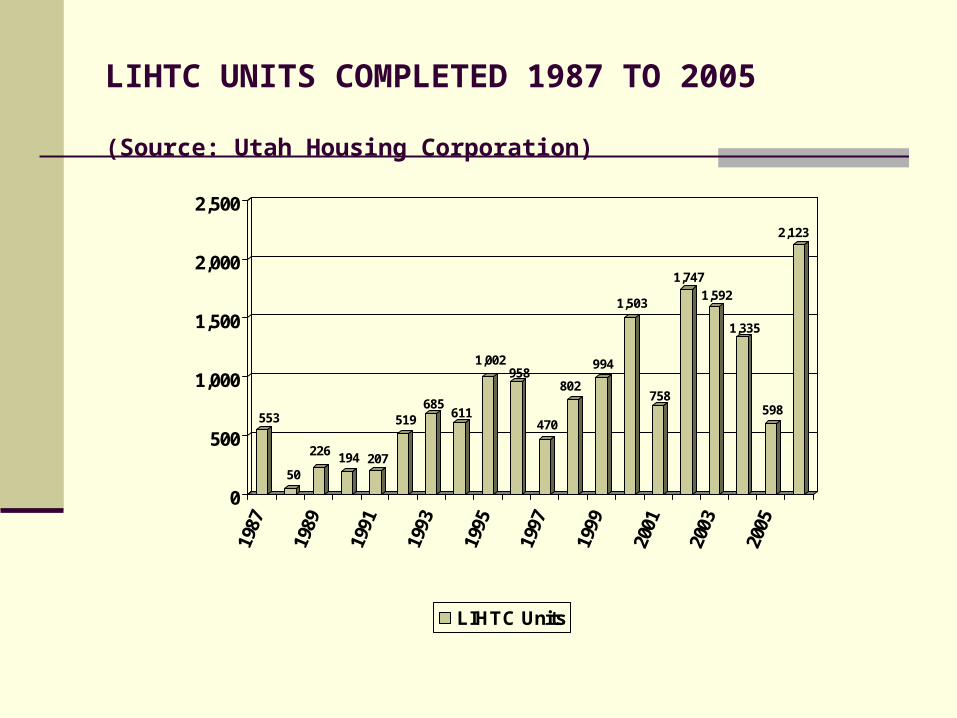
LIHTC UNITS COMPLETED 1987 TO 2005
(Source: Utah Housing Corporation)
553
50
226 194 207
519685
611
1,002958
470
802
994
1,503
758
1,747
1,592
1,335
598
2,123
0
500
1,000
1,500
2,000
2,500
1987
1989
1991
1993
1995
1997
1999
2001
2003
2005
LIHTC Units
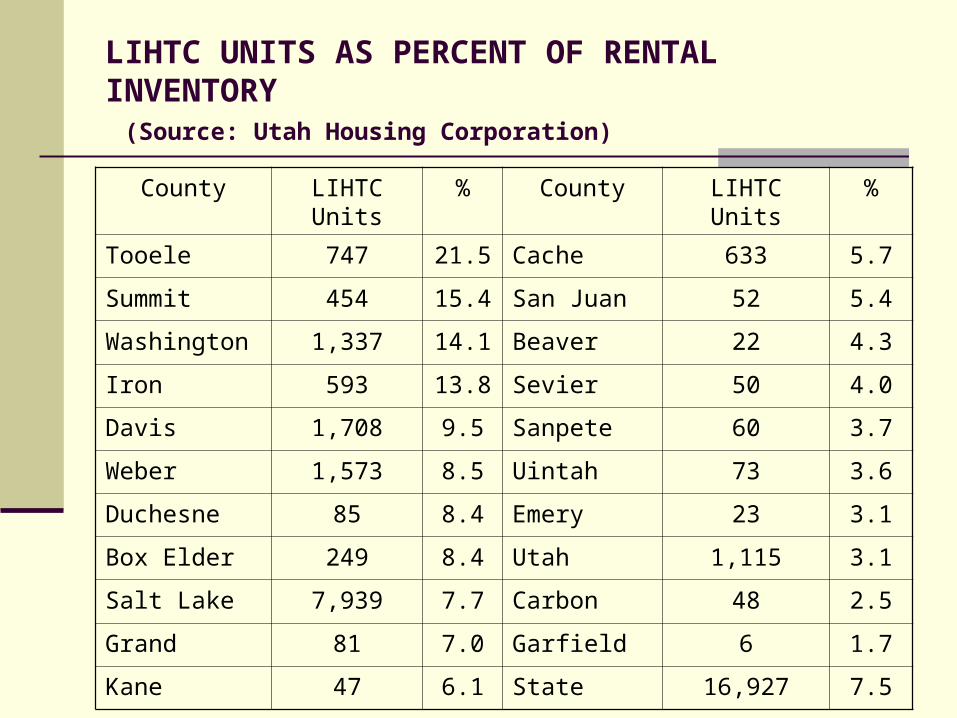
LIHTC UNITS AS PERCENT OF RENTAL INVENTORY (Source: Utah Housing Corporation)
County LIHTC Units % County LIHTC Units %
Tooele 747 21.5 Cache 633 5.7
Summit 454 15.4 San Juan 52 5.4
Washington 1,337 14.1 Beaver 22 4.3
Iron 593 13.8 Sevier 50 4.0
Davis 1,708 9.5 Sanpete 60 3.7
Weber 1,573 8.5 Uintah 73 3.6
Duchesne 85 8.4 Emery 23 3.1
Box Elder 249 8.4 Utah 1,115 3.1
Salt Lake 7,939 7.7 Carbon 48 2.5
Grand 81 7.0 Garfield 6 1.7
Kane 47 6.1 State 16,927 7.5

Comparison of Mortgage Payment to Rental RateMedian Price of Existing Home Salt Lake-Ogden Metro Area (NAR) and Average Monthly Rent for Two Bedroom Two Bath Unit in Salt Lake County (Equimark). Assumption 2006: Median Housing Price Increases 8% and Loan at 6.25% and 10% down payment.
Year Monthly Payment
(P&I, Tax & Ins.)
Average Mo. Rent
2 Bdrm 2 Bath
Rent as % of Mortgage Pmt.
1995 $853 $627 73.5%
1996 $908 $683 75.2%
1997 $929 $728 78.3%
1998 $908 $732 80.6%
1999 $982 $733 74.7%
2000 $1,074 $757 70.5%
2001 $1006 $775 77.0%
2002 $972 $772 79.5%
2003 $895 $746 83.3%
2004 $957 $762 79.6%
2005 $993 $766 77.1%
2006 (projected) $1,185 $914 77.1%

AFFORDABILITY ISSUES
Recession; Construction, Tourism. Material Costs Severely Cost Burdened Homeowners Wages and Household Income Immigration
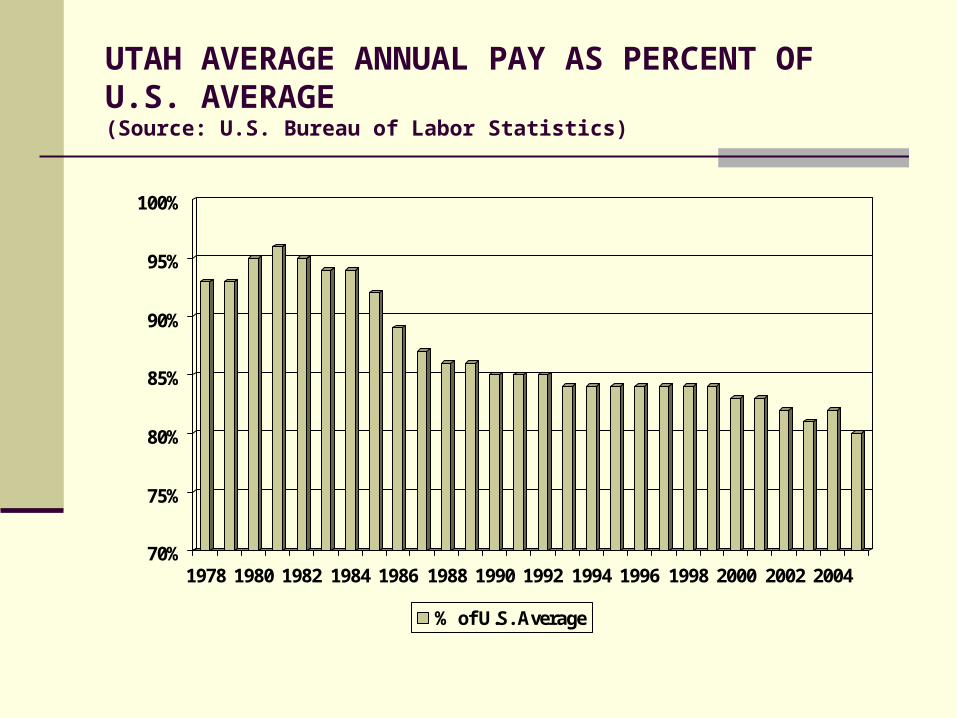
UTAH AVERAGE ANNUAL PAY AS PERCENT OF U.S. AVERAGE(Source: U.S. Bureau of Labor Statistics)
70%
75%
80%
85%
90%
95%
100%
1978 1980 1982 1984 1986 1988 1990 1992 1994 1996 1998 2000 2002 2004
% of U.S. Average

TOP SECTORS IN EMPLOYMENT GROWTH(Average Wage - $30,612)(Source: Utah Department of Workforce Services)
Sector New Jobs in 2005
Total Jobs Avg. Wage
2003
Construction 9,700 85,700 $30,528
Prof & Bus. 7,800 149,200 $34,668
Health 4,700 132,000 $28,224
Retail 3,100 142,600 $22,440
Leisure 2,100 103,200 $12,576

Median Income Comparisons for StatesUtah Median - $47,074 Ranks 17th U.S. Median - $44,684


IMMIGRATION AND DEMAND FOR AFFORDABLE RENTAL UNITS
Utah’s foreign born population is about 200,000; about 85,000 are estimated to be illegal.
Each year the foreign born population grows by about 10,000 people and 2,500 households.
PUMS shows that 57% rent or 1,425 households. 75% of these renter households are from Latin America
and Africa. Assuming that these households are very low income the
immigrant demand each year for affordable rental units is nearly 1,100 units.
If high levels of overcrowding then demand might drop to 500 units.