utah big game annual report 2019
TRANSCRIPT

UTAH BIG GAME ANNUAL REPORT
2019
Publication No. 20-23

UTAH BIG GAME ANNUAL REPORT
2019
Prepared by:
Heather H. Bernales Biometrician
Kent R. Hersey
Big Game Projects Coordinator
and
Covy Jones Big Game Program Coordinator
Publication Number 20-23
Annual Performance Report for Federal Aid Project W-65-M, segments 67 and 68
State of Utah
Department of Natural Resources DIVISION OF WILDLIFE RESOURCES
Michal D. Fowlks Director

TABLE OF CONTENTS
INTRODUCTION..........................................................................................................................1 METHODS .....................................................................................................................................1 MULE DEER Harvest ........................................................................................................................................4 Population trend data ................................................................................................................37 ELK Harvest ......................................................................................................................................69 Population trend data ..............................................................................................................107 PRONGHORN Harvest ....................................................................................................................................131 Population trend data ..............................................................................................................146 MOOSE Harvest ....................................................................................................................................162 Population trend data ..............................................................................................................172 BISON Harvest ..................................................................................................................................179 Population trend data ..............................................................................................................183 DESERT BIGHORN SHEEP Harvest ..................................................................................................................................186 Population trend data ..............................................................................................................192 ROCKY MOUNTAIN BIGHORN SHEEP Harvest ....................................................................................................................................197 Population trend data ..............................................................................................................202 MOUNTAIN GOAT Harvest ....................................................................................................................................207 Population trend data ..............................................................................................................214

INTRODUCTION This report is a summary of big game harvest information and monitoring efforts for eight species (mule deer, Rocky Mountain elk, pronghorn, Shiras moose, American bison, desert bighorn sheep, Rocky Mountain bighorn sheep, and mountain goat) in the state of Utah. Those species are managed based on species management plans that have been developed through a public review process and approved by Utah’s Wildlife Board. This report represents the big game portion of Federal Aid Project W-65-M, segments 67 and 68, grant agreement periods July 1, 2018 through June 30, 2019 and July 1, 2019 through June 30, 2020, respectively. This Federal Aid project covers the 2019–20 hunting seasons, big game surveys conducted in 2019 and 2020, and reports statewide trends for all big game species. METHODS Annual Harvest Surveys Limited-entry harvest for all big game species were determined by mandatory online/telephone reporting. Antlerless deer, elk, pronghorn, and moose harvest were determined by voluntary web/telephone reporting. General-season deer and elk harvest were determined through mixed mode web/telephone surveys of randomized, statistically valid samples of approximately 25% of total license holders. Based on results from the surveys and online reports, harvest data were projected by the total number of permits to obtain estimates of the number of animals harvested, number of hunters afield, and number of days hunted. To minimize error, harvest data for individual hunts, units, and statewide totals were projected separately. As such, the sum of hunt estimates and unit estimates may not always equal the statewide totals. Additionally, success rates are calculated from the raw data and may not always equal the projected harvest divided by the projected number of hunters afield. Harvest Sex and Age Composition For limited-entry units, the average age of harvested animals is obtained from counts of annual rings on teeth submitted by hunters. During general-season hunts, check stations are used to gather information on age and antler size. The sex composition of harvested animals is determined through questions on telephone and online surveys. Population Sex and Age Composition Population sex and age composition is determined through the use of ground and/or aerial classification counts. Ground classification is done using a random process during early morning and evening hours, whereas aerial trend counts occur when counting conditions are favorable and cover all appropriate fall, winter and/or spring use areas. Data collected during classification and trend counts are used to determine annual production and survival of young (doe: fawn, cow: calf ratios), as well as the ratio of bucks or bulls to females in the herds. For deer, annual ground classification counts are conducted immediately after the general-season harvest. For the
1

remaining species, a combination of ground classification counts and aerial trend counts are used to determine population sex and age composition. Population Modeling All of the data collected on harvest, survival, recruitment, and population structure are used in computer modeling applications for big game populations in Utah. Computer models are used to help determine the current status of the population (i.e., growing, declining, stable), the future structure of the population under various harvest scenarios, and the number of permits to be allocated. Big Game Movements and Seasonal Distribution Ground observations are used to determine movements and seasonal distribution of big game species. Trapping and marking projects are carried out periodically where needed to determine direction and extent of herd movements. That information is obtained simply by tagging and use of color markers, or by using radio or GPS collars to help track movements. Those data are used to design hunts to ensure proper harvest. Ground observations are also used to determine movements and seasonal distribution of big game species. Management Unit Boundaries Utah has thirty wildlife management units that serve as the basis for big game management recommendations. Boundaries vary slightly by species, so for exact boundary descriptions, refer to that species Unit Management Plan.
2

MULE DEER
3

Statewide trends of deer harvest statistics, Utah 1925–2019.
4

Statewide deer harvest statistics, Utah 1925–1975.
Year
Regular license harvest Control permit harvest Archery harvest Total harvest
Buck
Doe Total
Huntersafield
Buck Doe Total
Huntersafield
Buck Doe Total
Huntersafield
Buck Doe Total
Huntersafield
1925 1400 — 1400 5650 — — — — — — — — 1400 — 1400 5650
1926 2000 — 2000 7000 — — — — — — — — 2000 — 2000 7000
1927 3200 — 3200 9100 — — — — — — — — 3200 — 3200 9100
1928 4400 — 4400 11300 — — — — — — — — 4400 — 4400 11300
1929 5000 — 5000 12800 — — — — — — — — 5000 — 5000 12800
1930 6400 — 6400 15600 — — — — — — — — 6400 — 6400 15600
1931 7800 — 7800 19500 — — — — — — — — 7800 — 7800 19500
1932 7113 — 7113 16600 — — — — — — — — 7113 — 7113 16600
1933 8019 — 8019 17700 — — — — — — — — 8019 — 8019 17700
1934 11271 — 11271 21485 — 825 825 928 — — — — 11271 825 12096 22413
1935 9640 — 9640 23000 — 2008 2008 2598 — — — — 9640 2008 11648 25598
1936 13800 — 13800 29500 — — — — — — — — 13800 — 13800 29500
1937 21000 — 21000 38900 — — — — — — — — 21000 — 21000 38900
1938 25572 — 25572 50000 — 2428 2428 4500 — — — — 25572 2428 28000 54500
1939 28552 — 28552 60000 — 9448 9448 10612 — — — — 28552 9448 38000 70612
1940 32300 — 32300 60000 — 11700 11700 14437 — — — — 32300 11700 44000 74437
1941 34460 — 34460 60000 — 15540 15540 21461 — — — — 34460 15540 50000 81461
1942 35723 — 35723 65000 1058 26799 27857 33823 3 26 29 61 36784 26825 63609 98884
1943 39690 — 39690 75000 450 15556 16006 21242 0 12 12 186 40140 15568 55708 96428
1944 40743 — 40743 64672 — 11027 11027 16320 0 7 7 75 40743 11034 51777 81067
1945 37235 — 37235 71734 1730 10924 12654 16160 1 0 1 110 38966 10924 49890 88004
1946 41580 — 41580 89753 1685 10044 11729 16355 12 50 62 248 43277 10094 53371 106356
1947 46940 — 46940 88401 2608 12274 14882 17224 9 41 50 296 49557 12315 61872 105921
1948 53526 — 53526 95073 2222 13052 15274 18961 18 77 95 382 55766 13129 68895 114416
1949 45414 — 45414 86124 2513 12579 15092 19862 5 23 28 244 47932 12602 60534 106230
1950 49879 — 49879 93232 4496 19021 23517 28624 9 12 21 231 54384 19033 73417 122087
5
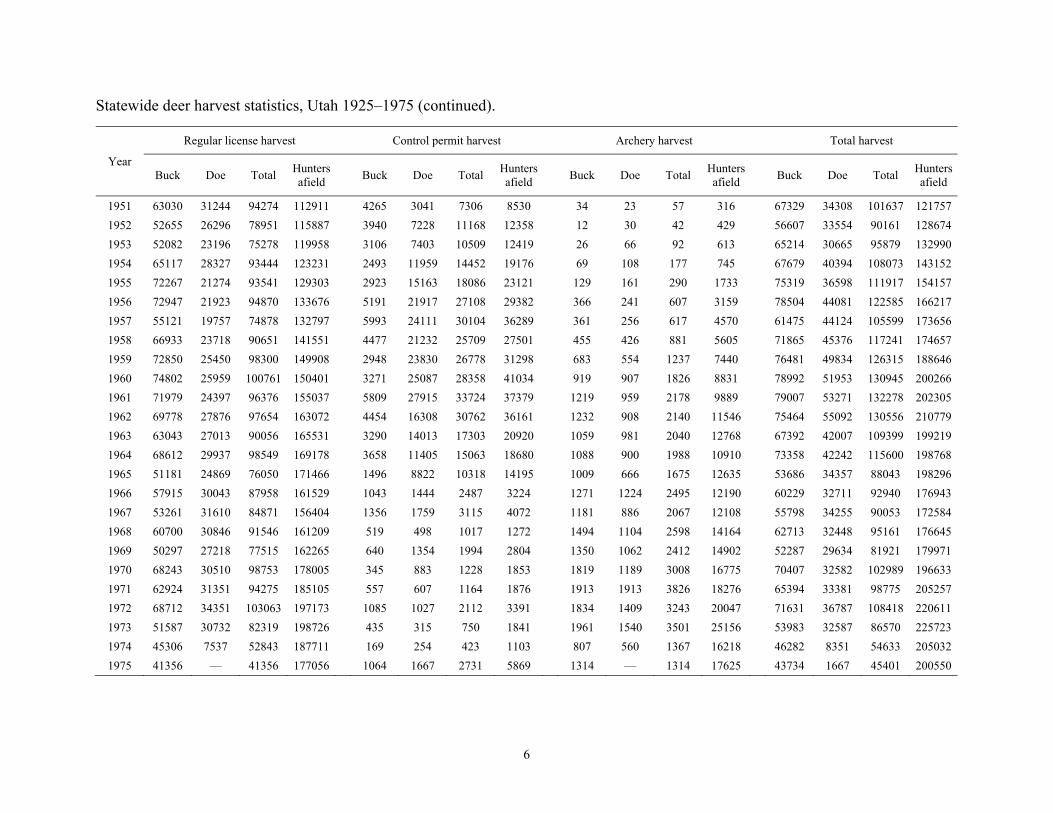
Statewide deer harvest statistics, Utah 1925–1975 (continued).
Year
Regular license harvest Control permit harvest Archery harvest Total harvest
Buck
Doe Total
Huntersafield
Buck Doe Total
Huntersafield
Buck Doe Total
Huntersafield
Buck Doe Total
Huntersafield
1951 63030 31244 94274 112911 4265 3041 7306 8530 34 23 57 316 67329 34308 101637 121757
1952 52655 26296 78951 115887 3940 7228 11168 12358 12 30 42 429 56607 33554 90161 128674
1953 52082 23196 75278 119958 3106 7403 10509 12419 26 66 92 613 65214 30665 95879 132990
1954 65117 28327 93444 123231 2493 11959 14452 19176 69 108 177 745 67679 40394 108073 143152
1955 72267 21274 93541 129303 2923 15163 18086 23121 129 161 290 1733 75319 36598 111917 154157
1956 72947 21923 94870 133676 5191 21917 27108 29382 366 241 607 3159 78504 44081 122585 166217
1957 55121 19757 74878 132797 5993 24111 30104 36289 361 256 617 4570 61475 44124 105599 173656
1958 66933 23718 90651 141551 4477 21232 25709 27501 455 426 881 5605 71865 45376 117241 174657
1959 72850 25450 98300 149908 2948 23830 26778 31298 683 554 1237 7440 76481 49834 126315 188646
1960 74802 25959 100761 150401 3271 25087 28358 41034 919 907 1826 8831 78992 51953 130945 200266
1961 71979 24397 96376 155037 5809 27915 33724 37379 1219 959 2178 9889 79007 53271 132278 202305
1962 69778 27876 97654 163072 4454 16308 30762 36161 1232 908 2140 11546 75464 55092 130556 210779
1963 63043 27013 90056 165531 3290 14013 17303 20920 1059 981 2040 12768 67392 42007 109399 199219
1964 68612 29937 98549 169178 3658 11405 15063 18680 1088 900 1988 10910 73358 42242 115600 198768
1965 51181 24869 76050 171466 1496 8822 10318 14195 1009 666 1675 12635 53686 34357 88043 198296
1966 57915 30043 87958 161529 1043 1444 2487 3224 1271 1224 2495 12190 60229 32711 92940 176943
1967 53261 31610 84871 156404 1356 1759 3115 4072 1181 886 2067 12108 55798 34255 90053 172584
1968 60700 30846 91546 161209 519 498 1017 1272 1494 1104 2598 14164 62713 32448 95161 176645
1969 50297 27218 77515 162265 640 1354 1994 2804 1350 1062 2412 14902 52287 29634 81921 179971
1970 68243 30510 98753 178005 345 883 1228 1853 1819 1189 3008 16775 70407 32582 102989 196633
1971 62924 31351 94275 185105 557 607 1164 1876 1913 1913 3826 18276 65394 33381 98775 205257
1972 68712 34351 103063 197173 1085 1027 2112 3391 1834 1409 3243 20047 71631 36787 108418 220611
1973 51587 30732 82319 198726 435 315 750 1841 1961 1540 3501 25156 53983 32587 86570 225723
1974 45306 7537 52843 187711 169 254 423 1103 807 560 1367 16218 46282 8351 54633 205032
1975 41356 — 41356 177056 1064 1667 2731 5869 1314 — 1314 17625 43734 1667 45401 200550
6
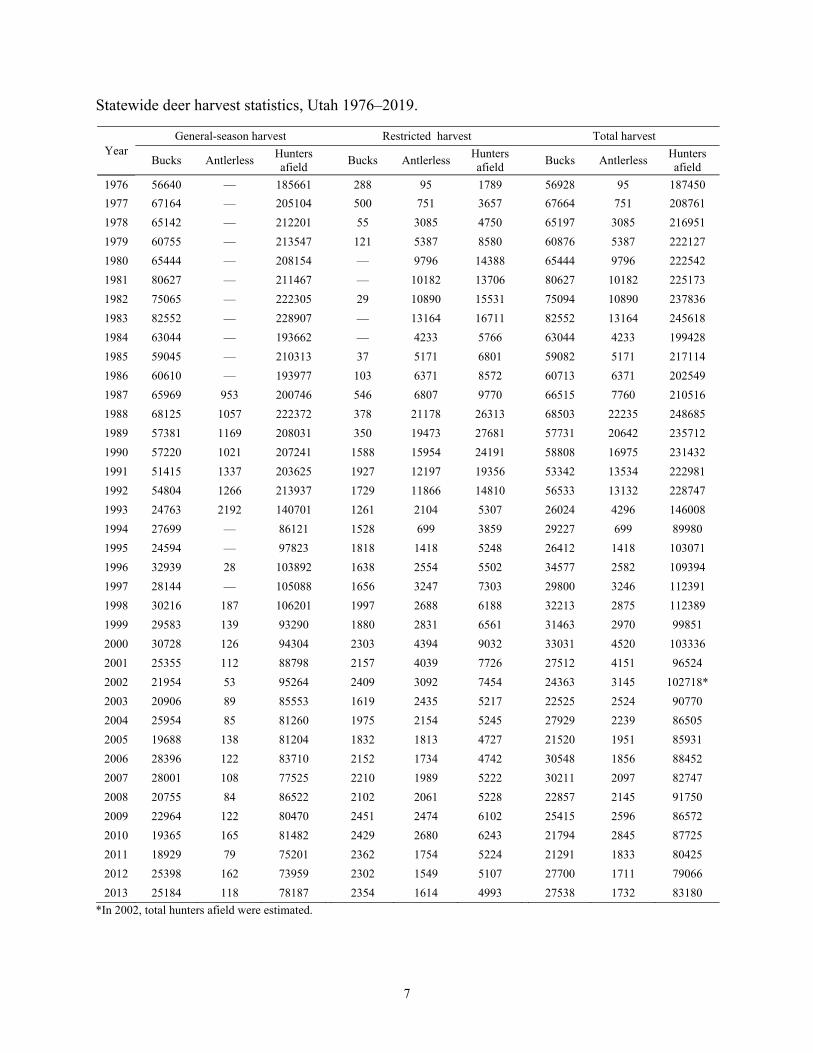
Statewide deer harvest statistics, Utah 1976–2019.
Year General-season harvest Restricted harvest Total harvest
Bucks Antlerless Hunters afield
Bucks Antlerless Hunters afield
Bucks Antlerless Hunters afield
1976 56640 — 185661 288 95 1789 56928 95 187450
1977 67164 — 205104 500 751 3657 67664 751 208761
1978 65142 — 212201 55 3085 4750 65197 3085 216951
1979 60755 — 213547 121 5387 8580 60876 5387 222127
1980 65444 — 208154 — 9796 14388 65444 9796 222542
1981 80627 — 211467 — 10182 13706 80627 10182 225173
1982 75065 — 222305 29 10890 15531 75094 10890 237836
1983 82552 — 228907 — 13164 16711 82552 13164 245618
1984 63044 — 193662 — 4233 5766 63044 4233 199428
1985 59045 — 210313 37 5171 6801 59082 5171 217114
1986 60610 — 193977 103 6371 8572 60713 6371 202549
1987 65969 953 200746 546 6807 9770 66515 7760 210516
1988 68125 1057 222372 378 21178 26313 68503 22235 248685
1989 57381 1169 208031 350 19473 27681 57731 20642 235712
1990 57220 1021 207241 1588 15954 24191 58808 16975 231432
1991 51415 1337 203625 1927 12197 19356 53342 13534 222981
1992 54804 1266 213937 1729 11866 14810 56533 13132 228747
1993 24763 2192 140701 1261 2104 5307 26024 4296 146008
1994 27699 — 86121 1528 699 3859 29227 699 89980
1995 24594 — 97823 1818 1418 5248 26412 1418 103071
1996 32939 28 103892 1638 2554 5502 34577 2582 109394
1997 28144 — 105088 1656 3247 7303 29800 3246 112391
1998 30216 187 106201 1997 2688 6188 32213 2875 112389
1999 29583 139 93290 1880 2831 6561 31463 2970 99851
2000 30728 126 94304 2303 4394 9032 33031 4520 103336
2001 25355 112 88798 2157 4039 7726 27512 4151 96524
2002 21954 53 95264 2409 3092 7454 24363 3145 102718*
2003 20906 89 85553 1619 2435 5217 22525 2524 90770
2004 25954 85 81260 1975 2154 5245 27929 2239 86505
2005 19688 138 81204 1832 1813 4727 21520 1951 85931
2006 28396 122 83710 2152 1734 4742 30548 1856 88452
2007 28001 108 77525 2210 1989 5222 30211 2097 82747
2008 20755 84 86522 2102 2061 5228 22857 2145 91750
2009 22964 122 80470 2451 2474 6102 25415 2596 86572
2010 19365 165 81482 2429 2680 6243 21794 2845 87725
2011 18929 79 75201 2362 1754 5224 21291 1833 80425
2012 25398 162 73959 2302 1549 5107 27700 1711 79066
2013 25184 118 78187 2354 1614 4993 27538 1732 83180
*In 2002, total hunters afield were estimated.
7

Statewide deer harvest statistics, Utah 1976–2019 (continued).
Year General-season harvest Restricted harvest Total harvest
Bucks Antlerless Hunters afield
Bucks Antlerless Hunters afield
Bucks Antlerless Hunters afield
2014 26105 138 77512 2266 2280 5495 28371 2418 83007
2015 29530 184 80315 2439 2703 6090 31969 2887 86405
2016 31804 156 83947 2598 3246 6728 34402 3402 90675
2017 27333 138 81449 2593 3637 7629 29926 3775 84741
2018 29389 203 78658 2621 3847 8130 32010 4050 86788
2019 21906 211 76574 2408 3138 7813 24314 3349 84387
8

Total buck deer harvest by management unit / subunit, Utah 2010–2019.
Unit Subunit 2010 2011 2012 2013 2014 2015 2016 2017 2018 2019
22 Beaver — Beaver 891 1080 1207 1081 1182 1342 1306 1511 1240 748
10 Book Cliffs — Book Cliffs 555 487 458 369 371 383 412 407 401 402
1 Box Elder — Box Elder 1115 1101 1299 1177 1072 1311 1497 1504 1452 1009
2 Cache — Cache 1056 950 1597 1326 1663 1871 1949 1294 1638 1051
16 Central Mtns B Manti 1711 1406 2083 2168 2232 2215 2459 2141 2412 1685
16 Central Mtns A Nebo 1107 1201 1040 1241 1060 1238 1485 1209 1300 997
6 Chalk Creek — Chalk Creek 667 612 931 903 957 1038 1175 1078 1178 917
5 East Canyon — East Canyon 626 659 910 815 784 1076 1081 972 997 691
21 Fillmore A Oak Creek 248 192 116 116 95 111 125 129 132 106
21 Fillmore B Pahvant 448 351 491 540 446 607 649 610 687 574
15 Henry Mtns — Henry Mtns 59 73 73 74 75 69 69 75 65 55
26 Kaiparowits — Kaiparowits 35 42 111 147 120 145 181 155 120 112
7 Kamas — Kamas 441 446 424 612 657 704 766 618 628 356
13 La Sal B Dolores Triangle 20 17 10 13 17 15 18 14 18 16
13 La Sal A La Sal Mtns 512 675 587 562 545 540 610 607 547 483
23 Monroe — Monroe 252 432 519 630 711 743 793 760 592 427
4 Morgan-South Rich — Morgan-South Rich 839 600 877 815 888 923 959 871 1085 602
24 Mt Dutton — Mt Dutton 150 193 224 246 283 304 367 363 299 155
11 Nine Mile A Anthro 105 45 160 169 154 215 251 262 289 158
11 Nine Mile B Range Creek 273 284 300 269 282 321 410 367 408 355
8 North Slope A Summit 321 245 144 188 310 322 221 218 274 144
8 North Slope C Three Corners 188 168 234 176 167 200 275 205 279 154
8 North Slope B West Daggett 237 279 283 225 239 292 356 224 340 163
3 Ogden — Ogden 506 407 815 789 711 805 929 647 833 570
18 Oquirrh-Stansbury — Oquirrh-Stansbury 573 558 1041 870 974 1014 1320 1069 1060 1009
28 Panguitch Lake — Panguitch Lake 569 722 1168 1146 1134 1237 1111 1249 1029 932
27 Paunsaugunt — Paunsaugunt 197 215 186 173 160 153 174 172 188 205
9

Total buck deer harvest by management unit / subunit, Utah 2010–2019 (continued).
Unit Subunit 2010 2011 2012 2013 2014 2015 2016 2017 2018 2019
30 Pine Valley — Pine Valley 863 890 1130 1337 1313 1587 1951 1816 1558 1513
25 Plateau C Boulder 579 407 694 694 824 850 928 721 737 457
25 Plateau A Fishlake 528 368 543 554 585 654 668 517 500 375
25 Plateau B Thousand Lakes 35 66 142 58 76 75 108 105 91 63
14 San Juan A Abajo 485 824 873 945 904 984 1129 1103 958 801
14 San Juan B Elk Ridge 47 46 43 46 44 47 74 49 42 48
12 San Rafael — San Rafael 139 330 497 392 305 421 341 434 430 381
9 South Slope D Bonanza 56 43 88 126 127 148 115 188 159 194
9 South Slope C Diamond Mtn 115 117 113 116 116 112 120 119 130 130
9 South Slope B Vernal 705 625 661 571 648 704 810 570 748 617
9 South Slope A Yellowstone 525 481 450 584 663 752 843 690 826 681
20 Southwest Desert — Southwest Desert 294 416 155 201 176 278 232 225 280 155
17 Wasatch Mtns C Avintaquin 200 196 367 447 402 461 402 328 335 241
17 Wasatch Mtns B Currant Creek 947 614 827 920 950 1164 1145 834 1159 701
17 Wasatch Mtns A Salt Lake 340 162 209 118 151 158 151 164 188 91
17 Wasatch Mtns A West 1019 903 1735 1846 1718 2272 2226 1578 2172 1577
19 West Desert C Tintic 140 108 248 227 234 359 331 347 331 337
19 West Desert B Vernon 181 183 166 170 150 152 154 156 177 184
19 West Desert A West Desert 123 129 92 71 101 87 122 125 105 96
29 Zion — Zion 772 839 1367 1329 1307 1501 1605 1622 1594 1587
10

Total antlerless* deer harvest by management unit / subunit, Utah 2010–2019.
Unit Subunit 2010 2011 2012 2013 2014 2015 2016 2017 2018 2019
22 Beaver — Beaver 48 49 23 72 79 110 171 182 128 122
10 Book Cliffs — Book Cliffs 0 0 0 5 5 3 3 0 0 0
1 Box Elder — Box Elder 190 147 227 121 160 175 161 157 211 234
2 Cache — Cache 248 148 159 199 175 171 194 176 279 136
16 Central Mtns B Manti 147 164 119 145 179 201 202 228 208 198
16 Central Mtns A Nebo 92 68 27 33 56 53 102 127 125 78
6 Chalk Creek — Chalk Creek 81 78 72 63 80 110 136 161 262 288
5 East Canyon — East Canyon 70 39 103 71 89 109 169 129 337 314
21 Fillmore A Oak Creek 108 56 22 17 28 26 61 6 0 2
21 Fillmore B Pahvant 16 10 3 0 5 5 16 25 16 30
15 Henry Mtns — Henry Mtns 0 0 0 0 0 0 0 0 0 0
26 Kaiparowits — Kaiparowits 2 0 0 0 5 11 17 0 13 17
7 Kamas — Kamas 20 28 15 11 41 25 24 38 47 19
13 La Sal B Dolores Triangle 0 0 0 0 0 0 0 0 0 0
13 La Sal A La Sal Mtns 2 3 0 0 0 8 0 0 52 6
23 Monroe — Monroe 150 97 81 117 219 247 282 343 134 115
4 Morgan-South Rich — Morgan-South Rich 12 5 8 13 18 23 38 24 15 16
24 Mt Dutton — Mt Dutton 4 5 19 25 73 116 107 131 117 76
11 Nine Mile A Anthro 25 20 22 19 8 18 26 17 32 17
11 Nine Mile B Range Creek 7 25 11 6 9 5 0 25 50 43
8 North Slope A Summit 0 8 0 0 0 0 0 0 0 0
8 North Slope C Three Corners 42 2 4 3 2 6 3 0 3 0
8 North Slope B West Daggett 30 25 71 30 45 26 60 46 60 36
3 Ogden — Ogden 35 25 37 39 28 52 37 55 40 66
18 Oquirrh-Stansbury — Oquirrh-Stansbury 73 56 34 46 34 56 38 32 55 39
28 Panguitch Lake — Panguitch Lake 134 122 109 121 142 194 167 171 148 113
27 Paunsaugunt — Paunsaugunt 98 0 0 0 0 0 6 4 9 9
*Data includes mitigation harvest.
11

Total antlerless* deer harvest by management unit / subunit, Utah 2010–2019 (continued).
Unit Subunit 2010 2011 2012 2013 2014 2015 2016 2017 2018 2019
30 Pine Valley — Pine Valley 214 94 47 104 127 178 226 374 407 385
25 Plateau C Boulder 82 51 61 60 113 183 221 394 377 164
25 Plateau A Fishlake 6 5 0 3 8 6 17 37 16 18
25 Plateau B Thousand Lakes 8 9 1 9 8 25 29 14 10 16
14 San Juan A Abajo 52 30 25 38 48 60 61 58 22 29
14 San Juan B Elk Ridge 0 0 0 0 0 0 0 0 0 0
12 San Rafael — San Rafael 53 67 26 54 73 54 55 67 65 44
9 South Slope D Bonanza 0 0 0 0 8 5 0 3 8 11
9 South Slope C Diamond Mtn 25 0 0 0 0 0 0 3 0 0
9 South Slope B Vernal 216 135 83 97 129 147 174 120 136 112
9 South Slope A Yellowstone 187 112 155 80 108 107 171 188 198 182
20 Southwest Desert — Southwest Desert 38 35 13 37 10 19 38 64 71 43
17 Wasatch Mtns C Avintaquin 0 2 0 0 1 2 2 21 16 30
17 Wasatch Mtns B Currant Creek 51 18 32 18 34 109 72 10 17 33
17 Wasatch Mtns A Salt Lake 58 26 37 4 46 26 35 25 26 26
17 Wasatch Mtns A West 38 21 17 26 109 81 111 106 147 118
19 West Desert C Tintic 20 36 22 27 37 52 31 54 38 57
19 West Desert B Vernon 31 5 1 0 45 24 24 0 4 0
19 West Desert A West Desert 18 4 12 6 5 0 12 21 3 10
29 Zion — Zion 114 3 10 9 20 42 103 140 149 92
*Data includes mitigation harvest.
12

Total buck deer hunters afield by management unit / subunit, Utah 2010–2019.
Unit Subunit 2010 2011 2012 2013 2014 2015 2016 2017 2018 2019
22 Beaver — Beaver 4011 3824 3649 3386 3273 3282 3403 3711 3679 3204
10 Book Cliffs — Book Cliffs 623 567 559 443 445 446 450 444 451 466
1 Box Elder — Box Elder 4047 3831 3876 3597 3441 3723 3684 3451 3828 3830
2 Cache — Cache 5861 5743 6463 6529 6124 6634 7075 6653 6686 6419
16 Central Mtns B Manti 9101 7917 7458 8042 7754 7888 8713 8061 7764 7014
16 Central Mtns A Nebo 5544 5930 4194 4089 4033 4192 4323 4236 3913 4244
6 Chalk Creek — Chalk Creek 1724 1806 2163 2356 2348 2413 2713 2669 3192 3517
5 East Canyon — East Canyon 3357 3666 4417 4123 3934 4009 4523 4316 4947 5035
21 Fillmore A Oak Creek 1055 743 510 471 441 458 382 367 502 398
21 Fillmore B Pahvant 2331 1715 1781 1640 1653 1746 2133 2299 2433 2263
15 Henry Mtns — Henry Mtns 72 82 77 76 78 74 73 79 70 60
26 Kaiparowits — Kaiparowits 218 199 370 458 399 488 448 509 412 452
7 Kamas — Kamas 2477 2653 2781 2892 2792 2828 3144 3102 3436 3376
13 La Sal B Dolores Triangle 21 17 18 16 18 18 19 16 20 16
13 La Sal A La Sal Mtns 2586 2298 1842 1703 1728 1665 1671 1737 1510 1523
23 Monroe — Monroe 1499 1413 976 1263 1443 1544 1667 1721 1296 1169
4 Morgan-South Rich — Morgan-South Rich 2242 2205 2462 2524 2524 2339 2449 2593 3151 2781
24 Mt Dutton — Mt Dutton 921 792 697 681 728 788 784 793 807 708
11 Nine Mile A Anthro 435 279 558 554 605 560 595 611 813 776
11 Nine Mile B Range Creek 1073 889 858 804 824 836 868 836 1082 1247
8 North Slope A Summit 1661 1788 1050 1142 1319 1324 1183 1440 1263 1379
8 North Slope C Three Corners 823 554 1086 881 667 627 651 618 703 825
8 North Slope B West Daggett 1331 1024 1278 1220 1072 1121 1113 1076 1087 1094
3 Ogden — Ogden 2711 2348 2746 2844 2678 2858 3167 2794 2739 2757
18 Oquirrh-Stansbury — Oquirrh-Stansbury 2730 2543 2533 2329 2733 2747 3059 2940 3039 3625
28 Panguitch Lake — Panguitch Lake 2662 2645 2917 3235 3403 3483 3445 3456 3533 3310
27 Paunsaugunt — Paunsaugunt 252 260 236 211 188 196 209 214 219 242
13

Total buck deer hunters afield by management unit / subunit, Utah 2010–2019 (continued).
Unit Subunit 2010 2011 2012 2013 2014 2015 2016 2017 2018 2019
30 Pine Valley — Pine Valley 3788 3289 3747 4047 4312 4263 4428 4480 4632 5050
25 Plateau C Boulder 2087 1720 1476 1733 1781 1883 2004 1708 1701 1355
25 Plateau A Fishlake 2683 2077 1423 1373 1368 1422 1587 1509 1238 1271
25 Plateau B Thousand Lakes 118 209 471 185 184 201 300 316 278 292
14 San Juan A Abajo 1981 2009 2407 2418 2400 2467 2545 2647 2652 2627
14 San Juan B Elk Ridge 50 50 53 54 52 56 210 56 52 57
12 San Rafael — San Rafael 864 1291 1649 1264 1463 1531 1492 1556 1601 1845
9 South Slope D Bonanza 218 158 315 295 292 286 336 423 417 589
9 South Slope C Diamond Mtn 122 123 121 124 122 119 128 130 139 135
9 South Slope B Vernal 2776 2337 1755 1426 1343 1313 1587 1197 1608 1641
9 South Slope A Yellowstone 2405 2052 1554 1649 1761 1839 2002 1924 1941 2063
20 Southwest Desert — Southwest Desert 1561 1627 735 819 860 913 851 835 883 904
17 Wasatch Mtns C Avintaquin 966 708 992 1071 973 1108 1149 1041 827 830
17 Wasatch Mtns B Currant Creek 5057 3276 2515 2669 2748 2959 3232 3216 3054 2910
17 Wasatch Mtns A Salt Lake 3007 2509 1978 1878 1580 1476 1637 1457 1581 1325
17 Wasatch Mtns A West 5347 5104 7246 7597 7200 8285 8599 8508 8208 8399
19 West Desert C Tintic 813 665 838 908 878 929 887 885 927 1186
19 West Desert B Vernon 231 245 251 232 209 201 200 204 217 239
19 West Desert A West Desert 673 827 541 584 514 474 516 503 532 521
29 Zion — Zion 2490 2631 2795 3082 3221 3289 3530 3650 4149 4335
14

Total antlerless* deer hunters afield by management unit / subunit, Utah 2010–2019.
Unit Subunit 2010 2011 2012 2013 2014 2015 2016 2017 2018 2019
22 Beaver — Beaver 38 34 38 64 80 123 169 204 196 193
10 Book Cliffs — Book Cliffs 0 0 0 2 5 3 5 0 0 0
1 Box Elder — Box Elder 233 244 314 205 220 202 257 249 299 291
2 Cache — Cache 207 147 174 205 193 203 191 239 332 255
16 Central Mtns B Manti 118 139 143 161 205 209 230 244 226 227
16 Central Mtns A Nebo 171 131 54 49 48 57 102 149 167 100
6 Chalk Creek — Chalk Creek 68 81 79 71 85 109 129 145 296 351
5 East Canyon — East Canyon 42 31 43 45 60 61 111 84 298 463
21 Fillmore A Oak Creek 187 49 18 20 29 17 41 11 1 5
21 Fillmore B Pahvant 34 20 2 4 2 8 15 31 26 24
15 Henry Mtns — Henry Mtns 0 0 0 0 0 0 0 0 0 0
26 Kaiparowits — Kaiparowits 1 3 0 1 6 13 11 0 15 13
7 Kamas — Kamas 18 20 20 15 32 27 25 33 47 32
13 La Sal B Dolores Triangle 0 0 0 0 0 0 0 0 0 0
13 La Sal A La Sal Mtns 1 2 2 2 2 5 0 0 10 2
23 Monroe — Monroe 310 133 99 136 244 297 311 376 176 192
4 Morgan-South Rich — Morgan-South Rich 4 2 8 13 23 28 37 40 26 36
24 Mt Dutton — Mt Dutton 7 4 14 29 67 93 101 158 149 139
11 Nine Mile A Anthro 16 33 34 22 18 24 33 32 32 33
11 Nine Mile B Range Creek 6 19 13 3 9 7 0 21 62 63
8 North Slope A Summit 0 8 0 0 0 0 0 0 0 0
8 North Slope C Three Corners 41 6 4 6 4 9 4 0 4 9
8 North Slope B West Daggett 34 29 72 30 39 40 76 63 79 77
3 Ogden — Ogden 37 25 45 36 41 34 42 41 50 51
18 Oquirrh-Stansbury — Oquirrh-Stansbury 51 37 31 45 35 74 41 37 66 68
28 Panguitch Lake — Panguitch Lake 147 135 128 147 154 214 207 244 188 136
27 Paunsaugunt — Paunsaugunt 95 0 0 0 0 1 5 3 5 19
*Data includes mitigation hunters.
15

Total antlerless* deer hunters afield by management unit / subunit, Utah 2010–2019 (continued).
Unit Subunit 2010 2011 2012 2013 2014 2015 2016 2017 2018 2019
30 Pine Valley — Pine Valley 239 108 68 112 144 187 242 456 508 504
25 Plateau C Boulder 55 52 63 72 112 149 175 424 501 339
25 Plateau A Fishlake 5 10 11 6 8 11 21 70 18 19
25 Plateau B Thousand Lakes 2 3 3 14 18 21 22 23 23 52
14 San Juan A Abajo 68 25 17 27 34 34 45 42 52 47
14 San Juan B Elk Ridge 0 0 0 0 0 0 0 0 0 0
12 San Rafael — San Rafael 36 67 39 60 79 68 66 103 86 76
9 South Slope D Bonanza 0 0 0 0 8 5 0 5 12 8
9 South Slope C Diamond Mtn 30 0 0 0 0 0 0 2 0 0
9 South Slope B Vernal 195 110 121 116 145 164 226 150 176 155
9 South Slope A Yellowstone 191 222 247 151 156 149 211 206 237 222
20 Southwest Desert — Southwest Desert 35 29 11 23 13 18 33 40 78 68
17 Wasatch Mtns C Avintaquin 0 2 0 0 4 2 2 48 29 34
17 Wasatch Mtns B Currant Creek 39 43 40 36 46 102 81 40 37 36
17 Wasatch Mtns A Salt Lake 0 0 0 0 0 0 0 0 0 0
17 Wasatch Mtns A West 23 29 23 27 97 57 76 79 12 82
19 West Desert C Tintic 20 15 13 27 37 38 14 0 43 47
19 West Desert B Vernon 23 6 2 0 48 32 23 47 3 0
19 West Desert A West Desert 11 5 8 6 3 7 9 0 16 10
29 Zion — Zion 175 14 8 17 17 33 116 19 194 143
*Data includes mitigation hunters.
16

Total deer harvest by management unit, Utah 2019.
Unit Buck
harvest Antlerless
harvest Total
harvest Hunters afield
Mean days hunted
Success rate (%)
22 Beaver 748 122 870 3397 5.2 24.9
10 Book Cliffs 402 0 402 466 5.0 86.3
1 Box Elder 1009 234 1243 4121 4.2 28.5
2 Cache 1051 136 1187 6674 4.7 17.6
16 Central Mtns 2682 276 2958 11585 4.8 24.9
6 Chalk Creek 917 288 1205 3868 3.3 30.1
5 East Canyon 691 314 1005 5498 4.5 18.1
21 Fillmore 680 32 712 2690 4.1 25.9
15 Henry Mtns 55 0 55 60 4.4 91.7
26 Kaiparowits 112 17 129 465 3.9 25.2
7 Kamas 356 19 375 3408 4.1 11.0
13 La Sal 499 6 505 1541 5.1 32.5
23 Monroe 427 115 542 1361 5.0 38.1
4 Morgan-South Rich 602 16 618 2817 3.3 21.9
24 Mt Dutton 155 76 231 847 5.1 25.4
11 Nine Mile 513 60 573 2119 4.0 25.6
8 North Slope 461 36 497 3384 3.8 14.6
3 Ogden 570 66 636 2808 4.9 22.1
18 Oquirrh-Stansbury 1009 39 1048 3693 4.1 28.4
28 Panguitch Lake 932 113 1045 3446 4.6 30.3
27 Paunsaugunt 205 9 214 261 5.3 81.9
30 Pine Valley 1513 385 1898 5554 4.1 33.6
25 Plateau 895 198 1093 3327 4.2 31.6
14 San Juan 849 29 878 2731 4.8 32.0
12 San Rafael 381 44 425 1921 3.9 21.7
9 South Slope 1622 305 1927 4813 5.2 38.1
20 Southwest Desert 155 43 198 972 6.0 18.8
17 Wasatch Mtns 2610 207 2817 13616 4.4 20.4
19 West Desert 617 67 684 2003 4.3 33.6
29 Zion 1587 92 1679 4478 4.5 37.5
Unidentified 10 5 15 161 4.5 9.4
Statewide totals 24314 3349 27663 84387 5.4 32.1
17

General-season early any legal weapon (rifle)* deer harvest, Utah 2019.
Unit Hunt
number Hunt name
Buck harvest
PermitsHunters afield
Mean days hunted
Success rate (%)
4/5/6 DB1590 Chalk Creek/East Canyon/Morgan-South Rich 257 1372 1092 2.9 23.5
21 DB1591 Fillmore 92 309 236 3.5 39.1
7 DB1592 Kamas 73 638 521 3.3 14.1
11 DB1593 Nine Mile 57 222 197 3.4 29.1
28 DB1594 Panguitch Lake 129 371 330 3.4 39.2
30 DB1595 Pine Valley 197 624 511 3.3 38.6
25A DB1596 Plateau, Fishlake 70 160 143 3.8 48.8
29 DB1597 Zion 250 528 463 3.3 53.9
Statewide totals 1125 4224 3493 3.3 33.2
*This table does not include data from youth hunters because youth hunters could hunt all general seasons. See youth hunter harvest statistics below.
Youth* general-season early any legal weapon (rifle)* deer harvest, Utah 2019.
Unit Hunt
number Hunt name
Buck harvest
Permits Hunters afield
Mean dayshunted
Success rate (%)
4/5/6 DB1590 Chalk Creek/East Canyon/Morgan-South Rich 101 358 303 4.6 33.3
21 DB1591 Fillmore 32 82 72 6.2 44.7
7 DB1592 Kamas 11 103 85 4.1 13.5
11 DB1593 Nine Mile 29 67 60 6.9 48.6
28 DB1594 Panguitch Lake 53 124 118 5.2 45.2
30 DB1595 Pine Valley 76 170 147 5.1 51.4
25A DB1596 Plateau, Fishlake 20 35 29 3.6 68.8
29 DB1597 Zion 62 143 129 4.4 47.8
Statewide totals 384 1082 943 4.9 41.8
*Youth hunters who obtained a general-season any legal weapon deer permit could hunt all general seasons. This table summarizes data from all 4 seasons (not including extended archery season).
18
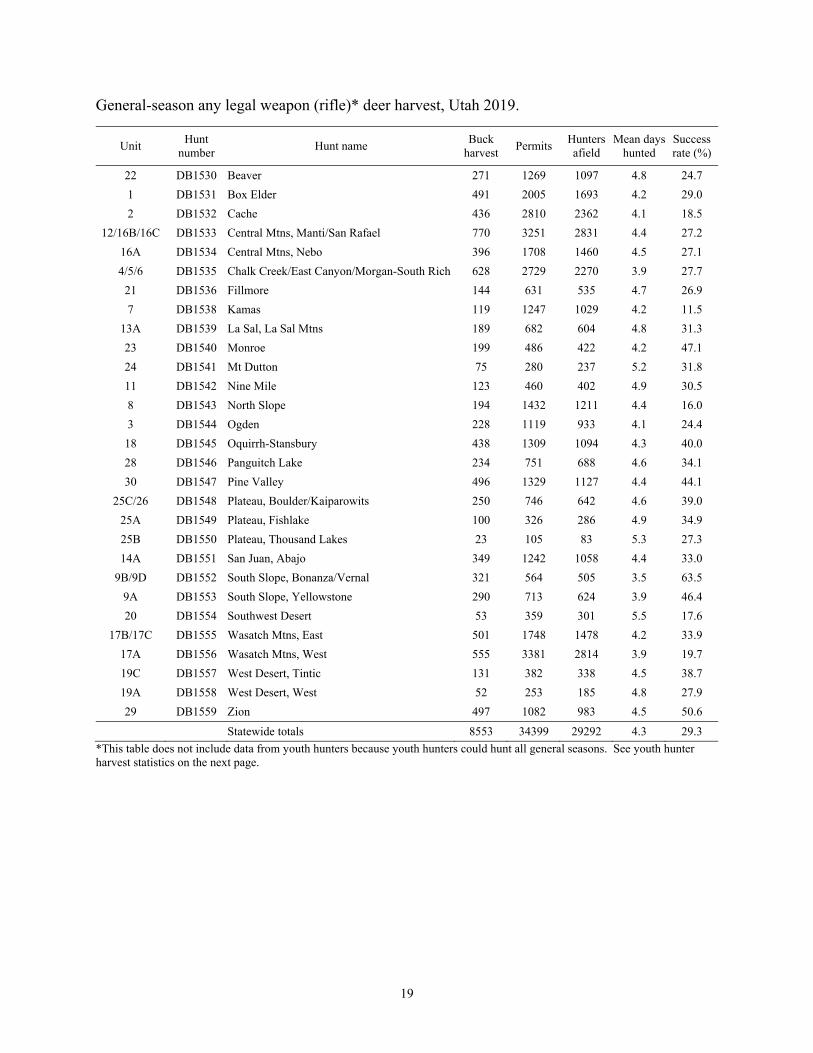
General-season any legal weapon (rifle)* deer harvest, Utah 2019.
Unit Hunt
number Hunt name
Buck harvest
Permits Hunters afield
Mean dayshunted
Success rate (%)
22 DB1530 Beaver 271 1269 1097 4.8 24.7
1 DB1531 Box Elder 491 2005 1693 4.2 29.0
2 DB1532 Cache 436 2810 2362 4.1 18.5
12/16B/16C DB1533 Central Mtns, Manti/San Rafael 770 3251 2831 4.4 27.2
16A DB1534 Central Mtns, Nebo 396 1708 1460 4.5 27.1
4/5/6 DB1535 Chalk Creek/East Canyon/Morgan-South Rich 628 2729 2270 3.9 27.7
21 DB1536 Fillmore 144 631 535 4.7 26.9
7 DB1538 Kamas 119 1247 1029 4.2 11.5
13A DB1539 La Sal, La Sal Mtns 189 682 604 4.8 31.3
23 DB1540 Monroe 199 486 422 4.2 47.1
24 DB1541 Mt Dutton 75 280 237 5.2 31.8
11 DB1542 Nine Mile 123 460 402 4.9 30.5
8 DB1543 North Slope 194 1432 1211 4.4 16.0
3 DB1544 Ogden 228 1119 933 4.1 24.4
18 DB1545 Oquirrh-Stansbury 438 1309 1094 4.3 40.0
28 DB1546 Panguitch Lake 234 751 688 4.6 34.1
30 DB1547 Pine Valley 496 1329 1127 4.4 44.1
25C/26 DB1548 Plateau, Boulder/Kaiparowits 250 746 642 4.6 39.0
25A DB1549 Plateau, Fishlake 100 326 286 4.9 34.9
25B DB1550 Plateau, Thousand Lakes 23 105 83 5.3 27.3
14A DB1551 San Juan, Abajo 349 1242 1058 4.4 33.0
9B/9D DB1552 South Slope, Bonanza/Vernal 321 564 505 3.5 63.5
9A DB1553 South Slope, Yellowstone 290 713 624 3.9 46.4
20 DB1554 Southwest Desert 53 359 301 5.5 17.6
17B/17C DB1555 Wasatch Mtns, East 501 1748 1478 4.2 33.9
17A DB1556 Wasatch Mtns, West 555 3381 2814 3.9 19.7
19C DB1557 West Desert, Tintic 131 382 338 4.5 38.7
19A DB1558 West Desert, West 52 253 185 4.8 27.9
29 DB1559 Zion 497 1082 983 4.5 50.6
Statewide totals 8553 34399 29292 4.3 29.3
*This table does not include data from youth hunters because youth hunters could hunt all general seasons. See youth hunter harvest statistics on the next page.
19

Youth* general-season any legal weapon (rifle) deer harvest, Utah 2019.
Unit Hunt
number Hunt name
Buck harvest
Permits Hunters afield
Mean dayshunted
Success rate (%)
22 DB1530 Beaver 130 333 309 5.6 41.9
1 DB1531 Box Elder 105 489 423 4.1 24.8
2 DB1532 Cache 244 838 745 4.8 32.8
12/16B/16C DB1533 Central Mtns, Manti/San Rafael 383 961 871 5.7 43.9
16A DB1534 Central Mtns, Nebo 208 544 499 5.4 41.7
4/5/6 DB1535 Chalk Creek/East Canyon/Morgan-South Rich 197 733 625 5.3 31.5
21 DB1536 Fillmore 80 170 166 6.5 48.1
7 DB1538 Kamas 41 231 178 5.1 23.0
13A DB1539 La Sal, La Sal Mtns 73 205 154 6.2 47.3
23 DB1540 Monroe 65 114 99 4.9 65.4
24 DB1541 Mt Dutton 22 79 63 5.4 34.8
11 DB1542 Nine Mile 48 121 106 7.7 44.9
8 DB1543 North Slope 86 375 318 5.6 27.0
3 DB1544 Ogden 106 309 277 4.6 38.3
18 DB1545 Oquirrh-Stansbury 144 361 320 4.8 45.0
28 DB1546 Panguitch Lake 92 244 224 6.5 41.0
30 DB1547 Pine Valley 155 295 277 5.4 55.8
25C/26 DB1548 Plateau, Boulder/Kaiparowits 92 183 162 4.5 57.1
25A DB1549 Plateau, Fishlake 24 67 62 6.4 38.2
25B DB1550 Plateau, Thousand Lakes 4 10 10 4.8 40.0
14A DB1551 San Juan, Abajo 141 362 297 6.3 47.5
9B/9D DB1552 South Slope, Bonanza/Vernal 107 163 150 5.6 71.8
9A DB1553 South Slope, Yellowstone 101 208 176 4.0 57.4
20 DB1554 Southwest Desert 30 97 88 7.2 34.2
17B/17C DB1555 Wasatch Mtns, East 161 476 407 5.3 39.6
17A DB1556 Wasatch Mtns, West 290 1095 911 5.1 31.9
19C DB1557 West Desert, Tintic 40 104 96 5.1 41.7
19A DB1558 West Desert, West 14 66 50 4.4 28.0
29 DB1559 Zion 143 261 241 5.7 59.5
Statewide totals 3326 9494 8304 5.3 41.4
*Youth hunters who obtained a general-season any legal weapon deer permit could hunt all general seasons. This table summarizes data from all 4 seasons (not including extended archery season).
20

General-season muzzleloader deer harvest, Utah 2019.
Unit Hunt
number Hunt name
Buck harvest
Permits Hunters afield
Mean dayshunted
Success rate (%)
22 DB1560 Beaver 157 526 454 4.4 34.6
1 DB1561 Box Elder 117 823 674 4.0 17.3
2 DB1562 Cache 167 1217 1021 4.5 16.4
12/16B/16C DB1563 Central Mtns, Manti/San Rafael 321 1388 1173 4.0 27.3
16A DB1564 Central Mtns, Nebo 146 735 633 4.0 23.1
4/5/6 DB1565 Chalk Creek/East Canyon/Morgan-South Rich 221 1719 1418 3.8 15.6
21 DB1566 Fillmore 124 392 348 3.9 35.7
7 DB1568 Kamas 65 728 605 4.1 10.8
13A DB1569 La Sal, La Sal Mtns 92 292 247 4.4 37.2
23 DB1570 Monroe 64 193 159 4.3 40.0
24 DB1571 Mt Dutton 18 116 104 5.3 17.7
11 DB1572 Nine Mile 65 283 232 4.1 27.9
8 DB1573 North Slope 106 598 503 4.5 21.0
3 DB1574 Ogden 73 479 391 4.2 18.7
18 DB1575 Oquirrh-Stansbury 158 556 506 4.1 31.2
28 DB1576 Panguitch Lake 198 489 439 4.4 45.2
30 DB1577 Pine Valley 225 798 676 4.3 33.3
25C/26 DB1578 Plateau, Boulder/Kaiparowits 80 310 252 4.5 31.5
25A DB1579 Plateau, Fishlake 69 196 166 4.2 41.9
25B DB1580 Plateau, Thousand Lakes 14 81 68 4.6 20.9
14A DB1581 San Juan, Abajo 114 536 422 4.7 27.1
9B/9D DB1582 South Slope, Bonanza/Vernal 124 296 261 4.5 47.4
9A DB1583 South Slope, Yellowstone 128 301 264 4.2 48.5
20 DB1584 Southwest Desert 36 147 123 5.3 29.2
17B/17C DB1585 Wasatch Mtns, East 159 739 620 4.1 25.6
17A DB1586 Wasatch Mtns, West 243 1480 1237 4.1 19.6
19C DB1587 West Desert, Tintic 63 155 142 3.9 44.7
19A DB1588 West Desert, West 13 106 82 4.0 16.3
29 DB1589 Zion 257 663 620 4.1 41.4
Statewide totals 3617 16342 13840 4.2 27.0
21

General-season archery* deer harvest, Utah 2019.
Unit Hunt
number Hunt name
Buck harvest
Permits Hunters afield
Mean dayshunted
Success rate (%)
22 DB1500 Beaver 94 546 499 7.4 18.8
1 DB1501 Box Elder 19 827 301 4.7 6.3
2 DB1502 Cache 75 1228 954 7.6 7.9
12/16B/16C DB1503 Central Mtns, Manti/San Rafael 269 1462 1227 7.2 21.9
16A DB1504 Central Mtns, Nebo 123 762 639 7.0 19.2
4/5/6 DB1505 Chalk Creek/East Canyon/Morgan-South Rich 119 1729 1232 6.1 9.6
21 DB1506 Fillmore 80 402 348 7.5 23.1
7 DB1508 Kamas 36 742 583 6.5 6.2
13A DB1509 La Sal, La Sal Mtns 77 298 235 7.1 32.9
23 DB1510 Monroe 58 218 202 8.2 28.6
24 DB1511 Mt Dutton 11 126 110 6.4 10.0
11 DB1512 Nine Mile 33 289 199 8.7 16.4
8 DB1513 North Slope 33 611 494 7.2 6.7
3 DB1514 Ogden 33 484 325 7.1 10.0
18 DB1515 Oquirrh-Stansbury 28 566 433 6.5 6.5
28 DB1516 Panguitch Lake 97 508 458 8.0 21.1
30 DB1517 Pine Valley 182 821 696 6.8 26.1
25C/26 DB1518 Plateau, Boulder/Kaiparowits 85 323 287 6.3 29.5
25A DB1519 Plateau, Fishlake 43 212 194 7.4 22.4
25B DB1520 Plateau, Thousand Lakes 12 84 74 7.5 16.3
14A DB1521 San Juan, Abajo 90 532 460 6.5 19.7
9B/9D DB1522 South Slope, Bonanza/Vernal 100 501 440 6.9 22.8
9A DB1523 South Slope, Yellowstone 33 345 290 7.5 11.4
20 DB1524 Southwest Desert 16 147 121 9.2 13.3
17B/17C DB1525 Wasatch Mtns, East 126 768 624 6.7 20.2
17A DB1526 Wasatch Mtns, West 103 1516 1055 6.7 9.7
19C DB1527 West Desert, Tintic 16 164 137 7.7 11.5
19A DB1528 West Desert, West 0 108 51 4.7 0.0
29 DB1529 Zion 169 681 574 8.3 29.5
Statewide totals 2160 17000 13242 6.9 16.5
*Does not include harvest from extended archery season.
22

Dedicated hunter* deer harvest, Utah 2019.
Unit Hunt
number Hunt name
Buck harvest
Permits Hunters afield
Mean dayshunted
Success rate (%)
22 DB1769 Beaver 93 386 369 11.7 25.2
1 DB1770 Box Elder 12 55 48 9.7 24.2
2 DB1771 Cache 108 484 473 11.0 22.7
12/16B/16C DB1772 Central Mtns, Manti/San Rafael 278 977 939 11.5 29.6
16A DB1773 Central Mtns, Nebo 111 382 367 11.9 30.2
4/5/6 DB1774 Chalk Creek/East Canyon/Morgan-South Rich 53 337 326 12.4 16.4
21 DB1775 Fillmore 77 274 262 10.5 29.2
7 DB1777 Kamas 8 100 89 9.2 8.8
13A DB1778 La Sal, La Sal Mtns 32 104 98 11.1 32.7
23 DB1779 Monroe 41 133 126 9.5 32.8
24 DB1780 Mt Dutton 27 91 86 10.2 31.6
11 DB1781 Nine Mile 57 191 176 12.8 32.3
8 DB1782 North Slope 10 84 78 11.1 13.2
3 DB1783 Ogden 24 104 97 9.4 25.0
18 DB1784 Oquirrh-Stansbury 164 413 394 9.5 41.7
28 DB1785 Panguitch Lake 129 360 354 12.6 36.3
30 DB1786 Pine Valley 174 577 555 11.3 31.3
25C/26 DB1787 Plateau, Boulder/Kaiparowits 61 203 183 8.9 33.3
25A DB1788 Plateau, Fishlake 38 135 129 11.1 29.4
25B DB1789 Plateau, Thousand Lakes 8 33 30 7.8 25.0
14A DB1790 San Juan, Abajo 19 88 88 8.9 22.0
9B/9D DB1791 South Slope, Bonanza/Vernal 89 201 198 10.7 44.9
9A DB1792 South Slope, Yellowstone 39 208 186 11.5 21.2
20 DB1793 Southwest Desert 17 114 103 14.1 16.7
17B/17C DB1794 Wasatch Mtns, East 161 539 518 9.9 31.0
17A DB1795 Wasatch Mtns, West 129 576 546 8.9 23.6
19C DB1796 West Desert, Tintic 32 92 89 11.3 35.6
19A DB1797 West Desert, West 17 74 70 10.9 24.0
29 DB1798 Zion 175 494 483 11.2 36.3
Statewide totals 2183 7809 7460 10.9 28.6
*Dedicated hunters could hunt all 3 general deer seasons. This table summarizes data from all 3 seasons (not including extended archery season).
23

Extended archery* deer harvest, Utah 2019.
Unit Hunt name Buck
harvest Antlerless
harvest Total
harvest Hunters afield
Mean days hunted
Success rate (%)
1 Box Elder 31 17 48 232 7.4 20.8
2 Cache 4 5 9 145 4.0 6.1
16A Central Mtns, Nebo 13 0 13 66 7.9 20.0
5 East Canyon 132 48 180 1617 7.1 11.1
3 Ogden 31 26 57 443 6.9 12.9
18 Oquirrh-Stansbury 52 9 61 390 6.0 15.7
9B South Slope, Vernal 70 4 74 298 10.0 25.0
9A South Slope, Yellowstone 83 9 92 254 10.1 36.2
17A Wasatch Mtns, Salt Lake 53 26 79 1025 5.8 7.7
17A Wasatch Mtns, West 22 44 66 464 5.7 14.2
19C West Desert, Tintic 52 18 70 280 6.8 25.0
South Slope, Unidentified Subunit 4 0 4 31 4.7 14.3
Wasatch Front, Unidentified Subunit 4 5 9 110 3.8 8.0
Statewide totals** 552 210 762 4425 8.2 17.2
*Does not include dedicated hunters or youth general-season any weapon deer hunters. Success rates were calculated from projected estimates and not raw data. **Statewide totals for hunters afield do not equal the sum of the columns because hunters could hunt multiple units.
24

Premium limited-entry buck deer harvest, Utah 2019.
Hunt type Unit Hunt
number Hunt name
Buck harvest
Permits Hunters afield
Mean days hunted
Success rate (%)
Archery 15 DB1000 Henry Mtns 7 10 10 6.4 70.0
27 DB1001 Paunsaugunt 31 38 38 6.6 82.4
Any weapon 15 DB1003 Henry Mtns 26 27 27 2.9 96.3
27 DB1004 Paunsaugunt 73 85 84 5.8 87.5
Muzzleloader 15 DB1005 Henry Mtns 13 13 13 4.1 100.0
27 DB1006 Paunsaugunt 26 32 32 4.4 80.0
Multi-season 15 DB1007 Henry Mtns 0 1 1 39.0 0.0
27 DB1008 Paunsaugunt 3 4 4 16.0 75.0
Statewide Sportsman/Conservation 2 2 2 21.0 100.0
Cactus buck 27 DB1058 Paunsaugunt 17 26 25 5.9 66.7
Management 15 DB1009 Henry Mtns (any legal weapon) 4 4 4 2.0 100.0
15 DB1051 Henry Mtns (archery) 2 2 2 6.5 100.0
15 DB1052 Henry Mtns (muzzleloader) 3 3 3 2.7 100.0
27 DB1010 Paunsaugunt (any legal weapon) 16 20 19 3.3 84.2
27 DB1073 Paunsaugunt (archery) 4 5 5 3.6 80.0
27 DB1074 Paunsaugunt (muzzleloader) 5 5 5 2.2 100.0
25

Limited-entry buck deer harvest, Utah 2019.
Hunt type Unit Hunt
number Hunt name
Buck harvest
PermitsHunters afield
Mean days hunted
Success rate (%)
Archery 10 DB1011 Book Cliffs 66 92 89 6.6 73.9
21A DB1012 Fillmore, Oak Creek LE 5 7 7 13.7 71.4
13B DB1013 La Sal, Dolores Triangle 2 2 2 2.0 100.0
14B DB1014 San Juan, Elk Ridge 9 11 11 4.7 81.8
9C DB1015 South Slope, Diamond Mtn 21 24 24 5.2 87.5
19B DB1016 West Desert, Vernon 26 45 45 9.9 58.1
Any weapon 10A DB1017 Book Cliffs, North 188 205 203 4.4 92.9
10B DB1018 Book Cliffs, South 43 50 49 4.4 88.9
21A DB1019 Fillmore, Oak Creek LE 24 29 29 4.6 82.8
13B DB1020 La Sal, Dolores Triangle 9 10 9 3.5 100.0
14A DB1021 North Slope, Summit 18 96 80 4.4 22.2
14B DB1022 San Juan, Elk Ridge 23 32 30 3.7 77.8
9C DB1023 South Slope, Diamond Mtn 80 82 82 3.4 97.3
19B DB1024 West Desert, Vernon 108 136 135 3.9 80.0
Muzzleloader 22 DB1059 Beaver 3 4 4 4.7 66.7
10 DB1025 Book Cliffs 74 92 92 4.1 80.7
2C DB1026 Cache, Crawford Mtn 14 18 17 5.3 81.3
4/5/6 DB1027 Chalk Creek/East Canyon/Morgan-South Rich
13 17 15 4.9 86.7
21 DB1028 Fillmore 2 2 2 5.0 100.0
21A DB1029 Fillmore, Oak Creek LE 10 10 10 4.5 100.0
7 DB1030 Kamas 3 9 9 5.5 37.5
13B DB1031 La Sal, Dolores Triangle 5 5 5 4.2 100.0
24 DB1053 Mt Dutton 2 5 5 6.4 40.0
11 DB1033 Nine Mile 16 28 27 6.1 60.9
8 DB1065 North Slope 7 9 9 6.7 77.8
3 DB1054 Ogden 4 5 5 6.4 80.0
30 DB1034 Pine Valley 8 8 8 5.8 100.0
25B DB1036 Plateau, Thousand Lakes 2 3 3 5.0 66.7
14B DB1037 San Juan, Elk Ridge 14 14 14 3.9 100.0
9C DB1038 South Slope, Diamond Mtn 26 26 26 3.3 100.0
9A DB1039 South Slope, Yellowstone 7 10 9 4.6 77.8
20 DB1040 Southwest Desert 3 5 5 8.2 60.0
17BC DB1041 Wasatch Mtns, East 16 28 27 5.3 57.7
19B DB1042 West Desert, Vernon 44 52 52 4.4 84.3
29 DB1043 Zion 8 12 12 6.6 66.7
26

Limited-entry buck deer harvest, Utah 2019 (continued).
Hunt type Unit Hunt
number Hunt name
Buck harvest
PermitsHunters afield
Mean days hunted
Success rate (%)
Multi-season 10 DB1044 Book Cliffs 12 13 13 11.8 91.7
10 DB1056 Book Cliffs (conservation) 3 4 4 6.3 75.0
21A DB1045 Fillmore, Oak Creek LE 1 1 1 15.0 100.0
14B DB1046 San Juan, Elk Ridge 2 2 2 2.0 100.0
9C DB1047 South Slope, Diamond Mtn 3 3 3 4.0 100.0
19B DB1048 West Desert, Vernon 6 7 7 7.3 85.7
27

CWMU buck deer harvest, Utah 2019.
Unit Hunt
number CWMU
Buck harvest
Permits Hunters afield
Mean days hunted
Success rate (%)
27 DB1200 Alton 25 25 25 5.0 100.0
27 DB1201 Alton 5 5 5 3.5 100.0
11A DB1202 Antelope Creek 3 3 3 13.5 100.0
17C DB1203 Avintaquin Canyon 4 7 7 2.8 60.0
4 DB1204 Bally Watts 10 14 14 3.7 71.4
25A DB1205 Bar J Ranch 5 9 9 5.0 50.0
16B DB1206 Bear Mountain 6 10 10 3.1 62.5
3 DB1207 Bear Springs 5 6 6 5.3 83.3
11B/16B DB1208 Black Hawk 3 3 3 3.0 100.0
1 DB1209 Blind Spring 5 10 8 3.3 66.7
1 DB1210 Blue Creek 2 3 3 2.0 66.7
1 DB1211 Blue Spring Hills 7 9 9 4.6 80.0
3 DB1212 Bluebell 9 10 10 3.8 87.5
25A DB1213 Boobe Hole 5 18 18 5.1 25.0
17B DB1215 Buckhorn Ranch 4 5 5 2.6 80.0
16B DB1216 Castle Valley Outdoors 2 6 6 4.4 40.0
4 DB1217 Causey Spring 11 12 12 3.5 90.9
4 DB1219 Chimney Rock 17 18 18 3.1 94.1
1 DB1221 Clear Valley Ranch 6 8 8 4.0 71.4
3 DB1222 Coldwater Ranch 14 17 17 3.1 81.3
11B DB1223 Conover-Jensen 24 28 28 4.0 85.2
1 DB1224 Cotton Thomas 7 10 10 2.5 70.0
17A DB1225 Coyote Little Pole 19 20 20 3.8 93.8
17A DB1320 Deer Creek 3 5 4 4.0 66.7
14A DB1227 Deer Haven 17 17 17 3.3 100.0
4 DB1228 Deseret 75 89 89 3.8 84.2
1 DB1229 Dilly Ranch 6 7 7 2.2 83.3
1 DB1325 Double Cone 6 7 7 4.8 83.3
17A DB1230 Double R Ranch 10 24 24 4.8 41.7
1 DB1231 Dove Creek 9 11 11 3.5 81.8
4 DB1232 Durst Mountain 6 10 10 5.7 57.1
6 DB1233 East Fork Chalk Creek 29 40 40 6.2 73.0
29 DB1234 East Zion 9 17 16 14.6 53.3
1 DB1236 Engineer Springs 3 4 4 3.0 75.0
6 DB1237 Ensign Ranches 33 39 39 3.9 83.3
4 DB1238 Folley Ridge 16 23 22 2.8 72.2
1 DB1240 George Creek 7 8 8 5.1 85.7
1 DB1241 Golden Spike 5 7 7 3.7 66.7
28

CWMU buck deer harvest, Utah 2019 (continued).
Unit Hunt
number CWMU
Buck harvest
Permits Hunters afield
Mean days hunted
Success rate (%)
6 DB1242 Grass Valley/Clark Canyon 94 133 131 4.0 71.8
25A DB1243 Grazing Pasture 0 3 3 4.7 0.0
3 DB1244 Green Canyon 6 10 10 7.6 60.0
4 DB1245 Guildersleeve 14 17 17 4.5 81.3
5 DB1246 Hardscrabble 4 10 8 4.0 50.0
18 DB1248 Heaston East 21 22 22 3.4 94.1
16B DB1249 Hiawatha 4 6 6 4.2 60.0
1 DB1250 Indian Creek 1 13 13 3.7 7.7
17C DB1251 Indian Head 13 15 15 2.5 84.6
1 DB1252 Ingham Peak 29 37 37 3.3 79.2
13A DB1253 J.B. Ranch 4 7 7 3.4 57.1
5 DB1317 Jacob’s Creek 11 19 19 4.3 58.3
25A DB1255 Johnson Mountain Ranch 1 2 2 13.5 50.0
1 DB1256 Junction Valley 42 48 47 3.6 90.2
5 DB1257 Lazy H Ranch 2 5 3 5.5 50.0
17B DB1258 Little Red Creek 12 16 16 3.3 75.0
5 DB1259 Lone Tree Taylor Hollow 12 18 18 4.2 69.2
4 DB1321 Mecham Ridge 4 7 7 5.6 57.1
4 DB1260 Middle Ridge 13 16 15 2.8 85.7
11B DB1261 Minnie Maud Ridge 29 45 45 4.5 64.1
17B DB1263 Moon Ranch 1 10 10 6.4 11.1
1 DB1264 Mountain Meadow 8 9 9 4.8 87.5
16A DB1327 Mountain Sky Ranch 0 6 6 12.2 0.0
5 DB1265 Mountain Top 13 20 20 4.3 66.7
29 DB1266 Mt Carmel 17 22 22 4.5 76.2
6 DB1267 Neil Creek 18 18 18 4.5 100.0
1 DB1303 North Peaks 5 10 9 3.1 57.1
1 DB1269 North Promontory 7 7 7 3.8 100.0
1 DB1270 Nucor West 7 7 7 1.5 100.0
16B DB1271 Oak Ranch 1 17 17 4.8 7.7
16B DB1272 Old Woman Plateau 5 12 12 3.9 40.0
21B DB1322 Pahvant Ensign 9 9 9 4.8 100.0
1 DB1273 Park Valley Hereford 21 46 45 4.1 47.5
11B DB1274 Patmos Ridge 3 3 3 9.0 100.0
4 DB1275 Pine Canyon 23 29 28 4.2 84.0
3 DB1286 Pisgah Mountain 5 17 17 4.8 30.8
1 DB1276 Plymouth Peak 3 3 3 2.0 100.0
1 DB1277 Pocatello Valley 7 8 7 3.0 100.0
3 DB1278 Powder Mountain 9 11 11 8.9 80.0
11B DB1279 Preston Nutter Ranch 3 4 3 5.0 100.0
1 DB1280 Promontory Point 5 5 5 2.0 100.0
29
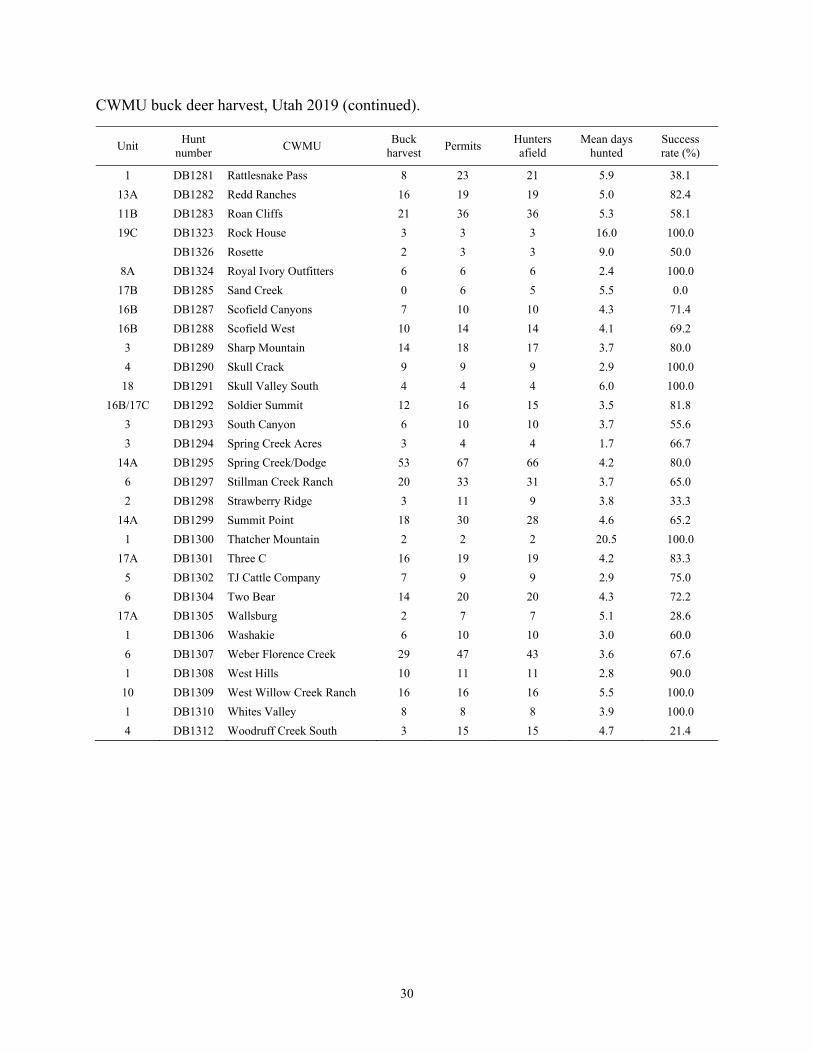
CWMU buck deer harvest, Utah 2019 (continued).
Unit Hunt
number CWMU
Buck harvest
Permits Hunters afield
Mean days hunted
Success rate (%)
1 DB1281 Rattlesnake Pass 8 23 21 5.9 38.1
13A DB1282 Redd Ranches 16 19 19 5.0 82.4
11B DB1283 Roan Cliffs 21 36 36 5.3 58.1
19C DB1323 Rock House 3 3 3 16.0 100.0
DB1326 Rosette 2 3 3 9.0 50.0
8A DB1324 Royal Ivory Outfitters 6 6 6 2.4 100.0
17B DB1285 Sand Creek 0 6 5 5.5 0.0
16B DB1287 Scofield Canyons 7 10 10 4.3 71.4
16B DB1288 Scofield West 10 14 14 4.1 69.2
3 DB1289 Sharp Mountain 14 18 17 3.7 80.0
4 DB1290 Skull Crack 9 9 9 2.9 100.0
18 DB1291 Skull Valley South 4 4 4 6.0 100.0
16B/17C DB1292 Soldier Summit 12 16 15 3.5 81.8
3 DB1293 South Canyon 6 10 10 3.7 55.6
3 DB1294 Spring Creek Acres 3 4 4 1.7 66.7
14A DB1295 Spring Creek/Dodge 53 67 66 4.2 80.0
6 DB1297 Stillman Creek Ranch 20 33 31 3.7 65.0
2 DB1298 Strawberry Ridge 3 11 9 3.8 33.3
14A DB1299 Summit Point 18 30 28 4.6 65.2
1 DB1300 Thatcher Mountain 2 2 2 20.5 100.0
17A DB1301 Three C 16 19 19 4.2 83.3
5 DB1302 TJ Cattle Company 7 9 9 2.9 75.0
6 DB1304 Two Bear 14 20 20 4.3 72.2
17A DB1305 Wallsburg 2 7 7 5.1 28.6
1 DB1306 Washakie 6 10 10 3.0 60.0
6 DB1307 Weber Florence Creek 29 47 43 3.6 67.6
1 DB1308 West Hills 10 11 11 2.8 90.0
10 DB1309 West Willow Creek Ranch 16 16 16 5.5 100.0
1 DB1310 Whites Valley 8 8 8 3.9 100.0
4 DB1312 Woodruff Creek South 3 15 15 4.7 21.4
30

Limited-entry antlerless deer harvest, Utah 2019.
Unit Hunt
number Hunt name
Antlerless harvest Permits
Hunters afield
Mean dayshunted
Success rate (%) Doe Fawn Total
22 DA1000 Beaver, Circleville North 34 0 34 49 48 3.4 72.2
1 DA1001 Box Elder, West Bear River 10 0 10 40 23 5.2 42.9
1 DA1002 Box Elder, West Bear River 7 3 10 20 15 3.6 66.7
6 DA1026 Chalk Creek 152 8 160 299 208 2.1 76.9
5 DA1039 East Canyon 87 8 95 246 145 3.7 65.2
5 DA1040 East Canyon 3 0 3 48 14 4.0 25.0
5 DA1027 East Canyon, Davis-North Salt Lake 37 1 38 99 87 5.9 44.1
5 DA1028 East Canyon, Davis-North Salt Lake 50 2 52 98 89 2.8 58.7
23/25 DA1003 Monroe/Plateau, Sevier Valley 34 2 36 100 79 6.1 45.5
24 DA1004 Mt Dutton, Circleville South 17 1 18 48 38 2.8 48.0
11 DA1029 Nine Mile, Green River Valley 2 0 2 23 10 1.6 20.0
11 DA1041 Nine Mile, Green River Valley 13 2 15 25 18 2.3 81.8
11 DA1030 Nine Mile, Price River Valley 13 0 13 25 19 5.8 66.7
8 DA1005 North Slope, Manila-Phil Pico 16 0 16 50 43 3.7 36.7
18 DA1031 Oquirrh-Stansbury, Settlement Cyn 22 0 22 49 44 4.5 50.0
28 DA1007 Panguitch Lake, Panguitch Valley 38 4 42 50 44 2.0 96.4
28 DA1032 Panguitch Lake, Parowan Front 63 3 66 99 83 2.3 80.3
30 DA1009 Pine Valley, Enterprise 66 0 66 80 72 2.0 90.9
30 DA1017 Pine Valley, Enterprise 56 2 58 78 70 2.5 82.7
30 DA1018 Pine Valley, New Harmony 25 0 25 51 34 3.4 48.1
30 DA1019 Pine Valley, New Harmony 38 0 38 48 31 2.6 75.0
30 DA1020 Pine Valley, Quichapa 45 4 49 80 74 3.7 66.0
30 DA1021 Pine Valley, Quichapa 51 0 51 79 75 2.1 68.0
25 DA1022 Plateau, Antimony 10 1 11 49 42 4.7 26.3
25 DA1023 Plateau, Antimony 30 0 30 50 42 2.6 71.9
25 DA1037 Plateau, East Angle 12 0 12 50 44 2.9 26.1
25 DA1024 Plateau, Fremont River Valley 20 0 20 50 45 3.6 43.2
14 DA1033 San Juan, Monticello 8 0 8 15 15 2.4 50.0
14 DA1042 San Juan, Monticello 3 0 3 15 7 3.4 40.0
20 DA1043 Southwest Desert, Cedar Valley 5 0 5 39 22 4.0 21.4
20 DA1035 Southwest Desert, Garrison 10 1 11 13 10 1.6 62.5
17 DA1036 Wasatch Mtns, West-Sheep Creek 37 3 40 48 41 1.5 97.1
29 DA1010 Zion, Northwest Zion 31 5 36 45 40 1.5 88.6
29 DA1025 Zion, Northwest Zion 19 2 21 30 26 7.4 83.3
31

CWMU antlerless deer harvest, Utah 2019.
Unit Hunt
number CWMU
Antlerless harvest Permits
Hunters afield
Mean days hunted
Success rate (%) Doe Fawn Total
1 DA1011 George Creek 5 0 5 5 5 1.4 100.0
1 DA1012 Junction Valley 64 11 75 46 41 1.9 97.1
29 DA1013 Mt Carmel 5 0 5 5 5 1.0 100.0
32
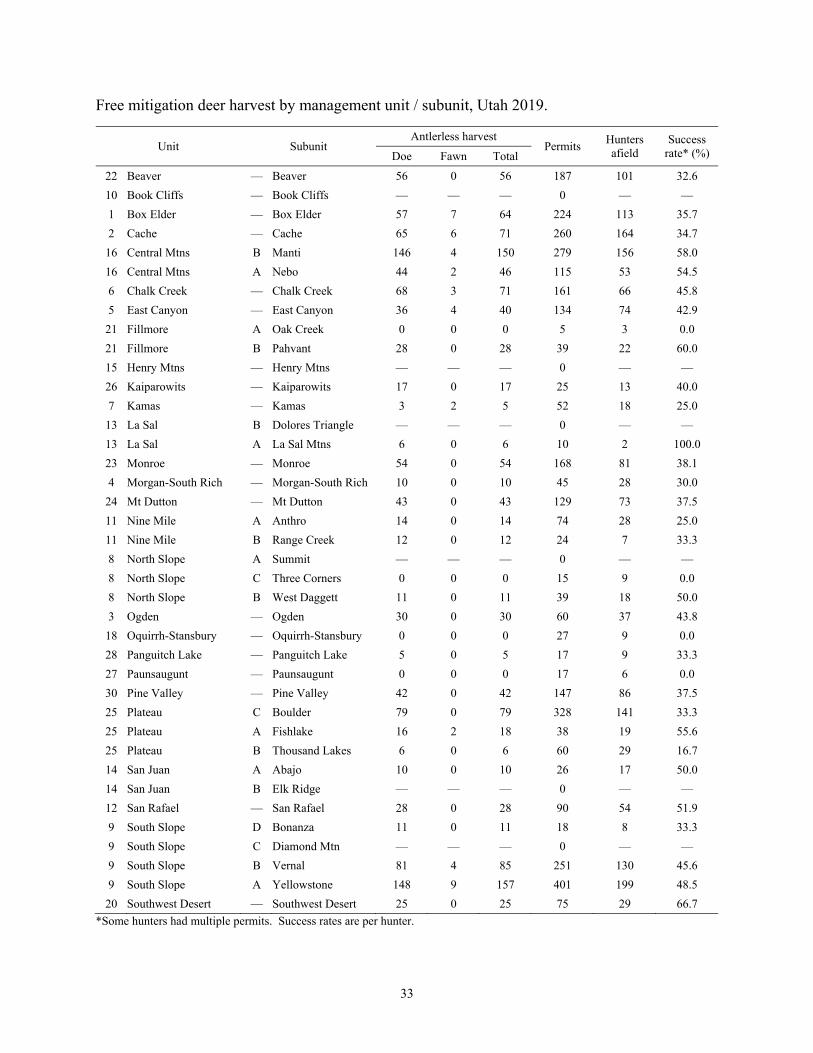
Free mitigation deer harvest by management unit / subunit, Utah 2019.
Unit Subunit Antlerless harvest
Permits Hunters afield
Success rate* (%) Doe Fawn Total
22 Beaver — Beaver 56 0 56 187 101 32.6
10 Book Cliffs — Book Cliffs — — — 0 — —
1 Box Elder — Box Elder 57 7 64 224 113 35.7
2 Cache — Cache 65 6 71 260 164 34.7
16 Central Mtns B Manti 146 4 150 279 156 58.0
16 Central Mtns A Nebo 44 2 46 115 53 54.5
6 Chalk Creek — Chalk Creek 68 3 71 161 66 45.8
5 East Canyon — East Canyon 36 4 40 134 74 42.9
21 Fillmore A Oak Creek 0 0 0 5 3 0.0
21 Fillmore B Pahvant 28 0 28 39 22 60.0
15 Henry Mtns — Henry Mtns — — — 0 — —
26 Kaiparowits — Kaiparowits 17 0 17 25 13 40.0
7 Kamas — Kamas 3 2 5 52 18 25.0
13 La Sal B Dolores Triangle — — — 0 — —
13 La Sal A La Sal Mtns 6 0 6 10 2 100.0
23 Monroe — Monroe 54 0 54 168 81 38.1
4 Morgan-South Rich — Morgan-South Rich 10 0 10 45 28 30.0
24 Mt Dutton — Mt Dutton 43 0 43 129 73 37.5
11 Nine Mile A Anthro 14 0 14 74 28 25.0
11 Nine Mile B Range Creek 12 0 12 24 7 33.3
8 North Slope A Summit — — — 0 — —
8 North Slope C Three Corners 0 0 0 15 9 0.0
8 North Slope B West Daggett 11 0 11 39 18 50.0
3 Ogden — Ogden 30 0 30 60 37 43.8
18 Oquirrh-Stansbury — Oquirrh-Stansbury 0 0 0 27 9 0.0
28 Panguitch Lake — Panguitch Lake 5 0 5 17 9 33.3
27 Paunsaugunt — Paunsaugunt 0 0 0 17 6 0.0
30 Pine Valley — Pine Valley 42 0 42 147 86 37.5
25 Plateau C Boulder 79 0 79 328 141 33.3
25 Plateau A Fishlake 16 2 18 38 19 55.6
25 Plateau B Thousand Lakes 6 0 6 60 29 16.7
14 San Juan A Abajo 10 0 10 26 17 50.0
14 San Juan B Elk Ridge — — — 0 — —
12 San Rafael — San Rafael 28 0 28 90 54 51.9
9 South Slope D Bonanza 11 0 11 18 8 33.3
9 South Slope C Diamond Mtn — — — 0 — —
9 South Slope B Vernal 81 4 85 251 130 45.6
9 South Slope A Yellowstone 148 9 157 401 199 48.5
20 Southwest Desert — Southwest Desert 25 0 25 75 29 66.7
*Some hunters had multiple permits. Success rates are per hunter.
33
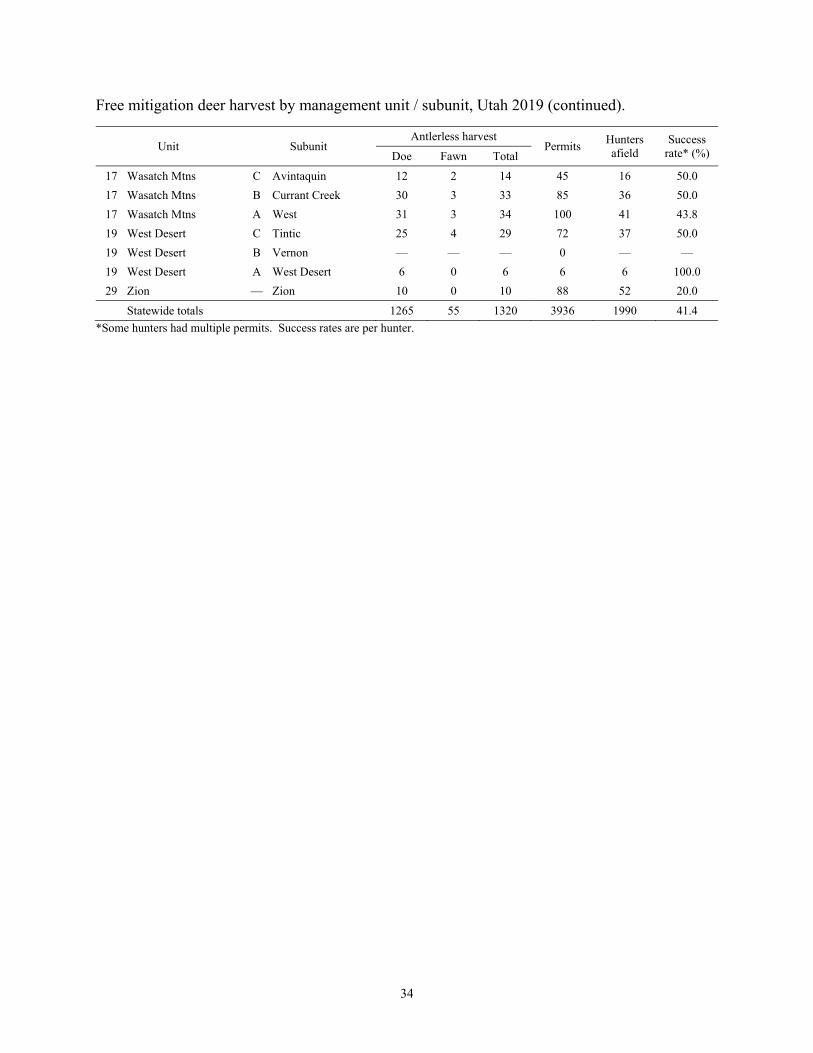
Free mitigation deer harvest by management unit / subunit, Utah 2019 (continued).
Unit Subunit Antlerless harvest
Permits Hunters afield
Success rate* (%) Doe Fawn Total
17 Wasatch Mtns C Avintaquin 12 2 14 45 16 50.0
17 Wasatch Mtns B Currant Creek 30 3 33 85 36 50.0
17 Wasatch Mtns A West 31 3 34 100 41 43.8
19 West Desert C Tintic 25 4 29 72 37 50.0
19 West Desert B Vernon — — — 0 — —
19 West Desert A West Desert 6 0 6 6 6 100.0
29 Zion — Zion 10 0 10 88 52 20.0
Statewide totals 1265 55 1320 3936 1990 41.4
*Some hunters had multiple permits. Success rates are per hunter.
34

Fee mitigation deer harvest by management unit / subunit, Utah 2019.
Unit Subunit Antlerless harvest
Permits Hunters afield
Success rate* (%) Doe Fawn Total
22 Beaver — Beaver 30 2 32 46 44 72.0
10 Book Cliffs — Book Cliffs — — — 0 — —
1 Box Elder — Box Elder 49 4 53 96 94 55.8
2 Cache — Cache 56 4 60 102 91 66.7
16 Central Mtns B Manti 43 5 48 76 71 67.9
16 Central Mtns A Nebo 32 0 32 49 47 68.2
6 Chalk Creek — Chalk Creek 50 7 57 82 77 73.5
5 East Canyon — East Canyon 31 7 38 56 54 70.0
21 Fillmore A Oak Creek 2 0 2 2 2 100.0
21 Fillmore B Pahvant 2 0 2 2 2 100.0
15 Henry Mtns — Henry Mtns — — — 0 — —
26 Kaiparowits — Kaiparowits — — — 0 — —
7 Kamas — Kamas 14 0 14 17 14 100.0
13 La Sal B Dolores Triangle — — — 0 — —
13 La Sal A La Sal Mtns — — — 2 — —
23 Monroe — Monroe 25 0 25 34 32 76.5
4 Morgan-South Rich — Morgan-South Rich 6 0 6 8 8 75.0
24 Mt Dutton — Mt Dutton 15 0 15 30 28 52.9
11 Nine Mile A Anthro 3 0 3 5 5 66.7
11 Nine Mile B Range Creek 1 0 1 10 9 16.7
8 North Slope A Summit — — — 0 — —
8 North Slope C Three Corners — — — 0 — —
8 North Slope B West Daggett 9 0 9 16 16 55.6
3 Ogden — Ogden 7 3 10 16 14 66.7
18 Oquirrh-Stansbury — Oquirrh-Stansbury 8 0 8 15 15 50.0
28 Panguitch Lake — Panguitch Lake — — — 0 — —
27 Paunsaugunt — Paunsaugunt 9 0 9 13 13 66.7
30 Pine Valley — Pine Valley 56 0 56 64 62 90.3
25 Plateau C Boulder 22 0 22 52 47 46.7
25 Plateau A Fishlake — — — 0 — —
25 Plateau B Thousand Lakes — — — 1 — —
14 San Juan A Abajo 8 0 8 8 8 100.0
14 San Juan B Elk Ridge — — — 0 — —
12 San Rafael — San Rafael 16 0 16 22 22 71.4
9 South Slope D Bonanza — — — 0 — —
9 South Slope C Diamond Mtn — — — 0 — —
9 South Slope B Vernal 23 0 23 25 25 90.9
9 South Slope A Yellowstone 16 0 16 23 23 70.0
20 Southwest Desert — Southwest Desert 2 0 2 7 7 33.3
*Some hunters had multiple permits. Success rates are per hunter.
35

Fee mitigation deer harvest by management unit / subunit, Utah 2019 (continued).
Unit Subunit Antlerless harvest
Permits Hunters afield
Success rate* (%) Doe Fawn Total
17 Wasatch Mtns C Avintaquin 16 0 16 18 18 90.9
17 Wasatch Mtns B Currant Creek — — — 5 — —
17 Wasatch Mtns A West — — — 3 — —
19 West Desert C Tintic 10 0 10 13 10 100.0
19 West Desert B Vernon — — — 0 — —
19 West Desert A West Desert 4 0 4 4 4 100.0
29 Zion — Zion 20 0 20 20 20 100.0
Statewide totals 585 32 617 942 882 68.8
*Some hunters had multiple permits. Success rates are per hunter.
36

Historical statewide mule deer population estimates, Utah 1992–2019.
37
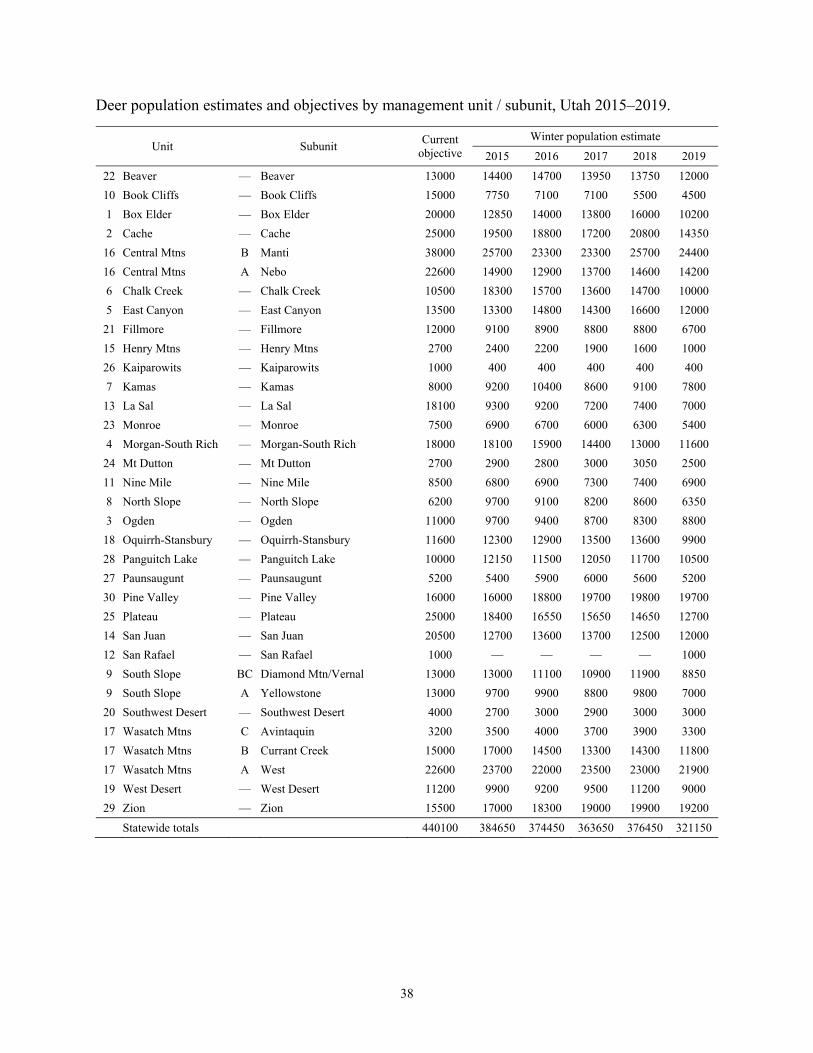
Deer population estimates and objectives by management unit / subunit, Utah 2015–2019.
Unit Subunit Current
objective
Winter population estimate
2015 2016 2017 2018 2019
22 Beaver — Beaver 13000 14400 14700 13950 13750 12000
10 Book Cliffs — Book Cliffs 15000 7750 7100 7100 5500 4500
1 Box Elder — Box Elder 20000 12850 14000 13800 16000 10200
2 Cache — Cache 25000 19500 18800 17200 20800 14350
16 Central Mtns B Manti 38000 25700 23300 23300 25700 24400
16 Central Mtns A Nebo 22600 14900 12900 13700 14600 14200
6 Chalk Creek — Chalk Creek 10500 18300 15700 13600 14700 10000
5 East Canyon — East Canyon 13500 13300 14800 14300 16600 12000
21 Fillmore — Fillmore 12000 9100 8900 8800 8800 6700
15 Henry Mtns — Henry Mtns 2700 2400 2200 1900 1600 1000
26 Kaiparowits — Kaiparowits 1000 400 400 400 400 400
7 Kamas — Kamas 8000 9200 10400 8600 9100 7800
13 La Sal — La Sal 18100 9300 9200 7200 7400 7000
23 Monroe — Monroe 7500 6900 6700 6000 6300 5400
4 Morgan-South Rich — Morgan-South Rich 18000 18100 15900 14400 13000 11600
24 Mt Dutton — Mt Dutton 2700 2900 2800 3000 3050 2500
11 Nine Mile — Nine Mile 8500 6800 6900 7300 7400 6900
8 North Slope — North Slope 6200 9700 9100 8200 8600 6350
3 Ogden — Ogden 11000 9700 9400 8700 8300 8800
18 Oquirrh-Stansbury — Oquirrh-Stansbury 11600 12300 12900 13500 13600 9900
28 Panguitch Lake — Panguitch Lake 10000 12150 11500 12050 11700 10500
27 Paunsaugunt — Paunsaugunt 5200 5400 5900 6000 5600 5200
30 Pine Valley — Pine Valley 16000 16000 18800 19700 19800 19700
25 Plateau — Plateau 25000 18400 16550 15650 14650 12700
14 San Juan — San Juan 20500 12700 13600 13700 12500 12000
12 San Rafael — San Rafael 1000 — — — — 1000
9 South Slope BC Diamond Mtn/Vernal 13000 13000 11100 10900 11900 8850
9 South Slope A Yellowstone 13000 9700 9900 8800 9800 7000
20 Southwest Desert — Southwest Desert 4000 2700 3000 2900 3000 3000
17 Wasatch Mtns C Avintaquin 3200 3500 4000 3700 3900 3300
17 Wasatch Mtns B Currant Creek 15000 17000 14500 13300 14300 11800
17 Wasatch Mtns A West 22600 23700 22000 23500 23000 21900
19 West Desert — West Desert 11200 9900 9200 9500 11200 9000
29 Zion — Zion 15500 17000 18300 19000 19900 19200
Statewide totals 440100 384650 374450 363650 376450 321150
38

Deer survival and population growth rates (lambda) by management unit, Utah 2013–2019.
Unit Year Adult survival* Fawn survival Lambda
Book Cliffs 2013-2014 0.88 — 1.05
2014-2015 0.84 — 1.09
2015-2016 — — —
2016-2017 0.91 — —
2017-2018 0.64 0.54 0.74
2018-2019 0.70 0.61 0.78
Cache 2013-2014 0.82 0.77 1.04
2014-2015 0.92 0.79 1.16
2015-2016 0.84 0.27 0.92
2016-2017 0.71 0.10 0.75
2017-2018 0.91 0.59 1.10
2018-2019 0.67 0.00 0.70
Henry Mtns* 2016-2017 0.82 0.81 1.09
2017-2018 0.86 — 1.00
2018-2019 0.77 — 0.82
Monroe 2013-2014 0.82 0.86 1.12
2014-2015 0.82 0.75 1.07
2015-2016 0.79 0.44 0.93
2016-2017 0.75 0.38 0.84
2017-2018 0.76 0.41 0.86
2018-2019 0.71 0.58 0.85
North Slope 2018-2019 0.68 — 0.74
Oquirrh-Stansbury 2013-2014 0.80 0.78 1.07
2014-2015 0.78 0.61 0.98
2015-2016 0.72 0.27 0.81
2016-2017 0.72 0.18 0.77
2017-2018 0.82 0.81 1.05
2018-2019 0.62 0.35 0.72
Paunsaugunt* 2016-2017 0.85 0.53 1.01
2017-2018 0.80 0.53 0.97
2018-2019 0.88 — 1.01
Pine Valley 2013-2014 0.84 0.93 1.11
2014-2015 0.86 0.90 1.12
2015-2016 0.89 0.41 1.02
2016-2017 0.84 0.50 0.98
2017-2018 0.79 0.43 0.91
2018-2019 0.90 0.53 1.02 *Adult and fawn survival were collected from female deer only, except for the Henry Mtns and Paunsaugunt units where only adult male deer were collared.
39

Deer survival and population growth rates (lambda) by management unit, Utah 2013–2019 (continued).
Unit Year Adult survival Fawn survival Lambda
San Juan 2013-2014 0.86 0.79 1.10
2014-2015 0.84 0.71 1.01
2015-2016 0.80 0.71 1.00
2016-2017 0.75 0.41 0.87
2017-2018 0.73 0.00 0.75
2018-2019 0.76 0.27 0.81
South Slope 2013-2014 0.93 0.83 1.20
2014-2015 0.82 0.93 1.15
2015-2016 0.78 0.31 1.00
2016-2017 0.71 0.18 0.77
2017-2018 0.88 0.75 1.11
2018-2019 0.67 0.24 0.73
Wasatch-Manti 2013-2014 0.82 0.80 1.09
2014-2015 0.83 0.69 1.06
2015-2016 0.81 0.31 0.91
2016-2017 0.88 0.37 1.00
2017-2018 0.83 0.75 1.07
2018-2019 0.83 0.39 0.96
West Desert, Vernon 2018-2019 0.81 0.35 0.92
Zion 2018-2019 0.78 — 0.93
40
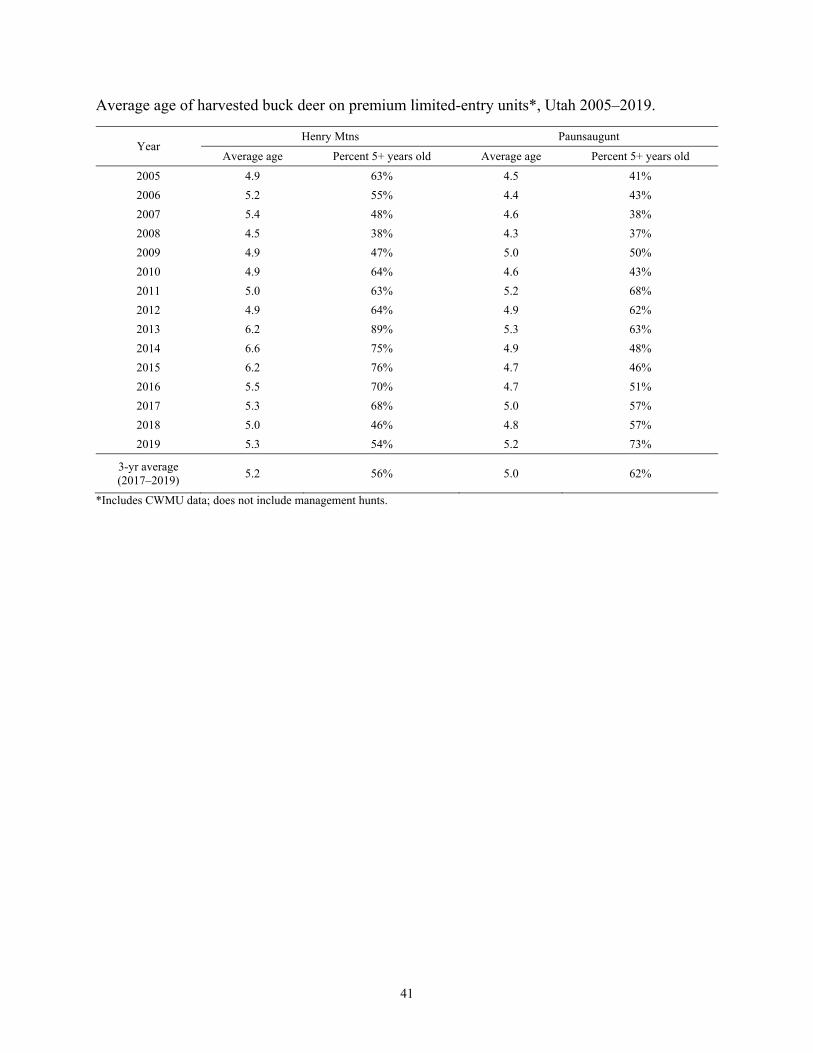
Average age of harvested buck deer on premium limited-entry units*, Utah 2005–2019.
Year Henry Mtns Paunsaugunt
Average age Percent 5+ years old Average age Percent 5+ years old
2005 4.9 63% 4.5 41%
2006 5.2 55% 4.4 43%
2007 5.4 48% 4.6 38%
2008 4.5 38% 4.3 37%
2009 4.9 47% 5.0 50%
2010 4.9 64% 4.6 43%
2011 5.0 63% 5.2 68%
2012 4.9 64% 4.9 62%
2013 6.2 89% 5.3 63%
2014 6.6 75% 4.9 48%
2015 6.2 76% 4.7 46%
2016 5.5 70% 4.7 51%
2017 5.3 68% 5.0 57%
2018 5.0 46% 4.8 57%
2019 5.3 54% 5.2 73%
3-yr average (2017–2019)
5.2 56% 5.0 62%
*Includes CWMU data; does not include management hunts.
41

Number of buck deer / 100 does for general-season public land management units / subunits, Utah 2017–2019.
Unit Subunit Current
objective
Postseason estimate 3-year average 2017 2018 2019
22 Beaver — Beaver 18–20 18 15 15 16.0
1 Box Elder — Box Elder 15–17 19 16 14 16.3
2 Cache — Cache 15–17 15 20 14 16.4
16 Central Mtns B Manti 15–17 13 17 16 15.4
16 Central Mtns A Nebo 15–17 17 16 16 16.2
21 Fillmore — Fillmore 18–20 22 18 14 18.1
26 Kaiparowits — Kaiparowits 18–20 * * * *
7 Kamas — Kamas 18–20 22 24 20 22.2
13 La Sal A La Sal Mtns 15–17 11 17 17 15.2
23 Monroe — Monroe 18–20 14 17 17 16.0
24 Mt Dutton — Mt Dutton 18–20 18 16 17 17.2
11 Nine Mile — Nine Mile 18–20 28 26 19 24.1
8 North Slope — North Slope 18–20 18 20 18 18.6
18 Oquirrh-Stansbury — Oquirrh-Stansbury 15–17 19 19 17 18.1
28 Panguitch Lake — Panguitch Lake 18–20 18 16 15 16.2
30 Pine Valley — Pine Valley 18–20 24 24 21 23.0
25 Plateau C Boulder 18–20 17 13 13 14.4
25 Plateau A Fishlake 18–20 15 18 17 17.0
25 Plateau B Thousand Lakes 18–20 32 26 14 24.0
14 San Juan A Abajo 15–17 22 18 14 18.1
12 San Rafael — San Rafael * * * * *
9 South Slope BD Bonanza/Vernal 15–17 19 23 14 18.7
9 South Slope A Yellowstone 18–20 18 22 20 20.2
20 Southwest Desert — Southwest Desert 18–20 24 21 20 21.5
17 Wasatch Mtns BC East 18–20 19 19 19 18.8
17 Wasatch Mtns A West 15–17 16 16 16 16.0
19 West Desert AC West Desert, Other 15–17 13 13 35 23.8
29 Zion — Zion 18–20 23 23 19 21.5
*Insufficient data.
42

Number of buck deer / 100 does for general-season private land management units / subunits, Utah 2017–2019.
Unit Subunit Current
objective
Postseason estimate 3-year average 2017 2018 2019
6 Chalk Creek — Chalk Creek 18–20 27 30 25 27.4
5 East Canyon — East Canyon 18–20 24 34 24 27.6
4 Morgan-South Rich — Morgan-South Rich 18–20 23 36 30 29.4
3 Ogden — Ogden 18–20 16 20 16 17.3
Number of buck deer / 100 does for limited-entry management units / subunits, Utah 2017–2019.
Unit Subunit Current
objective
Postseason estimate 3-year average 2017 2018 2019
10 Book Cliffs AC North 25–35 33 42 34 36.4
10 Book Cliffs B South 25–35 36 35 27 32.4
2 Cache B Crawford Mtn 25–35 18 27 20 21.6
21 Fillmore A Oak Creek 25–35 29 49 27 35.0
13 La Sal B Dolores Triangle 25–35 42 28 33 34.2
14 San Juan B Elk Ridge 25–35 30 44 24 32.8
9 South Slope C Diamond Mtn 25–35 34 34 35 34.4
19 West Desert B Vernon 25–35 44 29 41 38.0
Number of buck deer / 100 does for premium limited-entry management units / subunits, Utah 2017–2019.
Unit Subunit Current
objective
Postseason estimate 3-year average 2017 2018 2019
15 Henry Mtns — Henry Mtns 40–55 41 44 37 40.8
27 Paunsaugunt — Paunsaugunt 40–55 48 49 42 46.5
43

Number of fawn deer / 100 does by management unit / subunit, Utah 2010–2019.
Unit Subunit Postseason estimate
2010 2011 2012 2013 2014 2015 2016 2017 2018 2019
22 Beaver — Beaver 48 61 57 61 60 64 57 45 49 48
10 Book Cliffs AC North 50 50 52 44 57 59 46 42 28 36
10 Book Cliffs B South 46 44 41 39 49 41 27 29 27 44
1 Box Elder — Box Elder 64 70 56 52 63 65 58 56 57 52
2 Cache A Cache 81 72 85 58 61 64 65 67 78 55
2 Cache B Crawford Mtn 62 72 98 117 69 58 66 70 74 51
16 Central Mtns B Manti 73 64 72 65 67 69 64 63 65 56
16 Central Mtns A Nebo 73 52 58 61 57 52 66 64 58 54
6 Chalk Creek — Chalk Creek 71 64 73 63 68 65 60 70 57 55
5 East Canyon — East Canyon 75 61 84 47 64 68 61 79 71 52
21 Fillmore A Oak Creek 25 44 44 50 62 62 56 45 63 41
21 Fillmore B Pahvant 42 57 58 58 65 59 48 49 49 42
15 Henry Mtns — Henry Mtns 62 54 74 60 81 76 65 53 38 57
26 Kaiparowits — Kaiparowits * * * * * * * * * *
7 Kamas — Kamas 76 65 75 64 67 64 79 55 61 48
13 La Sal B Dolores Triangle 26 35 65 65 47 64 40 56 28 41
13 La Sal A La Sal Mtns 40 53 48 53 56 46 47 24 22 34
23 Monroe — Monroe 38 66 69 70 66 64 50 52 51 43
4 Morgan-South Rich — Morgan-South Rich 84 61 86 50 67 62 61 72 64 44
24 Mt Dutton — Mt Dutton 48 64 66 67 56 56 51 64 45 48
11 Nine Mile A Anthro 47 61 63 73 78 78 70 55 46 57
11 Nine Mile B Range Creek 60 65 58 49 60 65 50 58 37 50
8 North Slope A Summit * * * * * * * * * *
8 North Slope BC Three Corners/West Daggett 81 61 64 63 65 73 57 55 46 58
3 Ogden — Ogden 87 67 78 63 69 63 57 63 60 63
18 Oquirrh-Stansbury — Oquirrh-Stansbury 61 61 54 69 68 66 57 56 57 39
*Insufficient data.
44

Number of fawn deer / 100 does by management unit / subunit, Utah 2010–2019 (continued).
Unit Subunit Postseason estimate
2010 2011 2012 2013 2014 2015 2016 2017 2018 2019
28 Panguitch Lake — Panguitch Lake 54 57 70 63 58 65 66 51 59 62
27 Paunsaugunt — Paunsaugunt 53 63 59 52 64 65 60 63 48 55
30 Pine Valley — Pine Valley 55 66 60 59 58 61 57 57 46 60
25 Plateau C Boulder 61 64 70 57 57 65 56 69 47 52
25 Plateau A Fishlake 42 52 61 70 62 71 44 57 46 45
25 Plateau B Thousand Lakes 38 66 42 61 58 63 50 55 63 62
14 San Juan A Abajo 52 57 53 62 52 57 55 51 32 44
14 San Juan B Elk Ridge 32 33 42 51 38 43 48 28 27 35
12 San Rafael — San Rafael * * * * * * * * * *
9 South Slope C Diamond Mtn 79 63 68 70 74 82 68 58 51 56
9 South Slope B Vernal 63 61 72 60 78 76 65 64 58 50
9 South Slope A Yellowstone 66 47 63 67 64 69 64 64 62 47
20 Southwest Desert — Southwest Desert 41 53 44 48 46 48 48 49 32 50
17 Wasatch Mtns C Avintaquin 69 67 65 65 67 64 58 67 30 57
17 Wasatch Mtns B Currant Creek 65 52 79 70 81 61 64 72 59 65
17 Wasatch Mtns A Salt Lake 62 * 66 68 * 72 72 59 63 *
17 Wasatch Mtns A West 79 74 71 76 70 73 75 68 66 58
19 West Desert B Vernon 78 77 61 55 85 67 69 67 63 56
19 West Desert AC West Desert, Other 73 60 * 54 * * * * 43 73
29 Zion — Zion 63 69 62 59 56 61 63 60 57 59
Statewide averages 63 61 65 62 64 63 59 59 52 53
*Insufficient data.
45

Deer classification data by management unit / subunit, Utah 2010–2019. Beaver
Year
Postseason Spring
n Fawns / 100 does
Fawns / 100 adults
Bucks / 100 does
% bucks > 3 pts.
n Fawns /
100 adults
2010–11 839 48 41 18 62 — —
2011–12 970 61 53 16 50 — —
2012–13 646 57 49 16 41 — —
2013–14 894 61 52 18 35 — —
2014–15 1047 60 50 19 34 — —
2015–16 757 64 52 22 36 — —
2016–17 833 57 45 25 49 — —
2017–18 715 45 38 18 50 — —
2018–19 978 49 43 15 59 — —
2019–20 838 48 42 15 53 — —
Book Cliffs, North
Year
Postseason Spring
n Fawns / 100 does
Fawns / 100 adults
Bucks / 100 does
% bucks > 3 pts.
n Fawns /
100 adults
2010–11 869 50 38 32 56 830 19
2011–12 1468 50 38 31 53 952 32
2012–13 1120 52 41 27 43 974 29
2013–14 683 44 33 33 53 1150 33
2014–15 1270 57 41 39 45 862 32
2015–16 1011 59 44 34 48 600 36
2016–17 1367 46 34 34 44 977 27
2017–18 950 42 32 33 54 — —
2018–19 1127 28 20 42 53 239 17
2019–20 735 36 27 34 78 — —
46

Deer classification data by management unit / subunit, Utah 2010–2019 (continued). Book Cliffs, South
Year
Postseason Spring
n Fawns / 100 does
Fawns / 100 adults
Bucks / 100 does
% bucks > 3 pts.
n Fawns /
100 adults
2010–11 588 46 32 47 63 488 26
2011–12 508 44 30 49 60 580 28
2012–13 522 41 30 37 47 480 26
2013–14 443 39 28 41 54 448 20
2014–15 601 49 35 40 50 220 26
2015–16 473 41 31 30 39 492 22
2016–17 440 27 21 28 44 192 16
2017–18 367 29 22 36 60 572 15
2018–19 522 27 20 35 63 — —
2019–20 448 44 35 27 77 — —
Box Elder
Year
Postseason Spring
n Fawns / 100 does
Fawns / 100 adults
Bucks / 100 does
% bucks > 3 pts.
n Fawns /
100 adults
2010–11 774 64 53 21 53 — —
2011–12 1008 70 58 20 43 — —
2012–13 1387 56 49 15 30 1086 46
2013–14 776 52 47 12 27 578 44
2014–15 786 63 53 18 30 893 45
2015–16 936 65 54 21 40 918 33
2016–17 1059 58 49 19 40 92 19
2017–18 707 56 47 19 39 — —
2018–19 733 57 49 16 29 215 47
2019–20 709 52 46 14 42 — —
47

Deer classification data by management unit / subunit, Utah 2010–2019 (continued). Cache
Year
Postseason Spring
n Fawns / 100 does
Fawns / 100 adults
Bucks / 100 does
% bucks > 3 pts.
n Fawns /
100 adults
2010–11 1467 81 66 23 38 465 13
2011–12 914 72 64 12 41 650 59
2012–13 827 85 74 16 48 761 52
2013–14 2666 58 52 13 48 892 55
2014–15 889 61 51 19 46 805 60
2015–16 764 64 53 20 30 595 41
2016–17 634 65 57 15 57 336 19
2017–18 901 67 58 15 51 369 45
2018–19 916 78 65 20 25 496 10
2019–20 1137 55 48 14 49 — —
Cache, Crawford Mtn
Year
Postseason Spring
n Fawns / 100 does
Fawns / 100 adults
Bucks / 100 does
% bucks > 3 pts.
n Fawns /
100 adults
2010–11 138 62 53 17 38 32 7
2011–12 192 72 63 15 40 — —
2012–13 96 98 85 16 57 95 51
2013–14 125 117 95 23 42 80 95
2014–15 119 69 57 23 64 — —
2015–16 153 58 42 40 42 — —
2016–17 181 66 51 30 36 — —
2017–18 126 70 59 18 58 — —
2018–19 243 74 58 27 46 90 43
2019–20 289 51 43 20 61 — —
48

Deer classification data by management unit / subunit, Utah 2010–2019 (continued). Central Mtns, Manti (Central Region)
Year
Postseason Spring
n Fawns / 100 does
Fawns / 100 adults
Bucks / 100 does
% bucks > 3 pts.
n Fawns /
100 adults
2010–11 2494 84 75 12 47 275 42
2011–12 1454 70 63 11 36 382 78
2012–13 1206 79 70 13 39 280 53
2013–14 1433 73 63 16 69 232 59
2014–15 1389 73 62 18 34 — —
2015–16 1623 72 61 19 27 279 42
2016–17 2003 73 64 14 42 — —
2017–18 1157 66 60 11 25 — —
2018–19 1985 80 68 17 29 — —
2019–20 1722 62 56 12 41 — —
Central Mtns, Manti (Southeastern Region)
Year
Postseason Spring
n Fawns / 100 does
Fawns / 100 adults
Bucks / 100 does
% bucks > 3 pts.
n Fawns /
100 adults
2010–11 2215 61 53 16 46 4122 42
2011–12 1700 58 50 16 45 2066 40
2012–13 1841 68 58 17 35 3161 47
2013–14 1937 60 50 21 25 2296 47
2014–15 2009 62 49 26 35 856 43
2015–16 2111 58 46 27 39 1489 33
2016–17 2212 56 48 17 36 1619 29
2017–18 1237 60 52 15 33 2580 40
2018–19 1966 53 45 17 32 2584 31
2019–20 1395 49 41 21 36 — —
49

Deer classification data by management unit / subunit, Utah 2010–2019 (continued). Central Mtns, Nebo
Year
Postseason Spring
n Fawns / 100 does
Fawns / 100 adults
Bucks / 100 does
% bucks > 3 pts.
n Fawns /
100 adults
2010–11 824 73 64 14 36 — —
2011–12 2022 52 47 10 34 — —
2012–13 1264 58 51 14 35 — —
2013–14 612 61 50 21 26 — —
2014–15 1286 57 49 18 29 — —
2015–16 1237 52 45 16 30 — —
2016–17 570 66 57 15 42 — —
2017–18 365 64 55 17 47 — —
2018–19 1185 58 50 16 29 — —
2019–20 808 54 47 16 31 — —
Chalk Creek
Year
Postseason Spring
n Fawns / 100 does
Fawns / 100 adults
Bucks / 100 does
% bucks > 3 pts.
n Fawns /
100 adults
2010–11 1067 71 53 34 58 — —
2011–12 886 64 49 32 59 816 45
2012–13 927 73 55 32 57 1022 48
2013–14 798 63 47 33 45 766 52
2014–15 1110 68 50 36 48 919 55
2015–16 1099 65 46 42 42 629 37
2016–17 821 60 46 31 64 527 31
2017–18 1060 70 55 27 55 725 49
2018–19 851 57 44 30 58 796 27
2019–20 841 55 44 25 52 — —
50
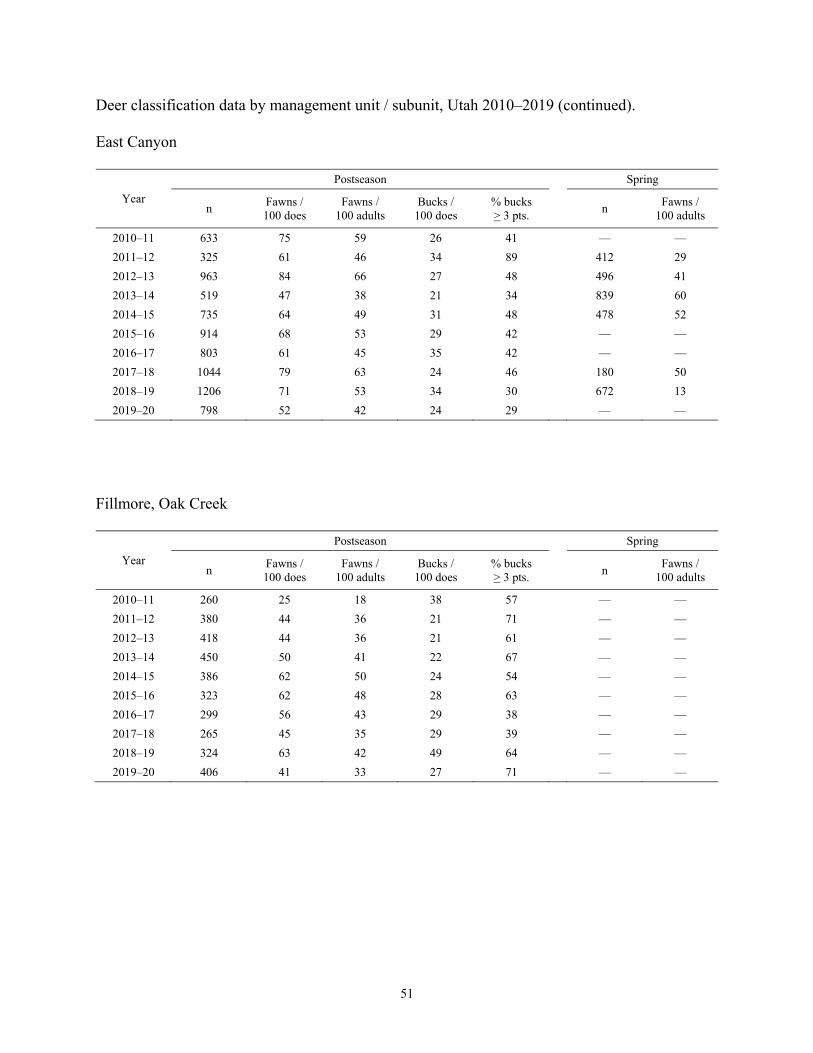
Deer classification data by management unit / subunit, Utah 2010–2019 (continued). East Canyon
Year
Postseason Spring
n Fawns / 100 does
Fawns / 100 adults
Bucks / 100 does
% bucks > 3 pts.
n Fawns /
100 adults
2010–11 633 75 59 26 41 — —
2011–12 325 61 46 34 89 412 29
2012–13 963 84 66 27 48 496 41
2013–14 519 47 38 21 34 839 60
2014–15 735 64 49 31 48 478 52
2015–16 914 68 53 29 42 — —
2016–17 803 61 45 35 42 — —
2017–18 1044 79 63 24 46 180 50
2018–19 1206 71 53 34 30 672 13
2019–20 798 52 42 24 29 — —
Fillmore, Oak Creek
Year
Postseason Spring
n Fawns / 100 does
Fawns / 100 adults
Bucks / 100 does
% bucks > 3 pts.
n Fawns /
100 adults
2010–11 260 25 18 38 57 — —
2011–12 380 44 36 21 71 — —
2012–13 418 44 36 21 61 — —
2013–14 450 50 41 22 67 — —
2014–15 386 62 50 24 54 — —
2015–16 323 62 48 28 63 — —
2016–17 299 56 43 29 38 — —
2017–18 265 45 35 29 39 — —
2018–19 324 63 42 49 64 — —
2019–20 406 41 33 27 71 — —
51

Deer classification data by management unit / subunit, Utah 2010–2019 (continued). Fillmore, Pahvant
Year
Postseason Spring
n Fawns / 100 does
Fawns / 100 adults
Bucks / 100 does
% bucks > 3 pts.
n Fawns /
100 adults
2010–11 803 42 37 15 69 — —
2011–12 872 57 49 17 52 — —
2012–13 958 58 50 16 49 — —
2013–14 833 58 47 24 43 — —
2014–15 1006 65 55 20 38 — —
2015–16 858 59 47 24 46 — —
2016–17 721 48 38 27 37 — —
2017–18 796 49 40 22 45 — —
2018–19 874 49 42 18 37 — —
2019–20 756 42 37 14 41 — —
Henry Mtns
Year
Postseason Spring
n Fawns / 100 does
Fawns / 100 adults
Bucks / 100 does
% bucks > 3 pts.
n Fawns /
100 adults
2010–11 451 62 39 59 86 278 24
2011–12 374 54 34 61 78 333 29
2012–13 437 74 49 52 73 363 31
2013–14 495 60 39 55 75 478 34
2014–15 661 81 55 48 68 382 43
2015–16 451 76 46 65 67 446 42
2016–17 513 65 45 47 53 220 26
2017–18 386 53 38 41 75 448 34
2018–19 454 38 26 44 64 339 20
2019–20 411 57 42 37 77 — —
52
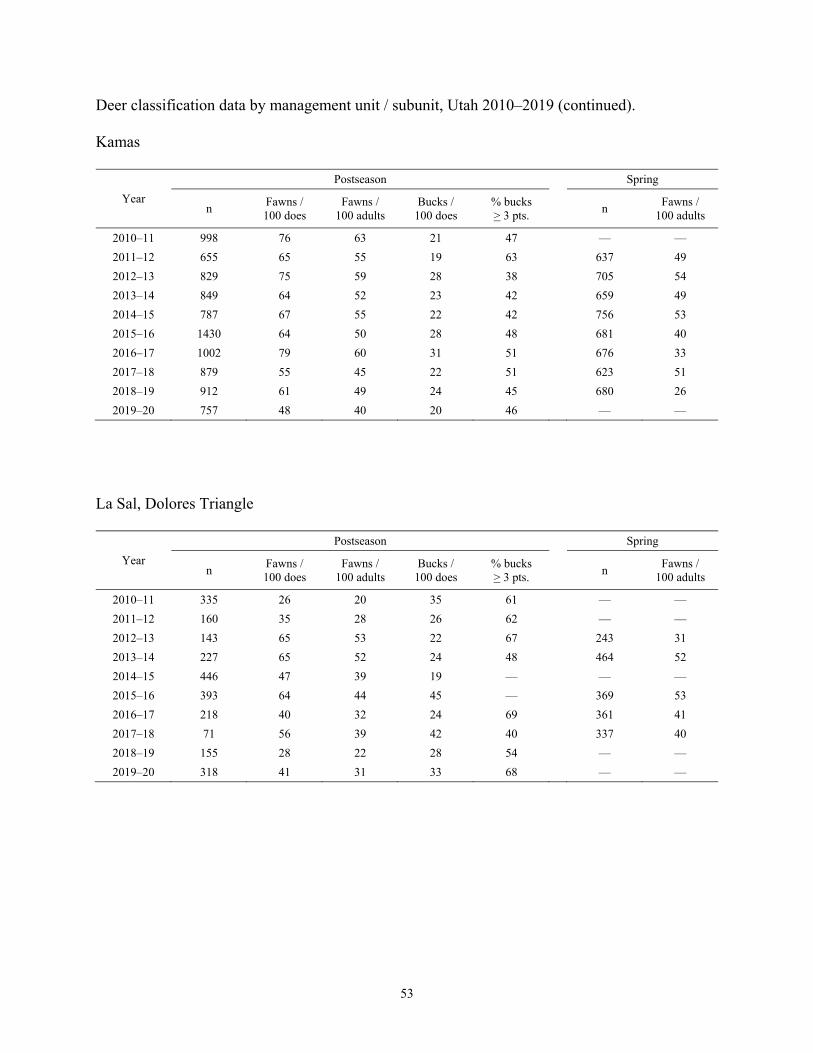
Deer classification data by management unit / subunit, Utah 2010–2019 (continued). Kamas
Year
Postseason Spring
n Fawns / 100 does
Fawns / 100 adults
Bucks / 100 does
% bucks > 3 pts.
n Fawns /
100 adults
2010–11 998 76 63 21 47 — —
2011–12 655 65 55 19 63 637 49
2012–13 829 75 59 28 38 705 54
2013–14 849 64 52 23 42 659 49
2014–15 787 67 55 22 42 756 53
2015–16 1430 64 50 28 48 681 40
2016–17 1002 79 60 31 51 676 33
2017–18 879 55 45 22 51 623 51
2018–19 912 61 49 24 45 680 26
2019–20 757 48 40 20 46 — —
La Sal, Dolores Triangle
Year
Postseason Spring
n Fawns / 100 does
Fawns / 100 adults
Bucks / 100 does
% bucks > 3 pts.
n Fawns /
100 adults
2010–11 335 26 20 35 61 — —
2011–12 160 35 28 26 62 — —
2012–13 143 65 53 22 67 243 31
2013–14 227 65 52 24 48 464 52
2014–15 446 47 39 19 — — —
2015–16 393 64 44 45 — 369 53
2016–17 218 40 32 24 69 361 41
2017–18 71 56 39 42 40 337 40
2018–19 155 28 22 28 54 — —
2019–20 318 41 31 33 68 — —
53

Deer classification data by management unit / subunit, Utah 2010–2019 (continued). La Sal, La Sal Mtns
Year
Postseason Spring
n Fawns / 100 does
Fawns / 100 adults
Bucks / 100 does
% bucks > 3 pts.
n Fawns /
100 adults
2010–11 511 40 35 15 68 613 30
2011–12 381 53 43 23 44 409 40
2012–13 503 48 43 11 40 601 41
2013–14 598 53 45 17 44 784 41
2014–15 536 56 49 14 62 501 44
2015–16 537 46 39 18 48 608 35
2016–17 480 47 40 17 59 578 29
2017–18 497 24 21 11 46 842 29
2018–19 543 22 19 17 37 660 20
2019–20 410 34 29 17 59 — —
Monroe
Year
Postseason Spring
n Fawns / 100 does
Fawns / 100 adults
Bucks / 100 does
% bucks > 3 pts.
n Fawns /
100 adults
2010–11 1169 38 34 12 43 977 27
2011–12 1293 66 58 14 44 840 40
2012–13 1443 69 58 18 36 1220 42
2013–14 1930 70 57 23 33 1098 43
2014–15 1863 66 54 22 43 561 39
2015–16 1594 64 53 22 44 1427 30
2016–17 1275 50 42 19 46 1112 28
2017–18 920 52 45 14 49 — —
2018–19 1135 51 44 17 38 1111 30
2019–20 931 43 37 17 45 — —
54

Deer classification data by management unit / subunit, Utah 2010–2019 (continued). Morgan-South Rich
Year
Postseason Spring
n Fawns / 100 does
Fawns / 100 adults
Bucks / 100 does
% bucks > 3 pts.
n Fawns /
100 adults
2010–11 547 84 59 41 46 — —
2011–12 315 61 44 39 89 489 30
2012–13 1243 86 61 40 50 498 36
2013–14 454 50 40 27 29 780 56
2014–15 915 67 50 33 45 752 57
2015–16 837 62 44 42 37 — —
2016–17 817 61 46 33 51 — —
2017–18 962 72 59 23 47 251 43
2018–19 1195 64 47 36 23 505 22
2019–20 736 44 34 30 35 — —
Mt Dutton
Year
Postseason Spring
n Fawns / 100 does
Fawns / 100 adults
Bucks / 100 does
% bucks > 3 pts.
n Fawns /
100 adults
2010–11 311 48 43 13 56 — —
2011–12 349 64 54 18 54 — —
2012–13 695 66 58 14 36 — —
2013–14 631 67 55 22 43 — —
2014–15 875 56 46 23 51 — —
2015–16 934 56 46 22 50 — —
2016–17 778 51 42 21 49 — —
2017–18 489 64 54 18 55 — —
2018–19 264 45 38 16 56 — —
2019–20 553 48 41 17 42 — —
55

Deer classification data by management unit / subunit, Utah 2010–2019 (continued). Nine Mile, Anthro
Year
Postseason Spring
n Fawns / 100 does
Fawns / 100 adults
Bucks / 100 does
% bucks > 3 pts.
n Fawns /
100 adults
2010–11 227 47 39 20 44 42 24
2011–12 294 61 48 27 60 132 36
2012–13 224 63 49 28 33 44 57
2013–14 353 73 61 20 42 194 60
2014–15 480 78 57 36 44 — —
2015–16 339 78 58 34 43 — —
2016–17 358 70 53 31 43 — —
2017–18 202 55 42 30 48 — —
2018–19 260 46 33 37 47 — —
2019–20 248 57 47 22 68 — —
Nine Mile, Range Creek
Year
Postseason Spring
n Fawns / 100 does
Fawns / 100 adults
Bucks / 100 does
% bucks > 3 pts.
n Fawns /
100 adults
2010–11 519 60 52 16 37 1127 30
2011–12 684 65 53 22 49 588 32
2012–13 738 58 47 24 41 822 37
2013–14 713 49 40 24 39 726 34
2014–15 726 60 48 25 42 516 40
2015–16 681 65 50 31 46 1230 38
2016–17 791 50 40 25 42 1056 28
2017–18 374 58 46 26 49 1001 28
2018–19 573 37 30 21 36 1029 20
2019–20 765 50 42 18 38 — —
56

Deer classification data by management unit / subunit, Utah 2010–2019 (continued). North Slope, Three Corners/West Daggett
Year
Postseason Spring
n Fawns / 100 does
Fawns / 100 adults
Bucks / 100 does
% bucks > 3 pts.
n Fawns /
100 adults
2010–11 1194 81 68 19 38 1439 49
2011–12 965 61 52 18 47 1189 46
2012–13 1017 64 56 16 42 1072 43
2013–14 1031 63 55 15 40 1872 42
2014–15 1147 65 55 17 26 1393 43
2015–16 1231 73 59 24 39 894 44
2016–17 958 57 48 21 44 1070 32
2017–18 986 55 47 18 47 822 39
2018–19 1038 46 39 20 38 1261 23
2019–20 946 58 49 18 46 — —
Ogden
Year
Postseason Spring
n Fawns / 100 does
Fawns / 100 adults
Bucks / 100 does
% bucks > 3 pts.
n Fawns /
100 adults
2010–11 847 87 78 12 33 448 15
2011–12 932 67 56 20 57 125 65
2012–13 824 78 65 20 49 642 68
2013–14 641 63 53 19 46 809 77
2014–15 1099 69 59 18 46 587 62
2015–16 885 63 51 25 43 562 60
2016–17 909 57 47 21 44 — —
2017–18 790 63 55 16 61 — —
2018–19 873 60 50 20 38 — —
2019–20 896 63 54 16 31 — —
57

Deer classification data by management unit / subunit, Utah 2010–2019 (continued). Oquirrh-Stansbury
Year
Postseason Spring
n Fawns / 100 does
Fawns / 100 adults
Bucks / 100 does
% bucks > 3 pts.
n Fawns /
100 adults
2010–11 699 61 52 17 45 703 39
2011–12 1072 61 53 15 46 545 46
2012–13 558 54 48 12 37 878 35
2013–14 696 69 58 20 34 789 53
2014–15 702 68 58 18 44 — —
2015–16 568 66 52 27 46 — —
2016–17 552 57 46 23 52 — —
2017–18 959 56 48 19 48 — —
2018–19 851 57 48 19 40 — —
2019–20 649 39 34 17 55 — —
Panguitch Lake
Year
Postseason Spring
n Fawns / 100 does
Fawns / 100 adults
Bucks / 100 does
% bucks > 3 pts.
n Fawns /
100 adults
2010–11 986 54 46 17 51 — —
2011–12 1401 57 48 18 48 — —
2012–13 1613 70 59 19 35 — —
2013–14 2455 63 53 20 38 — —
2014–15 1826 58 49 19 42 — —
2015–16 1565 65 54 21 33 — —
2016–17 1614 66 55 19 46 — —
2017–18 1516 51 43 18 42 — —
2018–19 2086 59 51 16 42 — —
2019–20 1788 62 54 15 43 — —
58

Deer classification data by management unit / subunit, Utah 2010–2019 (continued). Paunsaugunt
Year
Postseason Spring
n Fawns / 100 does
Fawns / 100 adults
Bucks / 100 does
% bucks > 3 pts.
n Fawns /
100 adults
2010–11 547 53 36 47 75 — —
2011–12 587 63 43 47 70 — —
2012–13 605 59 41 44 54 — —
2013–14 758 52 37 42 64 — —
2014–15 757 64 44 46 55 — —
2015–16 861 65 44 49 60 — —
2016–17 998 60 40 51 68 — —
2017–18 896 63 42 48 68 — —
2018–19 847 48 32 49 64 — —
2019–20 879 55 38 42 62 — —
Pine Valley
Year
Postseason Spring
n Fawns / 100 does
Fawns / 100 adults
Bucks / 100 does
% bucks > 3 pts.
n Fawns /
100 adults
2010–11 1489 55 48 16 53 1358 45
2011–12 1849 66 57 18 39 1226 52
2012–13 2096 60 48 24 47 1521 47
2013–14 2460 59 49 21 42 1762 49
2014–15 1967 58 48 20 49 — —
2015–16 2698 61 48 26 46 — —
2016–17 2097 57 46 24 45 — —
2017–18 1865 57 46 24 51 — —
2018–19 2363 46 37 24 49 — —
2019–20 1785 60 49 21 52 — —
59

Deer classification data by management unit / subunit, Utah 2010–2019 (continued). Plateau, Boulder
Year
Postseason Spring
n Fawns / 100 does
Fawns / 100 adults
Bucks / 100 does
% bucks > 3 pts.
n Fawns /
100 adults
2010–11 777 61 54 14 47 — —
2011–12 911 64 55 16 41 — —
2012–13 472 70 56 25 40 — —
2013–14 729 57 49 16 29 — —
2014–15 1138 57 48 20 45 — —
2015–16 1233 65 54 21 39 — —
2016–17 1023 56 48 16 46 — —
2017–18 727 69 59 17 35 — —
2018–19 651 47 42 13 37 — —
2019–20 677 52 46 13 43 — —
Plateau, Fishlake
Year
Postseason Spring
n Fawns / 100 does
Fawns / 100 adults
Bucks / 100 does
% bucks > 3 pts.
n Fawns /
100 adults
2010–11 715 42 37 12 60 — —
2011–12 612 52 44 19 55 — —
2012–13 1118 61 53 14 43 — —
2013–14 846 70 59 19 43 — —
2014–15 913 62 51 23 51 — —
2015–16 711 71 58 24 41 — —
2016–17 833 44 37 18 58 — —
2017–18 679 57 50 15 57 — —
2018–19 537 46 39 18 45 — —
2019–20 711 45 38 17 59 — —
60

Deer classification data by management unit / subunit, Utah 2010–2019 (continued). Plateau, Thousand Lakes
Year
Postseason Spring
n Fawns / 100 does
Fawns / 100 adults
Bucks / 100 does
% bucks > 3 pts.
n Fawns /
100 adults
2010–11 291 38 32 20 54 — —
2011–12 346 66 52 27 65 — —
2012–13 282 42 36 17 50 — —
2013–14 427 61 49 25 47 — —
2014–15 672 58 45 28 55 — —
2015–16 257 63 45 40 57 — —
2016–17 291 50 41 21 58 — —
2017–18 193 55 42 32 39 — —
2018–19 255 63 50 26 34 — —
2019–20 151 62 54 14 33 — —
San Juan, Abajo
Year
Postseason Spring
n Fawns / 100 does
Fawns / 100 adults
Bucks / 100 does
% bucks > 3 pts.
n Fawns /
100 adults
2010–11 886 52 45 14 74 800 40
2011–12 681 57 48 19 49 575 45
2012–13 896 53 47 14 33 797 44
2013–14 1498 62 53 18 42 811 51
2014–15 999 52 43 20 41 — —
2015–16 1663 57 46 24 44 — —
2016–17 1343 55 45 23 39 — —
2017–18 825 51 41 22 49 799 25
2018–19 1079 32 27 18 41 945 27
2019–20 672 44 39 14 60 — —
61

Deer classification data by management unit / subunit, Utah 2010–2019 (continued). San Juan, Elk Ridge
Year
Postseason Spring
n Fawns / 100 does
Fawns / 100 adults
Bucks / 100 does
% bucks > 3 pts.
n Fawns /
100 adults
2010–11 290 32 23 38 77 333 20
2011–12 231 33 23 42 59 294 21
2012–13 174 42 34 24 80 275 29
2013–14 222 51 41 24 70 412 36
2014–15 174 38 28 36 64 — —
2015–16 138 43 30 43 63 — —
2016–17 187 48 34 43 45 — —
2017–18 261 28 21 30 54 264 18
2018–19 332 27 19 44 59 167 25
2019–20 230 35 28 24 83 — —
South Slope, Bonanza/Vernal
Year
Postseason Spring
n Fawns / 100 does
Fawns / 100 adults
Bucks / 100 does
% bucks > 3 pts.
n Fawns /
100 adults
2010–11 770 63 55 15 42 706 47
2011–12 1081 61 55 11 34 820 49
2012–13 892 72 66 10 42 879 36
2013–14 822 60 53 13 36 1309 47
2014–15 1205 78 67 17 33 952 54
2015–16 1267 76 65 18 31 766 45
2016–17 1274 65 56 17 35 1177 34
2017–18 1449 64 54 19 51 345 53
2018–19 811 58 47 23 42 213 47
2019–20 846 50 44 14 41 — —
62
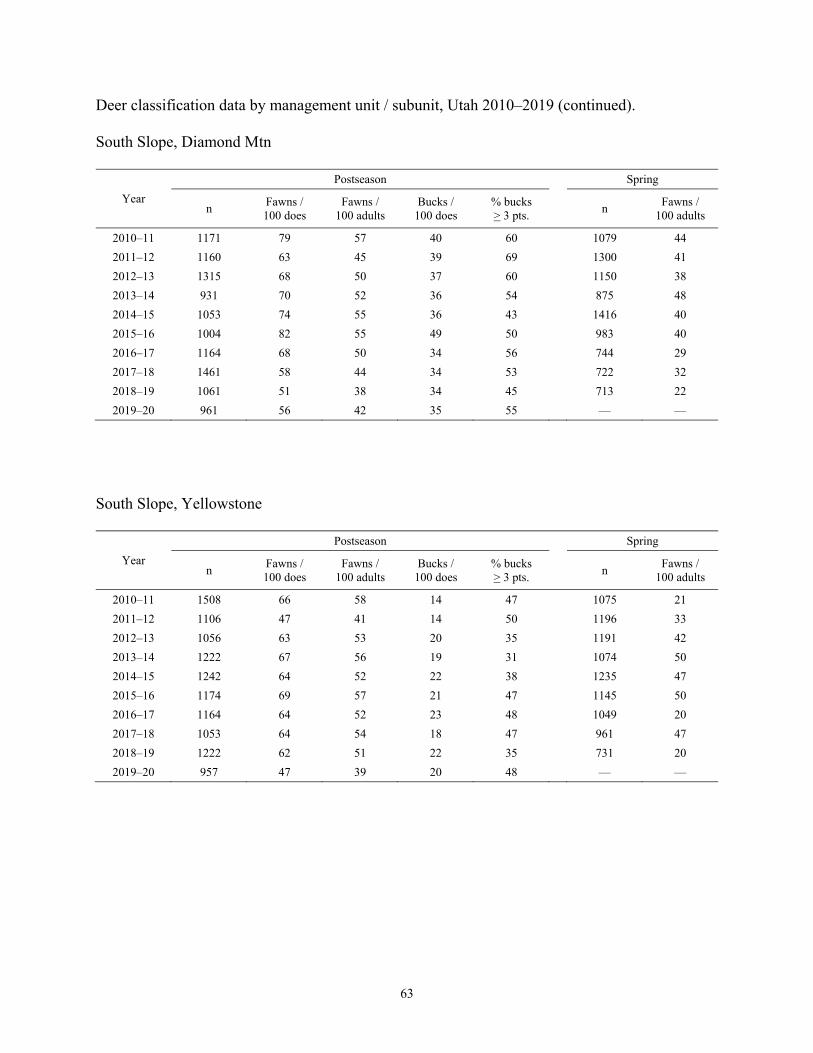
Deer classification data by management unit / subunit, Utah 2010–2019 (continued). South Slope, Diamond Mtn
Year
Postseason Spring
n Fawns / 100 does
Fawns / 100 adults
Bucks / 100 does
% bucks > 3 pts.
n Fawns /
100 adults
2010–11 1171 79 57 40 60 1079 44
2011–12 1160 63 45 39 69 1300 41
2012–13 1315 68 50 37 60 1150 38
2013–14 931 70 52 36 54 875 48
2014–15 1053 74 55 36 43 1416 40
2015–16 1004 82 55 49 50 983 40
2016–17 1164 68 50 34 56 744 29
2017–18 1461 58 44 34 53 722 32
2018–19 1061 51 38 34 45 713 22
2019–20 961 56 42 35 55 — —
South Slope, Yellowstone
Year
Postseason Spring
n Fawns / 100 does
Fawns / 100 adults
Bucks / 100 does
% bucks > 3 pts.
n Fawns /
100 adults
2010–11 1508 66 58 14 47 1075 21
2011–12 1106 47 41 14 50 1196 33
2012–13 1056 63 53 20 35 1191 42
2013–14 1222 67 56 19 31 1074 50
2014–15 1242 64 52 22 38 1235 47
2015–16 1174 69 57 21 47 1145 50
2016–17 1164 64 52 23 48 1049 20
2017–18 1053 64 54 18 47 961 47
2018–19 1222 62 51 22 35 731 20
2019–20 957 47 39 20 48 — —
63

Deer classification data by management unit / subunit, Utah 2010–2019 (continued). Southwest Desert
Year
Postseason Spring
n Fawns / 100 does
Fawns / 100 adults
Bucks / 100 does
% bucks > 3 pts.
n Fawns /
100 adults
2010–11 207 41 34 22 71 — —
2011–12 206 53 40 32 64 — —
2012–13 406 44 34 30 61 — —
2013–14 455 48 37 29 69 — —
2014–15 744 46 37 25 71 — —
2015–16 516 48 41 19 67 — —
2016–17 416 48 39 25 50 — —
2017–18 344 49 39 24 60 — —
2018–19 504 32 27 21 68 — —
2019–20 259 50 42 20 58 — —
Wasatch Mtns, Avintaquin
Year
Postseason Spring
n Fawns / 100 does
Fawns / 100 adults
Bucks / 100 does
% bucks > 3 pts.
n Fawns /
100 adults
2010–11 177 69 55 25 52 1339 28
2011–12 278 67 56 19 43 429 33
2012–13 306 65 52 27 58 883 43
2013–14 264 65 53 24 45 1096 42
2014–15 285 67 53 27 41 720 59
2015–16 270 64 48 36 50 720 39
2016–17 209 58 46 27 37 — —
2017–18 311 67 50 33 53 224 30
2018–19 284 30 25 18 43 — —
2019–20 160 57 48 19 35 — —
64

Deer classification data by management unit / subunit, Utah 2010–2019 (continued). Wasatch Mtns, Currant Creek
Year
Postseason Spring
n Fawns / 100 does
Fawns / 100 adults
Bucks / 100 does
% bucks > 3 pts.
n Fawns /
100 adults
2010–11 1326 65 53 21 42 1154 20
2011–12 1500 52 45 15 59 1249 37
2012–13 2396 79 67 18 41 1269 47
2013–14 1718 70 58 21 30 2191 45
2014–15 2057 81 63 28 45 1361 56
2015–16 2730 61 49 26 48 2065 43
2016–17 2378 64 53 22 57 298 28
2017–18 2216 72 62 17 48 1195 35
2018–19 2203 59 49 19 39 985 24
2019–20 1938 65 54 19 49 — —
Wasatch Mtns, Salt Lake
Year
Postseason Spring
n Fawns / 100 does
Fawns / 100 adults
Bucks / 100 does
% bucks > 3 pts.
n Fawns /
100 adults
2010–11 244 62 48 30 58 — —
2011–12 — — — — — — —
2012–13 500 66 51 28 58 — —
2013–14 192 68 54 28 33 — —
2014–15 — — — — — — —
2015–16 156 72 56 28 64 — —
2016–17 642 72 57 26 48 — —
2017–18 194 59 46 29 17 — —
2018–19 — — — — — — —
2019–20 — — — — — — —
65

Deer classification data by management unit / subunit, Utah 2010–2019 (continued). Wasatch Mtns, West
Year
Postseason Spring
n Fawns / 100 does
Fawns / 100 adults
Bucks / 100 does
% bucks > 3 pts.
n Fawns /
100 adults
2010–11 2686 79 66 20 39 680 61
2011–12 2617 74 62 19 49 724 73
2012–13 1524 71 61 16 36 510 68
2013–14 1619 76 65 18 39 367 69
2014–15 1633 70 59 19 39 532 62
2015–16 1087 73 62 17 44 455 56
2016–17 1207 75 65 16 56 — —
2017–18 857 68 59 16 54 — —
2018–19 851 66 57 16 55 251 61
2019–20 765 58 50 16 45 — —
West Desert, Other
Year
Postseason Spring
n Fawns / 100 does
Fawns / 100 adults
Bucks / 100 does
% bucks > 3 pts.
n Fawns /
100 adults
2010–11 27 73 69 7 100 — —
2011–12 169 60 56 6 33 — —
2012–13 — — — — — — —
2013–14 157 54 43 26 26 — —
2014–15 — — — — — — —
2015–16 — — — — — — —
2016–17 — — — — — — —
2017–18 90 51 45 13 57 — —
2018–19 120 43 38 13 40 — —
2019–20 54 73 54 35 33 — —
66

Deer classification data by management unit / subunit, Utah 2010–2019 (continued). West Desert, Vernon
Year
Postseason Spring
n Fawns / 100 does
Fawns / 100 adults
Bucks / 100 does
% bucks > 3 pts.
n Fawns /
100 adults
2010–11 232 78 60 31 32 — —
2011–12 273 77 64 19 63 — —
2012–13 327 61 51 20 42 — —
2013–14 225 55 45 21 52 — —
2014–15 622 85 64 33 38 — —
2015–16 298 67 50 34 51 — —
2016–17 456 69 50 36 48 — —
2017–18 403 67 47 44 49 — —
2018–19 460 63 48 29 49 — —
2019–20 343 56 40 41 58 — —
Zion
Year
Postseason Spring
n Fawns / 100 does
Fawns / 100 adults
Bucks / 100 does
% bucks > 3 pts.
n Fawns /
100 adults
2010–11 1098 63 51 24 50 — —
2011–12 1069 69 56 23 47 — —
2012–13 1400 62 50 25 43 — —
2013–14 1297 59 47 24 40 — —
2014–15 1734 56 46 24 55 — —
2015–16 1617 61 48 27 46 — —
2016–17 1663 63 51 24 46 — —
2017–18 1268 60 49 23 46 — —
2018–19 1467 57 47 23 48 — —
2019–20 1035 59 49 19 50 — —
67

ELK
68

Statewide trends of elk harvest statistics, Utah 1931–2019.
69

Statewide elk harvest statistics, Utah 1931–1970.
Year Permits issued
Hunters afield
Harvest Success rate (%) Bull Cow
Hunter’s choice
Total Bull Cow Calf Hunter’s choice
Total
1931 184 — 75 259 256 99 — — 26 125 49
1932 191 — 58 249 246 140 — — 49 189 77
1933 201 — 150 351 346 162 2 — 71 235 68
1934 143 — 281 424 418 179 44 — 96 292 70
1935 60 — 297 357 352 146 37 — 22 205 58
1936 60 — 160 220 217 92 49 — 12 153 70
1937 151 53 47 251 248 119 69 — — 188 76
1938 193 172 150 515 508 186 195 — 49 430 85
1939 328 408 — 736 726 261 380 — — 641 88
1940 522 406 — 928 916 455 383 — — 838 91
1941 419 378 74 871 860 390 391 — — 781 91
1942 426 394 146 966 954 374 385 — — 759 80
1943 429 291 112 832 821 303 261 — — 564 69
1944 262 123 195 580 572 172 90 — 170 432 76
1945 335 145 220 700 691 312 250 — — 562 81
1946 395 215 450 1060 1031 483 362 — — 845 82
1947 260 125 850 1235 1208 502 563 — — 1065 88
1948 25 10 875 910 902 307 481 — — 788 87
1949 175 95 655 925 914 374 343 — — 717 78
1950 305 70 1305 1680 1669 754 649 — — 1403 84
1951 350 136 1335 1821 1807 803 704 — — 1507 83
1952 310 120 1330 1760 1750 641 682 — — 1323 76
1953 210 115 1172 1497 1491 471 496 — — 967 65
1954 190 — 1160 1350 1332 423 425 — — 848 64
1955 281 — 1192 1473 1461 413 345 92 — 850 58
1956 357 — 1063 1420 1407 434 298 85 — 817 58
1957 513 — 1299 1812 1768 487 356 89 — 932 53
1958 580 — 1460 2040 2019 563 416 96 — 1075 53
1959 680 10 1493 2183 2176 638 462 120 — 1220 56
1960 830 — 1451 2281 2253 649 423 101 — 1173 52
1961 1020 — 1550 2570 2526 643 393 82 — 1118 44
1962 1130 — 1392 2522 2478 697 383 93 — 1173 47
1963 1191 — 1373 2564 2519 647 338 60 — 1045 41
1964 1228 — 1233 2461 2418 632 334 67 — 1033 43
1965 1386 — 1119 2505 2480 678 271 48 — 997 40
1966 1545 — 798 2343 2302 657 226 27 — 910 40
1967 4195 — 260 4455 4278 964 52 13 — 1029 24
1968 6086 — 176 6262 6036 1286 49 17 — 1352 22
1969 5005 — 457 5462 5215 1173 149 19 — 1341 26
1970 9639 — 715 10354 10008 1762 203 30 — 1995 20
70

Statewide elk harvest statistics, Utah 1971–2018.
Year General-season harvest Restricted harvest Total harvest
Bulls Antlerless Hunters afield
Bulls Antlerless Hunters afield
Bulls Antlerless Hunters afield
1971 1443 — 9371 — — — 1443 — 9371
1972 1896 — 15929 — — — 1896 — 15929
1973 1919 — 23895 — — — 1919 — 23895
1974 1675 — 17652 — — — 1675 — 17652
1975 1747 — 18904 — — — 1747 — 18904
1976 1750 4 19021 — — — 1750 4 19021
1977 2426 16 29573 — — — 2426 16 29573
1978 3091 17 33544 — — — 3091 17 33544
1979 2610 20 38069 — — — 2610 20 38069
1980 2051 25 19621 — — — 2051 25 19621
1981 2725 22 21425 — — — 2725 22 21425
1982 3069 24 22342 — — — 3069 24 22342
1983 3537 24 21659 — — — 3537 24 21659
1984 4115 34 29008 — — — 4115 34 29008
1985 4785 42 29287 — — — 4785 42 29287
1986 4001 31 29483 — — — 4001 31 29483
1987 4629 20 31758 — — — 4629 20 31758
1988 6434 45 37930 — — — 6434 45 37930
1989 6422 22 38861 — — — 6422 22 38861
1990 6405 31 43263 — — — 6405 31 43263
1991 6199 71 47082 — — — 6199 71 47082
1992 7341 104 47924 — — — 7341 104 47924
1993 6066 192 48372 — — — 6066 192 48372
1994 5902 101 50976 — — — 5902 101 50976
1995 4084 488 34928 1241 3987 8670 5325 4475 43598
1996 4699 761 34207 677 3916 6867 5376 4677 41074
1997 5268 565 33696 1212 6920 13674 6480 7485 47370
1998 3944 518 33014 1311 7550 13847 5255 8068 46861
1999 5044 462 36725 1156 6526 15912 6200 6988 52637
2000 5515 664 34347 1057 7251 15558 6572 7915 49905
2001* 4136 531 31195 872 6502 13981 5008 7033 45176
2002* 3212 533 29822 1177 4851 13342 4389 5384 43164
2003 3785 561 31496 1250 5596 14602 5035 6157 46098
2004 3729 387 31624 1677 4946 12627 5406 5333 44251
2005 3267 332 29751 1768 3876 10864 5035 4208 40615
2006 4176 432 31656 2062 3668 10319 6238 4100 41975
2007 4282 660 32884 2267 4958 13558 6549 5618 46442
2008 3818 654 33388 2399 5575 16354 6217 6229 49742
*In 2001 and 2002, hunters afield were estimated. Also in 2001, not all CWMU bull elk hunt data were available.
71

Statewide elk harvest statistics, Utah 1971–2019 (continued).
Year General-season harvest Restricted harvest Total harvest
Bulls Antlerless Hunters afield
Bulls Antlerless Hunters afield
Bulls Antlerless Hunters afield
2008 3818 654 33388 2399 5575 16354 6217 6229 49742
2009 4956 901 36312 2609 7102 17560 7565 8003 53872
2010 4941 722 36562 2761 7156 16726 7702 7878 53288
2011 4207 568 37944 2716 5456 19297 6923 6024 57241
2012 5020 689 36437 2663 7960 22720 7683 8649 59157
2013 5401 576 39583 2730 8172 26791 8131 8748 66374
2014 4910 686 39790 2749 8788 29713 7659 9474 69503
2015 5304 777 40397 2786 10427 30778 8090 11204 71175
2016 5427 762 41737 2657 10146 27159 8084 10908 68896
2017 4609 631 41071 2729 5771 23206 7338 6402 64277
2018 5129 793 36077 2629 7731 24655 7758 8524 60732
2019 4205 642 36217 2583 6658 22851 6788 7300 59068
72

Total bull elk harvest by management unit / subunit, Utah 2010–2019.
Unit Subunit 2010 2011 2012 2013 2014 2015 2016 2017 2018 2019
22 Beaver — Beaver 157 116 114 188 197 149 177 133 182 126
10 Book Cliffs — Book Cliffs 342 280 250 330 255 312 410 385 305 261
1 Box Elder B Hansel Mtn 33 49 39 44 26 25 29 13 29 77
1 Box Elder A West Box Elder 25 26 35 26 33 43 67 66 62 43
2 Cache — Cache 281 264 377 337 315 309 285 263 285 253
16 Central Mtns B Manti 897 710 821 821 755 762 823 676 748 685
16 Central Mtns A Nebo 188 167 167 180 156 166 236 213 193 116
6 Chalk Creek — Chalk Creek 250 248 280 308 303 320 343 312 340 307
5 East Canyon — East Canyon 245 171 243 213 226 219 279 184 173 173
21 Fillmore A Oak Creek 67 68 39 72 35 33 65 58 33 40
21 Fillmore B Pahvant 176 137 132 115 101 114 148 99 161 141
15 Henry Mtns — Henry Mtns 18 4 8 24 4 0 4 13 8 0
26 Kaiparowits — Kaiparowits 0 8 0 8 14 4 0 12 0 12
7 Kamas — Kamas 191 136 151 129 155 141 142 147 179 107
13 La Sal B Dolores Triangle 0 3 0 8 9 4 3 0 0 5
13 La Sal A La Sal Mtns 142 168 131 141 169 204 193 190 207 192
23 Monroe — Monroe 180 198 202 249 56 94 66 60 80 127
4 Morgan-South Rich — Morgan-South Rich 292 299 381 362 355 380 366 310 390 296
24 Mt Dutton — Mt Dutton 163 169 141 178 149 140 147 110 102 61
11 Nine Mile A Anthro 33 12 27 30 32 23 32 34 20 30
11 Nine Mile B Range Creek 155 174 183 207 208 173 185 166 189 151
8 North Slope A Summit 363 264 335 290 393 384 362 300 286 350
8 North Slope C Three Corners 33 30 27 30 27 26 22 22 25 19
8 North Slope B West Daggett 197 199 213 218 172 246 295 191 211 190
3 Ogden — Ogden 174 161 174 186 179 231 223 178 256 165
18 Oquirrh-Stansbury — Oquirrh-Stansbury 75 51 60 78 74 60 60 68 71 58
28 Panguitch Lake — Panguitch Lake 120 124 150 142 126 141 160 107 115 113
*Includes harvest from Oak Creek South.
73

Total bull elk harvest by management unit / subunit, Utah 2010–2019 (continued).
Unit Subunit 2010 2011 2012 2013 2014 2015 2016 2017 2018 2019
27 Paunsaugunt — Paunsaugunt 27 52 51 58 51 62 52 74 48 62
30 Pine Valley — Pine Valley 11 28 8 20 25 20 16 33 61 73
25 Plateau C Boulder 205 133 149 172 128 138 133 104 75 97
25 Plateau A Fishlake 366 290 315 367 398 428 308 341 493 338
25 Plateau B Thousand Lakes 8 0 4 21 8 24 16 4 0 21
14 San Juan A Montezuma Canyon 23 24 27 20 11 11 4 4 12 0
14 San Juan B San Juan 115 102 107 91 97 77 82 111 82 100
12 San Rafael A North 15 19 10 8 4 0 4 0 0 4
12 San Rafael B South 0 8 19 7 4 0 0 0 0 16
9 South Slope D Bonanza 40 42 49 30 81 87 101 121 130 107
9 South Slope C Diamond Mtn 91 85 72 74 71 65 69 76 64 71
9 South Slope B Vernal 423 360 364 431 387 470 421 349 326 264
9 South Slope A Yellowstone 345 363 427 453 443 512 534 632 540 438
20 Southwest Desert — Southwest Desert 216 190 228 290 289 260 162 167 195 142
17 Wasatch Mtns C Avintaquin 72 59 79 104 74 73 46 68 60 59
17 Wasatch Mtns B Currant Creek 329 237 395 349 326 330 237 179 252 209
17 Wasatch Mtns A West 470 496 553 544 533 549 531 488 570 519
19 West Desert A Deep Creek 52 48 36 35 42 44 33 59 23 35
19 West Desert BC East 11 17 24 31 46 58 41 25 53 61
29 Zion — Zion 87 94 88 112 115 178 172 193 125 73
74

Total antlerless* elk harvest by management unit / subunit, Utah 2010–2019.
Unit Subunit 2010 2011 2012 2013 2014 2015 2016 2017 2018 2019
22 Beaver — Beaver 119 121 122 80 124 189 449 252 388 334
10 Book Cliffs — Book Cliffs 84 57 99 83 114 109 117 97 101 81
1 Box Elder B Hansel Mtn 29 19 27 13 17 9 47 27 54 52
1 Box Elder A West Box Elder 33 32 85 55 45 85 71 45 70 33
2 Cache — Cache 350 173 331 276 226 304 446 347 467 294
16 Central Mtns B Manti 809 615 1366 1232 1407 1514 1483 539 728 623
16 Central Mtns A Nebo 156 81 74 145 137 135 195 203 467 224
6 Chalk Creek — Chalk Creek 296 213 425 484 472 687 782 376 513 536
5 East Canyon — East Canyon 236 297 397 342 348 536 651 241 471 283
21 Fillmore A Oak Creek 29 39 57 4 9 3 37 28 21 74
21 Fillmore B Pahvant 126 122 105 87 120 98 150 90 186 60
15 Henry Mtns — Henry Mtns 0 2 2 0 9 0 0 0 0 0
26 Kaiparowits — Kaiparowits 0 0 0 0 4 4 2 0 4 18
7 Kamas — Kamas 127 120 144 149 129 163 155 168 121 67
13 La Sal B Dolores Triangle 8 25 24 10 24 27 21 8 10 15
13 La Sal A La Sal Mtns 159 159 157 120 188 184 203 145 196 187
23 Monroe — Monroe 22 29 65 200 243 396 163 76 140 59
4 Morgan-South Rich — Morgan-South Rich 662 451 599 671 491 540 625 335 441 452
24 Mt Dutton — Mt Dutton 289 110 120 180 239 244 146 189 211 176
11 Nine Mile A Anthro 290 117 187 126 76 131 121 61 66 174
11 Nine Mile B Range Creek 451 100 168 115 131 105 94 80 52 44
8 North Slope A Summit 54 50 46 79 75 106 116 90 103 80
8 North Slope C Three Corners 55 30 31 23 17 8 8 0 4 2
8 North Slope B West Daggett 79 86 101 124 123 197 209 89 140 103
3 Ogden — Ogden 104 49 112 74 328 435 613 167 279 339
18 Oquirrh-Stansbury — Oquirrh-Stansbury 72 50 67 70 63 94 59 58 51 13
28 Panguitch Lake — Panguitch Lake 22 17 20 68 115 172 342 259 213 186
*Data includes mitigation harvest.
75

Total antlerless* elk harvest by management unit / subunit, Utah 2010–2019 (continued).
Unit Subunit 2010 2011 2012 2013 2014 2015 2016 2017 2018 2019
27 Paunsaugunt — Paunsaugunt 1 5 30 38 35 50 135 56 71 71
30 Pine Valley — Pine Valley 2 5 2 3 15 4 14 35 20 12
25 Plateau C Boulder 218 190 133 229 446 401 177 137 190 104
25 Plateau A Fishlake 477 328 42 312 529 561 208 197 234 142
25 Plateau B Thousand Lakes 2 2 0 0 12 10 15 3 15 78
14 San Juan A Montezuma Canyon 49 112 128 94 33 40 19 37 59 82
14 San Juan B San Juan 103 104 125 132 174 107 151 48 105 23
12 San Rafael A North 24 17 2 3 10 15 11 15 0 4
12 San Rafael B South 0 0 4 0 0 4 0 5 0 4
9 South Slope D Bonanza 0 4 4 0 12 9 48 0 3 8
9 South Slope C Diamond Mtn 255 147 207 144 80 197 113 129 116 158
9 South Slope B Vernal 276 209 398 279 196 379 473 187 382 366
9 South Slope A Yellowstone 372 305 524 594 506 542 871 418 717 582
20 Southwest Desert — Southwest Desert 135 119 75 162 337 393 275 379 239 290
17 Wasatch Mtns C Avintaquin 204 173 232 191 182 218 94 49 46 32
17 Wasatch Mtns B Currant Creek 597 482 968 1008 844 900 449 101 98 104
17 Wasatch Mtns A West 408 600 789 674 638 736 353 286 439 330
19 West Desert A Deep Creek 25 8 9 9 14 14 18 88 11 5
19 West Desert BC East 5 3 6 14 7 20 36 5 86 129
29 Zion — Zion 67 50 40 50 89 68 123 230 197 219
*Data includes mitigation harvest.
76

Total bull elk hunters by management unit / subunit, Utah 2010–2019.
Unit Subunit 2010 2011 2012 2013 2014 2015 2016 2017 2018 2019
22 Beaver — Beaver 1013 1045 908 1607 1309 1150 1308 1308 1202 960
10 Book Cliffs — Book Cliffs 816 754 789 978 918 841 1158 1275 1176 873
1 Box Elder B Hansel Mtn 214 324 124 215 219 247 199 123 103 156
1 Box Elder A West Box Elder 74 64 87 76 105 103 128 181 129 123
2 Cache — Cache 1999 1945 2387 2293 2241 2282 2330 2506 1858 1836
16 Central Mtns B Manti 4596 4830 4657 4880 4647 4279 4520 4631 3920 3653
16 Central Mtns A Nebo 1124 1093 977 1036 1009 983 1170 1177 989 782
6 Chalk Creek — Chalk Creek 823 1025 830 879 984 942 941 924 814 846
5 East Canyon — East Canyon 1615 1871 1760 1631 1759 1767 2017 2065 636 590
21 Fillmore A Oak Creek 353 386 372 846 233 242 383 359 191 175
21 Fillmore B Pahvant 731 657 604 536 449 569 684 585 744 636
15 Henry Mtns — Henry Mtns 145 110 76 62 68 38 54 61 46 33
26 Kaiparowits — Kaiparowits 36 57 32 20 71 80 82 75 110 181
7 Kamas — Kamas 2006 2313 1742 1599 1462 1482 1653 1605 1392 1069
13 La Sal B Dolores Triangle 43 56 22 17 31 17 17 4 0 42
13 La Sal A La Sal Mtns 661 707 742 864 853 802 888 943 827 773
23 Monroe — Monroe 782 1072 1163 1294 485 714 720 605 474 614
4 Morgan-South Rich — Morgan-South Rich 1009 1199 1017 1008 1125 1120 1048 1030 804 783
24 Mt Dutton — Mt Dutton 657 544 544 489 681 629 545 520 409 619
11 Nine Mile A Anthro 166 121 132 132 151 166 197 164 119 183
11 Nine Mile B Range Creek 528 645 865 703 805 671 754 678 515 425
8 North Slope A Summit 2912 2478 2445 2226 2673 2742 2573 2889 1855 2155
8 North Slope C Three Corners 48 46 45 41 44 46 45 43 38 33
8 North Slope B West Daggett 1487 1492 1738 1428 1374 1599 1811 1750 1337 1343
3 Ogden — Ogden 1203 1234 719 645 876 859 1086 1002 682 511
18 Oquirrh-Stansbury — Oquirrh-Stansbury 260 273 283 376 302 254 251 394 408 367
28 Panguitch Lake — Panguitch Lake 635 782 874 896 888 963 1256 1092 967 785
77

Total bull elk hunters by management unit / subunit, Utah 2010–2019 (continued).
Unit Subunit 2010 2011 2012 2013 2014 2015 2016 2017 2018 2019
27 Paunsaugunt — Paunsaugunt 163 198 260 218 213 268 245 255 322 254
30 Pine Valley — Pine Valley 220 261 163 240 251 243 245 368 170 427
25 Plateau C Boulder 961 810 732 779 874 790 825 814 599 457
25 Plateau A Fishlake 2179 2029 1631 1591 1805 1847 1868 1949 1973 1319
25 Plateau B Thousand Lakes 128 150 70 95 102 98 106 91 159 480
14 San Juan A Montezuma Canyon 202 147 123 148 97 86 38 78 66 121
14 San Juan B San Juan 395 386 413 394 334 328 337 327 361 333
12 San Rafael A North 119 197 86 102 63 51 75 43 24 51
12 San Rafael B South 56 107 79 89 88 54 20 34 0 54
9 South Slope D Bonanza 130 210 394 285 473 567 653 629 522 504
9 South Slope C Diamond Mtn 119 107 92 89 85 80 82 87 84 86
9 South Slope B Vernal 3453 3022 2857 2958 2715 2776 2833 2560 1812 1668
9 South Slope A Yellowstone 2273 2618 2764 3201 3243 3457 3825 3777 2394 2477
20 Southwest Desert — Southwest Desert 751 724 861 909 1082 1158 881 853 821 770
17 Wasatch Mtns C Avintaquin 613 570 705 704 732 817 629 570 501 413
17 Wasatch Mtns B Currant Creek 2681 2376 2728 2920 3231 3303 2653 2116 1799 1505
17 Wasatch Mtns A West 3297 4303 3863 3993 4115 4374 4320 4076 2727 2670
19 West Desert A Deep Creek 163 167 149 116 213 162 163 633 122 134
19 West Desert BC East 160 341 316 289 316 402 460 194 385 415
29 Zion — Zion 755 755 704 767 781 951 1025 1207 742 762
78

Total antlerless* elk hunters by management unit / subunit, Utah 2010–2019.
Unit Subunit 2010 2011 2012 2013 2014 2015 2016 2017 2018 2019
22 Beaver — Beaver 161 263 216 262 238 343 949 911 929 995
10 Book Cliffs — Book Cliffs 122 89 160 154 151 133 143 134 136 110
1 Box Elder B Hansel Mtn 43 33 55 61 46 49 69 96 137 149
1 Box Elder A West Box Elder 50 78 143 200 213 177 184 167 214 180
2 Cache — Cache 497 494 630 664 517 633 782 828 946 959
16 Central Mtns B Manti 1195 1299 2498 3010 3198 3226 3192 1366 1539 1324
16 Central Mtns A Nebo 189 196 121 225 265 176 275 428 759 516
6 Chalk Creek — Chalk Creek 431 625 925 1038 1234 1341 1506 1265 1281 1397
5 East Canyon — East Canyon 332 708 917 881 919 1054 1276 1182 1216 1178
21 Fillmore A Oak Creek 41 60 127 13 23 16 46 32 41 136
21 Fillmore B Pahvant 245 205 191 199 177 122 243 187 291 101
15 Henry Mtns — Henry Mtns 1 12 9 6 47 10 11 8 10 19
26 Kaiparowits — Kaiparowits 0 0 0 0 0 2 6 6 9 6
7 Kamas — Kamas 172 434 401 411 375 370 489 1015 1016 200
13 La Sal B Dolores Triangle 16 37 50 42 48 44 43 32 33 43
13 La Sal A La Sal Mtns 266 261 261 204 246 241 257 219 276 348
23 Monroe — Monroe 40 58 61 286 329 563 216 119 161 156
4 Morgan-South Rich — Morgan-South Rich 850 836 987 1108 1088 1012 1068 932 997 961
24 Mt Dutton — Mt Dutton 472 387 309 492 616 768 324 440 442 416
11 Nine Mile A Anthro 473 378 751 625 406 311 395 208 252 435
11 Nine Mile B Range Creek 803 570 470 525 530 421 304 345 110 113
8 North Slope A Summit 58 90 74 99 138 164 237 241 240 156
8 North Slope C Three Corners 154 106 85 68 82 55 23 0 20 17
8 North Slope B West Daggett 149 151 223 274 262 323 407 346 322 276
3 Ogden — Ogden 138 139 176 159 848 949 1371 1005 1113 836
18 Oquirrh-Stansbury — Oquirrh-Stansbury 83 88 76 99 76 107 66 63 55 9
28 Panguitch Lake — Panguitch Lake 3 5 29 134 146 270 695 676 734 528
*Data includes mitigation hunters.
79

Total antlerless* elk hunters by management unit / subunit, Utah 2010–2019 (continued).
Unit Subunit 2010 2011 2012 2013 2014 2015 2016 2017 2018 2019
27 Paunsaugunt — Paunsaugunt 9 20 53 76 99 136 289 254 274 291
30 Pine Valley — Pine Valley 9 26 20 27 34 84 112 197 145 151
25 Plateau C Boulder 597 628 317 716 974 976 457 368 390 336
25 Plateau A Fishlake 836 870 40 582 888 940 342 361 307 234
25 Plateau B Thousand Lakes 9 10 6 11 20 22 31 31 35 38
14 San Juan A Montezuma Canyon 94 246 314 256 171 201 123 148 127 181
14 San Juan B San Juan 227 191 276 259 352 288 347 131 214 59
12 San Rafael A North 42 78 34 33 65 43 28 50 11 16
12 San Rafael B South 0 0 0 0 0 0 0 47 0 0
9 South Slope D Bonanza 0 0 0 1 2 5 33 0 5 4
9 South Slope C Diamond Mtn 424 294 362 361 174 330 234 188 249 295
9 South Slope B Vernal 617 618 980 973 909 770 963 591 721 812
9 South Slope A Yellowstone 674 1028 1730 2496 2687 2292 3062 2354 2798 2301
20 Southwest Desert — Southwest Desert 183 161 103 181 426 579 570 541 445 669
17 Wasatch Mtns C Avintaquin 383 667 1034 902 896 852 247 122 97 129
17 Wasatch Mtns B Currant Creek 772 1166 1988 3090 3727 3442 1058 206 176 196
17 Wasatch Mtns A West 552 1504 1526 1548 2020 2523 494 728 776 722
19 West Desert A Deep Creek 21 16 12 17 19 27 30 287 39 20
19 West Desert BC East 18 15 11 18 16 176 159 31 274 432
29 Zion — Zion 305 137 127 163 206 208 259 491 479 523
*Data includes mitigation hunters.
80

Total elk harvest by management unit, Utah 2019.
Unit Bull
harvest Antlerless
harvest Total
harvest Hunters afield
Mean days hunted
Success rate (%)
22 Beaver 126 334 460 1955 5.0 23.2
10 Book Cliffs 261 81 342 983 5.1 34.8
1 Box Elder 120 85 205 608 5.3 31.6
2 Cache 253 294 547 2795 5.4 19.4
16 Central Mtns 801 847 1648 6275 5.6 26.1
6 Chalk Creek 307 536 843 2243 5.2 37.1
5 East Canyon 173 283 456 1768 5.7 25.5
21 Fillmore 181 134 315 1048 5.0 29.9
15 Henry Mtns 0 0 0 52 3.8 0.0
26 Kaiparowits 12 18 30 187 7.0 16.1
7 Kamas 107 67 174 1269 5.4 13.6
13 La Sal 197 202 399 1206 5.8 32.7
23 Monroe 127 59 186 770 4.8 23.8
4 Morgan-South Rich 296 452 748 1744 4.5 42.2
24 Mt Dutton 61 176 237 1049 5.1 22.6
11 Nine Mile 181 218 399 1156 4.8 34.5
8 North Slope 559 185 744 3980 5.6 18.7
3 Ogden 165 339 504 1347 5.8 37.4
18 Oquirrh-Stansbury 58 13 71 376 4.1 18.9
28 Panguitch Lake 113 186 299 1313 4.7 22.6
27 Paunsaugunt 62 71 133 545 7.1 23.8
30 Pine Valley 73 12 85 578 7.9 14.6
25 Plateau 456 324 780 2878 5.5 26.8
14 San Juan 100 105 205 694 6.5 29.5
12 San Rafael 20 8 28 121 6.0 23.1
9 South Slope 880 1143 2023 8294 6.3 24.1
20 Southwest Desert 142 290 432 1439 4.9 29.9
17 Wasatch Mtns 787 466 1253 5634 5.6 22.2
19 West Desert 96 105 201 854 6.2 23.6
29 Zion 73 219 292 1285 6.6 22.3
Unidentified 2 48 50 25 3.8 28.1
Statewide totals* 6788 7300 14088 59068 5.0 23.6
*Statewide totals for hunters afield do not equal the sum of the columns because hunters could hunt multiple units.
81

General-season archery elk harvest by management unit / subunit, Utah 2019.
Unit Subunit Harvest Hunters
afield Mean days
hunted Successrate (%)Bull Cow Calf Total
22 Beaver A East 21 21 0 42 216 6.5 19.6
22 Beaver B West 0 4 0 4 110 4.9 3.8
10 Book Cliffs — Book Cliffs 4 0 0 4 59 5.8 6.8
1 Box Elder A Grouse Creek 0 0 0 0 13 5.0 0.0
1 Box Elder B Hansel Mtn 0 0 0 0 17 4.5 0.0
2 Cache A Cache 30 12 0 42 479 7.6 8.8
2 Cache B East Rich 4 8 0 13 89 6.5 14.3
16 Central Mtns B Manti 51 54 28 134 949 6.1 14.3
16 Central Mtns A Nebo 8 17 8 33 208 6.0 16.3
6 Chalk Creek — Chalk Creek 17 0 0 17 313 5.7 5.4
5 East Canyon — East Canyon 21 8 0 29 203 6.1 14.6
21 Fillmore A Oak Creek 0 0 0 0 25 4.0 0.0
21 Fillmore B Pahvant 4 4 4 13 174 5.8 7.3
15 Henry Mtns — Henry Mtns 0 0 0 0 8 2.0 0.0
26 Kaiparowits — Kaiparowits 4 8 4 17 42 8.7 40.0
7 Kamas — Kamas 4 8 0 13 398 6.3 3.2
13 La Sal B Dolores Triangle 0 4 0 4 17 5.5 25.0
13 La Sal A La Sal Mtns 4 12 0 17 161 7.8 10.5
23 Monroe — Monroe 0 17 8 25 271 6.2 9.4
4 Morgan-South Rich — Morgan-South Rich 8 4 0 13 148 6.2 8.6
24 Mt Dutton — Mt Dutton 4 8 4 17 85 4.9 20.0
11 Nine Mile A Anthro 0 0 0 0 47 6.5 0.0
11 Nine Mile B1 Range Creek North 0 0 0 0 34 8.8 0.0
11 Nine Mile B2 Range Creek South 0 0 0 0 17 7.3 0.0
8 North Slope A Summit 34 21 0 54 779 6.9 7.1
8 North Slope B West Daggett 30 21 0 50 491 6.5 10.3
3 Ogden — Ogden 13 0 0 13 106 5.0 12.0
18 Oquirrh-Stansbury — Oquirrh-Stansbury 0 4 0 4 85 4.3 5.0
28 Panguitch Lake — Panguitch Lake 8 21 0 29 305 6.8 9.7
27 Paunsaugunt — Paunsaugunt 8 0 0 8 64 5.9 13.3
30 Pine Valley — Pine Valley 0 0 0 0 25 3.8 0.0
25 Plateau C Boulder 8 17 0 25 148 6.8 17.1
25 Plateau A Fishlake 17 54 0 71 402 6.9 17.9
25 Plateau B Thousand Lakes 0 0 0 0 21 5.4 0.0
14 San Juan A Montezuma Canyon 0 4 0 4 51 7.1 8.3
14 San Juan B San Juan 4 4 0 8 93 8.4 9.1
12 San Rafael A North 0 0 0 0 30 7.7 0.0
12 San Rafael B South 4 4 0 8 17 7.5 50.0
9 South Slope D Bonanza 25 4 4 33 157 6.8 21.6
9 South Slope B Vernal 34 21 0 54 542 7.3 10.2
9 South Slope A Yellowstone 42 25 0 67 635 7.1 10.7
20 Southwest Desert — Southwest Desert 13 4 0 17 131 7.5 12.9
82

General-season archery elk harvest by management unit / subunit, Utah 2019 (continued).
Unit Subunit Harvest Hunters
afield Mean days
hunted Successrate (%)Bull Cow Calf Total
17 Wasatch Mtns C Avintaquin 4 8 0 13 182 5.9 7.0
17 Wasatch Mtns B Currant Creek 4 29 4 38 428 5.9 8.9
17 Wasatch Mtns A West 25 41 4 71 974 5.9 7.4
19 West Desert A Deep Creek 0 0 0 0 38 5.6 0.0
19 West Desert BC East 4 8 4 17 47 7.1 36.4
29 Zion — Zion 4 0 0 4 301 5.9 1.4
Statewide totals* 465 479 72 1025 9117 6.7 11.2 *Statewide totals for hunters afield do not equal the sum of the columns because hunters could hunt multiple units.
83

General-season any weapon spike bull elk harvest by management unit / subunit, Utah 2019.
Unit Subunit Bull
harvest Hunters afield
Mean days hunted
Success rate (%)
22 Beaver A East 52 524 4.5 10.2
10 Book Cliffs — Book Cliffs 124 602 4.8 20.6
1 Box Elder A Grouse Creek 4 45 5.6 9.1
2 Cache A Cache 16 749 5.0 2.2
16 Central Mtns B Manti 188 1972 5.1 9.8
16 Central Mtns A Nebo 48 495 4.6 9.9
21 Fillmore B Pahvant 56 376 5.0 15.2
26 Kaiparowits — Kaiparowits 0 29 7.6 0.0
13 La Sal B Dolores Triangle 0 16 5.5 0.0
13 La Sal A La Sal Mtns 76 434 5.8 17.9
23 Monroe — Monroe 40 380 3.9 10.8
24 Mt Dutton — Mt Dutton 16 282 4.4 5.8
11 Nine Mile A Anthro 12 98 5.1 12.5
18 Oquirrh-Stansbury — Oquirrh-Stansbury 20 233 4.1 8.8
28 Panguitch Lake — Panguitch Lake 60 638 4.7 9.6
27 Paunsaugunt — Paunsaugunt 0 110 4.3 0.0
25 Plateau C Boulder 24 315 4.7 7.8
25 Plateau A Fishlake 104 814 4.9 13.1
25 Plateau B Thousand Lakes 4 70 4.6 5.9
14 San Juan B San Juan 4 135 5.1 3.0
12 San Rafael B South 12 29 4.6 42.9
20 Southwest Desert — Southwest Desert 32 470 4.6 7.0
17 Wasatch Mtns C Avintaquin 16 180 4.5 9.1
17 Wasatch Mtns B Currant Creek 56 790 4.9 7.3
17 Wasatch Mtns A West 60 921 4.3 6.7
19 West Desert A Deep Creek 16 74 3.8 22.2
Statewide totals* 1039 9864 5.2 10.5
*Statewide totals for hunters afield do not equal the sum of the columns because hunters could hunt multiple units.
84

General-season any weapon any bull elk harvest by management unit / subunit, Utah 2019.
Unit Subunit Bull
harvest Hunters afield
Mean days hunted
Success rate (%)
22 Beaver B West 8 101 4.9 8.3
1 Box Elder B Hansel Mtn 38 101 3.9 37.5
2 Cache B East Rich 38 173 4.4 22.0
2 Cache C Wellsville 0 38 4.9 0.0
6 Chalk Creek — Chalk Creek 29 236 4.4 12.5
5 East Canyon — East Canyon 42 278 4.0 15.2
21 Fillmore A Oak Creek 8 109 3.3 7.7
15 Henry Mtns — Henry Mtns 0 21 5.6 0.0
7 Kamas — Kamas 46 623 4.6 7.4
4 Morgan-South Rich — Morgan-South Rich 46 358 4.2 12.9
11 Nine Mile B1 Range Creek North 29 160 4.7 18.4
11 Nine Mile B2 Range Creek South 13 97 4.5 13.0
8 North Slope A Summit 171 1259 4.9 13.7
8 North Slope B West Daggett 71 749 4.8 9.6
3 Ogden — Ogden 58 303 4.2 19.4
30 Pine Valley — Pine Valley 0 122 4.6 0.0
14 San Juan A Montezuma Canyon 0 51 4.2 0.0
12 San Rafael A North 4 21 2.8 20.0
9 South Slope D Bonanza 46 316 5.3 14.7
9 South Slope B Vernal 117 1002 5.3 11.8
9 South Slope A Yellowstone 179 1579 5.4 11.5
19 West Desert BC East 29 320 4.9 9.2
29 Zion — Zion 54 404 4.9 13.5
Statewide totals* 1026 7721 5.3 13.3
*Statewide totals for hunters afield do not equal the sum of the columns because hunters could hunt multiple units.
85

General-season muzzleloader spike bull elk harvest by management unit / subunit, Utah 2019.
Unit Subunit Bull
harvest Hunters afield
Mean days hunted
Success rate (%)
22 Beaver A East 0 54 3.6 0.0
10 Book Cliffs — Book Cliffs 4 31 5.0 12.9
1 Box Elder A Grouse Creek 0 8 3.0 0.0
2 Cache A Cache 7 108 4.4 7.1
16 Central Mtns B Manti 19 201 4.1 9.6
16 Central Mtns A Nebo 4 27 2.1 14.3
21 Fillmore B Pahvant 7 19 4.6 40.0
26 Kaiparowits — Kaiparowits 0 4 9.0 0.0
13 La Sal B Dolores Triangle 0 4 9.0 0.0
13 La Sal A La Sal Mtns 4 19 3.6 20.0
23 Monroe — Monroe 4 81 3.5 4.8
24 Mt Dutton — Mt Dutton 0 12 2.7 0.0
11 Nine Mile A Anthro 0 8 3.5 0.0
18 Oquirrh-Stansbury — Oquirrh-Stansbury 0 12 1.7 0.0
28 Panguitch Lake — Panguitch Lake 4 39 4.2 10.0
27 Paunsaugunt — Paunsaugunt 7 8 2.5 100.0
25 Plateau C Boulder 7 43 4.3 18.2
25 Plateau A Fishlake 19 170 4.5 11.4
25 Plateau B Thousand Lakes 0 8 1.5 0.0
14 San Juan B San Juan 11 12 3.0 100.0
12 San Rafael B South 0 8 5.5 0.0
20 Southwest Desert — Southwest Desert 4 46 5.4 8.3
17 Wasatch Mtns C Avintaquin 0 8 5.5 0.0
17 Wasatch Mtns B Currant Creek 0 46 4.5 0.0
17 Wasatch Mtns A West 0 81 3.3 0.0
19 West Desert A Deep Creek — 0 — —
Statewide totals* 101 918 4.7 11.0
*Statewide totals for hunters afield do not equal the sum of the columns because hunters could hunt multiple units.
86

General-season muzzleloader any bull elk harvest by management unit / subunit, Utah 2019.
Unit Subunit Bull
harvest Hunters afield
Mean days hunted
Success rate (%)
22 Beaver B West 7 15 3.0 50.0
1 Box Elder B Hansel Mtn 4 7 4.0 50.0
2 Cache B East Rich 4 18 4.4 20.0
2 Cache C Wellsville 0 4 3.0 0.0
6 Chalk Creek — Chalk Creek 11 48 3.9 23.1
5 East Canyon — East Canyon 0 26 4.4 0.0
21 Fillmore A Oak Creek 4 4 4.0 100.0
15 Henry Mtns — Henry Mtns 0 4 3.0 0.0
7 Kamas — Kamas 0 15 3.3 0.0
4 Morgan-South Rich — Morgan-South Rich 7 48 3.1 15.4
11 Nine Mile B1 Range Creek North 0 11 5.0 0.0
11 Nine Mile B2 Range Creek South — 0 — —
8 North Slope A Summit 7 88 5.3 8.3
8 North Slope B West Daggett 0 70 4.7 0.0
3 Ogden — Ogden 7 52 3.0 14.3
30 Pine Valley — Pine Valley 4 4 4.0 100.0
14 San Juan A Montezuma Canyon 0 11 6.7 0.0
12 San Rafael A North — 0 — —
9 South Slope D Bonanza 4 11 6.0 33.3
9 South Slope B Vernal 11 55 5.1 20.0
9 South Slope A Yellowstone 22 177 5.4 12.5
19 West Desert BC East 0 7 5.0 0.0
29 Zion — Zion 7 29 4.4 25.0
Statewide totals* 97 655 5.0 14.8
*Statewide totals for hunters afield do not equal the sum of the columns because hunters could hunt multiple units.
87

General-season youth any bull elk harvest by management unit / subunit, Utah 2019.
Unit Subunit Bull
harvest Hunters afield
Mean days hunted
Success rate (%)
22 Beaver B West 0 20 2.4 0.0
1 Box Elder B Hansel Mtn 12 20 2.8 60.0
2 Cache B East Rich 0 4 2.0 0.0
6 Chalk Creek — Chalk Creek 0 8 2.0 0.0
5 East Canyon — East Canyon 16 24 2.2 66.7
21 Fillmore A Oak Creek 4 37 2.6 11.1
15 Henry Mtns — Henry Mtns — 0 — —
7 Kamas — Kamas 0 33 3.3 0.0
4 Morgan-South Rich — Morgan-South Rich 12 24 2.0 50.0
11 Nine Mile B1 Range Creek North 8 20 2.2 40.0
11 Nine Mile B2 Range Creek South 0 4 3.0 0.0
8 North Slope A Summit 8 29 3.6 28.6
8 North Slope B West Daggett 12 33 4.6 37.5
3 Ogden — Ogden 8 16 3.0 50.0
30 Pine Valley — Pine Valley — 0 — —
14 San Juan A Montezuma Canyon 0 8 4.0 0.0
12 San Rafael A North — 0 — —
9 South Slope D Bonanza 8 20 3.0 40.0
9 South Slope B Vernal* 12 69 4.4 17.6
9 South Slope A Yellowstone 36 86 4.0 42.9
19 West Desert BC East 8 41 3.9 20.0
29 Zion — Zion 4 24 3.8 16.7
Statewide totals* 148 432 4.2 34.1
*Statewide totals for hunters afield do not equal the sum of the columns because hunters could hunt multiple units.
88

Limited-entry archery bull elk harvest, Utah 2019.
Unit Hunt
number Hunt name
Bull harvest
Permits Hunters afield
Mean days hunted
Success rate (%)
22A EB3000 Beaver, East 6 8 8 11.6 71.4
10AB EB3001 Book Cliffs, Bitter Creek/South 8 37 36 12.3 22.2
10C EB3002 Book Cliffs, Little Creek Roadless 5 6 6 10.2 83.3
2 EB3003 Cache, Meadowville 1 9 8 9.0 14.3
2 EB3004 Cache, North 2 7 7 10.7 28.6
2 EB3005 Cache, South 3 10 10 12.5 30.0
16B EB3006 Central Mtns, Manti 35 113 113 11.8 30.8
16A EB3007 Central Mtns, Nebo 6 11 11 11.6 50.0
21B EB3008 Fillmore, Pahvant 8 14 14 14.1 53.8
13A EB3009 La Sal, La Sal Mtns 8 33 33 10.5 25.0
23 EB3010 Monroe 3 10 10 16.8 30.0
24 EB3011 Mt Dutton 7 17 17 9.0 43.8
11A EB3012 Nine Mile, Anthro 2 9 9 13.3 25.0
8C EB3013 North Slope, Three Corners 2 7 7 16.8 33.3
18 EB3014 Oquirrh-Stansbury 0 5 5 14.6 0.0
28 EB3015 Panguitch Lake 4 10 10 13.6 44.4
27 EB3016 Paunsaugunt 2 19 18 10.7 12.5
25C/26 EB3017 Plateau, Boulder/Kaiparowits 10 18 18 15.8 55.6
25AB EB3018 Plateau, Fishlake/Thousand Lakes 15 52 50 12.1 29.2
14B EB3019 San Juan Bull Elk 9 17 17 15.6 50.0
9C EB3020 South Slope, Diamond Mtn 4 12 12 7.5 33.3
20 EB3021 Southwest Desert 13 30 30 12.2 44.8
17 EB3022 Wasatch Mtns 58 266 260 11.2 22.4
19A EB3023 West Desert, Deep Creek 4 5 5 8.7 75.0
89

Limited-entry any weapon bull elk harvest, Utah 2019.
Unit Hunt
number Hunt name
Bull harvest
Permits Hunters afield
Mean days hunted
Success rate (%)
22A EB3024 Beaver, East 9 10 10 5.1 90.0
22A EB3025 Beaver, East 7 7 7 4.4 100.0
10AB EB3026 Book Cliffs, Bitter Creek/South 46 56 55 5.0 84.6
10AB EB3027 Book Cliffs, Bitter Creek/South 21 34 34 5.4 60.6
10C EB3028 Book Cliffs, Little Creek Roadless 13 15 15 4.2 86.7
1 EB3029 Box Elder, Grouse Creek 5 6 6 3.8 83.3
1 EB3030 Box Elder, Grouse Creek 5 7 7 8.6 71.4
1 EB3031 Box Elder, Pilot Mtn 11 11 11 4.4 100.0
2 EB3032 Cache, Meadowville 16 31 31 5.0 50.0
2 EB3033 Cache, Meadowville 6 20 19 5.4 31.6
2 EB3034 Cache, North 9 11 11 3.8 80.0
2 EB3035 Cache, North 3 6 6 6.0 50.0
2 EB3036 Cache, South 12 16 16 3.6 75.0
2 EB3037 Cache, South 7 9 9 3.8 77.8
16B EB3038 Central Mtns, Manti 111 144 142 4.8 78.2
16B EB3126 Central Mtns, Manti 78 106 104 4.9 75.2
16B EB3039 Central Mtns, Manti 11 21 20 6.2 55.0
16A EB3040 Central Mtns, Nebo 14 15 15 2.9 92.9
16A EB3041 Central Mtns, Nebo 6 11 11 5.7 54.5
21B EB3042 Fillmore, Pahvant 14 23 21 5.2 68.4
21B EB3043 Fillmore, Pahvant 7 13 13 4.2 53.8
13B EB3044 La Sal, Dolores Triangle 5 5 5 4.5 100.0
13A EB3045 La Sal, La Sal Mtns 33 47 46 5.0 72.1
13A EB3046 La Sal, La Sal Mtns 11 30 29 6.2 39.3
23 EB3047 Monroe 16 17 17 4.0 94.1
23 EB3048 Monroe 9 9 9 2.1 100.0
24 EB3049 Mt Dutton 12 14 14 5.2 84.6
24 EB3050 Mt Dutton 3 6 6 6.3 50.0
11A EB3051 Nine Mile, Anthro 4 6 6 6.0 66.7
11A EB3052 Nine Mile, Anthro 6 8 8 4.4 71.4
8C EB3053 North Slope, Three Corners 13 20 20 4.8 65.0
18 EB3054 Oquirrh-Stansbury 7 7 7 4.1 100.0
18 EB3055 Oquirrh-Stansbury 3 3 3 1.7 100.0
28 EB3056 Panguitch Lake 13 16 16 3.9 80.0
28 EB3057 Panguitch Lake 6 10 10 5.3 60.0
90
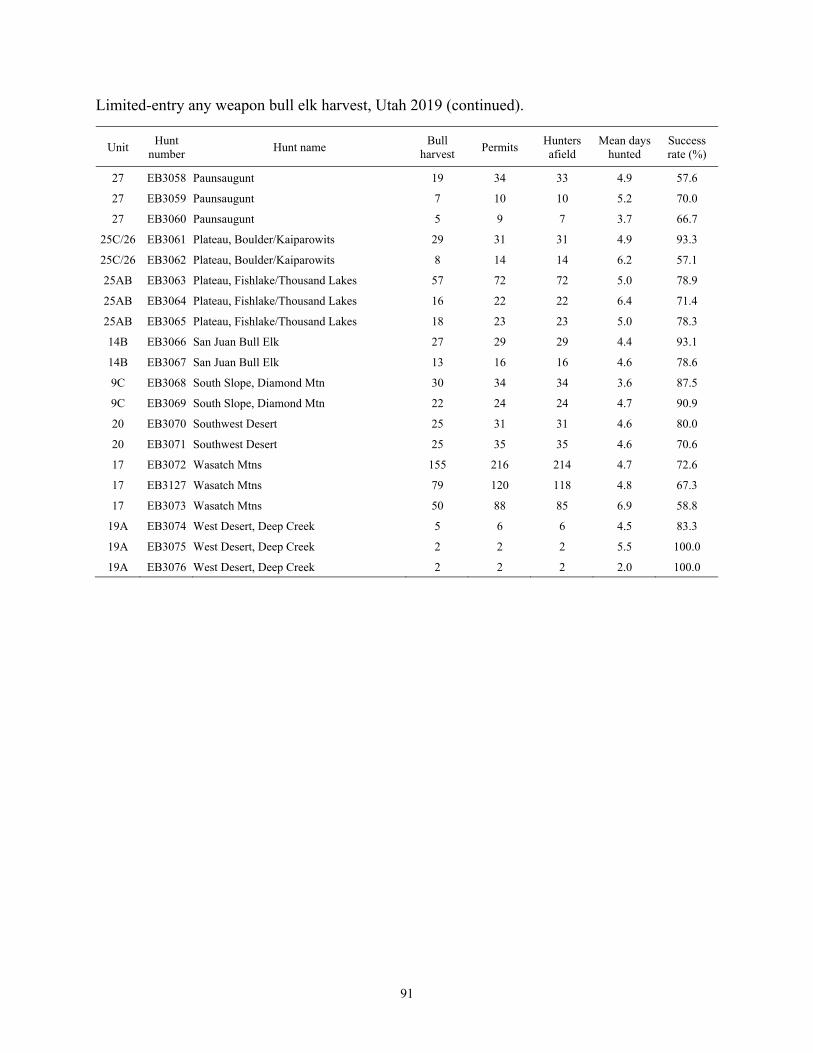
Limited-entry any weapon bull elk harvest, Utah 2019 (continued).
Unit Hunt
number Hunt name
Bull harvest
Permits Hunters afield
Mean days hunted
Success rate (%)
27 EB3058 Paunsaugunt 19 34 33 4.9 57.6
27 EB3059 Paunsaugunt 7 10 10 5.2 70.0
27 EB3060 Paunsaugunt 5 9 7 3.7 66.7
25C/26 EB3061 Plateau, Boulder/Kaiparowits 29 31 31 4.9 93.3
25C/26 EB3062 Plateau, Boulder/Kaiparowits 8 14 14 6.2 57.1
25AB EB3063 Plateau, Fishlake/Thousand Lakes 57 72 72 5.0 78.9
25AB EB3064 Plateau, Fishlake/Thousand Lakes 16 22 22 6.4 71.4
25AB EB3065 Plateau, Fishlake/Thousand Lakes 18 23 23 5.0 78.3
14B EB3066 San Juan Bull Elk 27 29 29 4.4 93.1
14B EB3067 San Juan Bull Elk 13 16 16 4.6 78.6
9C EB3068 South Slope, Diamond Mtn 30 34 34 3.6 87.5
9C EB3069 South Slope, Diamond Mtn 22 24 24 4.7 90.9
20 EB3070 Southwest Desert 25 31 31 4.6 80.0
20 EB3071 Southwest Desert 25 35 35 4.6 70.6
17 EB3072 Wasatch Mtns 155 216 214 4.7 72.6
17 EB3127 Wasatch Mtns 79 120 118 4.8 67.3
17 EB3073 Wasatch Mtns 50 88 85 6.9 58.8
19A EB3074 West Desert, Deep Creek 5 6 6 4.5 83.3
19A EB3075 West Desert, Deep Creek 2 2 2 5.5 100.0
19A EB3076 West Desert, Deep Creek 2 2 2 2.0 100.0
91
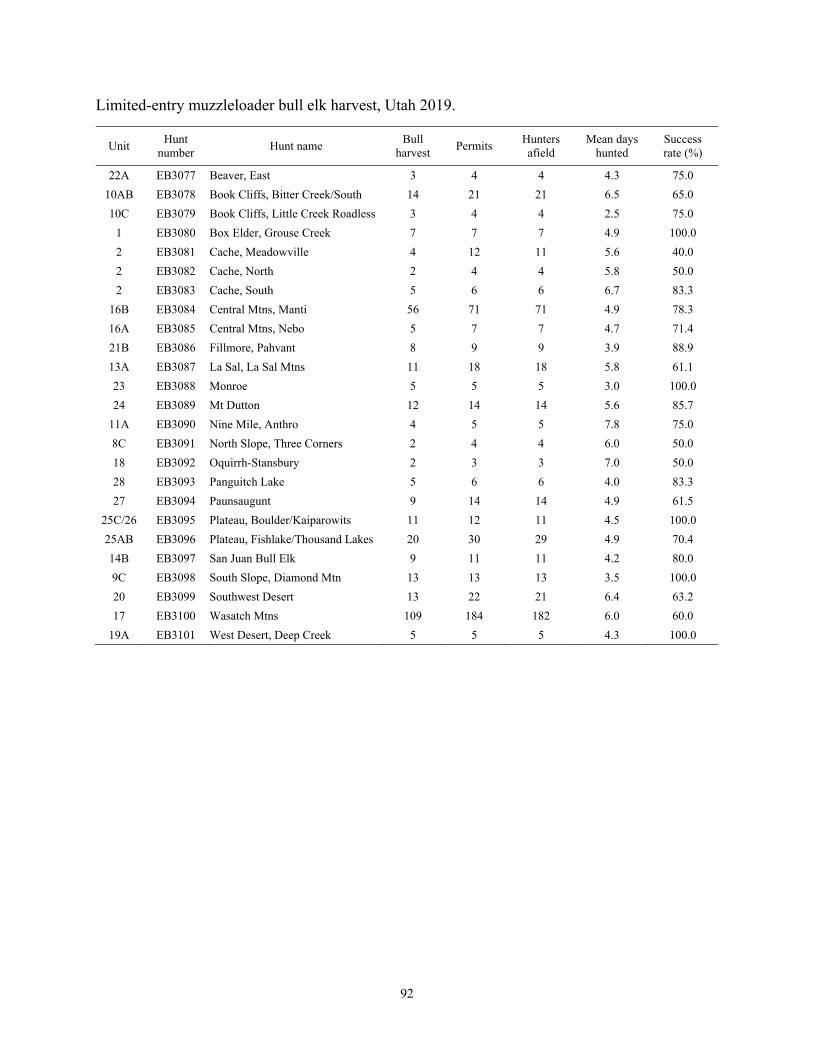
Limited-entry muzzleloader bull elk harvest, Utah 2019.
Unit Hunt
number Hunt name
Bull harvest
Permits Hunters afield
Mean days hunted
Success rate (%)
22A EB3077 Beaver, East 3 4 4 4.3 75.0
10AB EB3078 Book Cliffs, Bitter Creek/South 14 21 21 6.5 65.0
10C EB3079 Book Cliffs, Little Creek Roadless 3 4 4 2.5 75.0
1 EB3080 Box Elder, Grouse Creek 7 7 7 4.9 100.0
2 EB3081 Cache, Meadowville 4 12 11 5.6 40.0
2 EB3082 Cache, North 2 4 4 5.8 50.0
2 EB3083 Cache, South 5 6 6 6.7 83.3
16B EB3084 Central Mtns, Manti 56 71 71 4.9 78.3
16A EB3085 Central Mtns, Nebo 5 7 7 4.7 71.4
21B EB3086 Fillmore, Pahvant 8 9 9 3.9 88.9
13A EB3087 La Sal, La Sal Mtns 11 18 18 5.8 61.1
23 EB3088 Monroe 5 5 5 3.0 100.0
24 EB3089 Mt Dutton 12 14 14 5.6 85.7
11A EB3090 Nine Mile, Anthro 4 5 5 7.8 75.0
8C EB3091 North Slope, Three Corners 2 4 4 6.0 50.0
18 EB3092 Oquirrh-Stansbury 2 3 3 7.0 50.0
28 EB3093 Panguitch Lake 5 6 6 4.0 83.3
27 EB3094 Paunsaugunt 9 14 14 4.9 61.5
25C/26 EB3095 Plateau, Boulder/Kaiparowits 11 12 11 4.5 100.0
25AB EB3096 Plateau, Fishlake/Thousand Lakes 20 30 29 4.9 70.4
14B EB3097 San Juan Bull Elk 9 11 11 4.2 80.0
9C EB3098 South Slope, Diamond Mtn 13 13 13 3.5 100.0
20 EB3099 Southwest Desert 13 22 21 6.4 63.2
17 EB3100 Wasatch Mtns 109 184 182 6.0 60.0
19A EB3101 West Desert, Deep Creek 5 5 5 4.3 100.0
92

Multi-season limited-entry bull elk harvest, Utah 2019.
Unit Hunt
number Hunt name
Bull harvest
Permits Hunters afield
Mean days hunted
Success rate (%)
22A EB3102 Beaver, East 1 1 1 6.0 100.0
10AB EB3103 Book Cliffs, Bitter Creek/South 6 6 6 15.7 100.0
10C EB3104 Book Cliffs, Little Creek Roadless 1 2 2 4.5 50.0
1 EB3128 Box Elder, Grouse Creek 0 1 1 10.0 0.0
2 EB3105 Cache, Meadowville 3 4 4 11.8 75.0
2 EB3106 Cache, North 1 2 2 13.5 50.0
2 EB3107 Cache, South 2 2 2 27.5 100.0
16B EB3108 Central Mtns, Manti 14 17 17 13.1 81.3
16A EB3109 Central Mtns, Nebo 1 2 2 14.0 50.0
21B EB3110 Fillmore, Pahvant 2 3 3 15.7 66.7
13A EB3111 La Sal, La Sal Mtns 6 6 6 6.8 100.0
23 EB3112 Monroe 2 2 2 17.0 100.0
24 EB3113 Mt Dutton 3 3 3 9.7 100.0
11A EB3114 Nine Mile, Anthro 2 2 2 25.0 100.0
8C EB3115 North Slope, Three Corners 2 2 2 4.5 100.0
18 EB3116 Oquirrh-Stansbury 1 2 2 20.0 50.0
28 EB3117 Panguitch Lake 1 2 2 7.0 50.0
27 EB3118 Paunsaugunt 1 4 4 18.3 25.0
25C/26 EB3119 Plateau, Boulder/Kaiparowits 4 4 4 10.7 100.0
25AB EB3120 Plateau, Fishlake/Thousand Lakes 8 8 8 18.1 100.0
14B EB3121 San Juan Bull Elk 4 4 4 12.7 100.0
9C EB3122 South Slope, Diamond Mtn 2 3 3 16.3 66.7
20 EB3123 Southwest Desert 5 6 6 14.0 83.3
17 EB3124 Wasatch Mtns 23 30 29 19.1 78.6
19A EB3125 West Desert, Deep Creek 1 2 2 18.5 50.0
Statewide Sportsman/Conservation 2 2 2 35.0 100.0
93

CWMU bull elk harvest, Utah 2019.
Unit Hunt
number CWMU
Bull harvest
Permits Hunters afield
Mean days hunted
Success rate (%)
27 EB3500 Alton 8 8 8 3.4 100.0
25AB EB3501 Bar J Ranch 10 10 10 5.2 100.0
16B EB3502 Bear Mountain 4 7 7 3.7 57.1
3 EB3503 Bear Springs 5 5 5 1.8 100.0
11B/16B EB3504 Black Hawk 2 5 5 7.7 33.3
25AB EB3505 Boobe Hole 15 15 15 3.4 100.0
4 EB3506 Causey Spring 10 13 13 3.9 76.9
4 EB3508 Chimney Rock 16 18 17 4.3 93.8
3 EB3509 Coldwater Ranch 15 15 15 3.6 100.0
11B EB3510 Conover-Jensen 7 7 7 3.4 100.0
1 EB3511 Cotton Thomas 2 3 3 7.3 66.7
17A EB3512 Coyote Little Pole 8 10 10 3.0 80.0
4 EB3514 Deseret 97 103 103 3.4 93.9
1 EB3515 Double Cone 2 7 7 4.6 28.6
17C EB3604 Double R Ranch 6 10 10 5.6 55.6
4 EB3516 Durst Mountain 13 16 16 3.4 81.8
6 EB3517 East Fork Chalk Creek 24 30 29 8.2 84.6
6 EB3519 Ensign Ranches 20 23 23 3.6 88.9
4 EB3520 Folley Ridge 14 16 16 3.0 87.5
6 EB3521 Grass Valley/Clark Canyon 58 95 91 4.2 63.2
25AB EB3522 Grazing Pasture 6 6 6 3.0 100.0
4 EB3523 Guildersleeve 9 10 10 3.8 88.9
5 EB3524 Hardscrabble 4 10 10 4.3 37.5
18 EB3525 Heaston East 17 17 17 2.0 100.0
16B EB3526 Hiawatha 2 8 8 7.0 20.0
17C EB3527 Indian Head 13 14 14 2.5 92.9
1 EB3528 Ingham Peak 3 5 5 3.6 60.0
13A EB3529 J. B. Ranch 7 8 8 3.4 85.7
25AB EB3531 Johnson Mountain Ranch 11 15 15 5.9 75.0
16B EB3532 Jump Creek 4 5 5 3.0 75.0
1 EB3533 Junction Valley 4 6 6 3.4 60.0
17B EB3534 Little Red Creek 12 14 14 3.9 84.6
5 EB3535 Lone Tree Taylor Hollow 16 19 19 3.4 82.4
11B EB3536 Minnie Maud Ridge 29 39 39 3.9 73.5
17B EB3538 Moon Ranch 3 11 11 5.4 27.3
16A EB3606 Mountain Sky Ranch 4 6 6 8.5 66.7
5 EB3539 Mountain Top 25 30 30 4.0 82.6
1 EB3565 North Peaks 3 7 7 4.6 40.0
16B EB3540 Old Woman Plateau 10 10 10 3.9 100.0
21B EB3603 Pahvant Ensign 7 7 7 4.0 100.0
94

CWMU bull elk harvest, Utah 2019 (continued).
Unit Hunt
number CWMU
Bull harvest
Permits Hunters afield
Mean days hunted
Success rate (%)
11B EB3541 Patmos Ridge 2 2 2 5.0 100.0
3 EB3542 Powder Mountain 2 4 4 5.5 50.0
11B EB3543 Preston Nutter Ranch 9 13 12 3.1 75.0
13A EB3544 Redd Ranches 16 19 19 4.7 83.3
1 EB3545 Riverview Ranch LLC 8 8 8 5.5 100.0
11B EB3546 Roan Cliffs 17 19 19 5.1 87.5
17B EB3547 Sand Creek 4 6 6 4.3 66.7
16B EB3548 Scofield Canyons 8 8 8 2.6 100.0
16B EB3549 Scofield East 6 8 8 3.6 71.4
16B EB3550 Scofield West 8 8 8 4.8 100.0
2 EB3551 SJ Ranch 8 8 8 2.6 100.0
4 EB3552 Skull Crack 9 10 9 3.0 100.0
16B/17C EB3553 Soldier Summit 15 15 15 4.0 100.0
3 EB3554 South Canyon 8 10 10 2.8 77.8
14B EB3555 Spring Creek/Dodge 11 12 12 5.4 90.9
2 EB3557 Strawberry Ridge 19 20 20 3.6 95.0
14B EB3558 Summit Point 4 4 4 7.5 100.0
17A EB3559 Three C 10 10 10 3.2 100.0
6 EB3561 Two Bear 29 30 30 3.7 96.2
17A EB3562 Wallsburg 5 7 7 5.5 66.7
6 EB3563 Weber Florence Creek 50 69 68 3.3 73.6
10AB EB3607 West Willow Creek Ranch 0 2 2 8.5 0.0
4 EB3564 Woodruff Creek South 14 21 21 4.3 68.4
95

Limited-entry antlerless elk harvest, Utah 2019.
Unit Hunt
number Hunt
Antlerless harvest Permits
Hunters afield
Mean days hunted
Success rate (%) Cow Calf Total
22 EA1183 Beaver, East 19 7 26 113 128 4.3 22.9
22 EA1184 Beaver, North 66 8 74 193 219 4.6 38.1
22 EA1190 Beaver, North 71 8 79 194 222 4.9 40.8
22 EA1191 Beaver, North 46 3 49 218 242 5.5 22.4
22 EA1219 Beaver, North 46 6 52 136 145 3.9 38.3
10 EA1003 Book Cliffs, Bitter Creek East 33 1 34 48 53 2.9 72.2
10 EA1004 Book Cliffs, Little Creek Roadless 12 2 14 24 29 3.4 56.3
1 EA1007 Box Elder, Grouse Creek 2 0 2 8 10 7.0 20.0
1 EA1008 Box Elder, Grouse Creek 0 0 0 6 10 3.8 0.0
1 EA1203 Box Elder, Pilot Mtn 3 0 3 5 5 3.0 50.0
1 EA1204 Box Elder, Pilot Mtn 3 0 3 4 4 2.5 75.0
2 EA1009 Cache, East 101 15 116 458 482 5.1 25.3
2 EA1010 Cache, Rich 7 2 9 33 33 4.3 26.1
2 EA1193 Cache, Rich 10 1 11 31 34 5.3 36.0
2 EA1011 Cache, Richards Hollow 14 0 14 36 45 7.0 38.1
2 EA1012 Cache, Richmond-Hyde Park 7 0 7 30 35 2.9 22.7
2 EA1194 Cache, Richmond-Hyde Park 0 0 0 27 35 8.8 0.0
2 EA1205 Cache, Richmond-Hyde Park 5 1 6 33 35 5.4 18.2
2 EA1206 Cache, Richmond-Hyde Park 11 1 12 32 35 6.8 38.9
16 EA1013 Central Mtns, Central Manti 11 0 11 27 28 5.7 42.9
16 EA1014 Central Mtns, Ephraim 9 0 9 39 50 8.7 22.2
16 EA1015 Central Mtns, Ferron Canyon 13 1 14 28 30 4.5 50.0
16 EA1185 Central Mtns, Ferron Canyon Southeast 6 0 6 20 20 7.3 30.8
16 EA1017 Central Mtns, Gordon Creek-Price Canyon 18 0 18 29 30 9.2 62.5
16 EA1018 Central Mtns, Horn Mtn 6 0 6 10 10 4.0 62.5
16 EA1220 Central Mtns, Manti — — — 0 3 — —
16 EA1019 Central Mtns, Milburn 1 0 1 37 47 8.6 4.0
16 EA1020 Central Mtns, Mohrland-Stump Flat 9 1 10 10 10 4.3 100.0
16 EA1207 Central Mtns, Moroni Hills 13 4 17 69 75 7.2 25.0
16 EA1021 Central Mtns, Nebo 22 0 22 66 73 4.5 34.1
16 EA1208 Central Mtns, Nebo 39 4 43 68 72 4.8 63.5
16 EA1022 Central Mtns, North Manti 63 8 71 221 236 4.7 32.2
16 EA1023 Central Mtns, South Manti 19 1 20 39 39 4.4 51.9
16 EA1024 Central Mtns, South Manti 20 0 20 58 59 6.9 34.9
16 EA1025 Central Mtns, West Manti 15 1 16 69 78 10.1 23.7
6 EA1026 Chalk Creek 82 8 90 281 347 7.1 32.2
5 EA1027 East Canyon, Davis-North Salt Lake 53 4 57 224 253 6.1 25.5
5 EA1028 East Canyon, Morgan 24 6 30 132 153 4.8 22.4
5 EA1029 East Canyon, Summit 20 5 25 127 179 6.1 19.7
21 EA1209 Fillmore, Oak Creek LE 54 3 57 86 99 5.6 66.1
21 EA1030 Fillmore, Pahvant 12 0 12 20 20 4.6 61.5
21 EA1031 Fillmore, Pahvant 10 0 10 16 19 4.3 58.3
96

Limited-entry antlerless elk harvest, Utah 2019 (continued).
Unit Hunt
number Hunt
Antlerless harvest Permits
Hunters afield
Mean days hunted
Success rate (%)Cow Calf Total
7 EA1033 Kamas 19 1 20 74 99 7.5 27.1
7 EA1034 Kamas, Francis 4 1 5 21 25 5.3 25.0
7 EA1035 Kamas, Oakley 19 5 24 63 75 7.8 37.8
7 EA1036 Kamas, West Hills 0 0 0 8 15 4.8 0.0
13 EA1037 La Sal, Dolores Triangle 11 0 11 43 47 4.2 25.7
13 EA1038 La Sal, La Sal Mtns 32 2 34 110 120 5.0 30.4
13 EA1039 La Sal, La Sal Mtns 27 10 37 76 78 5.0 47.8
13 EA1210 La Sal, La Sal Mtns-Taylor Flat 13 1 14 28 30 6.4 50.0
23 EA1040 Monroe, Koosharem Valley 2 2 4 27 29 8.1 16.7
4 EA1042 Morgan-South Rich, East Lost Creek 7 2 9 34 54 3.9 26.3
4 EA1044 Morgan-South Rich, South Rich 13 0 13 44 50 9.1 29.6
4 EA1045 Morgan-South Rich, South Weber 0 0 0 25 30 5.8 0.0
4 EA1046 Morgan-South Rich, West Lost Creek 15 2 17 31 57 4.5 52.9
24 EA1047 Mt Dutton 18 0 18 43 49 4.4 42.4
24 EA1048 Mt Dutton 10 0 10 39 47 3.3 26.1
24 EA1049 Mt Dutton, Deep Creek 27 1 28 70 91 2.9 40.8
24 EA1050 Mt Dutton, East 28 4 32 85 96 3.0 37.5
24 EA1051 Mt Dutton, East 38 3 41 83 96 3.9 49.1
24/25 EA1186 Mt Dutton/Plateau 27 1 28 47 48 3.5 59.5
11 EA1052 Nine Mile, Avintaquin-West Anthro 81 8 89 176 196 3.7 50.4
11 EA1054 Nine Mile, West Anthro 73 7 80 213 246 4.6 37.4
8 EA1055 North Slope, Greendale 3 0 3 15 15 4.3 16.7
8 EA1056 North Slope, Greendale 2 0 2 6 9 5.0 40.0
8 EA1058 North Slope, Henrys Fork-Burnt Fork 17 0 17 69 74 3.6 25.0
8 EA1059 North Slope, Manila-Phil Pico 0 0 0 8 10 6.0 0.0
8 EA1196 North Slope, Summit 17 0 17 72 75 6.6 22.8
8 EA1060 North Slope, West Daggett 8 0 8 33 40 6.0 25.9
8 EA1061 North Slope, West Daggett 6 0 6 56 60 5.7 10.5
8 EA1062 North Slope, West Daggett 20 0 20 46 48 4.3 43.6
3 EA1063 Ogden 20 2 22 154 173 5.4 14.1
3 EA1064 Ogden 51 10 61 159 180 5.2 38.5
28 EA1066 Panguitch Lake 23 6 29 80 97 3.2 36.4
28 EA1067 Panguitch Lake 29 4 33 93 99 2.9 35.8
28 EA1068 Panguitch Lake 64 12 76 163 192 3.7 46.4
28 EA1069 Panguitch Lake 16 3 19 80 94 4.3 23.2
27 EA1073 Paunsaugunt 19 2 21 79 100 7.7 26.3
27 EA1187 Paunsaugunt, Hatch Bench 7 2 9 78 99 5.8 11.4
30 EA1074 Pine Valley 2 0 2 18 20 7.0 11.1
25 EA1075 Plateau, Boulder East 27 5 32 86 97 6.5 37.0
25 EA1076 Plateau, Boulder West 25 1 26 54 58 5.5 48.6
25 EA1077 Plateau, Boulder-Circle Cliffs 2 0 2 15 20 9.0 10.0
97

Limited-entry antlerless elk harvest, Utah 2019 (continued).
Unit Hunt
number Hunt
Antlerless harvest Permits
Hunters afield
Mean days hunted
Success rate (%) Cow Calf Total
25 EA1078 Plateau, Fishlake/Thousand Lakes 16 1 17 44 45 4.2 40.0
25 EA1221 Plateau, Fishlake/Thousand Lakes 0 0 0 1 1 2.0 0.0
25 EA1079 Plateau, Fishlake/Thousand Lakes East 10 0 10 17 18 2.8 58.3
25 EA1080 Plateau, Fishlake/Thousand Lakes West 10 2 12 19 19 5.0 64.3
14 EA1081 San Juan 29 2 31 88 97 5.3 35.1
14 EA1197 San Juan, Elk Ridge 13 0 13 45 50 6.7 29.6
12 EA1084 San Rafael, North 2 0 2 10 10 7.3 16.7
9 EA1085 South Slope, Bonanza/Vernal 21 0 21 84 99 8.2 25.0
9 EA1087 South Slope, Bonanza/Vernal 21 9 30 88 92 6.6 33.9
9 EA1089 South Slope, Diamond Mtn 32 4 36 64 68 3.9 56.8
9 EA1090 South Slope, Diamond Mtn 27 3 30 67 75 4.2 45.0
9 EA1091 South Slope, Diamond Mtn 28 2 30 68 73 3.4 43.6
9 EA1092 South Slope, Little Mtn-Buckskin Hills 34 4 38 87 105 5.3 43.5
9 EA1093 South Slope, Little Mtn-Buckskin Hills 32 8 40 96 104 6.6 41.7
9 EA1094 South Slope, Mosby Mtn 35 0 35 77 80 6.3 45.8
9 EA1098 South Slope, Yellowstone 7 0 7 44 47 4.0 16.0
9 EA1099 South Slope, Yellowstone 22 3 25 35 49 4.0 71.4
9 EA1100 South Slope, Yellowstone 27 0 27 42 50 3.2 63.0
20 EA1101 Southwest Desert 13 5 18 45 49 5.2 40.0
20 EA1102 Southwest Desert 46 6 52 104 119 3.6 50.0
20 EA1211 Southwest Desert 42 7 49 111 123 4.0 44.4
20 EA1212 Southwest Desert 53 1 54 115 121 3.7 47.3
20 EA1213 Southwest Desert 48 0 48 111 123 4.2 43.3
20 EA1103 Southwest Desert, Northwest Part 12 1 13 26 30 4.4 50.0
20 EA1104 Southwest Desert, Northwest Part 6 1 7 27 30 3.4 26.3
20 EA1214 Southwest Desert, Northwest Part 9 0 9 24 29 3.8 37.5
20 EA1215 Southwest Desert, Northwest Part 8 0 8 21 30 2.4 35.7
20 EA1216 Southwest Desert, Northwest Part 3 0 3 24 28 4.4 11.8
17 EA1217 Wasatch Mtns, Avintaquin 3 0 3 45 46 4.6 6.7
17 EA1110 Wasatch Mtns, Salt Lake 23 2 25 30 38 5.3 81.3
17 EA1111 Wasatch Mtns, Wallsburg 6 0 6 19 26 4.2 30.8
17 EA1112 Wasatch Mtns, Wallsburg 21 3 24 44 47 2.8 54.8
17 EA1113 Wasatch Mtns, West Heber 15 0 15 18 24 5.0 80.0
17 EA1114 Wasatch Mtns, West Timpanogos 23 0 23 24 25 2.9 94.7
17 EA1189 Wasatch Mtns, West-Central 66 12 78 335 386 4.1 23.2
19 EA1218 West Desert, Tintic 28 8 36 67 75 13.4 53.5
29 EA1116 Zion 3 2 5 38 41 7.2 12.5
29 EA1117 Zion 15 1 16 41 47 7.7 40.0
98

Limited-entry private-lands-only antlerless elk harvest, Utah 2019.
Unit Hunt
number Hunt
Antlerless harvest Permits
Hunters afield
Mean days hunted
Success rate (%) Cow Calf Total
22 EA2021 Beaver, East 5 0 5 7 17 4.3 66.7
1 EA2022 Box Elder, East 5 0 5 26 36 8.8 20.0
16B EA2011 Central Mtns, Manti 52 6 58 175 196 6.8 33.3
16A EA2016 Central Mtns, Nebo 42 9 51 93 100 11.1 54.5
6 EA2004 Chalk Creek 207 19 226 404 476 5.4 55.8
5 EA2003 East Canyon 67 4 71 199 247 9.6 35.8
21A EA2023 Fillmore, Oak Creek LE 8 0 8 27 38 6.3 28.6
13A EA2009 La Sal, La Sal Mtns 16 2 18 39 50 8.1 46.7
4 EA2002 Morgan-South Rich 53 2 55 113 158 5.7 48.9
24 EA2017 Mt Dutton 12 0 12 18 35 10.0 66.7
11A EA2008 Nine Mile, Anthro-Myton Bench 5 0 5 26 36 7.5 18.2
8B EA2005 North Slope, West Daggett 43 0 43 97 105 8.5 44.7
3 EA2001 Ogden 158 26 184 375 458 8.7 49.2
28 EA2018 Panguitch Lake 8 2 10 48 73 10.8 21.1
27 EA2015 Paunsaugunt 19 0 19 97 119 10.2 20.0
14 EA2010 San Juan 34 3 37 47 50 11.1 77.8
12 EA2024 San Rafael 0 0 0 4 4 6.0 0.0
9BD EA2007 South Slope, Bonanza/Vernal 118 10 128 241 299 8.3 53.1
9A EA2006 South Slope, Yellowstone 223 20 243 420 454 9.2 57.8
17C EA2014 Wasatch Mtns, Avintaquin-White River 5 0 5 47 63 7.7 11.1
17B EA2013 Wasatch Mtns, Currant Creek 38 2 40 125 143 8.9 32.3
17A EA2012 Wasatch Mtns, West 64 7 71 180 214 6.7 39.3
19C EA2019 West Desert, Tintic Valley 10 0 10 45 59 8.2 21.7
29 EA2020 Zion 109 7 116 321 383 8.9 36.3
99

CWMU antlerless elk harvest, Utah 2019.
Unit Hunt
number CWMU
Antlerless harvest Permits
Hunters afield
Mean days hunted
Success rate (%) Cow Calf Total
27 EA1118 Alton 0 0 0 10 10 11.0 0.0
25AB EA1119 Bar J Ranch 7 2 9 10 10 1.3 85.7
16B EA1120 Bear Mountain 0 0 0 14 15 4.0 0.0
3 EA1198 Bear Springs 0 0 0 4 4 3.0 0.0
25AB EA1121 Boobe Hole 8 0 8 9 10 3.3 88.9
3 EA1122 Causey Spring 5 0 5 7 7 1.8 75.0
4 EA1124 Chimney Rock 2 1 3 8 10 2.0 40.0
3 EA1125 Coldwater Ranch 9 0 9 10 10 1.8 88.9
1 EA1126 Cotton Thomas 0 0 0 5 5 4.0 0.0
17A EA1127 Coyote Little Pole 6 0 6 21 21 3.0 30.0
4 EA1129 Deseret 166 23 189 207 219 1.7 91.2
1 EA1130 Double Cone 0 0 0 7 8 1.8 0.0
17C EA1200 Double R Ranch 4 0 4 6 9 1.6 60.0
4 EA1131 Durst Mountain 11 0 11 19 19 1.7 58.3
6 EA1132 East Fork Chalk Creek 8 0 8 23 28 5.8 33.3
6 EA1134 Ensign Ranches 30 3 33 58 69 2.5 57.1
4 EA1135 Folley Ridge 2 0 2 5 5 2.4 40.0
6 EA1136 Grass Valley/Clark Canyon 25 3 28 42 49 1.5 65.6
25AB EA1137 Grazing Pasture 11 0 11 15 15 3.6 75.0
4 EA1138 Guildersleeve 3 0 3 8 8 2.5 33.3
5 EA1139 Hardscrabble 1 0 1 15 16 3.8 8.3
18 EA1140 Heaston East 9 0 9 9 9 1.2 100.0
16B EA1141 Hiawatha 10 0 10 15 16 2.9 70.0
17C EA1142 Indian Head 4 0 4 6 6 3.7 66.7
13A EA1143 J. B. Ranch 26 0 26 32 32 1.8 81.5
25AB EA1145 Johnson Mountain Ranch 17 1 18 20 20 1.3 88.9
16B EA1146 Jump Creek 15 0 15 15 15 2.9 100.0
17B EA1147 Little Red Creek 14 2 16 18 18 2.3 86.7
5 EA1148 Lone Tree Taylor Hollow 3 0 3 7 10 2.5 50.0
4 EA1199 Meadow Creek 8 0 8 18 20 3.1 45.5
11B EA1149 Minnie Maud Ridge 1 0 1 6 7 2.8 16.7
17B EA1151 Moon Ranch 2 0 2 4 5 2.0 50.0
5 EA1152 Mountain Top 4 0 4 17 17 2.6 21.4
16B EA1153 Old Woman Plateau 1 0 1 3 3 2.7 33.3
21B EA1192 Pahvant Ensign 3 0 3 14 17 1.6 22.2
3 EA1155 Powder Mountain 0 0 0 7 7 3.8 0.0
11B EA1156 Preston Nutter Ranch 3 0 3 4 5 2.0 75.0
13A EA1157 Redd Ranches 14 0 14 25 25 4.2 55.6
100

CWMU antlerless elk harvest, Utah 2019 (continued).
Unit Hunt
number CWMU
Antlerless harvest Permits
Hunters afield
Mean days hunted
Success rate (%) Cow Calf Total
1 EA1158 Riverview Ranch LLC 0 0 0 8 8 3.3 0.0
11B EA1159 Roan Cliffs 4 0 4 4 6 3.5 100.0
17B EA1160 Sand Creek 3 0 3 5 5 2.3 66.7
16B EA1161 Scofield Canyons 7 1 8 12 15 3.0 66.7
16B EA1162 Scofield East 7 0 7 12 13 3.3 62.5
16B EA1163 Scofield West 13 2 15 32 38 3.5 45.5
2 EA1164 SJ Ranch 5 1 6 6 6 1.6 100.0
4 EA1165 Skull Crack 13 2 15 15 15 1.5 100.0
16B/17C EA1166 Soldier Summit 10 0 10 13 15 2.4 75.0
3 EA1167 South Canyon 4 0 4 5 5 2.3 75.0
14B EA1168 Spring Creek/Dodge 6 0 6 14 17 5.8 40.0
2 EA1170 Strawberry Ridge 5 0 5 10 10 2.0 50.0
17A EA1172 Three C 17 0 17 25 26 6.3 68.4
6 EA1174 Two Bear 15 3 18 24 27 1.5 75.0
17A EA1175 Wallsburg 0 1 1 7 8 3.4 20.0
6 EA1176 Weber Florence Creek 13 1 14 49 50 3.4 29.4
10AB EA1202 West Willow Creek Ranch 0 0 0 2 4 1.0 0.0
4 EA1177 Woodruff Creek South 1 0 1 5 8 2.0 25.0
101

Antlerless elk control harvest, Utah 2019.
Unit Hunt name Cow
harvest Calf
harvest Total
harvest Hunters afield
Mean days hunted
Success rate (%)
6 Chalk Creek 10 3 13 294 6.0 4.4
5 East Canyon 13 0 13 294 5.6 4.4
15 Henry Mtns 0 0 0 19 2.8 0.0
4 Morgan-South Rich 19 0 19 278 6.6 6.8
30 Pine Valley 0 0 0 109 17.7 0.0
9 South Slope, Yellowstone 147 41 188 1568 6.9 12.0
19 West Desert, Tintic 29 0 29 147 10.0 19.7
19 West Desert, Vernon 35 3 38 150 7.8 25.3
Unknown 45 3 48 153 5.0 31.4
Statewide totals* 298 50 348 2810 7.1 12.4
3,254 antlerless elk control permits were sold in 2019. *Statewide totals for hunters afield do not equal the sum of the columns because hunters could hunt multiple units.
102

Landowner (free permit) mitigation elk harvest by management unit / subunit, Utah 2019.
Unit Subunit Antlerless harvest
Permits Hunters afield
Success rate* (%) Cow Calf Total
22 Beaver — Beaver 13 3 16 88 77 13.3
10 Book Cliffs — Book Cliffs 0 2 2 4 2 100.0
1 Box Elder B Hansel Mtn 12 0 12 38 36 25.0
1 Box Elder C Pilot Mtn 0 0 0 8 8 0.0
1 Box Elder A West Box Elder 9 0 9 40 33 13.3
2 Cache — Cache 7 6 13 121 100 12.2
16 Central Mtns B Manti 67 5 72 205 182 36.2
16 Central Mtns A Nebo 10 2 12 85 74 17.1
6 Chalk Creek — Chalk Creek 31 5 36 86 69 39.3
5 East Canyon — East Canyon 7 3 10 66 59 16.7
21 Fillmore A Oak Creek 7 0 7 11 10 66.7
21 Fillmore B Pahvant 6 0 6 25 22 33.3
15 Henry Mtns — Henry Mtns — — — 0 — —
26 Kaiparowits — Kaiparowits 1 0 1 8 6 20.0
7 Kamas — Kamas 6 0 6 26 23 25.0
13 La Sal B Dolores Triangle — — — 0 — —
13 La Sal A La Sal Mtns 5 3 8 8 6 100.0
23 Monroe — Monroe 19 0 19 68 62 26.7
4 Morgan-South Rich — Morgan-South Rich 30 5 35 59 53 61.9
24 Mt Dutton — Mt Dutton 5 0 5 44 35 14.3
11 Nine Mile A Anthro 0 0 0 26 20 0.0
11 Nine Mile B1 Range Creek North 4 0 4 27 27 15.4
11 Nine Mile B2 Range Creek South — — — 2 — —
8 North Slope A Summit 0 0 0 2 2 0.0
8 North Slope C Three Corners 0 0 0 8 7 0.0
8 North Slope B West Daggett 0 0 0 18 15 0.0
3 Ogden — Ogden 15 0 15 62 55 25.0
18 Oquirrh-Stansbury — Oquirrh-Stansbury — — — 0 — —
28 Panguitch Lake — Panguitch Lake 5 0 5 29 27 16.7
27 Paunsaugunt — Paunsaugunt 7 0 7 24 17 25.0
30 Pine Valley — Pine Valley 4 0 4 18 17 20.0
25 Plateau C Boulder 20 2 22 117 90 19.4
25 Plateau A Fishlake 8 0 8 33 32 23.1
25 Plateau B Thousand Lakes 2 2 4 18 18 25.0
14 San Juan A Montezuma Canyon 0 0 0 32 30 0.0
14 San Juan B San Juan — — — 0 — —
12 San Rafael A San Rafael North — — — 4 — —
12 San Rafael B San Rafael South — — — 0 — —
*Some hunters had multiple permits. Success rates are per hunter.
103

Landowner (free permit) mitigation elk harvest by management unit / subunit, Utah 2019 (continued).
Unit Subunit Antlerless harvest
Permits Hunters afield
Success rate* (%) Cow Calf Total
9 South Slope D Bonanza 0 0 0 6 4 0.0
9 South Slope C Diamond Mtn — — — 0 — —
9 South Slope B Vernal 26 2 28 113 96 23.3
9 South Slope A Yellowstone 53 10 63 232 192 29.9
20 Southwest Desert — Southwest Desert 7 6 13 36 35 36.4
17 Wasatch Mtns C Avintaquin 3 0 3 26 18 9.1
17 Wasatch Mtns B Currant Creek 0 0 0 48 35 0.0
17 Wasatch Mtns A West 4 3 7 20 16 40.0
19 West Desert BC East 0 0 0 16 12 0.0
19 West Desert A West Desert 4 0 4 7 4 100.0
29 Zion — Zion 26 0 26 79 72 32.3
Statewide totals 423 59 482 1993 1698 24.5
*Some hunters had multiple permits. Success rates are per hunter.
104

Hunter (fee permit) mitigation elk harvest by management unit / subunit, Utah 2019.
Unit Subunit Antlerless harvest
Permits Hunters afield
Success rate* (%) Cow Calf Total
22 Beaver — Beaver 6 2 8 85 57 13.8
10 Book Cliffs — Book Cliffs 28 3 31 34 34 92.3
1 Box Elder B Hansel Mtn 24 0 24 72 59 38.5
1 Box Elder C Pilot Mtn 11 0 11 27 20 50.0
1 Box Elder A West Box Elder 16 0 16 124 104 14.8
2 Cache — Cache 56 11 67 183 162 39.7
16 Central Mtns B Manti 109 13 122 288 267 44.4
16 Central Mtns A Nebo 48 0 48 165 142 32.8
6 Chalk Creek — Chalk Creek 62 8 70 181 153 43.8
5 East Canyon — East Canyon 55 6 61 113 104 53.8
21 Fillmore A Oak Creek 2 0 2 17 13 20.0
21 Fillmore B Pahvant 21 0 21 35 29 62.5
15 Henry Mtns — Henry Mtns — — — 0 — —
26 Kaiparowits — Kaiparowits — — — 6 0 —
7 Kamas — Kamas 4 0 4 12 11 20.0
13 La Sal B Dolores Triangle — — — 0 — —
13 La Sal A La Sal Mtns 21 3 24 37 32 66.7
23 Monroe — Monroe 32 0 32 74 67 47.1
4 Morgan-South Rich — Morgan-South Rich 61 15 76 149 116 57.4
24 Mt Dutton — Mt Dutton 5 0 5 46 43 10.7
11 Nine Mile A Anthro — — — 2 0 —
11 Nine Mile B1 Range Creek North 21 0 21 38 38 55.6
11 Nine Mile B2 Range Creek South 4 0 4 23 22 16.7
8 North Slope A Summit 9 0 9 13 13 66.7
8 North Slope C Three Corners 2 0 2 10 10 20.0
8 North Slope B West Daggett — — — 3 — —
3 Ogden — Ogden 37 2 39 68 60 66.7
18 Oquirrh-Stansbury — Oquirrh-Stansbury — — — 0 — —
28 Panguitch Lake — Panguitch Lake 10 0 10 44 37 23.5
27 Paunsaugunt — Paunsaugunt 3 0 3 10 10 25.0
30 Pine Valley — Pine Valley 2 0 2 7 7 25.0
25 Plateau C Boulder 17 0 17 98 83 17.9
25 Plateau A Fishlake 14 0 14 29 28 50.0
25 Plateau B Thousand Lakes 16 4 20 22 20 90.0
14 San Juan A Montezuma Canyon — — — 0 — —
14 San Juan B San Juan 7 3 10 17 16 60.0
12 San Rafael A San Rafael North 0 2 2 2 2 100.0
12 San Rafael B San Rafael South — — — 0 — —
*Some hunters had multiple permits. Success rates are per hunter.
105

Hunter (fee permit) mitigation elk harvest by management unit / subunit, Utah 2019 (continued).
Unit Subunit Antlerless harvest
Permits Hunters afield
Success rate* (%) Cow Calf Total
9 South Slope D Bonanza — — — 0 — —
9 South Slope C Diamond Mtn 57 5 62 103 96 57.1
9 South Slope B Vernal 14 7 21 50 43 41.7
9 South Slope A Yellowstone — — — 3 — —
20 Southwest Desert — Southwest Desert 12 0 12 30 26 42.9
17 Wasatch Mtns C Avintaquin — — — 2 — —
17 Wasatch Mtns B Currant Creek 3 0 3 11 7 33.3
17 Wasatch Mtns A West 0 0 0 3 3 0.0
19 West Desert BC East 4 0 4 13 11 33.3
19 West Desert A West Desert 1 0 1 16 16 9.1
29 Zion — Zion 35 0 35 65 51 63.6
Statewide totals 829 84 913 2330 2012 41.3
*Some hunters had multiple permits. Success rates are per hunter.
106
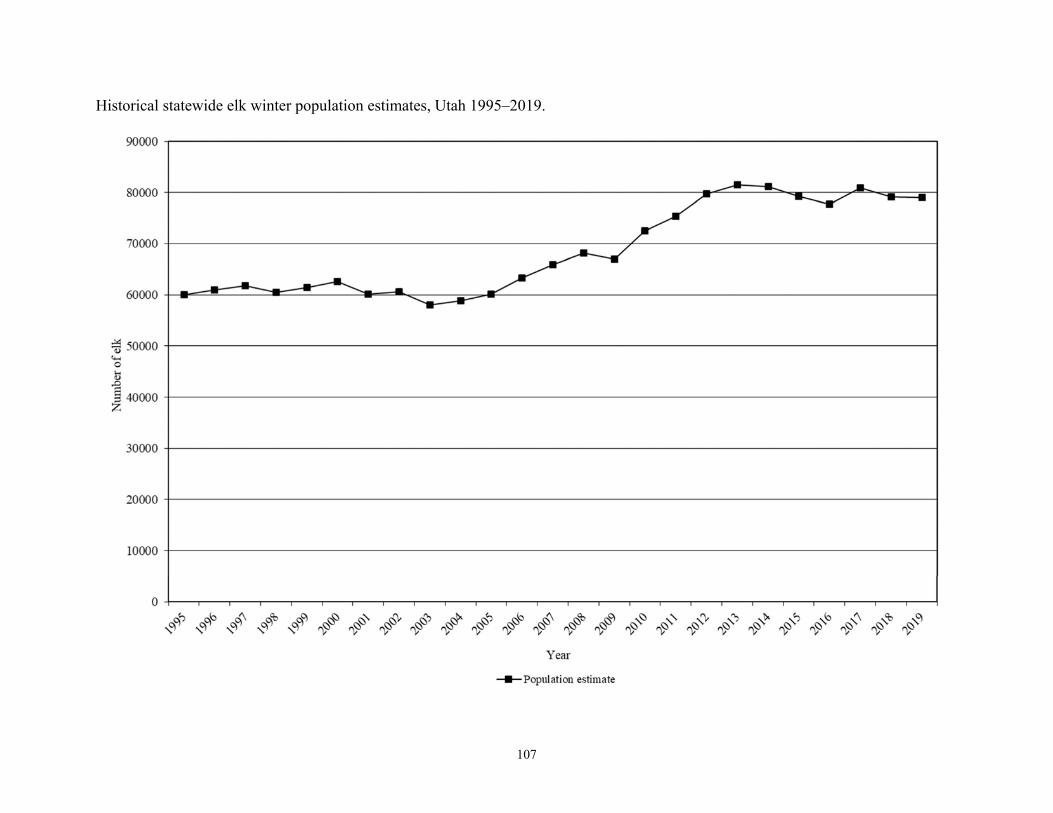
Historical statewide elk winter population estimates, Utah 1995–2019.
107

Elk winter population estimates and objectives by management unit / subunit, Utah 2015–2019.
Unit Subunit Current
objective
Winter population estimate
2015 2016 2017 2018 2019
22 Beaver — Beaver 1050 1550 1500 1450 1500 1400
10 Book Cliffs — Book Cliffs 7500 5600 5600 6300 6500 6500
1 Box Elder — Box Elder 675 750 700 700 700 650
2 Cache — Cache 2300 2300 2350 2300 2500 2500
16 Central Mtns B Manti 12000 12100 11400 11300 11300 11500
16 Central Mtns A Nebo 1450 1550 2000 2100 1300 1400
6 Chalk Creek — Chalk Creek 2400 4300 4600 4800 4000 3900
5 East Canyon — East Canyon 1800 2600 2450 2400 2400 2300
21 Fillmore — Fillmore 1600 1450 1450 1500 1400 1450
15 Henry Mtns — Henry Mtns 0 25 25 25 30 30
7 Kamas — Kamas 850 1350 1500 1650 600 600
13 La Sal — La Sal 2500 2450 2450 2600 2900 2700
23 Monroe — Monroe 1000-1004 1000 1000 1050 1000 1050
4 Morgan-South Rich — Morgan-South Rich 3800 3800 3850 4100 3650 3650
24 Mt Dutton — Mt Dutton 1500-2000 1700 1700 1800 1500 1600
11 Nine Mile A Anthro 700 1000 950 1000 1200 1100
11 Nine Mile A Range Creek 1800 1300 1650 1400 1350 1450
8 North Slope A Summit 300 800 800 800 275 275
8 North Slope C Three Corners 700 350 400 400 430 480
8 North Slope B West Daggett 1300 1700 1600 1650 700 750
3 Ogden — Ogden 2000 2300 2300 2750 1750 1750
18 Oquirrh-Stansbury — Oquirrh-Stansbury 1650 750 950 1100 1100 1100
28 Panguitch Lake — Panguitch Lake 1100 1700 1500 1500 1500 1400
27 Paunsaugunt — Paunsaugunt 140 200 300 275 275 200
30 Pine Valley — Pine Valley 50 75 75 75 50 50
25/26 Plateau C/A Boulder/Kaiparowits 1200-1700 1200 1200 1200 1200 1300
25 Plateau AB Fishlake/Thousand Lakes 5000-5900 4100 4400 4700 4900 5200
14 San Juan — San Juan 1300 1200 1000 1300 1300 1300
12 San Rafael — San Rafael 0 30 30 30 30 30
9 South Slope BC Diamond Mtn/Vernal 3000 2700 1900 2300 4300 4000
9 South Slope A Yellowstone 5000 7500 7200 7200 7500 7500
20 Southwest Desert — Southwest Desert 975 1550 1200 1200 1500 1300
17 Wasatch Mtns C Avintaquin 1800 1900 1400 1900 2000 1900
17 Wasatch Mtns B Currant Creek 3200 2300 1950 1900 2200 2600
17 Wasatch Mtns A West 3400 3600 3400 3400 3400 3400
19 West Desert — Deep Creek 350 100 150 200 350 300
29 Zion — Zion 300 350 800 600 600 475
Statewide totals 78215 79230 77730 80955 79190 79090
108

Average age of harvested bull elk on limited-entry units, Utah 2010–2019.
Unit Subunit Current
objective
Average age 3-year average 2010 2011 2012 2013 2014 2015 2016 2017 2018 2019
22 Beaver — Beaver 7.5–8.0 6.5 6.7 6.7 6.8 7.9 6.9 7.7 8.0 7.6 7.9 7.8
10 Book Cliffs AB Bitter Creek/South 6.5–7.0 6.7 6.4 7.1 7.3 7.9 7.5 7.8 6.2 6.4 6.0 6.2
10 Book Cliffs C Little Creek 7.5–8.0 6.8 6.6 7.1 7.3 7.9 7.5 7.3 7.1 7.0 7.0 7.0
1 Box Elder A Grouse Creek 4.5–5.0 5.0 4.8 6.3 5.2 5.3 5.5 5.7 5.2 6.0 5.5 5.6
1 Box Elder B Pilot Mtn 4.5–5.0 6.0 5.3 6.5 — 6.7 6.5 6.1 6.7 5.3 7.7 6.5
2 Cache C Meadowville 4.5–5.0 6.4 5.8 5.5 5.3 4.6 4.8 4.7 4.9 5.1 5.5 5.2
2 Cache A North 4.5–5.0 5.3 4.1 4.9 4.1 3.3 3.5 5.0 4.3 4.6 4.4 4.4
2 Cache B South 6.5–7.0 5.7 5.7 5.9 5.8 5.4 5.5 4.7 5.0 5.7 5.9 5.5
16 Central Mtns B Manti 5.5–6.0 6.4 5.9 6.2 6.2 6.1 5.9 6.3 6.0 6.4 6.3 6.3
16 Central Mtns A Nebo 6.5–7.0 5.7 6.0 5.8 6.2 5.6 6.0 5.3 5.8 5.8 5.7 5.8
21 Fillmore B Pahvant 7.5–8.0 7.0 6.8 6.9 7.3 7.6 7.8 8.1 7.9 7.6 6.5 7.3
13 La Sal B Dolores Triangle 5.5–6.0 — 6.0 — 9.0 — — — — 5.0 4.0 4.5
13 La Sal A La Sal Mtns 5.5–6.0 6.3 6.8 6.0 6.8 6.5 6.6 6.3 5.7 5.9 5.7 5.8
23 Monroe — Monroe 6.5–7.0 6.2 6.0 6.6 6.6 7.1 7.8 7.8 6.4 6.7 7.3 6.8
24 Mt Dutton — Mt Dutton 6.5–7.0 5.6 5.0 5.4 6.1 6.0 5.9 6.0 6.1 6.9 5.8 6.2
11 Nine Mile A Anthro 5.5–6.0 5.6 7.4 6.0 6.1 4.7 5.2 8.1 6.8 8.5 5.1 6.8
8 North Slope C Three Corners 5.5–6.0 5.5 6.0 6.0 6.3 5.9 5.7 5.4 5.0 4.7 6.0 5.2
18 Oquirrh-Stansbury — Oquirrh-Stansbury 5.5–6.0 6.1 5.2 6.1 6.0 6.2 4.9 6.1 4.4 5.8 5.4 5.2
28 Panguitch Lake — Panguitch Lake 6.5–7.0 5.7 5.5 5.6 5.8 5.8 5.4 5.9 5.1 6.1 6.7 6.0
27 Paunsaugunt — Paunsaugunt 4.5–5.0 5.8 4.7 4.9 6.5 5.3 4.9 4.8 4.5 4.8 4.8 4.7
25/26 Plateau C/A Boulder/Kaiparowits 7.5–8.0 7.1 7.4 7.4 7.6 7.9 7.3 8.2 7.3 8.2 7.5 7.7
25 Plateau AB Fishlake/Thousand Lakes 5.5–6.0 6.6 6.0 6.1 6.3 5.9 6.0 6.0 6.0 5.9 6.0 6.0
14 San Juan A San Juan Bull Elk 7.5–8.0 7.6 7.4 7.3 7.3 8.3 8.1 8.2 7.4 8.3 7.6 7.8
9 South Slope C Diamond Mtn 6.5–7.0 5.5 6.0 6.5 5.8 6.6 6.8 7.7 7.0 7.3 6.9 7.1
20 Southwest Desert — Indian Peaks 6.5–7.0 7.2 7.5 7.3 7.6 7.6 6.8 7.8 6.3 7.2 7.3 6.9
17 Wasatch Mtns — Wasatch Mtns 5.5–6.0 6.8 6.4 6.3 6.9 6.8 6.6 6.7 6.4 6.3 6.2 6.3
19 West Desert — Deep Creek 7.5–8.0 7.1 7.6 6.5 7.2 6.8 5.9 7.2 6.4 5.4 5.8 5.9
109
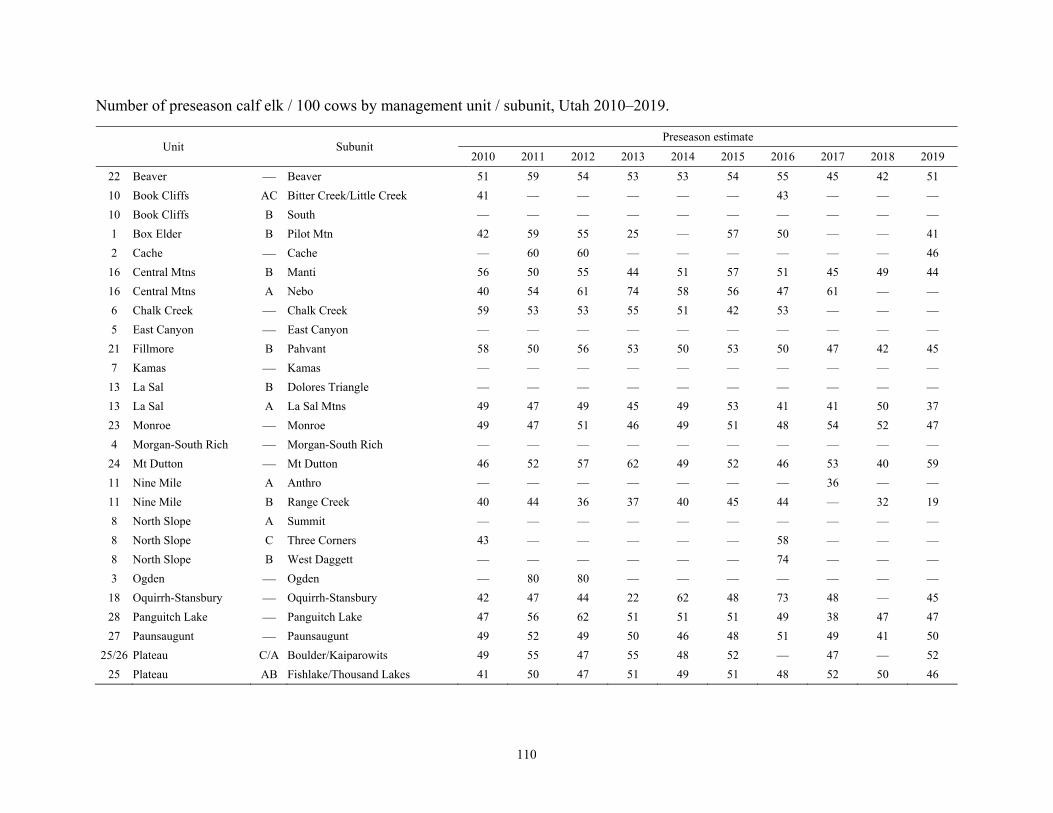
Number of preseason calf elk / 100 cows by management unit / subunit, Utah 2010–2019.
Unit Subunit Preseason estimate
2010 2011 2012 2013 2014 2015 2016 2017 2018 2019
22 Beaver — Beaver 51 59 54 53 53 54 55 45 42 51
10 Book Cliffs AC Bitter Creek/Little Creek 41 — — — — — 43 — — —
10 Book Cliffs B South — — — — — — — — — —
1 Box Elder B Pilot Mtn 42 59 55 25 — 57 50 — — 41
2 Cache — Cache — 60 60 — — — — — — 46
16 Central Mtns B Manti 56 50 55 44 51 57 51 45 49 44
16 Central Mtns A Nebo 40 54 61 74 58 56 47 61 — —
6 Chalk Creek — Chalk Creek 59 53 53 55 51 42 53 — — —
5 East Canyon — East Canyon — — — — — — — — — —
21 Fillmore B Pahvant 58 50 56 53 50 53 50 47 42 45
7 Kamas — Kamas — — — — — — — — — —
13 La Sal B Dolores Triangle — — — — — — — — — —
13 La Sal A La Sal Mtns 49 47 49 45 49 53 41 41 50 37
23 Monroe — Monroe 49 47 51 46 49 51 48 54 52 47
4 Morgan-South Rich — Morgan-South Rich — — — — — — — — — —
24 Mt Dutton — Mt Dutton 46 52 57 62 49 52 46 53 40 59
11 Nine Mile A Anthro — — — — — — — 36 — —
11 Nine Mile B Range Creek 40 44 36 37 40 45 44 — 32 19
8 North Slope A Summit — — — — — — — — — —
8 North Slope C Three Corners 43 — — — — — 58 — — —
8 North Slope B West Daggett — — — — — — 74 — — —
3 Ogden — Ogden — 80 80 — — — — — — —
18 Oquirrh-Stansbury — Oquirrh-Stansbury 42 47 44 22 62 48 73 48 — 45
28 Panguitch Lake — Panguitch Lake 47 56 62 51 51 51 49 38 47 47
27 Paunsaugunt — Paunsaugunt 49 52 49 50 46 48 51 49 41 50
25/26 Plateau C/A Boulder/Kaiparowits 49 55 47 55 48 52 — 47 — 52
25 Plateau AB Fishlake/Thousand Lakes 41 50 47 51 49 51 48 52 50 46
110

Number of preseason calf elk / 100 cows by management unit / subunit, Utah 2010–2019 (continued).
Unit Subunit Preseason estimate
2010 2011 2012 2013 2014 2015 2016 2017 2018 2019
14 San Juan — San Juan 45 48 46 36 49 47 43 43 44 52
12 San Rafael — San Rafael — — — — — — — — — —
9 South Slope C Diamond Mtn — — — — — — 31 — — —
9 South Slope B Vernal — — — — — — — — — —
9 South Slope A Yellowstone — — — — — — 36 — — —
20 Southwest Desert — Southwest Desert 43 50 52 50 51 47 25 55 42 26
17 Wasatch Mtns C Avintaquin — — — — — — — — — —
17 Wasatch Mtns B Currant Creek — — — — — — — — — —
17 Wasatch Mtns A West 55 57 57 63 59 58 58 56 — 59
19 West Desert — Deep Creek 61 — — — — — — — — —
29 Zion — Zion — — — — — — — 50 — —
Statewide averages 48 53 54 48 50 51 48 48 45 45
111

Elk winter trend count data by management unit / subunit, Utah 2010–2019. Beaver
Year n Calves / 100 cows Bulls / 100 cows Mature bulls / 100 cows
2010–11 817 — 13* 8*
2011–12 — — — —
2012–13 — — — —
2013–14 — — — —
2014–15 — — — —
2015–16 1258 — 31* 13*
2016–17 — — — —
2017–18 — — — —
2018–19 — — — —
2019–20 — — — —
*Bulls/100 antlerless.
Book Cliffs, Bitter Creek/Little Creek
Year n Calves / 100 cows Bulls / 100 cows Mature bulls / 100 cows
2010–11 — — — —
2011–12 — — — —
2012–13 — — — —
2013–14 — — — —
2014–15 — — — —
2015–16 3224 40 20 7
2016–17 — — — —
2017–18 — — — —
2018–19 2095 19 9 —
2019–20 — — — —
112

Elk winter trend count data by management unit / subunit, Utah 2010–2019 (continued). Book Cliffs, South
Year n Calves / 100 cows Bulls / 100 cows Mature bulls / 100 cows
2010–11 — — — —
2011–12 — — — —
2012–13 — — — —
2013–14 — — — —
2014–15 — — — —
2015–16 949 32 23 8
2016–17 — — — —
2017–18 — — — —
2018–19 876 17 19 8
2019–20 — — — —
Box Elder, Pilot Mtn
Year n Calves / 100 cows Bulls / 100 cows Mature bulls / 100 cows
2010–11 — — — —
2011–12 — — — —
2012–13 — — — —
2013–14 — — — —
2014–15 — — — —
2015–16 — — — —
2016–17 — — — —
2017–18 — — — —
2018–19 — — — —
2019–20 — — — —
113

Elk winter trend count data by management unit / subunit, Utah 2010–2019 (continued). Cache
Year n Calves / 100 cows Bulls / 100 cows Mature bulls / 100 cows
2010–11 732* 60 14 9
2011–12 — — — —
2012–13 — — — —
2013–14** 1779 33 13 7
2014–15 — — — —
2015–16 — — — —
2016–17 — — — —
2017–18 — — — —
2018–19 2112 — — —
2019–20 — — — —
*Ground classification **Calves/100 cows from a separate classification survey done at Hardware Ranch. Bull ratios are per 100 antlerless.
Central Mtns, Manti
Year n Calves / 100 cows Bulls / 100 cows Mature bulls / 100 cows
2010–11 — — — —
2011–12 — — — —
2012–13 9471 — 18* 10*
2013–14 — — — —
2014–15 — — — —
2015–16 — — — —
2016–17 7003 39 52 31
2017–18 — — — —
2018–19 — — — —
2019–20 5666 29 27 13
*Bulls/100 antlerless.
114

Elk winter trend count data by management unit / subunit, Utah 2010–2019 (continued). Central Mtns, Nebo
Year n Calves / 100 cows Bulls / 100 cows Mature bulls / 100 cows
2010–11 — — — —
2011–12 — — — —
2012–13 938 — 17* 5*
2013–14 — — — —
2014–15 — — — —
2015–16 — — — —
2016–17 1688 — 17* 6*
2017–18 — — — —
2018–19 — — — —
2019–20 1514 35 48 13
*Bulls/100 antlerless. Chalk Creek
Year n Calves / 100 cows Bulls / 100 cows Mature bulls / 100 cows
2010–11 3172 — — —
2011–12 — — — —
2012–13 3399 — 28* 19*
2013–14 — — — —
2014–15 — — — —
2015–16 — — — —
2016–17 — — — —
2017–18 — — — —
2018–19 3177 — — —
2019–20 — — — —
*Bulls/100 antlerless.
115

Elk winter trend count data by management unit / subunit, Utah 2010–2019 (continued). East Canyon
Year n Calves / 100 cows Bulls / 100 cows Mature bulls / 100 cows
2010–11 2204 42 376 259
2011–12 — — — —
2012–13 — — — —
2013–14 — — — —
2014–15 — — — —
2015–16 2173 — 31* 21*
2016–17 — — — —
2017–18 — — — —
2018–19 — — — —
2019–20 — — — —
*Bulls/100 antlerless.
Fillmore, Pahvant
Year n Calves / 100 cows Bulls / 100 cows Mature bulls / 100 cows
2010–11 1115 — 33* —
2011–12 — — — —
2012–13 — — — —
2013–14 — — — —
2014–15 — — — —
2015–16 1172 — 20* 9*
2016–17 — — — —
2017–18 — — — —
2018–19 — — — —
2019–20 — — — —
*Bulls/100 antlerless.
116

Elk winter trend count data by management unit / subunit, Utah 2010–2019 (continued). Kamas
Year n Calves / 100 cows Bulls / 100 cows Mature bulls / 100 cows
2010–11 870 — — —
2011–12 — — — —
2012–13 943 — 9* 5*
2013–14 — — — —
2014–15 — — — —
2015–16 — — — —
2016–17 — — — —
2017–18 — — — —
2018–19 483 — — —
2019–20 — — — —
*Bulls/100 antlerless.
La Sal, Dolores Triangle
Year n Calves / 100 cows Bulls / 100 cows Mature bulls / 100 cows
2010–11 1165 24 23 10
2011–12 — — — —
2012–13 — — — —
2013–14 522 29 41 16
2014–15 — — — —
2015–16 — — — —
2016–17 — — — —
2017–18 — — — —
2018–19 — — — —
2019–20 — — — —
117
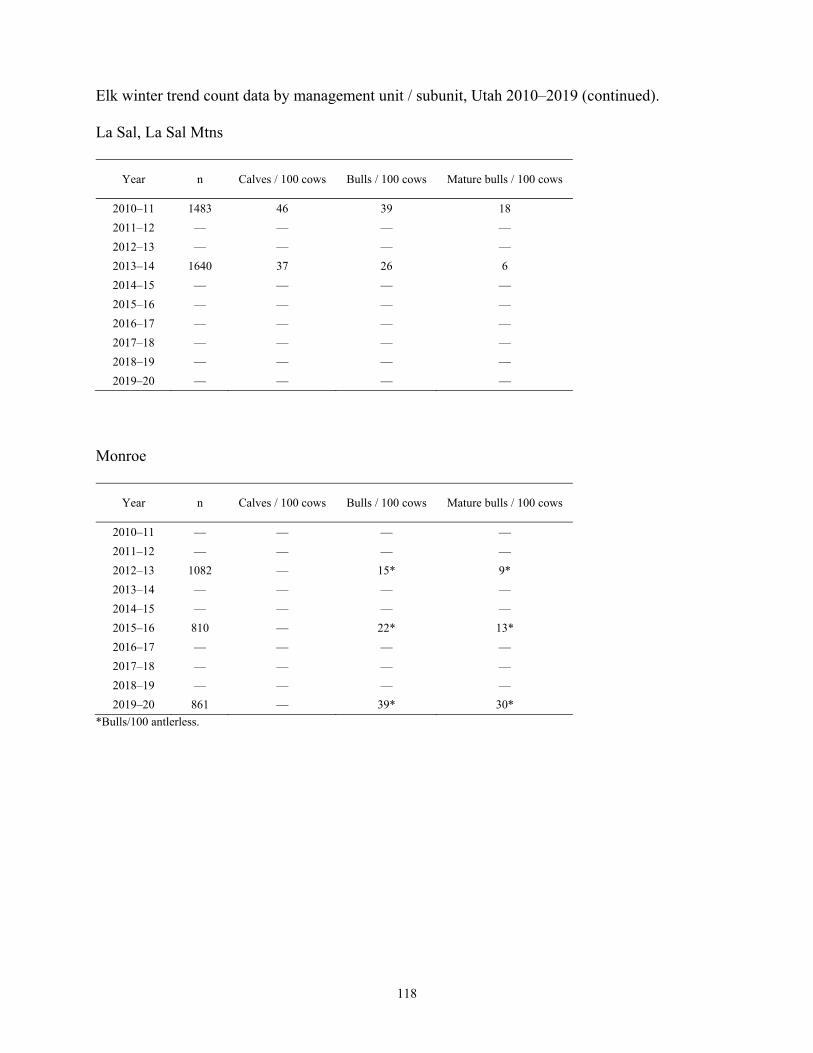
Elk winter trend count data by management unit / subunit, Utah 2010–2019 (continued). La Sal, La Sal Mtns
Year n Calves / 100 cows Bulls / 100 cows Mature bulls / 100 cows
2010–11 1483 46 39 18
2011–12 — — — —
2012–13 — — — —
2013–14 1640 37 26 6
2014–15 — — — —
2015–16 — — — —
2016–17 — — — —
2017–18 — — — —
2018–19 — — — —
2019–20 — — — —
Monroe
Year n Calves / 100 cows Bulls / 100 cows Mature bulls / 100 cows
2010–11 — — — —
2011–12 — — — —
2012–13 1082 — 15* 9*
2013–14 — — — —
2014–15 — — — —
2015–16 810 — 22* 13*
2016–17 — — — —
2017–18 — — — —
2018–19 — — — —
2019–20 861 — 39* 30*
*Bulls/100 antlerless.
118

Elk winter trend count data by management unit / subunit, Utah 2010–2019 (continued). Morgan-South Rich
Year n Calves / 100 cows Bulls / 100 cows Mature bulls / 100 cows
2010–11 — — — —
2011–12 — — — —
2012–13 — — — —
2013–14 — — — —
2014–15 — — — —
2015–16 3260 — 44* 33*
2016–17 — — — —
2017–18 — — — —
2018–19 — — — —
2019–20 5189 50 81 68
*Bulls/100 antlerless. Mt Dutton
Year n Calves / 100 cows Bulls / 100 cows Mature bulls / 100 cows
2010–11 — — — —
2011–12 — — — —
2012–13 1972 — 26* 12*
2013–14 — — — —
2014–15 — — — —
2015–16 1357 — 22* 4*
2016–17 — — — —
2017–18 — — — —
2018–19 — — — —
2019–20 849 — 40* 24*
*Bulls/100 antlerless.
119

Elk winter trend count data by management unit / subunit, Utah 2010–2019 (continued). Nine Mile, Anthro
Year n Calves / 100 cows Bulls / 100 cows Mature bulls / 100 cows
2010–11 — — — —
2011–12 — — — —
2012–13 669 31 41 20
2013–14 — — — —
2014–15 — — — —
2015–16 — — — —
2016–17 780 31 26 —
2017–18 — — — —
2018–19 — — — —
2019–20 — — — —
Nine Mile, Range Creek
Year n Calves / 100 cows Bulls / 100 cows Mature bulls / 100 cows
2010–11 — — — —
2011–12 — — — —
2012–13 1300 33 50 24
2013–14 — — — —
2014–15 — — — —
2015–16 — — — —
2016–17 1300 32 49 23
2017–18 — — — —
2018–19 — — — —
2019–20 — — — —
120

Elk winter trend count data by management unit / subunit, Utah 2010–2019 (continued). North Slope, Summit
Year n Calves / 100 cows Bulls / 100 cows Mature bulls / 100 cows
2010–11 268 34 16 8
2011–12 — — — —
2012–13 1006 — 10* 5*
2013–14 — — — —
2014–15 — — — —
2015–16 — — — —
2016–17 — — — —
2017–18 — — — —
2018–19 299 — — —
2019–20 — — — —
*Bulls/100 antlerless.
North Slope, Three Corners
Year n Calves / 100 cows Bulls / 100 cows Mature bulls / 100 cows
2010–11 — — — —
2011–12 — — — —
2012–13 267 29 144 107
2013–14 — — — —
2014–15 — — — —
2015–16 — — — —
2016–17 274 93 35 —
2017–18 — — — —
2018–19 323 24 44 —
2019–20 — — — —
121

Elk winter trend count data by management unit / subunit, Utah 2010–2019 (continued). North Slope, West Daggett
Year n Calves / 100 cows Bulls / 100 cows Mature bulls / 100 cows
2010–11 — — — —
2011–12 — — — —
2012–13 1055 32 7 0
2013–14 — — — —
2014–15 — — — —
2015–16 — — — —
2016–17 463 33 14 —
2017–18 — — — —
2018–19 487 34 18 —
2019–20 — — — —
Ogden
Year n Calves / 100 cows Bulls / 100 cows Mature bulls / 100 cows
2010–11 189* 80 33 22
2011–12 — — — —
2012–13 — — — —
2013–14 1618 — 15** 8**
2014–15 — — — —
2015–16 — — — —
2016–17 — — — —
2017–18 — — — —
2018–19 1397 — — —
2019–20 — — — —
*Ground classification. **Bulls/100 antlerless.
122

Elk winter trend count data by management unit / subunit, Utah 2010–2019 (continued). Oquirrh-Stansbury
Year n Calves / 100 cows Bulls / 100 cows Mature bulls / 100 cows
2010–11 — — — —
2011–12 — — — —
2012–13 — — — —
2013–14 — — — —
2014–15 — — — —
2015–16 — — — —
2016–17 — — — —
2017–18 — — — —
2018–19 — — — —
2019–20 — — — —
Panguitch Lake
Year n Calves / 100 cows Bulls / 100 cows Mature bulls / 100 cows
2010–11 — — — —
2011–12 — — — —
2012–13 — — — —
2013–14 — — — —
2014–15 — — — —
2015–16 1356 — 7* 2*
2016–17 — — — —
2017–18 — — — —
2018–19 — — — —
2019–20 — — — —
*Bulls/100 antlerless.
123

Elk winter trend count data by management unit / subunit, Utah 2010–2019 (continued). Paunsaugunt
Year n Calves / 100 cows Bulls / 100 cows Mature bulls / 100 cows
2010–11 — — — —
2011–12 — — — —
2012–13 — — — —
2013–14 — — — —
2014–15 — — — —
2015–16 — — — —
2016–17 205 — — —
2017–18 — — — —
2018–19 — — — —
2019–20 — — — —
Plateau, Boulder
Year n Calves / 100 cows Bulls / 100 cows Mature bulls / 100 cows
2010–11 — — — —
2011–12 — — — —
2012–13 1274 — — —
2013–14 — — — —
2014–15 — — — —
2015–16 333 — — —
2016–17 — — — —
2017–18 — — — —
2018–19 — — — —
2019–20 718 — 27* 13*
*Bulls/100 antlerless.
124

Elk winter trend count data by management unit / subunit, Utah 2010–2019 (continued). Plateau, Fishlake/Thousand Lakes
Year n Calves / 100 cows Bulls / 100 cows Mature bulls / 100 cows
2010–11 — — — —
2011–12 — — — —
2012–13 4085 — — —
2013–14 — — — —
2014–15 — — — —
2015–16 2924 — 23* —
2016–17 — — — —
2017–18 — — — —
2018–19 — — — —
2019–20 3794 — 19* 9*
*Bulls/100 antlerless.
San Juan
Year n Calves / 100 cows Bulls / 100 cows Mature bulls / 100 cows
2010–11 1274 47 70 44
2011–12 — — — —
2012–13 — — — —
2013–14 894 37 61 33
2014–15 — — — —
2015–16 — — — —
2016–17 — — — —
2017–18 1024 36 53 27
2018–19 — — — —
2019–20 — — — —
125

Elk winter trend count data by management unit / subunit, Utah 2010–2019 (continued). South Slope, Diamond Mtn
Year n Calves / 100 cows Bulls / 100 cows Mature bulls / 100 cows
2010–11 — — — —
2011–12 — — — —
2012–13 788 29 27 11
2013–14 — — — —
2014–15 — — — —
2015–16 — — — —
2016–17 — — — —
2017–18 — — — —
2018–19 1013 41 22 —
2019–20 — — — —
South Slope, Vernal
Year n Calves / 100 cows Bulls / 100 cows Mature bulls / 100 cows
2010–11 — — — —
2011–12 — — — —
2012–13 1441 35 15 3
2013–14 — — — —
2014–15 — — — —
2015–16 — — — —
2016–17 — — — —
2017–18 — — — —
2018–19 2122 54 20 —
2019–20 — — — —
126

Elk winter trend count data by management unit / subunit, Utah 2010–2019 (continued). South Slope, Yellowstone
Year n Calves / 100 cows Bulls / 100 cows Mature bulls / 100 cows
2010–11 — — — —
2011–12 — — — —
2012–13 6010 37 18 5
2013–14 — — — —
2014–15 — — — —
2015–16 — — — —
2016–17 — — — —
2017–18 — — — —
2018–19 6012 40 23 —
2019–20 — — — —
Southwest Desert
Year n Calves / 100 cows Bulls / 100 cows Mature bulls / 100 cows
2010–11 — — — —
2011–12 — — — —
2012–13 — — — —
2013–14 — — — —
2014–15 — — — —
2015–16 1230 — 18* 6*
2016–17 — — — —
2017–18 — — — —
2018–19 — — — —
2019–20 — — — —
127

Elk winter trend count data by management unit / subunit, Utah 2010–2019 (continued). Wasatch Mtns, Avintaquin
Year n Calves / 100 cows Bulls / 100 cows Mature bulls / 100 cows
2010–11 1578 26 36 14
2011–12 — — — —
2012–13 1396 41 42 27
2013–14 — — — —
2014–15 — — — —
2015–16 — — — —
2016–17 1133 52 42 —
2017–18 — — — —
2018–19 — — — —
2019–20 — — — —
Wasatch Mtns, Currant Creek
Year n Calves / 100 cows Bulls / 100 cows Mature bulls / 100 cows
2010–11 1814 29 33 15
2011–12 — — — —
2012–13 2992 31 30 16
2013–14 — — — —
2014–15 — — — —
2015–16 — — — —
2016–17 — — — —
2017–18 — — — —
2018–19 — — — —
2019–20 — — — —
128

Elk winter trend count data by management unit / subunit, Utah 2010–2019 (continued). Wasatch Mtns, West
Year n Calves / 100 cows Bulls / 100 cows Mature bulls / 100 cows
2010–11 3090 48 35 23
2011–12 — — — —
2012–13 2863 — 32* 22*
2013–14 — — — —
2014–15 — — — —
2015–16 — — — —
2016–17 2704 74 28 —
2017–18 — — — —
2018–19 — — — —
2019–20 — — — —
*Bulls/100 antlerless.
Zion
Year n Calves / 100 cows Bulls / 100 cows Mature bulls / 100 cows
2010–11 191 — 13* —
2011–12 — — — —
2012–13 — — — —
2013–14 — — — —
2014–15 — — — —
2015–16 — — — —
2016–17 645 — — —
2017–18 — — — —
2018–19 — — — —
2019–20 — — — —
*Bulls/100 antlerless.
129

PRONGHORN
130

Statewide trends of pronghorn harvest statistics, Utah 1946–2019.
*Data not available for 1948, 1951, 1952, and 1953.
131

Statewide pronghorn harvest statistics, Utah 1946–2019.
Year Buck harvest Doe / fawn harvest Total harvest Hunters afield
1946 62 0 62 66
1947 85 0 85 96
1948 — — — —
1949 43 0 43 45
1950 26 0 26 35
1951 — — — —
1952 — — — —
1953 — — — —
1954 39 25 64 75
1955 41 15 56 96
1956 47 0 47 102
1957 34 0 34 93
1958 33 0 33 84
1959 74 0 74 142
1960 99 0 99 161
1961 92 0 92 153
1962 74 0 74 122
1963 50 0 50 190
1964 56 0 56 96
1965 51 0 51 81
1966 73 0 73 105
1967 93 0 93 122
1968 114 0 114 151
1969 139 0 139 169
1970 158 0 158 181
1971 174 0 174 218
1972 198 0 198 251
1973 169 0 169 253
1974 183 0 183 254
1975 190 0 190 232
1976 180 0 180 224
1977 208 0 208 242
1978 276 0 276 314
1979 270 0 270 310
1980 280 2 282 310
1981 323 0 323 339
1982 365 35 400 445
1983 425 38 463 515
1984 500 169 669 733
1985 514 151 665 730
132

Statewide pronghorn harvest statistics, Utah 1946–2019 (continued).
Year Buck harvest Doe / fawn harvest Total harvest Hunters afield
1986 491 288 779 859
1987 534 446 980 1054
1988 584 205 789 883
1989 617 373 990 1092
1990 605 647 1252 1347
1991 634 773 1407 1577
1992 720 821 1541 1730
1993 602 947 1549 1873
1994 632 470 1102 1301
1995 605 195 800 1310
1996 535 92 627 704
1997 514 294 808 928
1998 522 581 1103 1195
1999 504 564 1068 1195
2000 503 128 631 791
2001 493 235 728 826
2002 512 166 678 840
2003 345 272 617 717
2004 431 420 851 848
2005 603 518 1121 1129
2006 820 535 1355 1672
2007 813 514 1327 1596
2008 849 845 1694 2077
2009 963 1056 2019 2226
2010 840 573 1413 1850
2011 679 566 1245 1449
2012 686 715 1401 1617
2013 817 798 1615 2150
2014 769 690 1459 2014
2015 775 733 1508 2153
2016 747 898 1645 2129
2017 844 1025 1869 2397
2018 887 1159 2046 2494
2019 983 943 1926 2530
133

Total pronghorn harvest by management unit, Utah 2019.
Unit Buck
harvest Doe/fawn
harvest Total
harvest Hunters afield
Mean days hunted
Success rate (%)
22 Beaver 22 53 75 96 2.2 44.6
10 Book Cliffs 69 0 69 74 1.8 93.2
1 Box Elder 93 91 184 303 2.6 43.5
2 Cache 44 36 80 135 2.0 32.6
21 Fillmore 30 139 169 199 1.8 28.7
26 Kaiparowits 2 0 2 2 1.5 100.0
13 La Sal 25 4 29 29 1.9 89.7
4 Morgan-South Rich 42 8 50 71 1.7 59.2
24/27 Mt Dutton/Paunsaugunt 44 31 75 112 3.2 47.3
11 Nine Mile 84 88 172 163 1.9 78.3
8 North Slope 34 32 66 74 1.5 54.6
28 Panguitch Lake 28 25 53 60 2.1 54.2
30 Pine Valley 29 23 52 68 2.4 76.9
25 Plateau 56 89 145 281 3.3 23.0
14 San Juan 7 0 7 8 2.1 87.5
12 San Rafael 93 115 208 260 2.5 55.5
9 South Slope 78 112 190 234 1.8 63.2
20 Southwest Desert 112 64 176 227 2.5 59.3
19 West Desert 89 33 122 132 2.3 79.2
Statewide Sportsman/Conservation 2 0 2 2 1.0 100.0
Statewide totals 983 943 1926 2530 2.3 52.4
134

Total buck pronghorn harvest by management unit / subunit, Utah 2010–2019.
Unit Subunit 2010 2011 2012 2013 2014 2015 2016 2017 2018 2019
22 Beaver Beaver 14 17 18 18 16 12 12 14 16 22
10 Book Cliffs Bitter Creek 10 8 9 7 7 9 11 12 17 24
10 Book Cliffs South 29 23 25 22 26 26 31 36 38 45
1 Box Elder Promontory 7 6 5 5 7 6 6 5 8 11
1 Box Elder Puddle Valley 9 10 10 9 12 11 15 18 22 25
1 Box Elder Snowville 16 19 20 21 18 22 28 32 33 35
1 Box Elder West 8 5 6 8 7 5 10 11 14 22
2 Cache North Rich 61 78 89 109 105 76 35 44 38 44
21 Fillmore Black Rock Desert 8 15 11 14 14 16 18 21 27 30
26 Kaiparowits Kaiparowits 2 1 1 1 1 0 0 1 2 2
13 La Sal South Cisco 1 2 4 4 5 3 7 10 24 25
4 Morgan-South Rich Morgan-South Rich 59 56 77 77 68 84 80 83 67 42
24/27 Mt Dutton/Paunsaugunt Mt Dutton/Paunsaugunt 55 63 47 42 37 37 38 35 36 44
11 Nine Mile Anthro 29 25 28 27 28 34 34 53 58 71
11 Nine Mile Range Creek 7 5 4 4 5 7 7 6 7 13
8 North Slope Summit 7 0 2 2 1 2 0 4 4 6
8 North Slope Three Corners/West Daggett 30 27 24 21 23 19 15 18 22 28
28 Panguitch Lake Panguitch Lake 8 7 6 6 7 6 7 11 19 28
30 Pine Valley Pine Valley 30 24 19 26 27 31 27 24 30 29
25 Plateau Plateau 182 43 67 172 136 146 122 113 54 56
14 San Juan Hatch Point 2 2 2 2 3 3 4 6 7 7
12 San Rafael Desert 20 18 4 6 5 5 9 7 13 12
12 San Rafael North 61 45 37 38 41 42 44 57 75 81
9 South Slope Bonanza/Diamond Mtn 24 22 24 19 20 20 18 20 40 46
9 South Slope Vernal 3 5 4 6 9 12 13 19 25 32
20 Southwest Desert Southwest Desert 76 80 77 83 84 84 91 110 112 112
19 West Desert Riverbed 41 35 31 32 25 20 25 26 28 31
19 West Desert Rush Valley 24 18 18 17 10 14 22 24 21 25
19 West Desert Snake Valley 16 18 15 17 21 21 16 24 29 33
135

Total doe/fawn* pronghorn harvest by management unit / subunit, Utah 2010–2019.
Unit Subunit 2010 2011 2012 2013 2014 2015 2016 2017 2018 2019
22 Beaver Beaver 6 4 7 3 3 9 13 21 24 53
10 Book Cliffs Bitter Creek 0 0 0 0 0 0 0 0 0 0
10 Book Cliffs South 0 0 2 0 15 8 10 0 4 0
1 Box Elder Promontory 13 2 14 14 4 3 17 12 19 27
1 Box Elder Puddle Valley 0 0 0 0 0 0 0 0 0 0
1 Box Elder Snowville 5 7 14 2 4 14 70 85 41 38
1 Box Elder West 3 0 0 5 0 0 0 19 48 26
2 Cache North Rich 176 296 351 279 129 88 85 106 78 36
21 Fillmore Black Rock Desert 4 5 5 4 6 20 28 11 61 139
26 Kaiparowits Kaiparowits 0 0 0 0 0 0 0 0 0 0
13 La Sal South Cisco 0 0 0 0 0 0 0 2 0 4
4 Morgan-South Rich Morgan-South Rich 122 89 134 177 151 117 110 86 70 8
24/27 Mt Dutton/Paunsaugunt Mt Dutton/Paunsaugunt 66 44 14 32 45 32 59 90 105 31
11 Nine Mile Anthro 0 0 12 6 5 8 36 38 73 80
11 Nine Mile Range Creek 2 8 3 0 3 3 4 11 8 8
8 North Slope Summit 4 10 3 3 5 4 4 3 3 5
8 North Slope Three Corners/West Daggett 20 14 28 15 26 20 25 20 23 27
28 Panguitch Lake Panguitch Lake 0 0 0 0 2 12 0 13 8 25
30 Pine Valley Pine Valley 19 17 9 0 4 0 7 18 11 23
25 Plateau Plateau 12 3 60 170 215 251 142 197 80 89
14 San Juan Hatch Point 0 0 0 0 0 0 0 0 0 0
12 San Rafael Desert 0 0 0 0 0 0 0 0 0 0
12 San Rafael North 19 8 23 14 13 23 92 105 274 115
9 South Slope Bonanza/Diamond Mtn 0 0 0 0 0 0 0 10 4 28
9 South Slope Vernal 15 14 15 27 31 70 65 77 110 84
20 Southwest Desert Southwest Desert 42 28 12 33 25 35 79 63 61 64
19 West Desert Riverbed 10 1 0 0 0 3 18 0 4 0
19 West Desert Rush Valley 27 9 2 1 0 0 12 6 10 18
19 West Desert Snake Valley 8 7 7 13 4 13 22 32 40 15
*Data includes mitigation harvest.
136

Total buck pronghorn hunters afield by management unit / subunit, Utah 2010–2019.
Unit Subunit 2010 2011 2012 2013 2014 2015 2016 2017 2018 2019
22 Beaver Beaver 17 18 19 20 19 14 14 14 18 22
10 Book Cliffs Bitter Creek 11 9 9 7 7 9 12 12 18 24
10 Book Cliffs South 37 25 27 24 30 28 35 40 43 50
1 Box Elder Promontory 10 9 7 7 7 8 6 9 8 14
1 Box Elder Puddle Valley 10 10 10 10 12 11 16 18 22 25
1 Box Elder Snowville 18 19 20 22 21 22 33 41 36 41
1 Box Elder West 9 6 9 10 9 5 14 12 15 25
2 Cache North Rich 64 83 98 125 127 97 50 47 58 58
21 Fillmore Black Rock Desert 11 15 14 14 15 18 19 22 27 32
26 Kaiparowits Kaiparowits 2 1 1 1 1 1 0 1 2 2
13 La Sal South Cisco 1 2 4 4 5 3 7 11 25 26
4 Morgan-South Rich Morgan-South Rich 61 59 81 80 70 90 84 87 71 47
24/27 Mt Dutton/Paunsaugunt Mt Dutton/Paunsaugunt 57 64 49 46 39 40 38 36 37 46
11 Nine Mile Anthro 29 27 29 29 28 35 36 53 60 72
11 Nine Mile Range Creek 7 5 5 5 5 7 7 7 8 13
8 North Slope Summit 9 0 2 2 1 2 0 4 4 7
8 North Slope Three Corners/West Daggett 32 32 29 25 26 23 23 21 23 28
28 Panguitch Lake Panguitch Lake 8 8 6 6 7 6 7 12 20 29
30 Pine Valley Pine Valley 36 29 22 29 27 32 32 35 34 37
25 Plateau Plateau 356 65 92 248 187 225 185 191 91 129
14 San Juan Hatch Point 2 2 2 2 3 3 4 6 7 8
12 San Rafael Desert 20 21 5 6 6 5 9 9 17 16
12 San Rafael North 71 52 42 42 42 42 48 59 78 92
9 South Slope Bonanza/Diamond Mtn 26 23 24 20 20 20 19 20 41 47
9 South Slope Vernal 5 5 5 6 9 13 14 19 25 32
20 Southwest Desert Southwest Desert 89 87 93 99 102 106 109 125 128 138
19 West Desert Riverbed 41 36 34 35 29 21 26 29 31 34
19 West Desert Rush Valley 25 21 19 19 14 14 22 26 23 29
19 West Desert Snake Valley 21 19 18 18 21 23 18 26 31 38
137

Total doe/fawn* pronghorn hunters afield by management unit / subunit, Utah 2010–2019.
Unit Subunit 2010 2011 2012 2013 2014 2015 2016 2017 2018 2019
22 Beaver Beaver 6 6 11 7 6 16 23 25 34 74
10 Book Cliffs Bitter Creek 0 0 0 0 0 0 0 0 0 0
10 Book Cliffs South 0 0 2 0 11 8 3 0 4 0
1 Box Elder Promontory 40 17 20 29 13 13 29 20 26 50
1 Box Elder Puddle Valley 0 0 0 0 0 0 0 0 0 0
1 Box Elder Snowville 14 29 23 2 18 35 89 115 59 61
1 Box Elder West 5 0 0 10 0 0 0 33 97 87
2 Cache North Rich 190 247 329 278 246 214 170 151 127 77
21 Fillmore Black Rock Desert 5 6 5 7 19 15 26 42 75 167
26 Kaiparowits Kaiparowits 0 0 0 0 0 0 0 0 0 0
13 La Sal South Cisco 0 0 2 0 0 0 0 2 2 3
4 Morgan-South Rich Morgan-South Rich 122 108 150 213 175 128 124 94 72 24
24/27 Mt Dutton/Paunsaugunt Mt Dutton/Paunsaugunt 71 48 16 37 43 42 56 108 123 66
11 Nine Mile Anthro 3 0 18 5 13 9 31 50 64 64
11 Nine Mile Range Creek 4 10 3 3 4 5 8 19 21 14
8 North Slope Summit 5 12 3 3 5 4 5 3 9 9
8 North Slope Three Corners/West Daggett 29 24 41 35 42 25 21 16 27 30
28 Panguitch Lake Panguitch Lake 0 0 0 0 1 4 0 16 10 31
30 Pine Valley Pine Valley 46 23 8 2 12 13 10 19 29 31
25 Plateau Plateau 49 29 95 401 366 507 277 299 127 152
14 San Juan Hatch Point 0 0 0 0 0 0 0 0 0 0
12 San Rafael Desert 0 0 0 0 0 0 0 0 0 0
12 San Rafael North 28 31 24 30 32 38 120 136 259 152
9 South Slope Bonanza/Diamond Mtn 0 0 0 0 0 0 0 5 3 29
9 South Slope Vernal 22 31 42 48 55 68 87 98 150 126
20 Southwest Desert Southwest Desert 72 50 30 47 46 50 95 95 116 89
19 West Desert Riverbed 8 6 2 0 0 4 12 0 3 0
19 West Desert Rush Valley 35 9 2 12 5 19 27 19 20 12
19 West Desert Snake Valley 9 9 14 15 12 11 27 40 34 19
*Data includes mitigation hunters.
138

Limited-entry archery buck pronghorn harvest, Utah 2019.
Unit Hunt
number Hunt name
Buck harvest
Permits Hunters afield
Mean days hunted
Success rate (%)
22 PB5000 Beaver 4 4 4 6.0 100.0
10 PB5001 Book Cliffs, Bitter Creek 4 4 4 1.0 100.0
10 PB5002 Book Cliffs, South 7 10 10 3.1 66.7
1 PB5003 Box Elder, Promontory 0 3 2 8.0 0.0
1 PB5004 Box Elder, Puddle Valley 5 5 5 3.6 100.0
1 PB5005 Box Elder, Snowville 2 5 4 3.5 50.0
1 PB5006 Box Elder, West 0 3 1 10.0 0.0
2/3/4 PB5007 Cache/Morgan-South Rich/Ogden 4 10 9 3.4 50.0
21 PB5008 Fillmore, Oak Creek 6 6 6 2.8 100.0
13 PB5009 La Sal, Potash/South Cisco 3 4 4 1.3 66.7
11 PB5011 Nine Mile, Anthro-Myton Bench 9 10 9 2.1 100.0
11 PB5053 Nine Mile, Range Creek 2 2 2 5.5 100.0
8 PB5012 North Slope, Three Corners/West Daggett 5 6 5 2.6 100.0
28/29 PB5054 Panguitch Lake/Zion, North 6 6 6 7.2 100.0
30 PB5013 Pine Valley 4 7 7 5.6 57.1
25 PB5333 Plateau, Parker Mtn 5 33 32 7.3 16.7
14 PB5058 San Juan, Hatch Point 2 2 2 3.0 100.0
12 PB5055 San Rafael, Desert 0 3 2 11.5 0.0
12 PB5015 San Rafael, North 11 18 18 5.2 61.1
9 PB5016 South Slope, Bonanza/Diamond Mtn 8 8 8 2.5 100.0
9 PB5017 South Slope, Vernal 7 7 7 3.3 100.0
20 PB5018 Southwest Desert 18 25 24 5.4 73.9
19 PB5019 West Desert, Riverbed 5 6 6 5.2 83.3
19 PB5020 West Desert, Rush Valley 1 4 4 3.7 33.3
19 PB5021 West Desert, Snake Valley 5 7 6 4.6 80.0
Limited-entry muzzleloader buck pronghorn harvest, Utah 2019.
Unit Hunt
number Hunt name
Buck harvest
Permits Hunters afield
Mean days hunted
Success rate (%)
2/3/4 PB5022 Cache/Morgan-South Rich/Ogden 8 10 10 1.9 80.0
11 PB5059 Nine Mile, Anthro-Myton Bench 12 12 12 1.9 100.0
25 PB5335 Plateau, Parker Mtn 12 30 27 2.9 46.2
12 PB5056 San Rafael, North 17 18 18 2.8 94.1
9 PB5060 South Slope, Bonanza/Diamond Mtn 9 9 9 2.6 100.0
20 PB5024 Southwest Desert 18 25 25 2.6 72.7
139

Limited-entry any weapon buck pronghorn harvest, Utah 2019.
Unit Hunt
number Hunt name
Buck harvest
Permits Hunters afield
Mean days hunted
Success rate (%)
22 PB5025 Beaver 18 19 18 1.1 100.0
10 PB5026 Book Cliffs, Bitter Creek 18 18 18 1.3 100.0
10 PB5027 Book Cliffs, South 38 40 40 1.7 94.9
1 PB5028 Box Elder, Promontory 11 12 12 2.5 90.9
1 PB5029 Box Elder, Puddle Valley 20 20 20 1.4 100.0
1 PB5030 Box Elder, Snowville 15 18 17 1.5 87.5
1 PB5031 Box Elder, West 17 19 19 2.3 89.5
2/3/4 PB5032 Cache/Morgan-South Rich/Ogden 28 34 33 2.0 84.4
21 PB5033 Fillmore, Oak Creek 20 22 21 1.9 94.7
26 PB5034 Kaiparowits 2 2 2 1.5 100.0
13 PB5035 La Sal, Potash/South Cisco 22 25 22 2.0 100.0
24 PB5331 Mt Dutton/Paunsaugunt 32 35 34 2.3 93.8
24 PB5332 Mt Dutton/Paunsaugunt 11 11 11 5.3 100.0
24 PB5036 Mt Dutton/Paunsaugunt, Johns Valley 1 1 1 4.0 100.0
11 PB5037 Nine Mile, Anthro-Myton Bench 36 38 37 1.3 97.3
11 PB5038 Nine Mile, Range Creek 11 11 11 1.5 100.0
8 PB5039 North Slope, Summit 6 7 7 1.7 85.7
8 PB5040 North Slope, Three Corners/West Daggett 23 24 23 1.5 100.0
28 PB5041 Panguitch Lake/Zion, North 22 23 23 1.7 95.7
30 PB5042 Pine Valley 25 31 30 2.0 85.2
25 PB5334 Plateau, Parker Mtn 39 72 70 2.8 56.1
14 PB5044 San Juan, Hatch Point 5 6 6 1.8 83.3
12 PB5045 San Rafael, Desert 12 17 14 2.3 85.7
12 PB5046 San Rafael, North 53 57 56 1.8 94.3
9 PB5047 South Slope, Bonanza/Diamond Mtn 29 30 30 1.7 96.6
9 PB5048 South Slope, Vernal 25 26 25 1.2 100.0
20 PB5049 Southwest Desert 67 82 79 2.3 84.4
19 PB5050 West Desert, Riverbed 24 27 25 1.9 96.0
19 PB5051 West Desert, Rush Valley 18 19 19 1.5 94.4
19 PB5052 West Desert, Snake Valley 28 33 32 1.9 87.1
Statewide Sportsman/Conservation 2 2 2 1.0 100.0
140

CWMU buck pronghorn, Utah 2019.
Unit Hunt
number CWMU
Buck harvest
Permits Hunters afield
Mean days hunted
Success rate (%)
19 PB5325 Allen Ranch 3 3 3 1.0 100.0
11 PB5300 Antelope Creek 8 8 8 1.2 100.0
1 PB5326 Cedar Springs 2 3 3 2.3 66.7
11 PB5327 Cottonwood Ridge 6 6 6 2.0 100.0
4 PB5302 Deseret 36 42 41 1.6 88.6
6 PB5303 Ensign Ranches 5 5 5 2.4 100.0
1 PB5330 George Creek 3 3 3 2.0 100.0
20 PB5337 Heist 4 5 5 1.8 80.0
4 PB5304 Middle Ridge 1 1 1 2.0 100.0
21 PB5328 Pahvant Ensign 4 5 5 2.0 75.0
1 PB5305 Park Valley 3 3 3 1.7 100.0
2 PB5306 Rabbit Creek 2 2 2 2.5 100.0
1 PB5307 RLF Deep Creek 4 5 5 1.4 80.0
2 PB5308 SJ Ranch 1 3 3 5.3 33.3
19 PB5309 Skull Valley South 2 3 3 1.3 66.7
1 PB5329 Snowville Flat 4 4 4 1.0 100.0
2 PB5310 Strawberry Ridge 1 2 1 3.0 100.0
1 PB5311 The Rose of Snowville 5 5 5 1.8 100.0
1 PB5312 TL Bar Ranch 2 2 2 2.0 100.0
10 PB5313 West Willow Creek Ranch 2 2 2 2.5 100.0
19 PB5314 Westlake 3 3 3 1.0 100.0
20 PB5315 Zane 5 5 5 2.0 100.0
141

Limited-entry doe/fawn pronghorn harvest, Utah 2019.
Unit Hunt
number Hunt name
Harvest Permits
Hunters afield
Mean days hunted
Success rate (%) Doe Fawn Total
22 PD1036 Beaver 32 1 33 50 44 2.4 75.0
1 PD1012 Box Elder, Promontory 3 0 3 10 8 3.6 37.5
1 PD1000 Box Elder, Snowville 29 1 30 40 34 3.5 56.0
1 PD1017 Box Elder, West 10 0 10 35 30 2.5 33.3
2/3/4 PD1001 Cache/Morgan-South Rich/Ogden 12 0 12 19 18 1.7 69.2
2/3/4 PD1002 Cache/Morgan-South Rich/Ogden 8 0 8 18 15 1.8 50.0
2/3/4 PD1003 Cache/Morgan-South Rich/Ogden 15 0 15 38 31 1.6 48.1
16 PD1033 Central Mtns, Poison Springs Bench 3 0 3 10 10 2.0 33.3
21 PD1027 Fillmore, Oak Creek South 32 2 34 47 44 1.8 76.9
21 PD1034 Fillmore, Oak Creek South 36 4 40 47 44 1.6 90.9
21 PD1035 Fillmore, Oak Creek South 31 1 32 49 37 1.8 86.7
24/27 PD1018 Mt Dutton/Paunsaugunt 21 1 22 40 36 2.3 60.7
8 PD1005 North Slope, Summit 5 0 5 5 5 1.3 100.0
8 PD1037 North Slope, Three Corners 11 1 12 14 12 1.3 100.0
8 PD1038 North Slope, West Daggett 9 0 9 10 10 1.5 87.5
28 PD1039 Panguitch Lake/Zion, North 19 1 20 25 22 1.4 94.7
25 PD1006 Plateau, Parker Mtn 15 3 18 45 36 2.6 50.0
25 PD1019 Plateau, Parker Mtn 31 3 34 48 45 2.8 75.6
25 PD1020 Plateau, Parker Mtn 24 1 25 48 42 2.9 60.0
12 PD1007 San Rafael, North-Cleveland 16 1 17 20 19 2.6 92.9
12 PD1030 San Rafael, North-Cleveland 10 1 11 20 19 1.7 60.0
12 PD1028 San Rafael, North-Mounds Reef 13 0 13 10 10 2.0 55.6
12 PD1029 San Rafael, North-Mounds Reef 16 2 18 10 10 1.9 90.0
9 PD1040 South Slope, Bonanza/Diamond Mtn 27 1 28 29 29 1.3 95.8
20 PD1008 Southwest Desert, Milford Flat 16 0 16 21 19 1.8 83.3
20 PD1009 Southwest Desert, Milford Flat 5 1 6 20 17 2.0 36.4
142

CWMU doe/fawn pronghorn harvest, Utah 2019.
Unit Hunt
number CWMU
Harvest Permits
Hunters afield
Mean days hunted
Success rate (%) Doe Fawn Total
11 PD1032 Antelope Creek 7 0 7 10 7 1.4 100.0
11 PD1025 Cottonwood Ridge 10 0 10 10 10 1.6 100.0
4 PD1011 Deseret 7 1 8 22 19 1.7 41.2
1 PD1023 George Creek 0 0 0 4 4 1.5 0.0
20 PD1041 Heist 2 0 2 6 5 1.3 50.0
21 PD1026 Pahvant Ensign 3 0 3 5 3 1.0 100.0
2 PD1013 Rabbit Creek 1 0 1 1 1 1.0 100.0
1 PD1014 RLF Deep Creek 2 0 2 3 2 1.5 100.0
2 PD1015 SJ Ranch — — — 3 0 — —
1 PD1024 Snowville Flat 3 0 3 3 3 1.0 100.0
1 PD1022 TL Bar Ranch 1 0 1 2 1 2.0 100.0
19 PD1031 Westlake 9 1 10 5 5 1.2 100.0
20 PD1016 Zane 6 0 6 9 6 1.5 100.0
143

Free mitigation pronghorn harvest by management unit / subunit, Utah 2019.
Unit Subunit Harvest
Permits Hunters afield
Success rate (%) Doe Fawn Total
22 Beaver Beaver 11 0 11 38 19 60.0
10 Book Cliffs Bitter Creek — — — 0 — —
10 Book Cliffs South — — — 3 — —
1 Box Elder Promontory 9 0 9 26 18 50.0
1 Box Elder Puddle Valley — — — 0 — —
1 Box Elder Snowville 0 0 0 22 16 0.0
1 Box Elder West 7 0 7 24 13 33.3
2 Cache North Rich 0 0 0 31 10 0.0
21 Fillmore Black Rock Desert 21 3 24 43 29 72.7
26 Kaiparowits Kaiparowits — — — 0 — —
13 La Sal South Cisco 4 0 4 5 1 100.0
4 Morgan-South Rich Morgan-South Rich 0 0 0 5 5 0.0
24/27 Mt Dutton/Paunsaugunt Mt Dutton/Paunsaugunt 0 0 0 30 18 0.0
11 Nine Mile Anthro 38 0 38 48 17 75.0
11 Nine Mile Range Creek 6 0 6 6 5 100.0
8 North Slope Summit 0 0 0 7 4 0.0
8 North Slope Three Corners/West Daggett — — — 15 — —
28 Panguitch Lake Panguitch Lake — — — 5 — —
30 Pine Valley Pine Valley 3 0 3 16 9 33.3
25 Plateau Plateau 8 0 8 35 21 22.2
14 San Juan Hatch Point — — — 0 — —
12 San Rafael Desert — — — 0 — —
12 San Rafael North 18 0 18 60 47 35.0
9 South Slope Bonanza/Diamond Mtn — — — 0 — —
9 South Slope Vernal 32 4 36 77 48 45.5
20 Southwest Desert Southwest Desert 13 6 19 63 27 28.6
19 West Desert Riverbed — — — 0 — —
19 West Desert Rush Valley 7 0 7 11 6 100.0
19 West Desert Snake Valley 15 0 15 25 15 57.1
Statewide totals 192 13 205 595 328 40.5
*Some hunters had multiple permits. Success rates are per hunter.
144

Fee mitigation pronghorn harvest by management unit / subunit, Utah 2019.
Unit Subunit Harvest
Permits Hunters afield
Success rate (%) Doe Fawn Total
22 Beaver Beaver 8 1 9 11 11 85.7
10 Book Cliffs Bitter Creek — — — 0 — —
10 Book Cliffs South — — — 0 — —
1 Box Elder Promontory 13 2 15 29 24 60.0
1 Box Elder Puddle Valley — — — 0 — —
1 Box Elder Snowville 3 0 3 11 6 50.0
1 Box Elder West 8 0 8 47 39 21.1
2 Cache North Rich 0 0 0 4 2 0.0
21 Fillmore Black Rock Desert 6 0 6 10 10 60.0
26 Kaiparowits Kaiparowits — — — 0 — —
13 La Sal South Cisco 0 0 0 4 2 0.0
4 Morgan-South Rich Morgan-South Rich — — — 0 — —
24/27 Mt Dutton/Paunsaugunt Mt Dutton/Paunsaugunt 9 0 9 12 12 75.0
11 Nine Mile Anthro 23 2 25 34 30 81.3
11 Nine Mile Range Creek 2 0 2 9 9 16.7
8 North Slope Summit — — — 1 — —
8 North Slope Three Corners/West Daggett 6 0 6 8 8 80.0
28 Panguitch Lake Panguitch Lake 5 0 5 9 9 50.0
30 Pine Valley Pine Valley 20 0 20 22 22 92.3
25 Plateau Plateau 4 0 4 12 8 50.0
14 San Juan Hatch Point — — — 0 — —
12 San Rafael Desert — — — 0 — —
12 San Rafael North 33 2 35 39 37 94.4
9 South Slope Bonanza/Diamond Mtn — — — 0 — —
9 South Slope Vernal 48 0 48 78 78 61.5
20 Southwest Desert Southwest Desert 15 0 15 21 15 100.0
19 West Desert Riverbed — — — 0 — —
19 West Desert Rush Valley 1 0 1 3 1 100.0
19 West Desert Snake Valley 0 0 0 4 4 0.0
Statewide totals 204 7 211 368 327 65.5
145

Historical statewide pronghorn population trends, Utah 1999–2019.
146

Pronghorn classification and trend count data by management unit / subunit, Utah 2010–2019. Beaver
Year Spring trend Preseason classification
n Bucks Does and fawns Unclassified n Fawns / 100 does Bucks / 100 does
2010 80 18 62 0 71 23 59
2011 168 22 146 0 78 36 38
2012 188 28 160 0 109 44 29
2013 169 28 141 0 190 32 32
2014 162 36 126 0 207 27 19
2015 — — — — 143 37 22
2016 396 61 335 0 102 71 56
2017 — — — — 147 53 46
2018 444 145 299 0 258 35 47
2019 — — — — 260 36 38
Book Cliffs, Bitter Creek
Year Spring trend Preseason classification
n Bucks Does and fawns Unclassified n Fawns / 100 does Bucks / 100 does
2010 — — — — 45 23 50
2011 — — — — 50 19 42
2012 147 33 114 0 52 9 49
2013 — — — — 55 31 22
2014 113 13 99 1 104 54 22
2015 — — — — 193 70 31
2016 227 51 173 3 67 70 53
2017 — — — — 97 40 43
2018 264 45 216 0 115 42 67
2019 — — — — 81 113 57
147

Pronghorn classification and trend count data by management unit / subunit, Utah 2010–2019 (continued). Book Cliffs, South
Year Spring trend Preseason classification
n Bucks Does and fawns Unclassified n Fawns / 100 does Bucks / 100 does
2010 321 56 265 0 199 44 24
2011 305 62 243 0 153 73 46
2012 364 67 297 0 146 25 28
2013 — — — — 138 30 29
2014 445 66 379 0 153 78 47
2015 — — — — 152 71 70
2016 598 153 445 0 168 62 51
2017 — — — — 211 34 61
2018 706 180 526 0 258 39 34
2019 — — — — 173 28 37
Box Elder, Promontory
Year Spring trend Preseason classification
n Bucks Does and fawns Unclassified n Fawns / 100 does Bucks / 100 does
2010 46 7 39 0 44 35 17
2011 46 4 42 0 — — —
2012 70 19 51 0 94 57 27
2013 45 8 37 0 44 40 36
2014 70 11 59 0 59 78 41
2015 128 36 92 0 82 57 38
2016 — — — — 178 48 30
2017 — — — — — — —
2018 — — — — 39 — —
2019 — — — — 140 58 31
148

Pronghorn classification and trend count data by management unit / subunit, Utah 2010–2019 (continued). Box Elder, Puddle Valley
Year Spring trend Preseason classification
n Bucks Does and fawns Unclassified n Fawns / 100 does Bucks / 100 does
2010 93 18 75 0 — — —
2011 118 31 87 0 52 39 87
2012 — — — — — — —
2013 182 42 122 18 79 22 36
2014 67 21 46 0 58 30 63
2015 — — — — 52 75 85
2016 — — — — 90 66 91
2017 — — — — — — —
2018 — — — — 78 35 35
2019 164 22 142 0 150 62 24
Box Elder, Snowville
Year Spring trend Preseason classification
n Bucks Does and fawns Unclassified n Fawns / 100 does Bucks / 100 does
2010 96 30 66 0 127 39 32
2011 187 53 134 0 255 33 34
2012 255 60 195 0 252 47 67
2013 297 91 206 0 306 69 35
2014 299 68 231 0 199 62 37
2015 420 125 295 0 330 63 28
2016 — — — — 442 73 34
2017 — — — — 92 53 51
2018 — — — — 97 34 15
2019 — — — — 300 50 46
.
149

Pronghorn classification and trend count data by management unit / subunit, Utah 2010–2019 (continued). Box Elder, West*
Year Spring trend Preseason classification
n Bucks Does and fawns Unclassified n Fawns / 100 does Bucks / 100 does
2010 17 5 12 0 55 47 37
2011 — — — — — — —
2012 — — — — — — —
2013 14 2 12 0 98 51 10
2014 64 18 46 0 92 62 15
2015 83 14 69 0 118 75 40
2016 — — — — 172 72 41
2017 — — — — — — —
2018 — — — — 71 22 75
2019 — — — — 79 26 43
*Formerly named Box Elder, Pilot Mtn
Cache, North Rich
Year Spring trend Preseason classification
n Bucks Does and fawns Unclassified n Fawns / 100 does Bucks / 100 does
2010 715 145 570 0 653 181 24
2011 1288 — — 1288 330 44 88
2012 398 — — 398 91 79 88
2013 419 105 291 0 — — —
2014 275 91 184 0 72 64 55
2015 — — — — 171 80 137
2016 650 — — 650 340* 47 123
2017 186 70 116 0 177 68 127
2018 1062* 329 733 0 152 81 56
2019 — — — — 234 29 52
*Includes Morgan-South Rich.
150
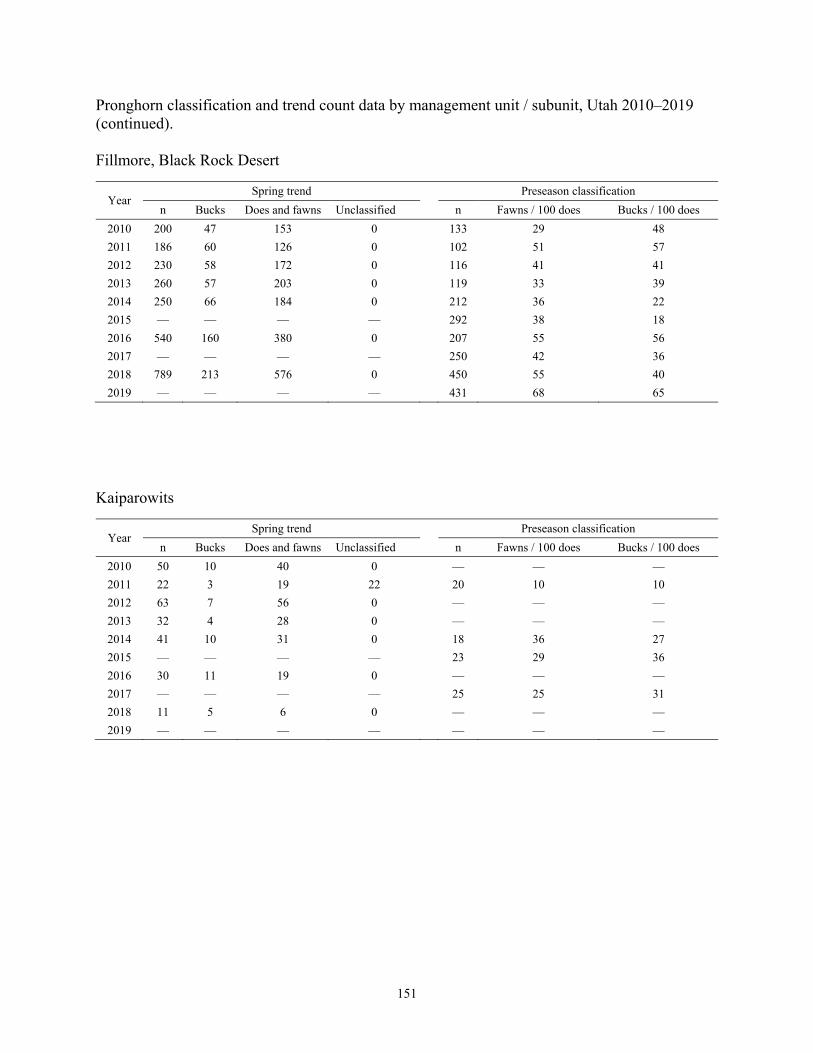
Pronghorn classification and trend count data by management unit / subunit, Utah 2010–2019 (continued). Fillmore, Black Rock Desert
Year Spring trend Preseason classification
n Bucks Does and fawns Unclassified n Fawns / 100 does Bucks / 100 does
2010 200 47 153 0 133 29 48
2011 186 60 126 0 102 51 57
2012 230 58 172 0 116 41 41
2013 260 57 203 0 119 33 39
2014 250 66 184 0 212 36 22
2015 — — — — 292 38 18
2016 540 160 380 0 207 55 56
2017 — — — — 250 42 36
2018 789 213 576 0 450 55 40
2019 — — — — 431 68 65
Kaiparowits
Year Spring trend Preseason classification
n Bucks Does and fawns Unclassified n Fawns / 100 does Bucks / 100 does
2010 50 10 40 0 — — —
2011 22 3 19 22 20 10 10
2012 63 7 56 0 — — —
2013 32 4 28 0 — — —
2014 41 10 31 0 18 36 27
2015 — — — — 23 29 36
2016 30 11 19 0 — — —
2017 — — — — 25 25 31
2018 11 5 6 0 — — —
2019 — — — — — — —
151
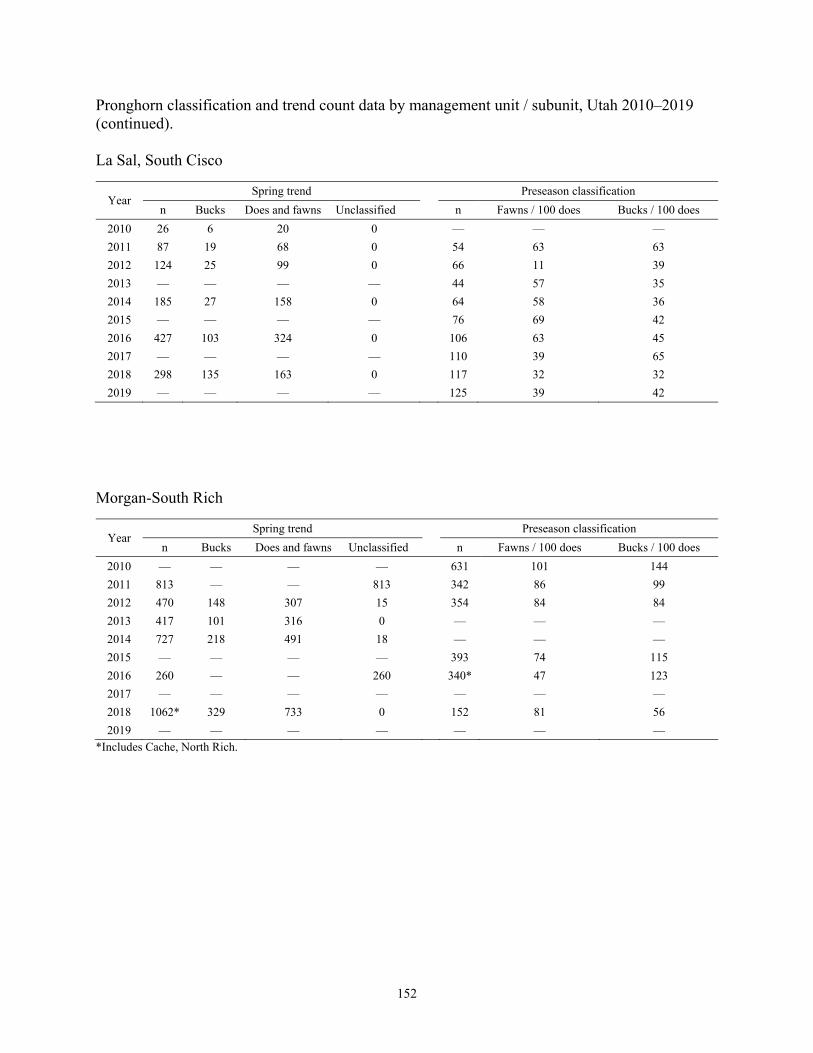
Pronghorn classification and trend count data by management unit / subunit, Utah 2010–2019 (continued). La Sal, South Cisco
Year Spring trend Preseason classification
n Bucks Does and fawns Unclassified n Fawns / 100 does Bucks / 100 does
2010 26 6 20 0 — — —
2011 87 19 68 0 54 63 63
2012 124 25 99 0 66 11 39
2013 — — — — 44 57 35
2014 185 27 158 0 64 58 36
2015 — — — — 76 69 42
2016 427 103 324 0 106 63 45
2017 — — — — 110 39 65
2018 298 135 163 0 117 32 32
2019 — — — — 125 39 42
Morgan-South Rich
Year Spring trend Preseason classification
n Bucks Does and fawns Unclassified n Fawns / 100 does Bucks / 100 does
2010 — — — — 631 101 144
2011 813 — — 813 342 86 99
2012 470 148 307 15 354 84 84
2013 417 101 316 0 — — —
2014 727 218 491 18 — — —
2015 — — — — 393 74 115
2016 260 — — 260 340* 47 123
2017 — — — — — — —
2018 1062* 329 733 0 152 81 56
2019 — — — — — — —
*Includes Cache, North Rich.
152

Pronghorn classification and trend count data by management unit / subunit, Utah 2010–2019 (continued). Mt Dutton/Paunsaugunt
Year Spring trend Preseason classification
n Bucks Does and fawns Unclassified n Fawns / 100 does Bucks / 100 does
2010 719 29 105 585 244 26 32
2011 640 15 150 475 248 49 18
2012 538 75 413 50 419 47 28
2013 705 114 591 0 284 30 32
2014 325 64 261 0 282 37 25
2015 — — — — 276 47 32
2016 562 120 442 0 449 53 33
2017 — — — — 322 51 31
2018 336 79 257 0 388 29 27
2019 — — — — 209 34 30
Nine Mile, Anthro
Year Spring trend Preseason classification
n Bucks Does and fawns Unclassified n Fawns / 100 does Bucks / 100 does
2010 159* 24 135 0 — — — 2011 — — — — 190 51 41
2012 193 43 141 9 240 48 23
2013 — — — — 215 68 26
2014 447 94 344 9 323 81 37
2015 — — — — 303 70 55
2016 514 107 407 0 489 66 46
2017 — — — — 460 77 42
2018 — — — — 662 71 64
2019 — — — — 490 70 50
*Incomplete count.
153
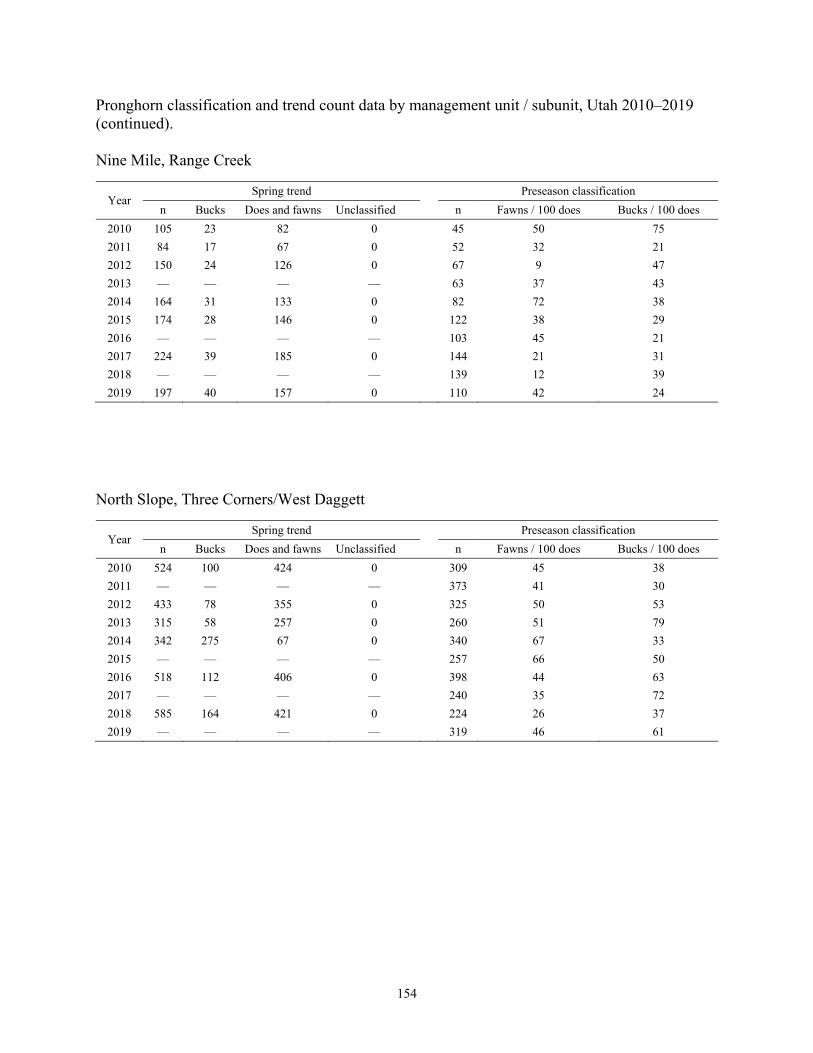
Pronghorn classification and trend count data by management unit / subunit, Utah 2010–2019 (continued). Nine Mile, Range Creek
Year Spring trend Preseason classification
n Bucks Does and fawns Unclassified n Fawns / 100 does Bucks / 100 does
2010 105 23 82 0 45 50 75
2011 84 17 67 0 52 32 21
2012 150 24 126 0 67 9 47
2013 — — — — 63 37 43
2014 164 31 133 0 82 72 38
2015 174 28 146 0 122 38 29
2016 — — — — 103 45 21
2017 224 39 185 0 144 21 31
2018 — — — — 139 12 39
2019 197 40 157 0 110 42 24
North Slope, Three Corners/West Daggett
Year Spring trend Preseason classification
n Bucks Does and fawns Unclassified n Fawns / 100 does Bucks / 100 does
2010 524 100 424 0 309 45 38
2011 — — — — 373 41 30
2012 433 78 355 0 325 50 53
2013 315 58 257 0 260 51 79
2014 342 275 67 0 340 67 33
2015 — — — — 257 66 50
2016 518 112 406 0 398 44 63
2017 — — — — 240 35 72
2018 585 164 421 0 224 26 37
2019 — — — — 319 46 61
154

Pronghorn classification and trend count data by management unit / subunit, Utah 2010–2019 (continued). Panguitch Lake
Year Spring trend Preseason classification
n Bucks Does and fawns Unclassified n Fawns / 100 does Bucks / 100 does
2010 98 14 84 0 98 51 25
2011 116 12 104 0 100 58 35
2012 116 18 98 0 137 84 30
2013 213 40 173 0 151 53 25
2014 43 5 38 0 185 41 23
2015 — — — — 214 47 38
2016 218 45 173 0 135 53 40
2017 — — — — 231 53 41
2018 317 87 230 0 315 32 35
2019 — — — — 205 37 29
Pine Valley
Year Spring trend Preseason classification
n Bucks Does and fawns Unclassified n Fawns / 100 does Bucks / 100 does
2010 192 48 144 0 97 49 27
2011 177 47 130 0 144 68 54
2012 344 88 256 0 132 23 63
2013 240 51 189 0 155 56 46
2014 360 83 277 0 94 38 86
2015 — — — — 208 65 37
2016 426 82 344 0 141 45 82
2017 — — — — 184 45 39
2018 368 82 286 0 173 9 32
2019 — — — — 220 72 26
155

Pronghorn classification and trend count data by management unit / subunit, Utah 2010–2019 (continued). Plateau
Year Spring trend Preseason classification
n Bucks Does and fawns Unclassified n Fawns / 100 does Bucks / 100 does
2010 798 — — 798 185 21 16
2011 899 — — 899 141 48 44
2012 1178 185 993 0 322 61 39
2013 1408 161 714 0 363 62 31
2014 1498 407 979 112 315 70 48
2015 1469 97 509 863 395 60 34
2016 1510 253 1257 0 405 61 32
2017 995 160 588 247 208 54 40
2018 640 120 523 0 501 30 23
2019 — — — — 140 35 38
San Juan, Hatch Point
Year Spring trend Preseason classification
n Bucks Does and fawns Unclassified n Fawns / 100 does Bucks / 100 does
2010 123 22 101 0 68 13 22
2011 53 13 40 0 38 4 42
2012 106 17 89 0 77 14 23
2013 58 10 48 0 74 44 37
2014 100 18 82 0 62 59 24
2015 192 37 155 0 121 55 40
2016 191 41 150 0 118 24 44
2017 143 38 105 0 75 4 43
2018 161 35 126 0 78 11 29
2019 127 19 108 0 46 17 41
156

Pronghorn classification and trend count data by management unit / subunit, Utah 2010–2019 (continued). San Rafael, Desert
Year Spring trend Preseason classification
n Bucks Does and fawns Unclassified n Fawns / 100 does Bucks / 100 does
2010 — — — — — — —
2011 234 56 178 0 81 15 35
2012 123 18 105 0 34 4 22
2013 307 82 225 0 — — —
2014 227 43 184 0 62 24 27
2015 189 44 145 0 79 64 11
2016 — — — — 98 43 26
2017 377 112 265 0 77 22 29
2018 — — — — 81 4 55
2019 197 38 159 0 25 10 15
San Rafael, North
Year Spring trend Preseason classification
n Bucks Does and fawns Unclassified n Fawns / 100 does Bucks / 100 does
2010 246* 73 173 0 162 42 40
2011 537 171 366 0 214 34 24
2012 538 139 399 0 236 40 29
2013 281 77 204 0 281 38 26
2014 835 69 666 0 264 46 24
2015 — — — — 250 75 33
2016 1077 263 814 0 544 60 47
2017 — — — — 360 56 73
2018 1218 304 914 0 444 28 61
2019 — — — — 228 48 58
*Incomplete count.
157

Pronghorn classification and trend count data by management unit / subunit, Utah 2010–2019 (continued). South Slope, Bonanza/Diamond Mtn
Year Spring trend Preseason classification
n Bucks Does and fawns Unclassified n Fawns / 100 does Bucks / 100 does
2010 — — — — 223 35 30
2011 — — — — 298 49 64
2012 476 83 371 22 207 31 42
2013 294 69 225 0 223 49 49
2014 — — — — 311 58 39
2015 478 88 390 0 386 55 44
2016 — — — — 232 50 48
2017 846 200 646 0 201 32 38
2018 — — — — 200 24 54
2019 402 101 301 0 257 65 41
South Slope, Vernal
Year Spring trend Preseason classification
n Bucks Does and fawns Unclassified n Fawns / 100 does Bucks / 100 does
2010 — — — — 128 47 36
2011 — — — — 126 51 43
2012 195 42 152 1 165 53 29
2013 295 41 248 6 173 75 75
2014 — — — — 214 64 36
2015 305 65 236 4 193 67 57
2016 — — — — 237 80 67
2017 241 46 162 33 245 75 40
2018 — — — — 375 63 43
2019 328 115 213 0 220 29 136
158

Pronghorn classification and trend count data by management unit / subunit, Utah 2010–2019 (continued). Southwest Desert
Year Spring trend Preseason classification
n Bucks Does and fawns Unclassified n Fawns / 100 does Bucks / 100 does
2010 1046 297 749 0 411 38 61
2011 1227 361 866 0 424 43 52
2012 899 227 672 0 349 31 44
2013 1005 236 769 0 344 41 32
2014 979 239 740 0 545 44 34
2015 — — — — 607 56 36
2016 1745 463 1282 0 526 57 48
2017 — — — — 351 47 37
2018 1620 434 1182 4 311 17 41
2019 — — — — 605 59 37
West Desert, Riverbed
Year Spring trend Preseason classification
n Bucks Does and fawns Unclassified n Fawns / 100 does Bucks / 100 does
2010 — — — — 187 13 24
2011 — — — — 70 9 97
2012 — — — — 178 20 38
2013 462 59 246 157 90 30 50
2014 — — — — 117 30 35
2015 — — — — 201 60 56
2016 — — — — 175 60 37
2017 — — — — 212 52 72
2018 — — — — 194 27 89
2019 723 166 557 0 248 34 80
159
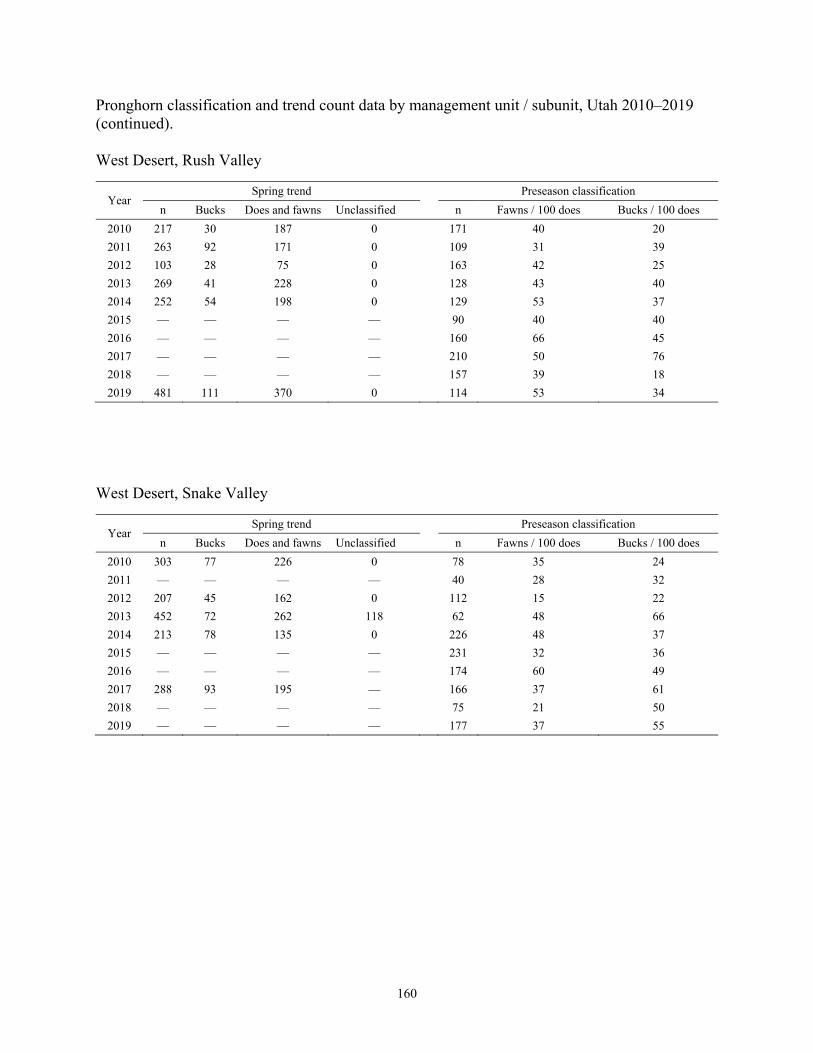
Pronghorn classification and trend count data by management unit / subunit, Utah 2010–2019 (continued). West Desert, Rush Valley
Year Spring trend Preseason classification
n Bucks Does and fawns Unclassified n Fawns / 100 does Bucks / 100 does
2010 217 30 187 0 171 40 20
2011 263 92 171 0 109 31 39
2012 103 28 75 0 163 42 25
2013 269 41 228 0 128 43 40
2014 252 54 198 0 129 53 37
2015 — — — — 90 40 40
2016 — — — — 160 66 45
2017 — — — — 210 50 76
2018 — — — — 157 39 18
2019 481 111 370 0 114 53 34
West Desert, Snake Valley
Year Spring trend Preseason classification
n Bucks Does and fawns Unclassified n Fawns / 100 does Bucks / 100 does
2010 303 77 226 0 78 35 24
2011 — — — — 40 28 32
2012 207 45 162 0 112 15 22
2013 452 72 262 118 62 48 66
2014 213 78 135 0 226 48 37
2015 — — — — 231 32 36
2016 — — — — 174 60 49
2017 288 93 195 — 166 37 61
2018 — — — — 75 21 50
2019 — — — — 177 37 55
160
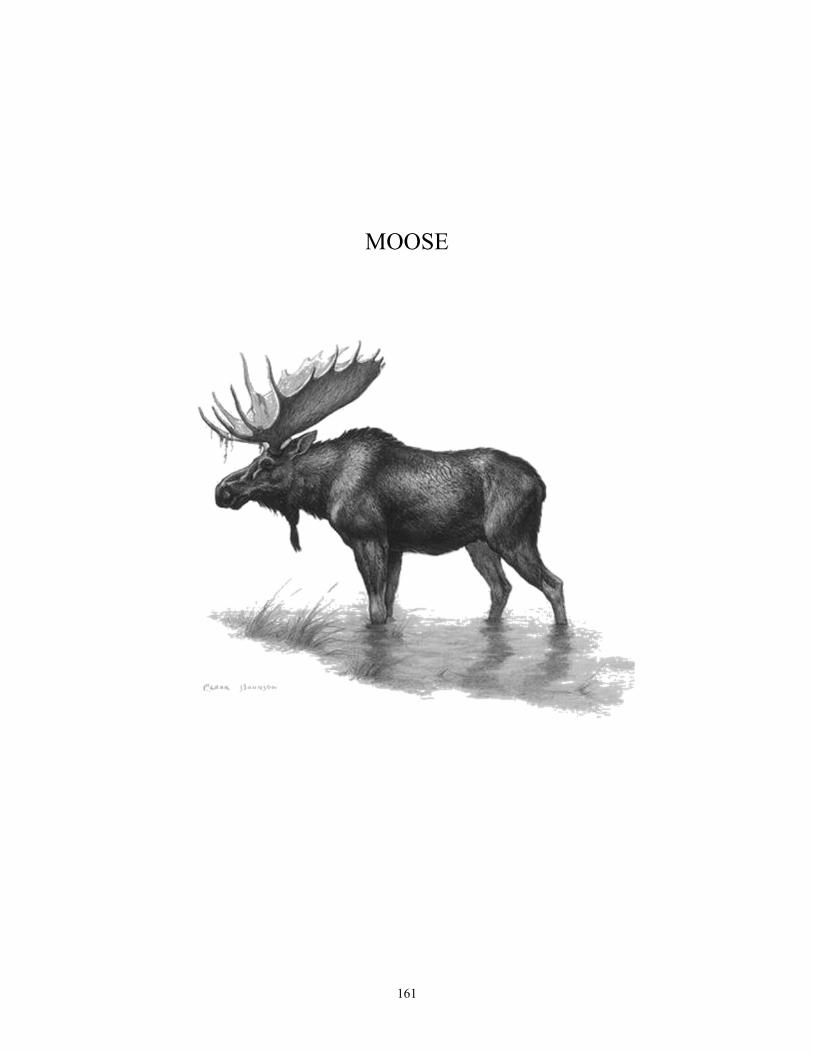
MOOSE
161

Statewide trends of moose harvest statistics, Utah 1958–2019.
162

Statewide moose harvest statistics, Utah 1958–2019.
Year Bull
harvest Antlerless
harvest Total
harvest Permits
Hunters afield
Mean days hunted
Success rate (%)
1958 7 — 7 10 10 — 70.0
1959 5 — 5 10 9 — 55.6
1960 10 — 10 20 19 — 52.6
1961 8 — 8 15 14 — 57.1
1962 7 — 7 15 15 — 46.7
1963 9 — 9 15 15 — 60.0
1964 8 — 8 15 14 — 57.1
1965 8 — 8 15 15 — 53.3
1966 5 — 5 10 9 — 55.6
1967 13 — 13 15 15 — 86.7
1968 14 — 14 15 15 — 93.3
1969 22 — 22 25 25 — 88.0
1970 24 — 24 35 34 — 70.6
1971 32 — 32 65 63 — 50.8
1972 71 — 71 105 105 — 67.6
1973 56 — 56 105 101 — 55.4
1974 16 — 16 25 25 — 64.0
1975 20 — 20 25 25 — 80.0
1976 55 — 55 60 60 — 91.7
1977 30 18 48 50 50 — 96.0
1978 65 16 81 90 89 — 91.0
1979 57 65 122 128 127 — 96.1
1980 81 21 102 120 118 — 86.4
1981 78 18 96 127 116 — 82.8
1982 94 0 94 106 106 — 88.7
1983 89 0 89 109 107 — 83.2
1984 113 0 113 130 130 — 86.9
1985 105 0 105 120 120 — 87.5
1986 134 15 149 156 155 — 96.1
1987 140 14 154 156 155 3.8 99.4
1988 141 26 167 179 176 3.6 94.9
1989 181 25 206 211 209 3.6 98.6
1990 192 90 282 291 283 3.3 99.6
1991 192 99 291 313 296 3.3 98.3
1992 198 100 298 305 303 2.7 98.3
1993 174 59 233 240 299 — 77.9
1994 110 47 157 164 157 — 100.0
1995 140 16 156 196 177 5.7 88.1
163

Statewide moose harvest statistics, Utah 1958–2019 (continued).
Year Bull
harvest Antlerless
harvest Total
harvest Permits
Hunters afield
Mean days hunted
Success rate (%)
1996 139 11 150 168 153 5.5 98.0
1997 142 25 167 172 171 5.2 97.7
1998 137 27 164 175 170 4.1 96.5
1999 110 35 145 — 147 — 98.6
2000* 97 26 123 185 123 — 100.0
2001 169 34 203 204 204 4.9 99.5
2002 174 56 230 233 233 4.4 98.7
2003 139 24 163 173 163 5.1 100.0
2004 201 14 215 245 228 4.4 94.3
2005 205 21 226 266 240 4.9 94.2
2006 223 81 304 336 325 4.9 93.5
2007 236 96 332 366 364 4.9 91.2
2008 266 98 364 428 403 7.0 90.3
2009 243 40 283 295 293 5.2 96.6
2010 214 25 239 270 266 6.4 89.8
2011 176 8 184 204 204 5.7 90.2
2012 168 0 168 175 174 4.9 96.6
2013 146 0 146 155 157 5.5 94.2
2014 128 0 128 138 137 5.1 93.4
2015 137 0 137 143 143 4.7 95.8
2016 133 15 148 162 161 5.8 91.9
2017 137 18 155 171 167 5.7 92.8
2018 163 24 187 199 199 5.0 94.0
2019 159 34 193 217 211 6.7 91.5
*No hunter or harvest data available for CWMU permits.
164

Total moose harvest by management unit / subunit, Utah 2019.
Unit Subunit Bull
harvest Antlerless
harvest Total
harvest Permits
Hunters afield
Mean days hunted
Success rate (%)
1 Box Elder — Box Elder 2 0 2 2 2 7.5 100.0
2 Cache — Cache 14 0 14 14 14 7.9 100.0
6 Chalk Creek — Chalk Creek 27 0 27 29 28 3.3 96.4
5 East Canyon — East Canyon 10 9 19 22 21 5.8 90.5
7 Kamas — Kamas 2 0 2 3 3 10.0 66.7
4 Morgan-South Rich — Morgan-South Rich 24 0 24 27 26 5.6 92.3
8 North Slope A Summit 16 10 26 28 26 4.6 100.0
8 North Slope BC Three Corners/West Daggett 5 0 5 5 5 12.0 100.0
3 Ogden — Ogden 11 15 26 32 32 6.5 81.3
9 South Slope BC Diamond Mtn/Vernal 2 0 2 2 2 13.0 100.0
9 South Slope A Yellowstone 3 0 3 4 4 13.0 75.0
17 Wasatch Mtns BC Avintaquin/Currant Creek 15 0 15 17 17 9.4 90.2
17 Wasatch Mtns A West 26 0 26 29 29 8.2 88.5
Statewide Sportsman/Conservation 2 0 2 3 2 20.0 100.0
165

Total bull moose harvest by management unit / subunit, Utah 2010–2019.
Unit Subunit 2010 2011 2012 2013 2014 2015 2016 2017 2018 2019
1 Box Elder — Box Elder — — — — — — — 1 1 2
2 Cache — Cache 27 13 10 7 5 8 10 10 13 14
6 Chalk Creek — Chalk Creek 26 32 31 29 24 29 23 26 28 27
5 East Canyon — East Canyon 16 18 17 14 14 11 9 10 11 10
7 Kamas — Kamas 4 4 2 2 2 0 1 1 2 2
4 Morgan-South Rich — Morgan-South Rich 32 25 28 27 27 29 28 29 29 24
8 North Slope A Summit 21 11 9 9 7 8 8 11 15 16
8 North Slope BC Three Corners/West Daggett 6 5 6 6 5 4 4 4 4 5
3 Ogden — Ogden 33 19 20 10 7 10 11 8 13 11
9 South Slope BC Diamond Mtn/Vernal 3 3 2 0 1 0 1 1 1 2
9 South Slope A Yellowstone 6 6 3 4 3 4 3 3 3 3
17 Wasatch Mtns BC Avintaquin/Currant Creek 8 13 9 9 11 12 13 12 14 15
17 Wasatch Mtns A West 29 24 29 28 22 20 21 20 26 26
166

Total antlerless moose harvest by management unit / subunit, Utah 2010–2019.
Unit Subunit 2010 2011 2012 2013 2014 2015 2016 2017 2018 2019
1 Box Elder — Box Elder — — — — — — — 0 0 0
2 Cache — Cache 0 0 0 0 0 0 0 0 0 0
6 Chalk Creek — Chalk Creek 10 8 0 0 0 0 0 0 0 0
5 East Canyon — East Canyon 0 0 0 0 0 0 7 6 7 9
7 Kamas — Kamas 0 0 0 0 0 0 0 0 0 0
4 Morgan-South Rich — Morgan-South Rich 0 0 0 0 0 0 0 0 0 0
8 North Slope A Summit 15 0 0 0 0 0 0 0 5 10
8 North Slope BC Three Corners/West Daggett 0 0 0 0 0 0 0 0 0 0
3 Ogden — Ogden 0 0 0 0 0 0 8 12 12 15
9 South Slope BC Diamond Mtn/Vernal 0 0 0 0 0 0 0 0 0 0
9 South Slope A Yellowstone 0 0 0 0 0 0 0 0 0 0
17 Wasatch Mtns BC Avintaquin/Currant Creek 0 0 0 0 0 0 0 0 0 0
17 Wasatch Mtns A West 0 0 0 0 0 0 0 0 0 0
167

Total bull moose hunters afield by management unit / subunit, Utah 2010–2019.
Unit Subunit 2010 2011 2012 2013 2014 2015 2016 2017 2018 2019
1 Box Elder — Box Elder — — — — — — — 1 1 2
2 Cache — Cache 29 16 11 7 6 8 10 11 13 14
6 Chalk Creek — Chalk Creek 31 35 34 30 27 30 29 29 31 28
5 East Canyon — East Canyon 18 19 18 15 16 11 10 12 13 11
7 Kamas — Kamas 4 4 2 2 2 1 1 1 2 3
4 Morgan-South Rich — Morgan-South Rich 33 30 29 29 28 29 29 31 29 26
8 North Slope A Summit 29 11 9 9 7 8 8 11 15 16
8 North Slope BC Three Corners/West Daggett 7 5 6 6 5 4 4 4 4 5
3 Ogden — Ogden 34 21 20 12 7 10 11 8 13 14
9 South Slope BC Diamond Mtn/Vernal 3 3 2 2 1 1 1 1 2 2
9 South Slope A Yellowstone 9 7 3 4 3 4 5 3 3 4
17 Wasatch Mtns BC Avintaquin/Currant Creek 8 13 9 9 11 13 13 13 14 17
17 Wasatch Mtns A West 30 25 29 29 24 22 22 22 26 29
168

Total antlerless moose hunters afield by management unit / subunit, Utah 2010–2019.
Unit Subunit 2010 2011 2012 2013 2014 2015 2016 2017 2018 2019
1 Box Elder — Box Elder — — — — — — — 0 0 0
2 Cache — Cache 0 0 0 0 0 0 0 0 0 0
6 Chalk Creek — Chalk Creek 11 12 0 0 0 0 0 0 0 0
5 East Canyon — East Canyon 0 0 0 0 0 0 7 7 10 10
7 Kamas — Kamas 2 0 0 0 0 0 0 0 0 0
4 Morgan-South Rich — Morgan-South Rich 0 0 0 0 0 0 0 0 0 0
8 North Slope A Summit 15 0 0 0 0 0 0 0 6 10
8 North Slope BC Three Corners/West Daggett 0 0 0 0 0 0 0 0 0 0
3 Ogden — Ogden 0 0 0 0 0 0 10 12 14 18
9 South Slope BC Diamond Mtn/Vernal 0 0 0 0 0 0 0 0 0 0
9 South Slope A Yellowstone 0 0 0 0 0 0 0 0 0 0
17 Wasatch Mtns BC Avintaquin/Currant Creek 0 0 0 0 0 0 0 0 0 0
17 Wasatch Mtns A West 0 0 0 0 0 0 0 0 0 0
169

Once-in-a-lifetime bull moose harvest, Utah 2019.
Unit Hunt
number Hunt name
Bull harvest
Permits Hunters afield
Mean days hunted
Success rate (%)
2 MB6000 Cache 10 10 10 9.6 100.0
6 MB6001 Chalk Creek 2 3 2 1.5 100.0
5 MB6002 East Canyon 3 3 3 6.3 100.0
5 MB6003 East Canyon, Morgan-Summit 3 3 3 10.3 100.0
7 MB6004 Kamas 2 3 3 10.0 66.7
4 MB6005 Morgan-South Rich 1 2 2 23.0 50.0
8 MB6006 North Slope, Summit 13 15 13 6.5 100.0
8 MB6007 North Slope, Three Corners/West Daggett 5 5 5 12.0 100.0
3 MB6008 Ogden 6 7 7 9.9 85.7
9 MB6009 South Slope, Diamond Mtn/Vernal 2 2 2 13.0 100.0
9 MB6010 South Slope, Yellowstone 3 4 4 13.0 75.0
17 MB6011 Wasatch Mtns/Central Mtns 37 41 41 9.4 89.7
Statewide Sportsman/Conservation 2 3 2 20.0 100.0
Antlerless moose harvest, Utah 2019.
Unit Hunt
number Hunt name
Harvest Permits
Hunters afield
Mean days hunted
Success rate (%) Cow Calf Total
5 MA1000 East Canyon, Davis-North Salt Lake 4 1 5 5 5 4.8 100.0
5 MA1001 East Canyon, Morgan-Summit 4 0 4 5 5 5.8 80.0
8 MA1004 North Slope, Summit 9 1 10 10 10 3.1 100.0
3 MA1002 Ogden 8 0 8 9 9 4.4 85.7
3 MA1003 Ogden, West 6 1 7 9 9 7.8 75.0
170

CWMU bull moose harvest, Utah 2019.
Unit Hunt
number CWMU
Bull harvest
Permits Hunters afield
Mean days hunted
Success rate (%)
4 MB6261 Bally Watts 2 2 2 4.0 100.0
3 MB6200 Bear Springs 2 2 2 4.5 100.0
4 MB6201 Beaver Hollow 2 3 2 3.5 100.0
4 MB6202 Causey Spring 4 4 4 6.3 100.0
4 MB6240 Chimney Rock 1 1 1 1.0 100.0
17 MB6205 Coyote Little Pole 2 2 2 3.0 100.0
4 MB6206 Deseret 3 3 3 6.0 100.0
4 MB6207 Durst Mountain 1 1 1 1.0 100.0
6 MB6208 East Fork Chalk Creek 5 5 5 5.0 100.0
6 MB6209 Ensign Ranches 3 3 3 3.7 100.0
4 MB6210 Folley Ridge 1 2 2 3.5 50.0
6 MB6211 Grass Valley/Clark Canyon 8 8 8 3.2 100.0
5 MB6251 Hardscrabble 2 2 2 2.0 100.0
1 MB6257 Ingham Peak 1 1 1 9.0 100.0
5 MB6258 Jacob's Creek 2 3 3 5.0 50.0
1 MB6262 Junction Valley 1 1 1 6.0 100.0
5 MB6215 Lone Tree Tunnel Hollow — 1 0 — —
3 MB6216 Powder Mountain 2 2 2 8.0 100.0
8 MB6259 Royal Ivory Outfitters 3 3 3 1.0 100.0
3 MB6217 Sharp Mountain 1 2 2 2.0 50.0
2 MB6254 SJ Ranch 1 1 1 2.0 100.0
4 MB6219 Skull Crack 5 5 5 3.8 100.0
3 MB6220 South Canyon 0 1 1 1.0 0.0
2 MB6222 Strawberry Ridge 3 3 3 4.0 100.0
17 MB6223 Three C 2 2 2 1.0 100.0
6 MB6224 Two Bear 3 3 3 2.7 100.0
17 MB6255 Wallsburg 0 1 1 3.0 0.0
6 MB6226 Weber Florence Creek 6 7 7 2.7 85.7
4 MB6256 Woodruff Creek South 4 4 4 3.3 100.0
171

Historical statewide moose population trends, Utah 1956–2019.
172

Average age of harvested bull moose, by management unit / subunit, 2010–2019.
Unit Subunit Current
objective
Average age 3-year average 2010 2011 2012 2013 2014 2015 2016 2017 2018 2019
1 Box Elder — Box Elder 3.75–4.25 — — — — — — — — — 6.0 6.0
2 Cache — Cache 3.75–4.25 4.9 3.7 3.8 3.8 3.4 4.6 5.1 4.4 4.7 5.1 4.7
6 Chalk Creek — Chalk Creek 3.75–4.25 3.6 4.0 4.1 4.2 4.0 4.9 3.7 3.9 3.7 4.2 3.9
5 East Canyon — East Canyon 3.75–4.25 4.7 3.2 4.2 3.0 3.4 4.6 3.8 3.9 3.0 3.6 3.5
7 Kamas — Kamas 3.75–4.25 5.0 2.7 3.0 9.0 — — 3.0 5.0 5.5 5.5 5.3
4 Morgan-South Rich — Morgan-South Rich 3.75–4.25 4.7 4.3 4.3 4.2 4.5 5.1 4.6 4.4 4.7 4.8 4.6
8 North Slope A Summit 3.75–4.25 5.3 4.2 4.6 5.3 5.0 5.1 5.9 4.7 4.7 5.2 4.9
8 North Slope BC Three Corners/West Daggett 3.75–4.25 4.2 6.0 3.7 5.0 4.0 5.0 4.5 4.0 6.0 5.2 5.1
3 Ogden — Ogden 3.75–4.25 4.5 3.8 4.3 3.6 3.0 4.0 6.8 5.5 4.7 5.6 5.3
9 South Slope BC Diamond Mtn/Vernal 3.75–4.25 4.3 3.0 4.0 — — — 3.0 6.0 4.0 4.0 4.7
9 South Slope A Yellowstone 3.75–4.25 4.3 4.2 4.5 3.5 6.5 4.0 5.7 4.0 3.3 4.0 3.8
17 Wasatch Mtns — Wasatch Mtns 3.75–4.25 4.1 4.0 4.4 4.6 4.6 4.3 3.7 4.4 4.2 3.7 4.1
Statewide average 3.75–4.25 4.5 3.9 4.3 4.3 4.3 4.7 4.4 4.4 4.3 4.5 4.4
173

Moose trend count data by management unit / subunit, Utah 2010–2019.
Cache
Year n Calves / 100 cows Calves / 100 adults Bulls / 100 cows
2010–11 — — — —
2011–12 — — — —
2012–13 — — — —
2013–14 172 36 18 103
2014–15 — — — —
2015–16 — — — —
2016–17 — — — —
2017–18 — — — —
2018–19 203 52 32 64
2019–20 — — — —
Chalk Creek
Year n Calves / 100 cows Calves / 100 adults Bulls / 100 cows
2010–11 256 27 15 73
2011–12 — — — —
2012–13 281 41 22 88
2013–14 — — — —
2014–15 — — — —
2015–16 — — — —
2016–17 — — — —
2017–18 — — — —
2018–19 264 38 22 75
2019–20 — — — —
East Canyon
Year n Calves / 100 cows Calves / 100 adults Bulls / 100 cows
2010–11 233 53 28 88
2011–12 — — — —
2012–13 — — — —
2013–14 — — — —
2014–15 — — — —
2015–16 221 33 22 51
2016–17 — — — —
2017–18 — — — —
2018–19 — — — —
2019–20 — — — —
174

Moose trend count data by management unit / subunit, Utah 2010–2019 (continued). Kamas
Year n Calves / 100 cows Calves / 100 adults Bulls / 100 cows
2010–11 54 59 32 86
2011–12 — — — —
2012–13 53 64 36 77
2013–14 — — — —
2014–15 — — — —
2015–16 — — — —
2016–17 — — — —
2017–18 — — — —
2018–19 62 44 24 85
2019–20 — — — —
Morgan-South Rich
Year n Calves / 100 cows Calves / 100 adults Bulls / 100 cows
2010–11 — — — —
2011–12 — — — —
2012–13 — — — —
2013–14 — — — —
2014–15 — — — —
2015–16 285 31 18 73
2016–17 — — — —
2017–18 — — — —
2018–19 — — — —
2019–20 353 53 21 145
North Slope, Summit
Year n Calves / 100 cows Calves / 100 adults Bulls / 100 cows
2010–11 92 47 35 33
2011–12 — — — —
2012–13 278* 52 38 35
2013–14 — — — —
2014–15 — — — —
2015–16 — — — —
2016–17 18 — — —
2017–18 — — — —
2018–19 110 47 — 92
2019–20 — — — —
*Includes portions of Wyoming.
175

Moose trend count data by management unit / subunit, Utah 2010–2019 (continued). North Slope, Three Corners/West Daggett
Year n Calves / 100 cows Calves / 100 adults Bulls / 100 cows
2010–11 — — — —
2011–12 — — — —
2012–13 74 41 23 76
2013–14 — — — —
2014–15 — — — —
2015–16 — — — —
2016–17 — — — —
2017–18 — — — —
2018–19 57 42 16 158
2019–20 — — — —
Ogden
Year n Calves / 100 cows Calves / 100 adults Bulls / 100 cows
2010–11 — — — —
2011–12 — — — —
2012–13 — — — —
2013–14 430 36 21 71
2014–15 — — — —
2015–16 — — — —
2016–17 — — — —
2017–18 — — — —
2018–19 343 33 19 76
2019–20 — — — —
South Slope, Diamond Mtn /Vernal
Year n Calves / 100 cows Calves / 100 adults Bulls / 100 cows
2010–11 — — — —
2011–12 — — — —
2012–13 27 22 8 178
2013–14 — — — —
2014–15 — — — —
2015–16 — — — —
2016–17 — — — —
2017–18 — — — —
2018–19 5 — — —
2019–20 — — — —
176

Moose trend count data by management unit / subunit, Utah 2010–2019 (continued). South Slope, Yellowstone
Year n Calves / 100 cows Calves / 100 adults Bulls / 100 cows
2010–11 — — — —
2011–12 — — — —
2012–13 73 44 33 34
2013–14 — — — —
2014–15 — — — —
2015–16 — — — —
2016–17 — — — —
2017–18 — — — —
2018–19 67 34 — 57
2019–20 — — — —
Wasatch Mtns, Avintaquin/Currant Creek
Year n Calves / 100 cows Calves / 100 adults Bulls / 100 cows
2010–11 49 30 20 52
2011–12 — — — —
2012–13 56 30 19 57
2013–14 — — — —
2014–15 — — — —
2015–16 — — — —
2016–17 — — — —
2017–18 — — — —
2018–19 — — — —
2019–20 — — — —
Wasatch Mtns, West
Year n Calves / 100 cows Calves / 100 adults Bulls / 100 cows
2010–11 282 55 32 74
2011–12 — — — —
2012–13 180 30 17 77
2013–14 — — — —
2014–15 — — — —
2015–16 — — — —
2016–17 — — — —
2017–18 — — — —
2018–19 — — — —
2019–20 — — — —
177

BISON
178

Statewide trends of bison harvest statistics, Utah 1960–2019.
*Data not available for 1964, 1965, 1972, and 1973. Does not include harvest or hunt statistics from Antelope Island hunts. Book Cliffs harvest included beginning in 2012.
179

Statewide bison harvest statistics*, Henry Mtns and Book Cliffs, Utah 1950–2019.
Year Harvest Permits
Hunters afield
Success rate (%) Bull Cow Calf Total
Hunter’s choice
Cow Total
1950 6 4 0 10 10 — 10 10 100.0
1951 — — — — — — — — —
1952 — — — — — — — — —
1953 — — — — — — — — —
1954 — — — — — — — — —
1955 — — — — — — — — —
1956 — — — — — — — — —
1957 — — — — — — — — —
1958 — — — — — — — — —
1959 — — — — — — — — —
1960 7 3 0 10 10 — 10 10 100.0
1961 8 4 0 12 12 — 12 12 100.0
1962 9 11 0 20 20 — 20 20 100.0
1963 1 6 0 7 14 — 14 14 50.0
1964 — — — — — — — — —
1965 — — — — — — — — —
1966 7 3 0 10 10 — 10 10 100.0
1967 4 6 0 10 10 — 10 10 100.0
1968 15 0 0 15 15 — 15 15 100.0
1969 8 0 0 8 10 — 10 10 80.0
1970 6 0 0 6 10 — 10 10 60.0
1971 8 2 0 10 15 — 15 15 66.7
1972 — — — — — — — — —
1973 — — — — — — — — —
1974 4 3 0 7 10 — 10 9 77.8
1975 7 2 0 9 10 — 10 9 100.0
1976 8 2 0 10 10 — 10 10 100.0
1977 9 1 0 10 10 — 10 10 100.0
1978 11 9 1 21 22 — 22 22 95.5
1979 14 12 1 27 27 — 27 27 100.0
1980 16 6 1 23 27 — 27 27 85.2
1981 20 5 0 25 27 — 27 27 92.6
1982 16 10 2 28 28 — 28 28 100.0
1983 20 8 0 28 28 — 28 28 100.0
1984 28 7 0 35 36 — 36 36 97.2
1985 29 12 0 41 45 — 45 45 91.1
1986 39 17 0 56 56 — 56 56 100.0
1987 40 14 1 55 56 — 56 56 98.2
1988 32 32 0 64 45 22 67 67 95.5
1989 31 28 1 60 45 22 67 67 89.6
*Does not include harvest or hunt statistics from Antelope Island hunts. Book Cliffs harvest included beginning in 2012.
180

Statewide bison harvest statistics*, Henry Mtns and Book Cliffs, Utah 1950–2019 (continued).
Year Harvest Permits
Hunters afield
Success rate (%) Bull Cow Calf Total
Hunter’s choice
Cow Total
1990 47 103 0 150 55 129 184 184 81.5
1991 44 32 2 78 70 22 92 91 85.7
1992 17 1 0 18 18 — 18 18 100.0
1993 41 7 0 48 51 — 51 51 94.1
1994 20 58 2 80 24 66 90 90 88.9
1995 32 44 0 76 36 66 102 102 74.5
1996 38 7 0 45 48 — 48 48 93.8
1997 24 28 0 52 29 27 56 56 92.9
1998 39 35 0 74 47 34 81 81 91.4
1999 30 52 0 82 37 66 103 102 80.4
2000 21 24 0 45 28 25 53 52 86.5
2001 39 38 0 77 62 30 92 92 83.7
2002 26 17 0 43 32 15 47 47 91.5
2003 34 14 0 48 41 19 60 60 80.0
2004 17 24 0 41 22 19 41 41 100.0
2005 12 11 0 23 15 10 25 23 100.0
2006 12 10 0 22 12 10 22 22 100.0
2007 61 59 0 121 68 75 143 141 85.8
2008 59 73 0 133** 68 102 170 165 80.6
2009 38 71 0 109 56 92 148 146 74.7
2010 31 7 0 38 40 11 51 48 79.2
2011 16 5 0 21 19 6 25 25 84.0
2012 49 48 0 97 66 57 123 123 78.9
2013 34 35 0 69 58 48 106 105 65.7
2014 41 32 0 73 52 35 87 85 85.9
2015 40 20 0 60 53 23 76 72 83.3
2016 53 25 0 78 70 23 93 92 84.8
2017 96 45 0 141 104 53 157 162 87.0
2018 96 106 0 202 143 123 266 261 77.4
2019 80 93 0 173 128 112 240 240 72.1
*Does not include harvest or hunt statistics from Antelope Island hunts. Book Cliffs harvest included beginning in 2012. **Includes one harvest of unknown sex.
181

Once-in-a-lifetime bison harvest, Utah 2019.
Hunt number
Hunt name Bull
harvestCow
harvest Total
harvest Permits
Hunters afield
Mean days hunted
Success rate (%)
BI6508 Book Cliffs (cow only) 1 21 22 26 26 3.5 84.6
BI6520 Book Cliffs (cow only) 1 11 12 23 23 5.3 50.0
BI6501 Book Cliffs (hunter's choice) 11 0 11 11 11 1.2 100.0
BI6517 Book Cliffs (hunter's choice) 13 3 16 16 16 3.1 100.0
BI6518 Book Cliffs (hunter's choice) 5 4 9 16 16 6.9 58.3
BI6519 Book Cliffs, Little Creek Roadless (hunter's choice) 9 0 9 9 9 3.1 100.0
BI6507 Book Cliffs, Wild Horse Bench/Nine Mile, Anthro (hunter's choice) 8 0 8 10 10 13.6 75.0
BI6505 Henry Mtns (cow only) 1 12 13 25 25 5.5 50.0
BI6506 Henry Mtns (cow only) 0 23 23 26 26 6.1 87.5
BI6515 Henry Mtns (cow only) 0 8 8 12 12 7.5 63.6
BI6503 Henry Mtns (hunter's choice) 11 2 13 17 17 4.7 76.5
BI6504 Henry Mtns (hunter's choice) 5 3 8 18 18 7.6 44.4
BI6509 Henry Mtns (hunter's choice) 5 2 7 9 9 6.0 77.8
BI6516 Henry Mtns (hunter's choice) 8 4 12 20 20 6.0 60.0
Statewide Sportsman/Conservation 2 0 2 2 2 10.0 100.0
182
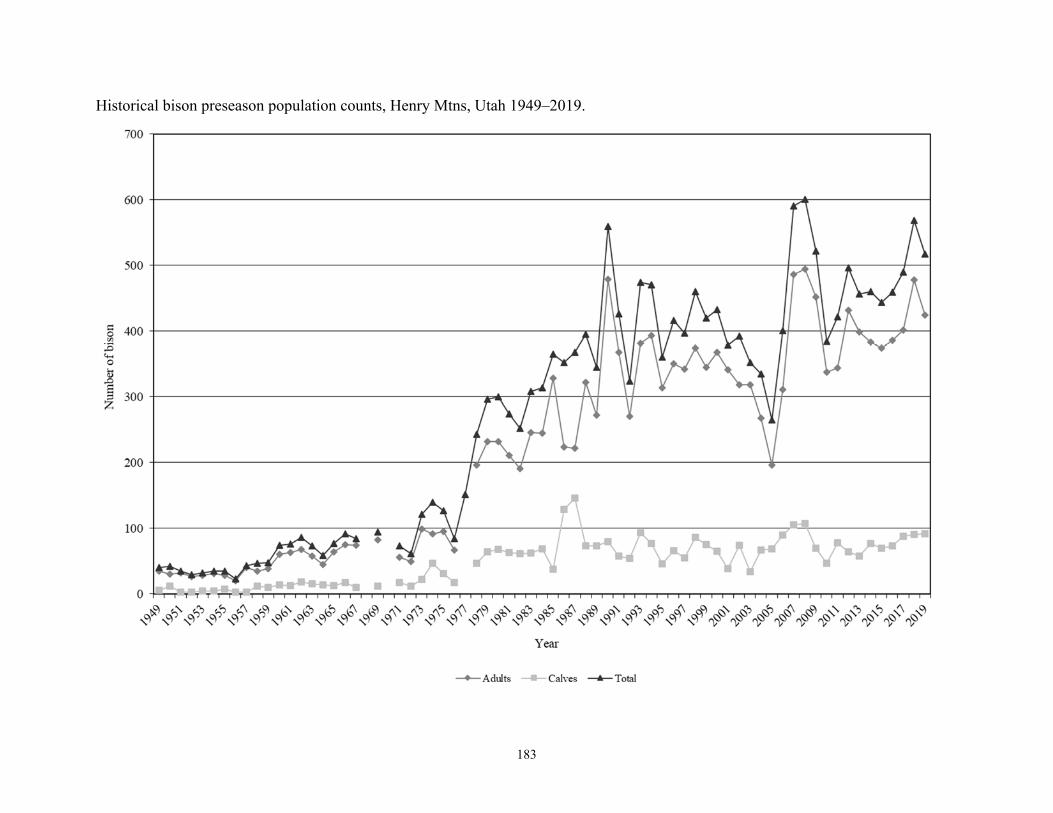
Historical bison preseason population counts, Henry Mtns, Utah 1949–2019.
183

Historical bison preseason classification, Henry Mtns, Utah, 1997–2019.
Year Calves / 100 cows Bulls / 100 cows
1997 25 55
1998 35 54
1999 36 65
2000 28 57
2001 18 57
2002 36 56
2003 17 56
2004 42 42
2005 49 38
2006 39 36
2007 35 60
2008 33 53
2009 24 52
2010 32 72
2011 37 61
2012 31 63
2013 28 56
2014 30 53
2015 31 70
2016 42 54
2017 37 56
2018 37 45
2019 14 63
Historical bison trend counts and classification, Book Cliffs, Utah, 2013–2019.
Year Spring trend counts Preseason classification
n Adults Calves Unclassified n Calves / 100 cows Bulls / 100 cows
2013 — — — — 111 53 73
2014 — — — — 96 35 70
2015 — — — — 192 42 84
2016 484 382 102 0 195 49 91
2017 — — — — 145 43 66
2018 — — — — 350 47 75
2019 595 457 138 — 156 55 62
184
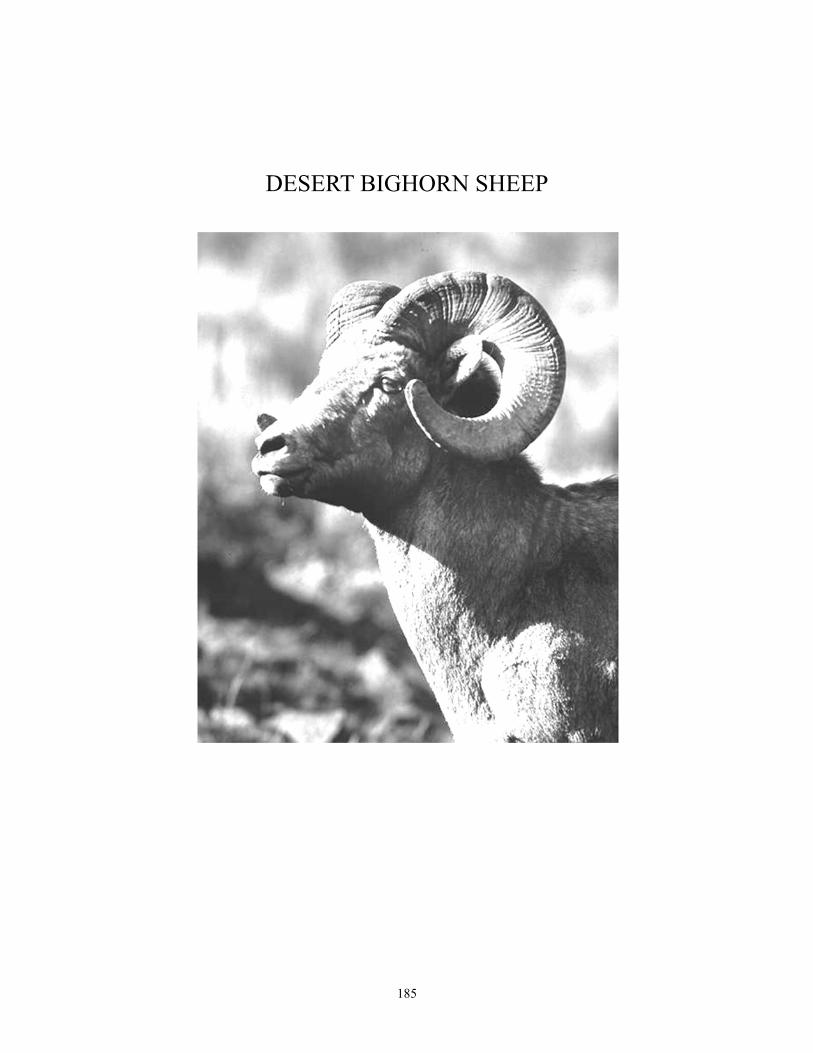
DESERT BIGHORN SHEEP
185

Statewide trends of desert bighorn sheep harvest statistics, Utah 1967–2019.
*Data not available in 1973 and 1974.
186

Statewide desert bighorn sheep harvest statistics, Utah 1967–2019.
Year Ram
harvest Permits
Hunters afield
Mean days hunted
Success rate (%)
1967 9 10 9 2.7 100.0
1968 3 10 10 5.2 30.0
1969 6 10 10 5.5 60.0
1970 4 10 10 7.4 40.0
1971 1 10 10 — 10.0
1972 1 10 8 — 12.5
1973 — — — — —
1974 — — — — —
1975 2 5 5 6.2 40.0
1976 4 10 10 8.7 40.0
1977 10 25 25 9.0 40.0
1978 7 23 23 8.6 30.4
1979 3 18 18 13.1 16.7
1980 10 19 19 12.7 52.6
1981 5 18 18 12.6 27.8
1982 6 11 11 9.9 54.5
1983 9 10 10 15.0 90.0
1984 5 14 14 13.4 35.7
1985 12 15 15 8.3 80.0
1986 10 14 14 8.0 71.4
1987 7 12 12 8.2 58.3
1988 12 15 15 8.1 80.0
1989 10 12 12 10.5 83.3
1990 12 15 15 7.1 80.0
1991 10 13 13 12.2 76.9
1992 10 11 11 6.5 90.9
1993 17 17 17 7.9 100.0
1994 18 19 19 0.0 94.7
1995 30 32 30 0.0 100.0
1996 28 29 29 8.7 96.6
1997 28 29 29 7.5 96.6
1998 31 31 31 8.4 100.0
1999 31 32 32 8.5 96.9
2000 33 33 33 6.3 100.0
2001 30 31 30 11.4 100.0
2002 39 40 40 6.4 97.5
2003 43 44 44 7.3 97.7
2004 40 42 42 8.7 95.2
187

Statewide desert bighorn sheep harvest statistics, Utah 1967–2019 (continued).
Year Ram
harvest Permits
Hunters afield
Mean days hunted
Success rate (%)
2005 39 40 40 8.5 97.5
2006 37 43 41 8.2 90.2
2007 40 45 45 10.7 88.9
2008 39 42 41 8.2 95.1
2009 37 42 41 9.8 90.2
2010 46 50 50 8.5 92.0
2011 46 54 54 8.9 85.2
2012 41 47 47 9.0 87.2
2013 42 44 43 8.7 97.7
2014 45 46 46 8.6 97.8
2015 45 49 48 7.6 93.8
2016 41 46 45 9.0 91.1
2017 57 59 58 8.6 98.3
2018 57 60 59 7.0 96.6
2019 75 78 79 7.5 96.2
188

Total desert bighorn sheep harvest by hunt, Utah 2019.
Unit Hunt
number Hunt name
Ram Harvest
Permits Hunters afield
Mean days hunted
Success rate (%)
15 DS6600 Henry Mtns 4 4 4 13.0 100.0
26 DS6601 Kaiparowits, East* 9 9 9 7.6 100.0
26 DS6602 Kaiparowits, Escalante 4 4 4 6.3 100.0
26 DS6603 Kaiparowits, West 11 12 11 3.8 100.0
13 DS6604 La Sal, Potash/South Cisco 4 4 4 10.8 100.0
30 DS6605 Pine Valley 4 4 4 3.3 100.0
14 DS6606 San Juan, Lockhart 2 2 2 3.0 100.0
14 DS6607 San Juan, South 1 4 4 13.7 33.3
12 DS6608 San Rafael, Dirty Devil 3 3 3 6.5 100.0
12 DS6609 San Rafael, North 5 5 5 9.2 100.0
12 DS6610 San Rafael, South† 8 8 8 10.0 100.0
29 DS6611 Zion^ 5 5 5 7.4 100.0
29 DS6612 Zion 6 6 6 5.5 100.0
29 DS6619 Zion 2 2 2 9.0 100.0
12/13/14/15 DS6615 Henry Mtns/La Sal, Potash/South Cisco/San Juan, South & Lockhart/San Rafael, Dirty Devil
1 1 1 1.0 100.0
12 DS6617 San Rafael, North/South 1 1 1 12.0 100.0
29 DS6613 Zion 2 2 2 1.5 100.0
29 DS6614 Zion 1 1 1 6.0 100.0
Statewide Sportsman/Conservation 2 2 2 13.0 100.0
*Nonresidents could hunt all Kaiparowits subunits. †Nonresidents could hunt both North and South San Rafael subunits. ^Nonresidents could hunt both early and late Zion seasons.
189

Total ram desert bighorn sheep harvest* by management unit / subunit, Utah 2010–2019.
Unit Hunt name 2010 2011 2012 2013 2014 2015 2016 2017 2018 2019
15 Henry Mtns 1 2 1 2 2 2 1 4 3 4
26 Kaiparowits, East 4 2 3 3 3 2 4 8 8 10
26 Kaiparowits, Escalante 4 4 3 1 2 1 2 2 4 4
26 Kaiparowits, West 2 4 4 4 5 8 7 8 7 13
13 La Sal, Potash 3 3 3 3 2 3 3 2 4 5
30 Pine Valley, Virgin River 2 3 2 3 2 2 2 4 3 4
14 San Juan, Lockhart 2 1 1 1 1 1 1 2 2 2
14 San Juan, South 3 2 2 2 2 1 1 3 2 1
12 San Rafael, Dirty Devil 5 5 2 2 3 2 1 2 1 3
12 San Rafael, North 5 3 2 1 1 1 1 4 3 6
12 San Rafael, South 9 8 8 9 7 7 7 7 6 7
29 Zion 4 9 10 10 13 15 11 12 14 14
*Harvest taken by statewide sportsman and conservation permit holders were added to the unit where the harvest occurred, when known. Also, some nonresident permit holders were allowed to hunt in multiple units – in this table, harvest is added to the unit where harvest occurred.
190

Total ram desert bighorn sheep hunters afield by management unit / subunit, Utah 2010–2019.
Unit Hunt name 2010 2011 2012 2013 2014 2015 2016 2017 2018 2019
15 Henry Mtns 2 2 2 2 3 3 3 4 4 4
26 Kaiparowits, East 4 4 4 4 2 3 5 8 8 9
26 Kaiparowits, Escalante 5 6 5 2 2 2 2 2 4 4
26 Kaiparowits, West 2 3 3 3 4 7 5 7 6 11
13 La Sal, Potash 3 3 3 3 2 2 2 2 3 4
30 Pine Valley, Virgin River 2 3 2 3 2 2 2 3 3 4
14 San Juan, Lockhart 2 2 2 1 1 1 1 2 2 2
14 San Juan, South 3 2 2 2 2 1 1 2 1 4
12 San Rafael, Dirty Devil 6 6 3 2 2 1 1 2 1 3
12 San Rafael, North 5 5 3 1 1 1 2 3 3 5
12 San Rafael, South 9 9 8 9 6 6 7 8 7 8
29 Zion 5 7 8 9 12 13 9 11 12 14
Statewide Sportsman/Conservation — 2 2 2 7 6 5 4 5 6
191

Desert bighorn sheep trend count data by management unit / subunit, Utah 2010–2019. Henry Mtns
Year n Lambs / 100 ewes Rams / 100 ewes Population estimate
2010 24 46 38 —
2011 — — — —
2012 63 52 100 105
2013 — — — —
2014 73 41 74 122
2015 — — — —
2016 92 30 70 153
2017 — — — —
2018 — — — —
2019 90 31 69 150
Kaiparowits, East/West
Year n Lambs / 100 ewes Rams / 100 ewes Population estimate
2010 — — — —
2011 200 40 54 —
2012 — — — —
2013 339 31 36 565
2014 — — — —
2015 355 35 44 592
2016 — — — —
2017 — — — —
2018 484 37 65 807
2019 — — — —
Kaiparowits, Escalante
Year n Lambs / 100 ewes Rams / 100 ewes Population estimate
2010 87 24 67 —
2011 — — — —
2012 71 22 51 118
2013 — — — —
2014 92 35 45 153
2015 — — — —
2016 — — — —
2017 88 21 63 147
2018 — — — —
2019 — — — —
192

Desert bighorn sheep trend count data by management unit / subunit, Utah 2010–2019 (continued). La Sal, Potash
Year n Lambs / 100 ewes Rams / 100 ewes Population estimate
2010 118 13 51 —
2011 — — — —
2012 69 19 72 115
2013 — — — —
2014 81 45 39 135
2015 — — — —
2016 — — — —
2017 134 43 51 223
2018 — — — —
2019 — — — —
Pine Valley, Virgin River
Year n Lambs / 100 ewes Rams / 100 ewes Population estimate
2010 73 22 76 —
2011 — — — —
2012 72 31 69 144
2013 — — — —
2014 52 21 59 104
2015 — — — —
2016 131 31 37 218
2017 — — — —
2018 — — — —
2019 149 43 41 248
San Juan, Lockhart
Year n Lambs / 100 ewes Rams / 100 ewes Population estimate
2010 46 32 52 —
2011 — — — —
2012 40 23 31 67
2013 — — — —
2014 84 22 33 140
2015 — — — —
2016 — — — —
2017 55 28 44 92
2018 — — — —
2019 — — — —
193

Desert bighorn sheep trend count data by management unit / subunit, Utah 2010–2019 (continued). San Juan, North
Year n Lambs / 100 ewes Rams / 100 ewes Population estimate
2010 17 9 45 —
2011 — — — —
2012 13 22 22 22
2013 — — — —
2014 14 38 38 23
2015 — — — —
2016 — — — —
2017 34 28 61 57
2018 — — — —
2019 42 41 50 70
San Juan, South
Year n Lambs / 100 ewes Rams / 100 ewes Population estimate
2010 57 3 40 —
2011 — — — —
2012 39 8 54 65
2013 — — — —
2014 45 30 37 75
2015 — — — —
2016 — — — —
2017 62 21 42 103
2018 — — — —
2019 — — — —
San Rafael, Dirty Devil
Year n Lambs / 100 ewes Rams / 100 ewes Population estimate
2010 67 30 37 —
2011 — — — —
2012 66 39 42 110
2013 — — — —
2014 60 38 50 100
2015 — — — —
2016 86 39 57 143
2017 — — — —
2018 — — — —
2019 113 43 102 188
194

Desert bighorn sheep trend count data by management unit / subunit, Utah 2010–2019 (continued). San Rafael, North
Year n Lambs / 100 ewes Rams / 100 ewes Population estimate
2010 — — — —
2011 86 29 37 —
2012 101 47 36 168
2013 94 31 53 157
2014 — — — —
2015 124 42 65 207
2016 — — — —
2017 — — — —
2018 102 40 98 170
2019 — — — —
San Rafael, South
Year n Lambs / 100 ewes Rams / 100 ewes Population estimate
2010 — — — —
2011 220 29 62 —
2012 — — — —
2013 188 37 51 313
2014 — — — —
2015 216 32 65 360
2016 — — — —
2017 — — — —
2018 133 25 97 222
2019 — — — —
Zion
Year n Lambs / 100 ewes Rams / 100 ewes Population estimate
2010 — — — —
2011 200 28 56 —
2012 — — — 600
2013 504 33 63 840
2014 — — — —
2015 498 30 41 830
2016 — — — —
2017 — — — —
2018 484 40 43 807
2019 — — — —
195

ROCKY MOUNTAIN BIGHORN SHEEP
196

Statewide trends of Rocky Mountain bighorn sheep harvest statistics, Utah 1991–2019.
197

Statewide Rocky Mountain bighorn sheep harvest statistics, Utah 1991–2019.
Year Ram
harvest Permits
Hunters afield
Mean days hunted
Success rate (%)
1991 3 3 3 — 100.0
1992 3 3 3 — 100.0
1993 6 6 6 — 100.0
1994 6 6 6 6.7 100.0
1995 6 6 6 — 100.0
1996 5 6 6 5.0 83.3
1997 3 3 3 5.0 100.0
1998 5 5 5 10.2 100.0
1999 4 4 4 — 100.0
2000 9 9 9 — 100.0
2001 12 12 12 — 100.0
2002 12 13 13 — 92.3
2003 13 13 13 17.1 100.0
2004 12 12 12 8.6 100.0
2005 13 13 13 9.1 100.0
2006 19 20 20 7.7 95.0
2007 22 22 22 5.7 100.0
2008 27 27 27 8.7 100.0
2009 28 28 28 5.0 100.0
2010 34 35 34 6.6 100.0
2011 37 37 37 6.4 100.0
2012 42 42 42 4.5 100.0
2013 46 46 46 5.2 100.0
2014 44 44 44 4.2 100.0
2015 40 41 41 5.2 97.6
2016 39 40 40 4.6 97.5
2017 37 37 37 5.7 100.0
2018 42 43 43 5.6 97.7
2019 57 60 60 3.7 95.0
198
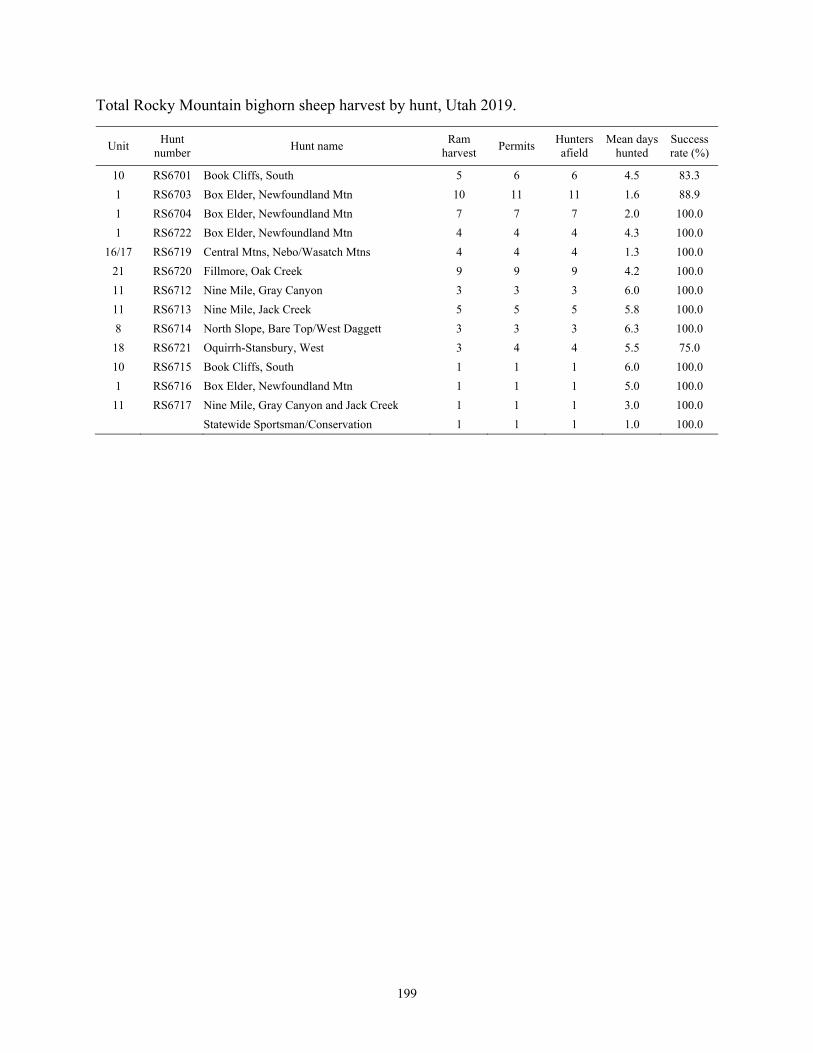
Total Rocky Mountain bighorn sheep harvest by hunt, Utah 2019.
Unit Hunt
number Hunt name
Ram harvest
Permits Hunters afield
Mean days hunted
Success rate (%)
10 RS6701 Book Cliffs, South 5 6 6 4.5 83.3
1 RS6703 Box Elder, Newfoundland Mtn 10 11 11 1.6 88.9
1 RS6704 Box Elder, Newfoundland Mtn 7 7 7 2.0 100.0
1 RS6722 Box Elder, Newfoundland Mtn 4 4 4 4.3 100.0
16/17 RS6719 Central Mtns, Nebo/Wasatch Mtns 4 4 4 1.3 100.0
21 RS6720 Fillmore, Oak Creek 9 9 9 4.2 100.0
11 RS6712 Nine Mile, Gray Canyon 3 3 3 6.0 100.0
11 RS6713 Nine Mile, Jack Creek 5 5 5 5.8 100.0
8 RS6714 North Slope, Bare Top/West Daggett 3 3 3 6.3 100.0
18 RS6721 Oquirrh-Stansbury, West 3 4 4 5.5 75.0
10 RS6715 Book Cliffs, South 1 1 1 6.0 100.0
1 RS6716 Box Elder, Newfoundland Mtn 1 1 1 5.0 100.0
11 RS6717 Nine Mile, Gray Canyon and Jack Creek 1 1 1 3.0 100.0
Statewide Sportsman/Conservation 1 1 1 1.0 100.0
199

Total ram Rocky Mountain bighorn sheep harvest* by hunt, Utah 2010–2019.
Unit Hunt name 2010 2011 2012 2013 2014 2015 2016 2017 2018 2019
10 Book Cliffs, South (Rattlesnake) 6 9 9 8 6 4 5 6 7 6
1 Box Elder, Newfoundland Mtn 5 5 6 11 11 11 10 11 14 21
1 Box Elder, Pilot Mtn 1 — — 1 1 — 1 — 1 —
16/17 Central Mtns, Nebo/Wasatch Mtns — — — — 1 1 2 1 1 4
21 Fillmore, Oak Creek — — — — — — — — 2 4
11 Nine Mile, Range Creek (Gray and Jack Cyns) 13 13 17 17 18 17 16 14 13 13
8 North Slope, Three Corners (Bare Top) 2 3 3 3 1 1 1 — 2 5
8 North Slope, West Daggett (Sheep Creek)** 3 3 3 3 3 2 2 4
18 Oquirrh-Stansbury, Stansbury 2 2 2 3 3 3 0 — — 3
17 Wasatch Mtns, Avintaquin — — — — — — 2 1 — —
Unknown — — — — — 1 — — 1 1
*Harvest taken by statewide sportsman and conservation permit holders were included in the unit where the harvest occurred. Also, some nonresident permit holders were allowed to hunt in multiple units – in this table, harvest is included in the unit where harvest occurred. **Combined with North Slope, Three Corners (Bare Mtn) beginning in 2018.
200

Total ram Rocky Mountain bighorn sheep hunters afield by hunt, Utah 2010–2019.
Unit Hunt name 2010 2011 2012 2013 2014 2015 2016 2017 2018 2019
10 Book Cliffs, South (Rattlesnake) 6 8 7 7 5 5 5 6 6 7
1 Box Elder, Newfoundland Mtn 5 5 6 10 11 11 10 11 14 23
1 Box Elder, Pilot Mtn 1 — — 1 1 — 1 — 1 —
16/17 Central Mtns, Nebo/Wasatch Mtns, West — — — — 1 1 1 1 1 4
21 Fillmore, Oak Creek — — — — — — — — 2 4
11 Nine Mile, Range Creek (Bighorn Mtn) 13 12 17 17 17 16 16 14 12 13
8 North Slope, Three Corners (Bare Mtn) 2 3 3 3 1 1 1 — 3 5
8 North Slope, West Daggett (Sheep Creek)* 3 3 3 3 3 2 2 4
18 Oquirrh-Stansbury, Stansbury 2 2 2 3 3 3 0 — — 3
17 Wasatch Mtns, Avintaquin — — — — — — 2 1 — —
Statewide Sportsman/Conservation — 2 2 2 2 2 2 2 3 1
*Combined with North Slope, Three Corners (Bare Mtn) beginning in 2018.
201

Rocky Mountain bighorn sheep trend count data by management unit / subunit, Utah 2010–2019. Book Cliffs, South (Rattlesnake)
Year n Lambs / 100 ewes Rams / 100 ewes Population estimate
2010 — — — —
2011 182 26 54 —
2012 — — — —
2013 153 33 52 255
2014 — — — —
2015 — — — —
2016 138 26 51 230
2017 — — — —
2018 — — — —
2019 89 40 49 148
Box Elder, Newfoundland Mtns
Year n Lambs / 100 ewes Rams / 100 ewes Population estimate
2010 — — — —
2011 — — — —
2012 198 54 94 283
2013 — — — —
2014 139 48 80 232
2015 — — — —
2016 158 69 86 263
2017 — — — —
2018 — — — —
2019 188 32 132 313
Central Mtns, Nebo
Year n Lambs / 100 ewes Rams / 100 ewes Population estimate
2010 — — — —
2011 — — — —
2012 — — — —
2013 16 — — —
2014 — — — —
2015 14 — — —
2016 — — — —
2017 — — — —
2018 31 38 56 52
2019 — — — —
202

Rocky Mountain bighorn sheep trend count data by management unit / subunit, Utah 2010–2019 (continued). Fillmore, Oak Creek
Year n Lambs / 100 ewes Rams / 100 ewes Population estimate
2017 67 43 63 134
2018 — — — —
2019 130 40 167 217
Nine Mile, Range Creek (Gray and Jack Canyons)
Year n Lambs / 100 ewes Rams / 100 ewes Population estimate
2010 — — — —
2011 418 33 69 —
2012 — — — —
2013 333 35 67 555
2014 — — — —
2015 — — — —
2016 264 19 54 440
2017 — — — —
2018 — — — —
2019 168 30 49 224
North Slope, Three Corners (Bare Top)
Year n Lambs / 100 ewes Rams / 100 ewes Population estimate
2010 104 56 86 —
2011 72* — — —
2012 52 52 95 87
2013 47 18 65 67
2014 39 50 45 56
2015 44 16 60 63
2016 28 23 92 40
2017 27 67 133 39
2018 31 38 100 44
2019 — — — —
*Incomplete count.
203
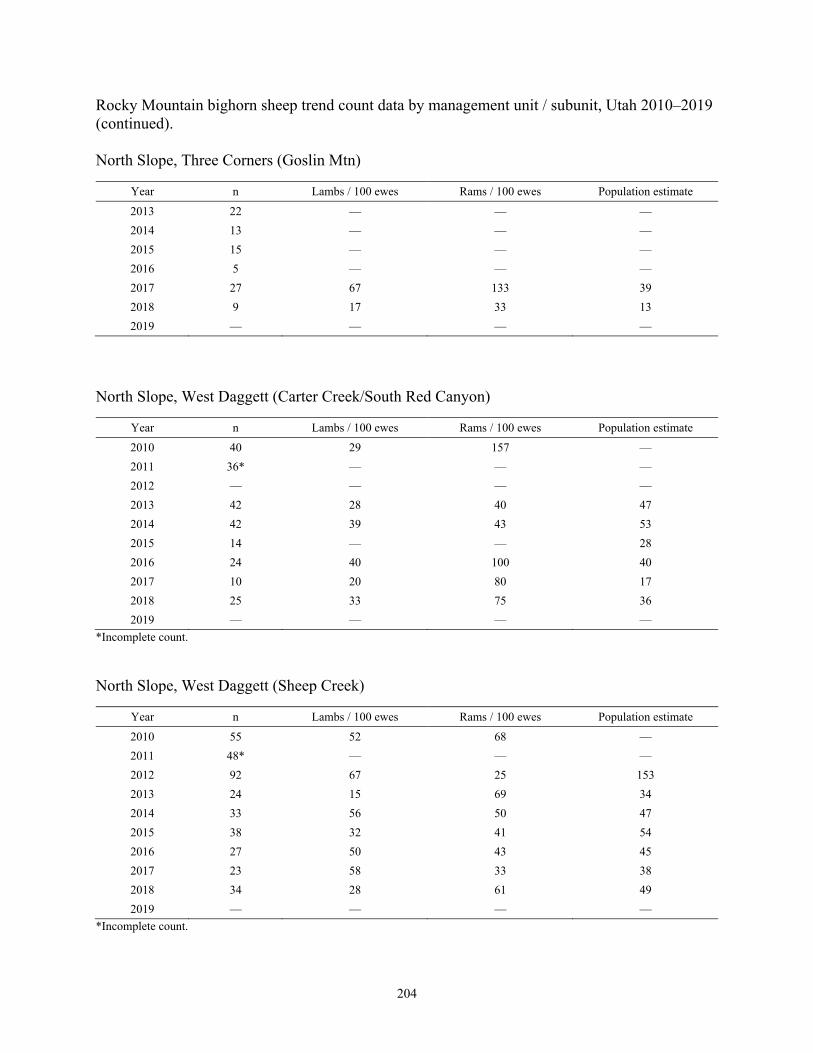
Rocky Mountain bighorn sheep trend count data by management unit / subunit, Utah 2010–2019 (continued). North Slope, Three Corners (Goslin Mtn)
Year n Lambs / 100 ewes Rams / 100 ewes Population estimate
2013 22 — — —
2014 13 — — —
2015 15 — — —
2016 5 — — —
2017 27 67 133 39
2018 9 17 33 13
2019 — — — —
North Slope, West Daggett (Carter Creek/South Red Canyon)
Year n Lambs / 100 ewes Rams / 100 ewes Population estimate
2010 40 29 157 —
2011 36* — — —
2012 — — — —
2013 42 28 40 47
2014 42 39 43 53
2015 14 — — 28
2016 24 40 100 40
2017 10 20 80 17
2018 25 33 75 36
2019 — — — —
*Incomplete count.
North Slope, West Daggett (Sheep Creek)
Year n Lambs / 100 ewes Rams / 100 ewes Population estimate
2010 55 52 68 —
2011 48* — — —
2012 92 67 25 153
2013 24 15 69 34
2014 33 56 50 47
2015 38 32 41 54
2016 27 50 43 45
2017 23 58 33 38
2018 34 28 61 49
2019 — — — —
*Incomplete count.
204

Rocky Mountain bighorn sheep trend count data by management unit / subunit, Utah 2010–2019 (continued). Oquirrh-Stansbury, Stansbury
Year n Lambs / 100 ewes Rams / 100 ewes Population estimate
2010 — — — —
2011 — — — —
2012 163 76 71 217
2013 — — — —
2014 — — — —
2015 140 13 82 233
2016 — — — —
2017 — — — —
2018 — — — —
2019 55 48 41 92
Wasatch Mtns, Avintaquin
Year n Lambs / 100 ewes Rams / 100 ewes Population estimate
2010 — — — —
2011 30 33 33 —
2012 — — — —
2013 55 35 42 73
2014 51 56 48 68
2015 — — — —
2016 — — — —
2017 — — — —
2018 — — — —
2019 — — — —
Wasatch Mtns, West (Provo Peak/Rock Canyon/Timpanogos)
Year n Lambs / 100 ewes Rams / 100 ewes Population estimate
2010 — — — —
2011 — — — —
2012 — — — —
2013 33 27 23 55
2014 — — — —
2015 32 60 53 48
2016 — — — —
2017 — — — —
2018 50 28 45 83
2019 — — — —
205

MOUNTAIN GOAT
206

Statewide trends of mountain goat harvest statistics, Utah 1981–2019.
207

Statewide mountain goat harvest statistics, Utah 1981–2019.
Year Billy
harvest Nanny harvest
Total harvest
Permits Hunters afield
Mean days hunted
Success rate (%)
1981 1 0 1 1 1 2.0 100.0
1982 0 1 1 1 1 2.0 100.0
1983 3 0 3 3 3 4.3 100.0
1984 2 1 3 4 4 4.0 75.0
1985 3 0 3 3 3 5.3 100.0
1986 2 2 4 4 4 6.5 100.0
1987 3 1 4 4 4 3.8 100.0
1988 3 1 4 4 4 3.5 100.0
1989 4 1 5 5 5 3.6 100.0
1990 4 0 4 6 6 4.8 66.7
1991 3 3 6 6 6 7.0 100.0
1992 8 0 8 8 8 5.8 100.0
1993 6 1 7 7 7 4.3 100.0
1994 10 0 10 10 10 — 100.0
1995 10 2 12 12 12 — 100.0
1996 16 2 18 19 19 4.2 94.7
1997 17 2 19 19 19 — 100.0
1998 18 0 18 19 19 3.5 94.7
1999 18 2 20 20 20 — 100.0
2000 19 9 28 29 29 3.2 96.6
2001 21 9 30 30 30 — 100.0
2002 25 10 35 36 36 — 97.2
2003 32 9 41 41 41 2.3 100.0
2004 31 15 46 46 46 2.6 100.0
2005 42 21 63 68 65 3.5 96.9
2006 48 38 86 94 93 3.3 92.5
2007 54 36 91 96 96 3.3 94.8
2008 57 30 88* 95 93 2.9 94.6
2009 77 30 107 108 107 2.8 100.0
2010 70 41 111 115 114 3.0 97.4
2011 91 42 133 143 142 3.4 93.7
2012 94 73 167 175 174 2.6 96.0
2013 87 70 157 170 166 2.7 94.6
2014 74 36 110 115 115 3.1 95.7
2015 77 35 112 118 117 3.2 95.7
2016 63 40 103 106 104 3.8 99.0
2017 64 38 102 111 108 3.5 94.4
2018 79 36 115 127 124 4.3 92.7
2019 86 28 114 130 130 4.8 87.7
*Includes one harvest of unknown sex.
208

Total mountain goat harvest by hunt, Utah 2019.
Unit Hunt
number Hunt name
Billy harvest
Nanny harvest
Total harvest
Permits Hunters afield
Mean days hunted
Success rate (%)
22 GO6800 Beaver 10 0 10 11 11 2.2 90.0
22 GO6801 Beaver 7 2 9 9 9 2.8 100.0
16 GO6803 Central Mtns, Nebo 10 0 10 11 11 5.6 90.0
16 GO6821 Central Mtns, Nebo (archery) 6 1 7 9 9 3.3 77.8
6/7 GO6804 Chalk Creek/Kamas, Uintas 3 8 11 12 12 8.1 90.9
13 GO6817 La Sal, La Sal Mtns 3 0 3 3 3 3.7 100.0
24 GO6814 Mt Dutton 1 1 2 2 2 5.0 100.0
8/9 GO6805 North Slope/South Slope, High Uintas Central 5 4 9 10 10 3.5 90.0
8/9 GO6815 North Slope/South Slope, High Uintas Central (archery) 3 0 3 4 4 6.0 75.0
8/9 GO6806 North Slope/South Slope, High Uintas East 2 0 2 3 3 8.7 66.7
8/9 GO6807 North Slope/South Slope, High Uintas Leidy Peak 3 0 3 3 3 4.7 100.0
8/9 GO6808 North Slope/South Slope, High Uintas West 18 2 20 22 22 5.3 90.5
3 GO6809 Ogden, Willard Peak 1 5 6 8 8 3.0 75.0
3 GO6810 Ogden, Willard Peak 2 2 4 7 7 6.0 57.1
3 GO6811 Ogden, Willard Peak (Female Goat Only) 0 1 1 2 2 13.5 50.0
17 GO6818 Wasatch Mtns, Box Elder Peak 2 0 2 2 2 4.0 100.0
17 GO6819 Wasatch Mtns, Lone Peak 3 0 3 3 3 7.0 100.0
17 GO6813 Wasatch Mtns, Provo Peak 2 0 2 2 2 4.0 100.0
17 GO6820 Wasatch Mtns, Timpanogos 2 2 4 4 4 3.8 100.0
Statewide Sportsman/Conservation 3 0 3 3 3 1.0 100.0
209

Total billy mountain goat harvest* by management unit / subunit, Utah 2010–2019.
Unit Hunt name 2010 2011 2012 2013 2014 2015 2016 2017 2018 2019
22 Beaver 18 24 18 20 20 14 11 13 9 18
16 Central Mtns, Nebo — — — 2 0 1 1 2 10 16
6/7 Chalk Creek/Kamas, Uintas 5 4 3 5 3 5 3 4 5 3
13 La Sal, La Sal Mtns — — — — — — — — 2 3
24 Mt Dutton — — — — — — — 1 1 1
8/9 North Slope/South Slope, High Uintas Central 7 5 11 6 5 9 7 5 9 8
8/9 North Slope/South Slope, High Uintas East 4 2 3 4 3 4 2 3 2 2
8/9 North Slope/South Slope, High Uintas Leidy Peak 3 4 2 1 1 2 1 1 1 3
8/9 North Slope/South Slope, High Uintas West 10 9 17 11 13 21 15 9 14 18
3 Ogden, Willard Peak 16 34 28 34 22 21 18 20 16 3
17 Wasatch Mtns, Box Elder Peak/Lone Peak/Timpanogos** 3 7 10 2 4 4 2 4 0 2
17 Wasatch Mtns, Lone Peak — — — — — — — — 3 3
17 Wasatch Mtns, Provo Peak 2 2 2 2 3 1 3 0 2 2
17 Wasatch Mtns, Timpanogos — — — — — — — — 4 2
Statewide Sportsman/Conservation — — — — — — — 2 1 3
*Harvest taken by statewide sportsman and conservation permit holders were added to the unit where the harvest occurred, when known. Also, some nonresident permit holders were allowed to hunt in multiple units – in this table, harvest is added to the unit where harvest occurred. **Wasatch Mtns, Box Elder Peak subunit only beginning in 2018.
210
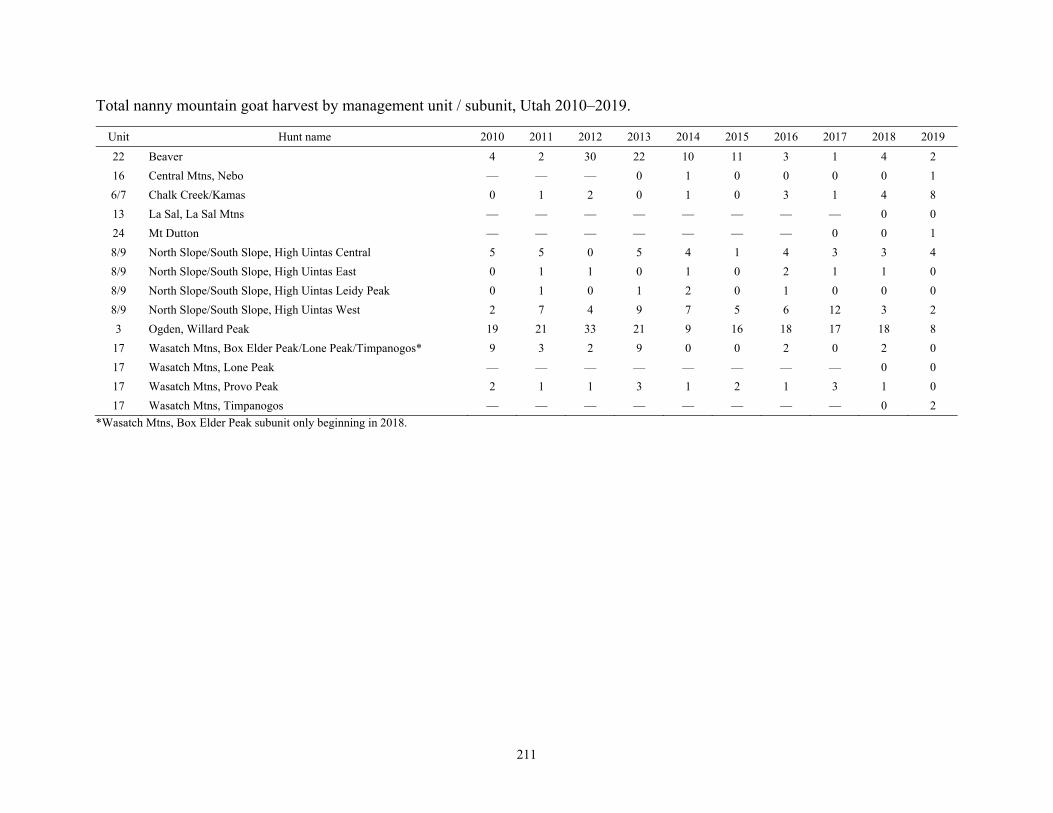
Total nanny mountain goat harvest by management unit / subunit, Utah 2010–2019.
Unit Hunt name 2010 2011 2012 2013 2014 2015 2016 2017 2018 2019
22 Beaver 4 2 30 22 10 11 3 1 4 2
16 Central Mtns, Nebo — — — 0 1 0 0 0 0 1
6/7 Chalk Creek/Kamas 0 1 2 0 1 0 3 1 4 8
13 La Sal, La Sal Mtns — — — — — — — — 0 0
24 Mt Dutton — — — — — — — 0 0 1
8/9 North Slope/South Slope, High Uintas Central 5 5 0 5 4 1 4 3 3 4
8/9 North Slope/South Slope, High Uintas East 0 1 1 0 1 0 2 1 1 0
8/9 North Slope/South Slope, High Uintas Leidy Peak 0 1 0 1 2 0 1 0 0 0
8/9 North Slope/South Slope, High Uintas West 2 7 4 9 7 5 6 12 3 2
3 Ogden, Willard Peak 19 21 33 21 9 16 18 17 18 8
17 Wasatch Mtns, Box Elder Peak/Lone Peak/Timpanogos* 9 3 2 9 0 0 2 0 2 0
17 Wasatch Mtns, Lone Peak — — — — — — — — 0 0
17 Wasatch Mtns, Provo Peak 2 1 1 3 1 2 1 3 1 0
17 Wasatch Mtns, Timpanogos — — — — — — — — 0 2
*Wasatch Mtns, Box Elder Peak subunit only beginning in 2018.
211

Total mountain goat hunters afield by management unit / subunit, Utah 2010–2019.
Unit Hunt name 2010 2011 2012 2013 2014 2015 2016 2017 2018 2019
22 Beaver 22 26 48 45 30 24 14 14 14 20
16 Central Mtns, Nebo — — — 1 1 1 1 3 10 20
6/7 Chalk Creek/Kamas 5 5 5 5 5 5 6 5 9 12
13 La Sal, La Sal Mtns — — — — — — — — 2 3
24 Mt Dutton — — — — — — — 1 1 2
8/9 North Slope/South Slope, High Uintas Central 13 12 11 11 10 11 11 10 13 14
8/9 North Slope/South Slope, High Uintas East 4 4 4 4 4 4 4 4 3 3
8/9 North Slope/South Slope, High Uintas Leidy Peak 3 5 2 2 3 2 2 2 3 3
8/9 North Slope/South Slope, High Uintas West 12 17 21 21 20 22 21 21 18 22
3 Ogden, Willard Peak 36 57 64 59 32 38 36 38 37 17
17 Wasatch Mtns, Box Elder Peak/Lone Peak/Timpanogos* 13 10 13 11 4 4 4 5 3 2
17 Wasatch Mtns, Lone Peak — — — — — — — — 3 3
17 Wasatch Mtns, Provo Peak 4 4 4 5 4 4 4 3 3 2
17 Wasatch Mtns, Timpanogos — — — — — — — — 4 4
Statewide Sportsman/Conservation — 2 3 2 2 2 1 2 1 3
*Wasatch Mtns, Box Elder Peak subunit only beginning in 2018.
212

Average age of harvested mountain goats, by management unit, Utah 2010–2019.
Unit Average age 3-year
average 2010 2011 2012 2013 2014 2015 2016 2017 2018 2019
22 Beaver 4.9 4.9 3.5 5.0 5.1 4.7 4.6 3.9 5.9 4.9 4.9
16 Central Mtns — — 3.0 — 2.0 3.0 — 3.5 5.0 5.0 4.5
6/7 Chalk Creek/Kamas 4.6 6.5 6.3 3.3 5.0 5.3 6.7 2.0 6.3 3.7 4.0
13 La Sal, La Sal Mtns — — — — — — — — 7.0 5.3 6.2
24 Mt Dutton — — — — — — — 2.0 5.0 5.5 4.2
8/9 North Slope/South Slope 4.1 4.7 4.9 4.7 5.4 5.3 5.3 5.0 4.3 4.7 4.7
3 Ogden, Willard Peak 3.7 4.1 3.6 3.9 2.8 3.6 3.7 2.9 3.8 4.3 3.6
17 Wasatch Mtns 7.4 4.0 6.8 4.1 5.4 8.0 2.6 5.4 6.8 4.3 5.5
Statewide average 4.7 4.5 4.3 4.4 4.6 4.6 4.5 4.0 4.9 4.7 4.5
213

Mountain goat trend count data by management unit / subunit, Utah 2010–2019. Beaver
Year n Billies Nannies / Immature males Kids Unclassified
adults
2010 — — — — —
2011 240 — — 42 198
2012 — — — — —
2013 222 — — 56 166
2014 — — — — —
2015 125 — — 27 98
2016 — — — — —
2017 — — — — —
2018 — — — — —
2019 140 — — 27 113
Central Mtns, Loafer Mtn
Year n Billies Nannies / Immature males Kids Unclassified
adults
2012 26 2 14 10 0
2013 — — — — —
2014 19 4 11 4 0
2015 37 4 21 12 0
2016 — — — — —
2017 20 2 10 4 4
2018 — — — — —
2019 — — — — —
Central Mtns, Nebo
Year n Billies Nannies / Immature males Kids Unclassified
adults
2010 — — — — —
2011 — — — — —
2012 22 2 — — 20
2013 — — — — —
2014 20 0 17 3 0
2015 29 7 16 6 0
2016 — — — — —
2017 91 3 52 21 15
2018 128 7 — 37 84
2019 — — — — —
214

Mountain goat trend count data by management unit / subunit, Utah 2010–2019 (continued). Chalk Creek/Kamas
Year n Billies Nannies / Immature males Kids Unclassified
adults
2010 — — — — —
2011 91 — — 14 77
2012 — — — — —
2013 — — — — —
2014 129 — — 15 114
2015 — — — — —
2016 — — — — —
2017 — — — — —
2018 — — — — —
2019 — — — — —
High Uintas fixed-wing flight for production trends (Kamas, North Slope, and South Slope)
Year n Billies Nannies / Immature males Kids Unclassified
adults
2010 124 — — 30 94
2011 — — — — —
2012 — — — — —
2013 — — — — —
2014 — — — — —
2015 — — — — —
2016 — — — — —
2017 — — — — —
2018 — — — — —
2019 108 — — 17 91
North Slope/South Slope, High Uintas Central
Year n Billies Nannies / Immature males Kids Unclassified
adults
2010 — — — — —
2011 197 — — 30 167
2012 — — — — —
2013 — — — — —
2014 206 — — 41 165
2015 — — — — —
2016 — — — — —
2017 — — — — —
2018 — — — — —
2019 — — — — —
215

Mountain goat trend count data by management unit / subunit, Utah 2010–2019 (continued). North Slope/South Slope, High Uintas East
Year n Billies Nannies / Immature males Kids Unclassified
adults
2010 — — — — —
2011 89 — — 8 81
2012 — — — — —
2013 — — — — —
2014 64 — — 4 60
2015 — — — — —
2016 — — — — —
2017 — — — — —
2018 — — — — —
2019 — — — — —
North Slope/South Slope, High Uintas Leidy Peak
Year n Billies Nannies / Immature males Kids Unclassified
adults
2010 — — — — —
2011 41 — — 7 34
2012 — — — — —
2013 — — — — —
2014 44 — — 13 31
2015 — — — — —
2016 — — — — —
2017 — — — — —
2018 — — — — —
2019 — — — — —
North Slope/South Slope, High Uintas West
Year n Billies Nannies / Immature males Kids Unclassified
adults
2010 — — — — —
2011 440 — — 58 382
2012 — — — — —
2013 — — — — —
2014 392 — — 45 347
2015 — — — — —
2016 — — — — —
2017 — — — — —
2018 — — — — —
2019 — — — — —
216

Mountain goat trend count data by management unit / subunit, Utah 2010–2019 (continued). Ogden, Willard Peak
Year n Billies Nannies / Immature males Kids Unclassified
adults
2010 218 — — 57 161
2011 252 — — 63 189
2012 — — — — —
2013 205 — — 47 158
2014 197 — — 50 147
2015 188 — — 74 144
2016 148 — — 34 114
2017 — — — — —
2018 90 — — 20 70
2019 — — — — —
Wasatch Mtns, Box Elder Peak
Year n Billies Nannies / Immature males Kids Unclassified
2010 54 8 36 10 0
2011 — — — — —
2012 30 10 12 6 2
2013 — — — — —
2014 34 0 24 10 0
2015 31 1 20 10 0
2016 — — — — —
2017 36 9 19 8 0
2018 — — — — —
2019 — — — — —
Wasatch Mtns, Lone Peak
Year n Billies Nannies / Immature males Kids Unclassified
adults
2010 67 26 23 17 1
2011 — — — — —
2012 13 9 0 0 4
2013 — — — — —
2014 27 4 14 9 0
2015 41 7 22 12 0
2016 — — — — —
2017 44 7 24 13 0
2018 — — — — —
2019 — — — — —
217

Mountain goat trend count data by management unit / subunit, Utah 2010–2019 (continued). Wasatch Mtns, Provo Peak
Year n Billies Nannies / Immature males Kids Unclassified
2010 104 15 14 25 50
2011 — — — — —
2012 79 5 29 22 23
2013 — — — — —
2014 75 16 19 6 34
2015 76 6 51 19 0
2016 — — — — —
2017 53 4 40 9 0
2018 — — — — —
2019 — — — — —
Wasatch Mtns, Timpanogos
Year n Billies Nannies / Immature males Kids Unclassified
2010 118 15 14 25 50
2011 — — — — —
2012 64 4 19 7 34
2013 — — — — —
2014 76 17 45 14 0
2015 92 16 50 26 0
2016 — — — — —
2017 81 16 44 15 6
2018 — — — — —
2019 — — — — —
218