Ústav fyziky atmosféry av Čr, vvi
TRANSCRIPT

Charles University in Prague
Faculty of Mathematics and Physics
Abstract of Doctoral Thesis
David Hanslian
Wind data analysis
Department of Meteorology and Environment Protection
Supervisor: doc. RNDr. Jaroslava Kalvová, CSc.
Branch of study: 4F8 Meteorology and Climatology
Prague 2014

2

3
Univerzita Karlova v Praze
Matematicko-fyzikální fakulta
Autoreferát dizertační práce
Mgr. David Hanslian
Analýza výsledků měření větru
Katedra meteorologie a ochrany prostředí
Vedoucí disertační práce: doc. RNDr. Jaroslava Kalvová, CSc.
Studijní obor: 4F8 Meteorologie a klimatologie
Praha 2014

4
Dizertační práce byla vypracována na základě výsledků doktorského studia oboru 4F8
Meteorologie a klimatologie na Matematicko-fyzikální fakultě Univerzity Karlovy v
letech 2005 – 2014
Doktorand:
Mgr. David Hanslian
Školitel:
doc. RNDr. Jaroslava Kalvová, CSc.
Školící pracoviště:
Katedra meteorologie a ochrany prostředí MFF UK
V Holešovičkách 2, 180 00 Praha 8
Oponenti:
RNDr. Vít Květoň, CSc.
Český hydrometeorologický ústav
Na Šabatce 17
140 00 Praha 4
RNDr. Radan Huth, DrSc.
Přírodovědecká fakulta UK
Katedra fyzické geografie a geoekologie
Albertov 6
128 43 Praha 2
Autoreferát byl rozeslán dne 8. srpna 2014
Obhajoba dizertační práce se koná 8. září 2014 v 9 hodin, V Holešovičkách 2, Praha 8,
Katedra meteorologie a ochrany prostředí, před komisí pro obhajoby doktorských
dizertačních prací oboru 4F8 Meteorologie a klimatologie.
S dizertační prací je možno se seznámit na studijním oddělení doktorského studia MFF
UK, Ke Karlovu 3, Praha 2.
Předseda Rady doktorského studijního oboru 4F8:
doc. RNDr. Josef Brechler, CSc.
Katedra meteorologie a ochrany prostředí MFF UK
V Holešovičkách 2, Praha 8.

5
Contents
Contents ........................................................................................................................ 5
1. Introduction .............................................................................................................. 6
2. Effects of anemometer siting on measured wind data .............................................. 6
2.1 Small-scale effects ........................................................................................... 7
2.2 Wind measurements above buildings ............................................................ 10
2.3 Effects of surrounding obstacles ................................................................... 12
3. Measure-correlate-predict methods ........................................................................ 14
3.1 Overview of MCP methods ........................................................................... 14
3.2 Author's matrix MCP methods ...................................................................... 17
3.3 Comparison of MCP methods and reference data ......................................... 19
4. Wind climate of the Czech Republic ...................................................................... 24
4.1 General properties of the wind climate ......................................................... 24
4.2 Wind map of the Czech Republic ................................................................. 26
References .................................................................................................................. 31
List of publications ..................................................................................................... 36

6
1. Introduction
With a little hyperbole it can be claimed, that wind is a meteorological variable that
"makes troubles". At first, it is not easy to obtain a precise measurement of wind
conditions. The common sources of measurement errors are low quality or poor design of
measuring equipment, erroneous measurement set-up, insufficient maintenance of
sensors or adverse external conditions (e.g. icing). Another challenge is the measurement
siting. It is often difficult to avoid significant effects of nearby objects on the measured
wind conditions. Finally, the wind data analysis and application are complicated by the
vector nature of wind variable and its high temporal and spatial variability.
The presented thesis attempts to analyze and mitigate some of these issues. Its first
part (Chapter 2) is mainly focused on the undesirable effects of anemometer siting, which
can affect the measured wind data. The second part of the thesis (Chapter 3) deals with
the extension (or completion) of wind data series by measure-correlate-predict (MCP)
methods. The final part (Chapter 4) analyses the wind conditions over the Czech
Republic and the calculation of the wind map of the Czech Republic is described here.
2. Effects of anemometer siting on measured wind data
The requirements on wind data depend on the purpose for which they are used.
While some applications require, in absolute terms, high-accuracy measurement of wind
speed, other applications can accept some uncertainty in this aspect. Some applications
need wind data with high temporal resolution, the other can manage with few
measurements per day. Some applications need the precise wind directions
measurements, the other do not...
Similarly, the requirements on anemometer siting also depend on for which purpose
are the data used for. For example, some microclimatic or air quality applications may
require wind data from the forest clearings or from the sites inside urban areas, sheltered
by nearby buildings. The same positions are, however, unacceptable for many other
applications, which require measurement of "regionally representative" wind conditions
affected by local obstacles as little as possible. In these cases the local effects on the
observed wind conditions are considered as a source of errors and the aim is to avoid
them or to quantify them in order to be able to correct the affected data. But the
application, for which the data are used, should again be taken into account to determine
the acceptable extent of siting effects or their uncertainty. The requirements for basic
meteorological measurements (WMO, 2008, part I/5), that must also consider practical
constraints of wind measurements at meteorological stations, are much less demanding
compared with rigorous requirements for specialized wind mast measurements in wind
energy (IEA, 1999, MEASNET, 2008).

7
2.1 Small-scale effects
The measured wind conditions can be surprisingly strongly affected by wind flow
deformation induced by poor anemometer design and by objects close to the anemometer.
These issues are closely described in IEA (1999) recommendations.
An inevitable obstacle affecting mast measurements of wind profile is the wind mast
itself. This topic has been investigated in multiple studies (e.g. Stickland et al., 2012,
Lindelöw et al., 2010, Orlando et al., 2011 or Farrugia & Sant, 2013). The wind flow is
obviously most disturbed at the wake of the wind mast, but the entire wind field around
wind mast is affected. The wind speed in upwind direction tends to be reduced, whereas
on the sides of the mast the wind speed increases (Figure 1). To reduce these effects
(except the wake effect) under 1 % of ambient wind speed, the anemometer should be
positioned at least approximately 6 mast diameters out of the mast; for reduction of these
effects under 0.5 %, the distance required is 8.5 mast diameters (IEA, 1999). The effects
around porous lattice tower are relatively lower. To avoid the effects of wake behind the
mast, installation of multiple anemometers in different direction is recommended (WMO,
2008, part II/5.3.3). Example of results of wind mast measurement designed this way
(Figure 2) is shown at Figure 3.
Figure 1 Simulated field of average wind speed near the tubular wind mast (wind flows
from the left). The wind speed is shown in relative number against the undisturbed wind.
Source: IEA (1999)

8
Figure 2 Wind mast measurement analyzed at Figure 3. The anemometers are positioned
1.53 m (7.5 mast diameters) out of the wind mast of diameter 20.3 cm.
Figure 3 Ratios between the individual recorded wind speeds at sensors positioned at the
opposite sided of wind mast shown at Figure 2 (1 year of measurement). Only the records
with average wind speed above 2.5 m/s are considered. The shading effect of wind mast
is obvious, the effects in other directions are less pronounced.
The measured wind can be also affected by any other kind of object close to the
recommend the minimum distance of anemometer from the lightning rod at least 50 of
lightning rod diameters and the minimum vertical distance above the horizontal boom at
least 12 of boom diameters (see also an example at Figure 4 and Figure 5).anemometer,
such as antennae, other sensors etc. Even very tiny objects, such as lightning rods or
wires, can influence the measured data if they are close enough. Also horizontal booms
or objects above or behind anemometers can influence the wind flow. For illustration, the
rigorous wind energy standards (IEA, 1999, MEASNET, 2008)

9
Figure 4 Wind mast measurement analyzed at Figure 5, view from southwest. The top
anemometer (40 m) is positioned approximately 40 cm above the mast top and 20 cm
besides the lightning rod. The anemometer 39.5 m (at left) is 1.7 m besides the mast top.
The anemometer 24 m (not shown here) is positioned analogously as anemometer 39.5 m.
The mast diameter is 17 cm and the lightning rod diameter is 0.9 cm, so the 40 m sensor
is only 3 mast diameters above the mast top and 22 diameters of lightning rod besides it,
both markedly under IEA (2008) recommendations.
Figure 5 Ratios between average wind speeds (1 year of measurement) at anemometers
at heights 24 m, 39.5 m and 40 m (see Figure 4). The shading of the top (40 m)
anemometer by lightning rod (directions 310 – 330 °) is stronger than shading of the
other anemometers by wind mast (directions 180 – 190°). The wind speed measured at 40
m anemometer is much higher, than at 39.5 m: detailed wind data analysis revealed, that
the wind speed at 40 m is probably overestimated by 2 % of wind speed by wind speed-up
above the mast top, the rest of the difference between 39.5 m a 40 m can be explained by
other factors.

10
2.2 Wind measurements above buildings
A common practice of wind measurement at manned meteorological stations is
positioning the anemometer above the building. The WMO (2008) standard allows such
position if the anemometer is at height at least one building width above the roof. Such
position ensures, that the measurement is outside the zone of perturbed wind, which
develops close above the roof. However, wind measured this way is affected by wind
speed-up above the building.
It is surprising, how little attention is paid to this issue. Despite the large number of
studies of wind flow around buildings, the only article found by the author of this thesis,
that attempts to quantify the effects of this wind speed-up on anemometer readings, was
published by Landberg (2000). This study is based on the experimental results and
provides a simple guide, how to estimate the magnitude of speed-up by simplified WAsP
model.
Figure 6 The typical manned weather station Kuchařovice. The observed wind climate is
affected by the anemometer position above the rooftop, by the forest behind (its
potentially strong effect is limited by low frequency of wind direction from the forest), by
near-by trees, a wind mast and a parallel anemometer.

11
Figure 7 A schematic drawing of three approaches, how to approximate the weather
station at Figure 6 by orographic elevation.
Height above roof
(above ground)
a) only upper
part
b) only lower
part c) entire height
2 m (9 m) 32.2 % 17.1 % 58.4 %
3 m (10 m) 22.2 % 14.5 % 42.1 %
4 m (11 m) 16.7 % 12.5 % 33.2 %
5 m (12 m) 13.1 % 10.9 % 27.4 %
7 m (14 m) 8.7 % 8.4 % 20.1 %
10 m (17 m) 5.2 % 6.0 % 14.0 %
Table 1 Simulated speed-up over the building of typical weather station depicted at
Figure 6 and Figure 7.
Following the recommendation of Landberg (2000), wind speed-up of wind
measurement above the typical Czech meteorological station (Figure 6) was estimated.
According to it, the building should be represented in WAsP model as a hill with the
same height and slope 1:5. The pyramidal shape of the building was represented by three
alternative approaches (Figure 7), where only the upper part (a), only the lower part (b) or
the entire height (c) of the building was considered.
The results (Table 1) show, that even in the case of the conservative approaches a) or
b), the estimated speed-up is far from negligible. The overestimation of measured wind
speed at these stations can be probably as high as around 20 %! In real cases the effect
will be probably reduced or partially compensated by the occurrence of obstacles around
these stations and the applied approach must be considered as only approximate.
Nevertheless, the result still indicates, that the speed-up is much more serious issue than
has been commonly thought.

12
Similar effects occur when the anemometer is located above the top of other objects,
such as tall wind mast or telecommunication mast. Perrin et al. (2007) calculated, that
speed-up about 1 % can be expected above the top of tubular hollow wind mast even at
height of 5 its diameters. A strict IEA (2008) recommendation expect the 0.5 % speed-up
at height of 8.5 its diameters. This speed-up is also the most probable explanation of the
major part of the difference between the measured wind speeds at sensors 39.5 m and 40
m at Figure 5.
2.3 Effects of surrounding obstacles
The effect of local obstacles can strongly change the wind conditions at a
measurement site. To estimate the magnitude of these effects, high-resolution numerical
or physical simulation can be performed. This is, however, not practical in most cases.
Alternatively, simplified approaches may be applied. Three typical cases can be
specified:
1) The wind measurement is located at generally open site with only limited number
of well defined obstacles (e.g. the measurements on airports or in the agricultural land
with windbreaks). In that case the effects of the individual obstacles can be estimated.
The well known approximate calculation of the wake effect behind the infinitely long
obstacle was performed by Perera (1981) and incorporated into the widely used model
WAsP (Troen & Petersen, 1989 - Figure 8).
Figure 8 The average shading effect (in percent of ambient wind speed) behind non-
porous infinitely long two-dimensional obstacle according to the study of Perera (1981).
In the shaded area the effects strongly depends on the obstacle shape and they cannot be
generalized. Source: Troen & Petersen (1989).

13
It can be observed, that behind the non-porous obstacle more than 10 % reduction of
wind speed can be expected even at the height of two obstacle heights or at the distance
of 40 obstacle heights. In the minimum recommended distance by WMO (2008)
standard, which is 10 obstacle heights, the wind speed reduction can be as high as 50 %
(!) Much larger distance is therefore recommended in wind energy practice (e.g. Brower
et al., 2012). The wind speed reduction is lower for porous obstacles (Troen & Petersen,
1989) and for obstacles of finite widths (Brunskill & Lubitz, 2012).
2) The "obstacles" form a field of large number of elements of similar height and
density. This is typically the case of forest, but the effects of homogeneous urban areas or
many kinds of vegetation formation (vineyards, plantations, bushes etc.) can be similar.
The simplified model of the wind flow above forest assumes that the vertical wind profile
is displaced upwards by a displacement height. This height (and the roughness length of
the displaced surface) depends on the height of the canopy and on its density. In the case
of typical forest it equals about ¾ of the canopy height (Raupach, 1994, Verhoef et al.,
1997). This theory, however, effectively works only high above the forest (the height of 3
forest heights above surface is mostly mentioned, e.g. Harman & Finigan, 2007 or Foken,
2008) and it increases with increasing distance between individual elements (Oke, 2008),
(Figure 9). Below this height the turbulence intensity is increased and wind conditions
are hardly predictable; this areas is called as roughness sublayer. As a result, if the
accurate regionally representative wind information is desired, then wind measurement
inside forests (or urban areas) and even up to some height above their tops should be
avoided, because such data are very difficult to correct reliably.
Figure 9 Schematic drawing of vertical wind profile over dense and sparse forest. The
sparser forest of the same vegetation height lowers the displacement height, however the
roughness length rather increases and the roughness sublayer (shaded) is much thicker.
Source: Dellwik et al. (2004)

14
3) The configuration of obstacles is complex and cannot be described either as a
group of simple individual obstacle or as a homogeneous field of elements. In this case
only a simplified estimation of the wake or the spatial effects can be done and a strong
uncertainty can hardly be avoided.
3. Measure-correlate-predict methods
3.1 Overview of MCP methods
The measure-correlate-predict (MCP) methods are used to simulate the wind
conditions at a target wind data series in the time period when the measured data are not
available. The simulation is based on another (reference) wind data series, which is
homogeneous and covers the period with the target data available as well as the period,
for which the missing target data are simulated. The most typical application of MCP is
the extension of a short-term wind data from a temporary measuring campaign to the
long-term wind conditions at the target site. In a more general sense, the MCP methods
can be applied for other tasks, such as the correction of gaps in the target series or the
estimation of wind conditions in specific occasions or periods.
The minimal length of the "training period", when the concurrent data from both
sites are analyzed, depends on the closeness of the relationship between the series, on the
applied methods and on the required accuracy of the result. For the typical application,
the reference series is obtained at another location or extracted from reanalysis, so that
the data are not closely correlated. In such case one full year of training data is
recommended, in order to cover all seasons and all usual weather patterns.
The simplest MCP methods are the methods of ratios. They are based on the
assumption that the wind speed basically behaves proportionally. This means that the
ratio between the wind speed at the reference and target sites as well as the ratio between
the wind speed in the training and long-term periods are constant. Then the average wind
speed at the target series in the simulated period is calculated as
where is the average wind speed of the reference series in the simulated period,
is the average wind speed of the target series in the training period etc.
This method can be also applied to other characteristics, e.g. to the parameters of
Weibull distribution (Weibull scale method – Clive, 2008). A similar approach is used for
calculation of so-called wind indices, which express the ratio of the average wind speed
(1)

15
or wind energy production of a given time period, such as individual months or years,
against the long-term average (e.g. the BDB-index; www.enveco.de).
The ratios of average wind speeds can be also applied to the individual wind speed
records, thus creating the artificial wind data series. If the ratio between the average wind
speeds at target and reference sites is applied to the reference data, then the artificial wind
data series can be constructed (e.g. Anderson, 2004):
( ) (
)
where vc(Td) a vr(T
d) represent the wind speed of the target and reference series at the
time record Td of the simulated period. This approach, however, does not simulate the
wind speed distribution correctly.
The correct simulation of the wind speed distribution can be achieved by the
calculation of the ratio between the average wind speeds of the simulated and training
periods at the reference series and its application to the target data (Windiness factor
method of King & Hurley, 2004). The simulated data cannot be matched to the individual
time records of the simulated period, so they are labeled as Tx:
( ) (
)
More elaborate kinds of the relationship between the reference and target data are
employed in the other methods. Most common is the application of first-order linear
regression:
( ) (
)
To simulate the wind speed distribution, the linear regression must be supplemented
by the simulation of residuals (e.g. EMD International A/S, 2008).
Various alternative regression approaches have been developed, such as the
SpeedSort or DynaSort methods (King & Hurley (2005, in Carta et al., 2013) or Variance
ratio method (5) (Rogers et al., 2005):
( )
(
) [ (
)
]
For most methods the simulation can be further improved by classification of the
data into groups (bins), that represent typical patterns of relationships between the data.
Most common is grouping the data by the wind direction at the reference site, typically to
12 or 36 directional sectors. The data can be grouped also by e.g. the daytime, season,
atmospheric stability or weather class.
All above mentioned methods are only focused on the simulation of the wind speed.
To simulate the wind direction, a separate method must be applied. A functional
(2)
(3)
(4)
(5)

16
relationship between the wind directions (e.g. Riedel et al., 2001 (in Carta et al., 2013))
or the veer correction (King & Hurley, 2005 (in Carta et al., 2013)) can be employed
(veer is defined as the difference between wind directions at the target and reference
series). Disadvantage of these approaches is the fact, that the joint relationship between
the wind speed and wind direction is not preserved, so that the directional distribution of
the wind speed cannot be simulated this way.
Several methods apply grouping the data into bins by the wind speed at the reference
site. The relation between the target and reference wind speed is calculated individually
for each wind speed bin, which allows simulation of the target wind speed distribution. If
the binning is performed jointly by the wind speed and wind direction, which is the most
common approach, then these methods are called as matrix methods (e.g. Mortimer, 1994
(in Rogers et al., 2005), EMD International A/S, 2008). The wind direction can be
simulated similarly (EMD International A/S, 2008).
The title "matrix method" is also used for another class of methods, which are based
on the identification of joint probabilities pt(kr,kc) of bins defined both by the reference
and by target series. Bins can be determined by wind speed, by wind direction, by other
factors or by combination of them. It is calculated, how does the probability of
occurrence of the individual bins change in response of the change of ( )
( ) occurrence of
involved bins at the reference site between the training and simulated period:
( ) ∑ [ ( ) ( )
( )]
where pd(kc) is the probability of occurrence of bin kc defined by the target data in
simulated period. The definition of bins kc determines the resolution of the result, so that
if the target data are binned by wind speed, then the wind speed distribution is simulated;
if they are binned by wind direction, then the wind rose is simulated. If the target data are
binned both by wind speed and wind direction (Salmon & Walmsley, 1999, García-Rojo,
2004), then the distribution of both variables is simulated, including their joint
relationship.
The average wind speed can be simply derived from the distribution of the wind
speed bins at target series or it can be calculated individually each bin kc. Such approach
was applied (differently) by Harstveit (2004, in Carta et al., 2013) and by Woods &
Watson (1997). They both defined the bins only by wind direction. If the proportional
relationship between wind speeds is applied, then the average wind speed in the
simulated period at the target series inside each bin kc is:
(6)
(1)

17
( )
∑ [ ( ) ( )]
( )
∑ [ ( )
( ) ( )
( )
( ) ( )
]
( )
where ( ) is the average wind speed at the target site in the training period for
the cases, when the data fall jointly into the bins kr and kc at the reference and target
series. Also Moulded site method described by King & Hurley (2004) uses an analogous
principle, although it is not easily obvious.
Alternatively, a conditional probability density functions can be applied instead of
separating data into bins. This method allows a calculation of the continuous wind speed
distribution (Perea et al., 2011, Carta & Velázquez, 2011).
Besides the described types of MCP method, many further alternative approaches
have been described in literature. Frequently mentioned is the employment of artificial
neural networks (e.g. Bilgili et al., 2007, Albrecht & Klesitz, 2007). Two-dimensional
linear regression was proposed by Achberger et al. (2002) or Nielsen et al. (2001, in
Carta et al., 2011), but its performance according to the comparison done by Rogers et al.
(2005) is poor. Also other alternative approaches do not show obvious advantages against
the above mentioned methods.
3.2 Author's matrix MCP methods
The proposed methods, which are simply labeled as Method 1 and Method 2, aim to
remove some essential limitations of both above-described types of matrix methods. The
calculation procedure is similar for both methods. At first all data are separated into bins
k by the reference data and all time records are assigned to appropriate bins. Then every
time record Td of the simulated period is linked with a individual time record T
t of the
training period belonging to the same bin. As a result, a synthetic wind data series is
obtained, which preserves the joint relationship between the wind speed and wind
direction.
Method 1 simply takes the ratio of wind speeds and the difference of wind directions
(wind veer) from the time record Tt are applies it on the reference data of the time record
Td of the same bin k:
( ) (
) [ ( ) (
)]
( ) (
) (
)
( )
(7)
(8)

18
Finally, a correction is applied to the simulated wind speeds, so that the ratio ( )
( )
of
the average wind speed for individual bins is preserved.
Method 2 is principally based on the analysis of joint probability between bins
defined by reference (kc) and by target (kr) series as described by (6) and (7). However, it
includes an improvement and a generalization of this methodology. In the existing
methods (Salmon & Walmsley, 1999, García-Rojo, 2004, Harstveit (2004, in Carta et al.,
2013), Woods & Watson (1997)) the bins kc and kr have been defined and treated equally.
But this is not necessary as bins kr and kc play different roles. Bins kr have the same effect
as the data classification (binning) in other above mentioned methods, while bins kc just
define the resolution of result. The only exception is when the method requires a minimal
amount of training data in "combined" bins (kr, kc) as in the method of Woods & Watson
(1997). Otherwise the dimension of bins kc can be arbitrary and even infinitely small. In
such case every time record of training data can be assigned to one unique bin kc and the
probabilities pd(kc) inside one bin kr are equal. Following (6), this effectively means, that
a random time record Tt from training period, which belongs to the same bin kr, can be
assigned to the simulated record Td. Similarly, the wind speed inside the bin kc (i.e. the
target wind speed vc(Tt) from the assigned time record) can be corrected according to the
(7). As a result, a target series of wind data can be simulated as:
( ) (
)
( ) (
) ( )
( )
(kr is simplified to k).
The appropriate definition of bins k (kr) is fundamental for successful application of
both methods. If the bins are too wide, then the methods are too rough and they lose their
advantages against simpler methods. But high number of sparsely populated bins may
cause increased random errors of individual bins. At the applied algorithm, the basic
classification with large number of small bins is defined first. Then the small bins are
merged, so that finally each applied merged bin contains at least pre-defined number of
training data.
The applied algorithm for both methods includes an optimization, where the time
records inside individual bins k are ranked according to the reference wind speed. Then
the time records Tt with higher reference wind speed are assigned to records T
d with
higher wind speed and vice versa (the overall number and distribution of used time
records Tt inside the bin k is preserved, they are just re-ordered).
(9)

19
3.3 Comparison of MCP methods and reference data
A comparison was performed to verify the applicability of proposed methods and to
compare various types of reference data sources. The wind data from manned weather
stations were used as the target series. The same set of weather station data and the data
from reanalyses were used as the reference series. The time period was limited to the
years 2005-2008 to prevent the possible inhomogeneity and all data were adjusted to
hourly data interval.
To enable multiple calculations for one pair of data series, one year of data was set
up as a training set and the other three years were used for verification. In individual
instances (runs) the training data consisted from 4 sections, each covering 3 consecutive
moths. It was required that as a whole, the training data always covered all seasons. This
way, set of 50 randomly chosen training periods was used in calculation.
The applied set of weather stations is shown at Table 2. All combinations of
reference/target stations were initially calculated, including those, that would not be
applied in practice because of large distance between them. The applied set of reanalysis
data is shown in Table 3. The data from NCEP/NCAR (Kalnay et al., 1996), ERA Interim
(Dee et al., 2011) and MERRA (Rienecker et al., 2011) reanalyses were used.
Table 2 The applied set of weather stations including the distance between them (in km).
The distances over 100 km are written by red, similarly as at Table 4.
To evaluate the model results, six metrics were used: difference of average wind
speeds (h1), difference of average power densities (h2), Kolmogorov-Smirnov integral
(KSI) (Zhang et al., 2013, Boyo & Adeyemi, 2012) of differences between frequency
distributions, corrected for the difference of average wind speed (h3), the average sector-
wise difference of wind direction frequencies (h4), KSI of differences between wind
direction distributions (h5) and the root-mean-square error (RMSE) of individual
simulated records of wind speed (h6). Metrics h1, h2 and h6 were calculated as a
percentage of real average wind speed, metric h2 as a percentage of real average power
density. Out of 50 runs calculated for each test, RMSE (or RMS – root mean square
value), absolute maximal error (absmax) and bias were determined.
alt.[m] Doksany Kopisty B-Tuřany O-Porub. P-Libuš Kuchař. P-Ruzyně Č.Buděj. Cheb Luká K.Mysl. Mileš.
Doksany 158 40 232 294 54 223 40 168 134 219 171 20
Kopisty 240 40 269 334 84 256 67 186 103 258 202 22
Brno-Tuřany 241 232 269 129 188 54 205 164 327 58 92 252
Ostrava-Poruba 242 294 334 129 267 184 282 285 415 89 211 313
Praha-Libuš 300 54 84 188 267 173 17 116 147 185 119 71
Kuchařovice 335 223 256 54 184 173 190 119 298 107 57 242
Praha-Ruzyně 364 40 67 205 282 17 190 128 133 200 135 56
České Budějovice 388 168 186 164 285 116 119 128 194 196 74 181
Cheb 483 134 103 327 415 147 298 133 194 331 242 122
Luká 511 219 258 58 89 185 107 200 196 331 123 238
Kostelní Myslová 563 171 202 92 211 119 57 135 74 242 123 189
Milešovka 833 20 22 252 313 71 242 56 181 122 238 189

20
Table 3 The overview of applied reanalysis data sets..
As a basic setting, the bins were defined by 36 wind directions and by several
unequal intervals of wind speed. The merged bins were required to contain at least 6
records of the training period. An example of simulation of Method 1 under these
conditions is shown at Figure 10.
Figure 10 The example of MCP Method 1 simulation and verification. The target series
is Praha-Ruzyně, the reference series is era_1000w.
Table 4 shows the RMSE of metric h1 (average wind speed) for all calculated
combinations of the reference and target series. It can be concluded, that if the reference
and/or target wind data are measured at sites in lowlands and basins (Doksany, Kopisty,
Brno-Tuřany, Ostrava-Poruba, Cheb), then large errors can be expected. This may be
caused by the fact, that the wind conditions in such sites are frequently isolated from the
shortcut reanalysistemporal
resolution
spatial
resolutionpressure/height level data type
nc_925g NCEP/NCAR 6h 2.5 × 2.5° 925 hPa geostrophic wind
nc_925w NCEP/NCAR 6h 2.5 × 2.5° 925 hPa model wind
nc_850g NCEP/NCAR 6h 2.5 × 2.5° 850 hPa geostrophic wind
nc_850w NCEP/NCAR 6h 2.5 × 2.5° 850 hPa model wind
era_1000g ERA Interim 6h 0.75 × 0.75° 1000 hPa geostrophic wind
era_1000w ERA Interim 6h 0.75 × 0.75° 1000 hPa model wind
era_925g ERA Interim 6h 0.75 × 0.75° 925 hPa geostrophic wind
era_925w ERA Interim 6h 0.75 × 0.75° 925 hPa model wind
era_850g ERA Interim 6h 0.75 × 0.75° 850 hPa geostrophic wind
era_850w ERA Interim 6h 0.75 × 0.75° 850 hPa model wind
me_2m MERRA 1h 0.33 × 0.5° 2 m above ground model wind
me_10m MERRA 1h 0.33 × 0.5° 10 m above ground model wind
me_50m MERRA 1h 0.33 × 0.5° 50 m above ground model wind
me1_850g MERRA 1h 0.33 × 0.5° 850 hPa geostrophic wind
me1_850w MERRA 1h 0.33 × 0.5° 850 hPa model wind

21
large-scale flow patterns due to inversions or local circulation, so that the
interrelationship of local wind conditions to the other wind data series is weak. The
strong orographic deformation of wind flow (Ostrava-Poruba, Kopisty) is an additional
negative factor for reference series (but not for target series).
Table 4: The RMSE of metrics h1 (difference between the average wind speeds) for all
tested combinations of reference and target series. The Method 1 in standard settings
was applied. The highest and lowest 3 values for each target series are highlighted, the
results from pairs of weather stations in the distance of over 100 km are written red.
For open sites, the 1000 hPa wind from ERA reanalysis and the surface wind from
MERRA reanalysis are generally the best reference series. The exception, when the
measured data as reference series are better than reanalyses, is the case when they are
measured at near-by topographically similar sites (Praha-Ruzyně × Praha-Libuš).
The results for metrics h2, h3 and h6 are basically similar. For the wind rose metrics
h4 and h5 also the shape of target site wind rose plays role (the omnidirectional target
wind roses tend to show better results than the wind roses with one or two strongly
prevailing wind directions for both metrics).
Doksany Kopisty B-Tuřan O-Porub P-Libuš Kuchař. P-Ruzyn Č.Buděj. Cheb Luká K.Mysl. Mileš.
Doksany 7.68% 8.97% 5.16% 3.98% 5.27% 4.07% 5.83% 7.97% 5.64% 4.58% 4.11% 5.75%
Kopisty 9.72% 11.29% 6.17% 7.33% 7.87% 7.38% 8.10% 8.64% 9.06% 8.81% 7.20% 8.32%
B-Tuřany 8.51% 6.61% 5.16% 3.73% 2.97% 4.29% 4.43% 4.07% 3.88% 5.71% 3.95% 4.85%
O-Poruba 10.73% 6.41% 7.75% 6.06% 6.40% 6.87% 7.06% 6.69% 7.08% 8.46% 6.26% 7.25%
P-Libuš 5.79% 5.52% 6.12% 3.97% 2.99% 1.27% 3.33% 4.86% 3.90% 4.19% 2.45% 4.04%
Kuchařovice 6.79% 5.65% 5.32% 4.34% 2.55% 3.14% 3.79% 4.77% 3.51% 4.22% 3.33% 4.31%
P-Ruzyně 5.59% 5.36% 6.23% 3.70% 1.11% 2.97% 3.16% 4.90% 3.82% 3.97% 2.16% 3.91%
Č.Buděj. 7.33% 4.91% 5.80% 4.86% 2.27% 3.04% 2.63% 4.35% 3.97% 4.24% 2.66% 4.19%
Cheb 9.64% 5.99% 5.57% 5.66% 4.35% 4.39% 4.92% 4.41% 5.05% 6.55% 4.56% 5.55%
Luká 6.98% 5.74% 5.45% 4.74% 2.51% 2.94% 3.01% 3.81% 4.97% 4.59% 2.77% 4.32%
K.Myslová 5.61% 6.44% 7.36% 4.66% 2.65% 3.28% 2.94% 4.03% 6.95% 3.83% 2.34% 4.55%
Milešovka 7.23% 5.61% 6.83% 3.61% 2.36% 3.08% 2.18% 4.03% 5.39% 4.52% 4.20% 4.46%
nc_925g 6.95% 5.01% 6.36% 4.62% 1.73% 1.62% 1.77% 3.17% 4.75% 3.11% 3.71% 1.38% 3.68%
nc_925w 6.41% 5.10% 6.86% 4.24% 1.83% 2.18% 1.74% 3.17% 5.59% 3.70% 3.53% 1.48% 3.82%
nc_850g 6.64% 5.36% 6.34% 5.05% 1.86% 2.02% 2.05% 3.05% 4.80% 3.09% 4.27% 1.89% 3.87%
nc_850w 6.45% 5.01% 6.86% 4.96% 2.07% 2.01% 2.12% 2.82% 5.75% 3.22% 3.76% 1.52% 3.88%
era_1000g 6.64% 5.83% 5.41% 3.31% 1.56% 1.74% 1.80% 4.13% 5.19% 3.47% 4.12% 1.91% 3.76%
era_1000w 5.92% 5.59% 4.96% 3.23% 1.24% 1.45% 1.11% 3.41% 5.21% 2.49% 3.97% 1.60% 3.35%
era_925g 6.77% 5.03% 5.68% 3.56% 1.40% 1.92% 1.51% 3.76% 5.23% 3.12% 4.05% 1.18% 3.60%
era_925w 6.52% 5.23% 5.87% 3.44% 1.73% 1.97% 1.69% 3.28% 4.89% 2.89% 3.86% 1.32% 3.56%
era_850g 6.50% 4.84% 6.28% 3.83% 1.79% 1.86% 1.86% 2.90% 5.09% 3.46% 4.23% 1.43% 3.67%
era_850w 6.59% 4.57% 6.79% 4.05% 1.92% 2.02% 1.94% 3.41% 5.14% 3.46% 3.87% 1.02% 3.73%
me_2m 6.46% 5.64% 5.67% 3.61% 1.29% 1.71% 1.46% 3.53% 5.02% 2.63% 3.78% 1.43% 3.52%
me_10m 6.51% 5.50% 5.64% 3.54% 1.26% 1.65% 1.37% 2.98% 5.13% 2.55% 3.78% 1.35% 3.44%
me_50m 6.44% 5.51% 5.64% 3.54% 1.25% 1.63% 1.33% 2.81% 5.13% 2.45% 3.67% 1.30% 3.39%
me1_850g 6.96% 5.24% 6.42% 4.05% 2.08% 2.34% 2.04% 3.14% 5.10% 3.95% 3.92% 1.39% 3.89%
me1_850w 6.68% 4.94% 6.54% 4.19% 2.06% 2.00% 2.06% 3.04% 5.68% 3.02% 3.63% 1.24% 3.76%
avg. 7.03% 5.58% 6.46% 4.28% 2.48% 2.85% 2.66% 3.90% 5.42% 3.91% 4.56% 2.48% 4.33%
Null method 11.20% 7.17% 7.58% 5.78% 5.45% 5.22% 6.91% 6.48% 6.59% 6.81% 6.45% 5.41% 6.76%
reference
series
target series
avg.

22
Figure 11 compares the "improvement rate" of RMSE of h1 metrics against the
Pearson correlation coefficient between the individual records of reference and target
series. The improvement rate is a ratio between the RMSE of applied Method 1 and the
Null method, which takes the training data of target series as a simulation result. At the
"improper" reference series from low-lying sites (Doksany, Kopisty, Brno-Tuřany,
Ostrava-Poruba a Cheb), the result is chaotic and improvement is generally poor. In the
other cases, the error is reduced as much as to 20 % for the best correlated series (r >
0.75). For the series with correlation of 0.5-0.6, which is marked as "very poor
correlation" by EMD International (2008), the method still improves the results to 40 –
80 % of RMSE of Null method.
Figure 11 The "improvement rate" of Method 1 vs. the correlation between reference and
target data. The results are differentiated by the reference data source. See text for more
explanation.
The comparison between the author's methods and basic MCP methods (Table 5)
shows that both Method 1 and Method 2 perform well. The accuracy of simulation of the
average wind speed (h1) is similar to the Linear regression (linReg) method (4) and better
than for the Method of ratios (ratios) (1) and the Variance ratio (varRat) method (5). The
results of h2 and h3 metrics for the Linear regression method and the Method of ratios
without simulation of residual are not relevant, because these methods are not designed to
the calculation of the wind speed frequency distribution. Among the other methods, the
Method 1 a Method 2 are much better then the Variance ratio method. On the other hand
the Method 1 and Method 2 are less successful then the simpler methods in simulation of
individual values of wind speed due to their wind variability simulation.
The result also shows that the classification of wind data by wind direction clearly
improves results of all methods. However, it cannot be clearly concluded that the basic
classification to 36 directional sectors improves the result against classification to 12
sectors, because the result depends on other factors (used data, rate of binning by other
factors, merging algorithm, minimum number of training data inside bin etc.).

23
Table 5 The average values of test results for different MCP methods.
Figure 12 shows an example of the wind rose simulation. In this aspect, both Method
1 and Method 2 perform very well.
Figure 12 The example of one individual run of wind rose simulation for the target series
Milešovka (reference series me_10m).
Příloha 2:
h3 (% sp.) h6 (% sp.)
RMSE absmax bias RMSE absmax bias RMS RMS
ratios 1 4.19% 9.13% 0.23% 31.6% 48.6% -17.21% 13.54% 57.4%
ratios 12 4.03% 8.74% 0.61% 26.1% 43.3% -11.19% 10.88% 53.8%
ratios 36 4.08% 8.90% 0.79% 25.8% 43.8% -9.79% 10.65% 53.8%
linReg 1 3.68% 8.10% -0.35% 42.7% 58.9% -41.97% 22.94% 53.8%
linReg 12 3.33% 7.32% -0.16% 34.6% 49.0% -33.90% 18.32% 49.9%
linReg 36 3.28% 7.31% -0.26% 32.9% 47.5% -32.08% 17.45% 49.9%
varRat 1 4.74% 10.37% 1.26% 12.3% 27.8% 0.15% 4.80% 60.4%
varRat 12 4.47% 9.73% 1.71% 12.0% 26.0% 3.46% 4.02% 56.8%
varRat 36 4.60% 9.87% 2.05% 14.2% 29.3% 6.94% 4.04% 57.1%
m1 1 3.58% 7.63% -0.14% 9.8% 22.1% -0.93% 3.24% 74.8%
m1 12 3.36% 7.12% 0.14% 8.8% 19.3% -0.03% 2.91% 69.0%
m1 36 3.32% 7.20% 0.17% 9.1% 19.5% 0.85% 2.91% 68.5%
m2 1 3.58% 7.63% -0.15% 9.9% 22.0% -1.23% 3.27% 74.9%
m2 12 3.37% 7.15% 0.14% 8.8% 19.5% -0.87% 2.94% 69.0%
m2 36 3.32% 7.24% 0.17% 8.8% 20.5% -0.86% 2.92% 68.5%
3.80% 8.23% 0.41% 19.2% 33.1% -9.24% 8.32% 61.2%
6.30% 13.90% -0.87% 20.9% 44.3% -3.40% 5.08% 95.1%Příloha 2:
h2 (% of power density)h1 (% of wind speed)
avg
Null method
method DD

24
The comparison of various settings of the Method 1 and Method 2 was done as well.
It was found, among others, that:
- it is difficult to say, whether an additional classification (binning) by daytime and
season improves the result. Its effect depends on chosen pair of reference/target data
series and on other settings of applied method. In general, an additional classification
rather improves results if the other classifications are less detailed (i.e. number of wind
direction sectors is lower) and if the minimum required number of training data in a
merged bin is lower and vice versa,
- the chosen minimum number of 6 training records in a merged bin (for wind data of
1h time resolution) is close to optimal, but removing the limit (i.e. one training record in
a bin is accepted) or increasing the limit to the minimum of 12 records gives similar
results. Higher number of required records in a merged bin leads to higher errors,
especially if the basic classification is more detailed,
- the optimization of assigning ranked data inside bins generally improves results,
- the correction for ratio of average wind speeds (inside bins) in Method 1 improves
results slightly. Most notably it decreases positive bias of this method, that would
otherwise appear,
- the effect of wind speed correction ( )
( ) in Method 2 is substantial. It improves
results of average wind speed, average power density and frequency distribution. This
improvement effectively indicates the difference between Method 2 and methods of
Salmon & Walmsley (1999) or García-Rojo (2004).
4. Wind climate of the Czech Republic
4.1 General properties of the wind climate
In agreement with Sobíšek (2000), the surface wind climate at any site (not only) in
the Czech Republic can be understood as a result of three factors: geostrophic wind
conditions, regional thermal and radiation effects and topographic effects. These factors
manifest differently in different sites. In open elevated sites the wind conditions are
mostly driven by the wind flow in free atmosphere, while in sites less exposed the local
circulations and effects of local obstacles play important role.
Majority of the studies of the wind climate in the Czech Republic, that were found by
the author of this thesis, focus predominantly to the descriptive analysis of wind
measurements (e.g. Kolektiv autorů, 1958, Sobíšek, 2000, Tolasz et al., 2007 and many
local studies). The general interpretation of measured wind patterns over the area of

25
former Czechoslovakia was performed in a study Petrovič et al. (1969), where the diurnal
and seasonal periodicity of wind speed and wind direction were analyzed. The effort was
also made by Stuchlíka & Křivánkové (1966) and Sobíšek (1969, 1982, 1992, 1995,
2000) to generalize the wind conditions spatially by definition of "wind climatic regions",
based on the prevailing wind directions. However, the design of such areas depends on
the choice of used wind measurements and it cannot capture the complex spatial
variability of wind conditions.
Two specific wind phenomena in the Czech Republic were identified besides the
general pattern of dominant wind flow from western directions. The well known feature
is the episodic regional increase of wind speed from south to south-east directions, which
occurs over wide belt from southeast Moravia across the country up to north Bohemia. It
is related to the streaming of wind through the gap between Alps and Carpathians
(Defant, 1923, Gregor, 1957). As the air stratification is stable, the low-level jet stream
can develop in such situations (Brázdil & Štekl (1986)). Additionally, the foehn wind can
occur at the lee sides of Carpathians in south and east Moravia (Gregor, 1953).
The second notable phenomena is the cold downslope "polák" wind from north to
north-east, occurring over the lee sides of mountains Orlické hory, Jeseníky and in
Moravská brána channel (ČMeS, 2014). It can be probably classified as weak bora wind.
According to the findings of author of this thesis, this feature can be found also in middle
and southeastern Moravia (Figure 13).
Figure 13 The wind rose (1 year of measurement) for a site in mid-southeastern
Moravia, at the southern slopes of mid-Moravian Carpathians. Three prevailing wind
directions can be identified: i) the north-northeastern "polák" wind, intensified here by
the its downslope movement, ii) the south-eastern wind typical for southeast Moravia, iii)
western wind flow, which is relatively weak compared to the Bohemian regions.
26
4.2 Wind map of the Czech Republic
(The wind map described here was created in cooperation between Jiří Hošek and
author of this thesis, with technical help of our colleagues.)
The main purpose of the construction of the "Wind map" is to estimate the wind
conditions over the Czech Republic for needs of possible wind energy utilization. Several
"wind maps" have been therefore constructed in the past 20 years with various level of
success (Hanslian et al., 2012). The actual wind map, described in this thesis, was
calculated as a combination of models VAS/WAsP and PIAP:
The VAS/WAsP model (Hanslian et al., 2012) is a combination of VAS method and
WAsP model. VAS (Sokol & Štekl, 1994) is a method for three-dimensional
interpolation of meteorological variables. If applied to the wind data, this method reflects
the general increase of wind speed with altitude, that can be observed in the Czech
republic. WAsP model (Troen & Petersen, 1989) is the widely used wind resource
assessment model, which enables detailed evaluation of effects of local terrain, roughness
changes and obstacles on wind conditions. The combined VAS/WAsP model consists
from three steps: At first the wind measurements are processed by WAsP to remove the
local effects from measured data and obtain the "generalized wind conditions". Then the
generalized data are interpolated by VAS. Finally, a detailed calculation over the whole
area is performed again by WAsP in order to include the effects of local orography and
roughness. This approach captures both large-scale and microscale effects on wind
conditions. Its performance is, however, limited in microscale due to simplified physics
of the model WAsP, so that the effects of steep or complex orographic features cannot be
well captured. In larger scales the accuracy of VAS/WAsP is limited by lack of flow
modelling, so that its performance depends on the number (and quality) of applied wind
measurements.
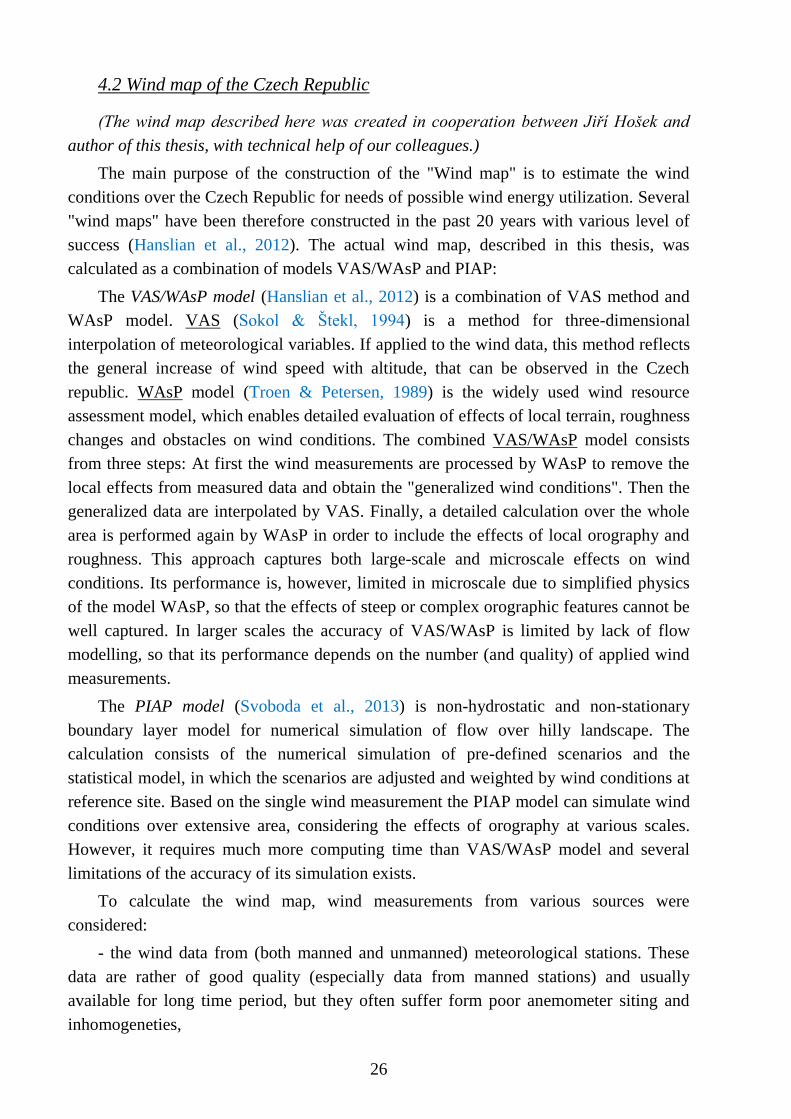
The PIAP model (Svoboda et al., 2013) is non-hydrostatic and non-stationary
boundary layer model for numerical simulation of flow over hilly landscape. The
calculation consists of the numerical simulation of pre-defined scenarios and the
statistical model, in which the scenarios are adjusted and weighted by wind conditions at
reference site. Based on the single wind measurement the PIAP model can simulate wind
conditions over extensive area, considering the effects of orography at various scales.
However, it requires much more computing time than VAS/WAsP model and several
limitations of the accuracy of its simulation exists.
To calculate the wind map, wind measurements from various sources were
considered:
- the wind data from (both manned and unmanned) meteorological stations. These
data are rather of good quality (especially data from manned stations) and usually
available for long time period, but they often suffer form poor anemometer siting and
inhomogeneties,

27
- the wind data from wind masts. They are usually only short-term (1 or 2 years), but
well sited and mostly of good quality,
- the wind measurements at air quality (AIM) measurement network. The data
quality varies, but some of the stations are well sited at areas with no other wind data
available.
The wind data underwent thorough data and measurement site quality control and the
most problematic data records were removed. The MCP Method 2 (see chapter 3.1 for
details) was applied to extend all data to the period 1997-2006.
Finally, 71 wind measurements were applied in calculation of VAS/WAsP model.
Calculation of PIAP model was only based on 5 wind measurements. The CORINE
(Haines-Young et al., 2006) data were used for classification of surface roughness
according to the study of Wieringa (2003). The digital terrain model DMÚ25 was used
for orography description.
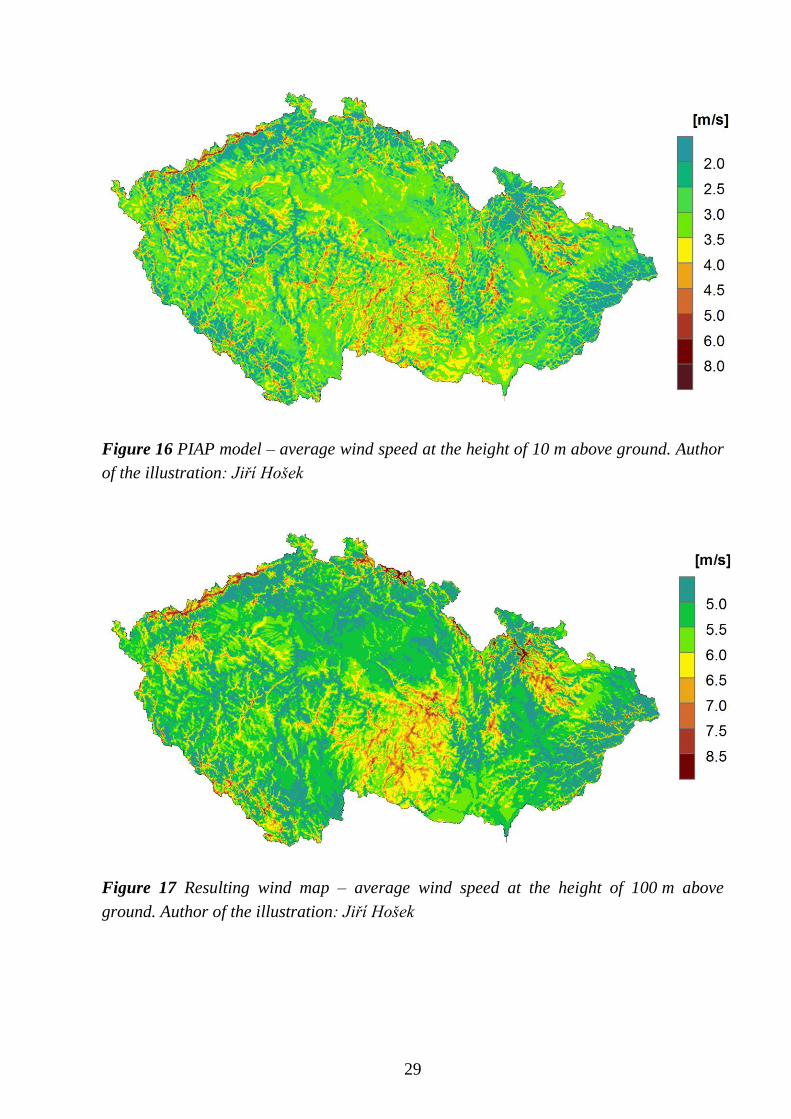
The results of calculation of VAS/WAsP model are shown at Figure 14 and 15, the
result of PIAP calculation is shown in Figure 16. The final result (Figure 17) was simply
calculated as weighted average of VAS/WAsP and PIAP results in the ratio 7 : 3. The
calculation of PIAP was originally performed in a grid with resolution of 600 m, so it had
to be resampled to the 100-meter resolution of VAS/WAsP model. The height above
ground for wind map was set to 100 m, which is the typical height of wind turbines.
According to the final wind map, the highest average wind speed can be expected on
the ridges of Krkonoše and Jeseníky mountains. However, the largest areas with average
wind speeds above 6 m/s that are theoretically suitable for wind power utilization exist
over the highland areas of Krušné hory, Českomoravská vrchovina, Nízký Jeseník and
others.

28
Figure 14 Result of interpolation by the VAS method in the VAS/WAsP model for
roughness length of 0.1 m and height 10 m. Author of the illustration: Jiří Hošek.
Figure 15 VAS/WAsP model – average wind speed at the height of 100 m above ground.
Author of the illustration: Jiří Hošek.
[m/s]
29
Figure 16 PIAP model – average wind speed at the height of 10 m above ground. Author
of the illustration: Jiří Hošek
Figure 17 Resulting wind map – average wind speed at the height of 100 m above
ground. Author of the illustration: Jiří Hošek

30
The accuracy of the wind map was verified by comparison with wind measurements
that were not available at the time of its calculation. These wind data were measured on
wind masts at the heights 35 - 90 m above ground and transformed to the height of 100 m
using WAsP model. They were also extended to the period 1997-2006 by Method 2
(chapter 3.2). As a result, the errors of spatial extrapolation of wind data are fully
considered, while the errors of wind profile simulation by WAsP and long-term
correction are considered only partially.
The result (Table 6) shows, that the RMSE of average wind speed calculation was
0.4 m/s and the simulated wind speeds were positively biased by almost 0.3 m/s. The
most probable main source of the overestimation of simulated wind speed is the position
of wind speed measurement at manned weather stations above roof (see chapter 2.2).
Even though some correction of wind speed at these measurements was applied, it was
probably not sufficient to fully cover the real wind speed-up.
ID altitude z0 RIX
altitude
differences difference against measurement [m/s]
[m] [m] [%] [m] VAS/WAsP PIAP wind map
A 200 0.12 0 -10/100 0,19 -0,27 0,05
B 300 0.08 0 -20/50 0,20 0,37 0,25
C 300 0.10 0.2 -100/50 0,12 -0,19 0,03
D 300 0.09 0 -70/100 0,54 0,83 0,63
E 400 0.12 0.9 -50/50 -0,38 -0,60 -0,44
F 400 0.20 1 -130/130 0,64 -0,18 0,39
G 400 0.24 5.7 -100/50 0,71 0,54 0,66
H 400 0.19 1.4 -120/200 0,10 0,40 0,19
I 500 0.27 0.6 -150/50 0,02 0,63 0,20
J 500 0.28 0.6 -100/50 0,03 0,64 0,21
K 600 0.19 1.8 -200/10 -0,07 1,20 0,31
L 600 0.22 3.9 -150/200 -0,23 1,12 0,18
O 600 0.22 2.1 -200/0 0,53 1,04 0,68
P 700 0.18 2.1 -200/100 0,83 0,09 0,61
Q 700 0.17 0.2 -100/30 0,26 0,97 0,47
R 700 0.35 0.8 -200/130 0,28 -1,01 -0,11
root mean square error (RMSE) 0.41 0.72 0.40
bias 0.24 0.35 0.27
Table 6 Comparison of the average wind speed by VAS/WAsP and PIAP model and by
resulting wind map with the results derived from the independent wind mas
measurements.

31
References
Anderson, M. (2004). A review of MCP techniques. RES Report 01327R00022.
Achberger, C., Ekström, M., & Bärring, L. (2002). Estimation of local near‐surface wind
conditions–a comparison of WASP and regression based techniques. Meteorological
Applications, 9(2), 211-221.
Bilgili, M., Sahin, B., & Yasar, A. (2007). Application of artificial neural networks for
the wind speed prediction of target station using reference stations data. Renewable
Energy, 32(14), 2350-2360.
Boyo, A. O., & Adeyemi, K. A. (2012). Analysis of Solar Radiation data From Satellite
and Nigeria Meteorolocical Station. International Journal of Renewable Energy
Research, 1(4), 314-322.
Brázdil, R., & Štekl, J. (1986). Cirkulační poměry a atmosférické srážky na území ČSSR.
Univerzita J. E. Purkyně, Brno.
Brower, M. C., et al. (2012). Wind resource assessment: a practical guide to developing
a wind project. M. Brower (Ed.). John Wiley & Sons.
Brunskill, A. W., & Lubitz, W. D. (2012). A neural network shelter model for small wind
turbine siting near single obstacles. Wind & Structures, 15(1), 43-64.
Carta, J. A., & Velázquez, S. (2011). A new probabilistic method to estimate the long-
term wind speed characteristics at a potential wind energy conversion site. Energy,
36(5), 2671-2685.
Carta, J. A., Velázquez, S., & Cabrera, P. (2013). A review of measure-correlate-predict
(MCP) methods used to estimate long-term wind characteristics at a target site.
Renewable and Sustainable Energy Reviews, 27, 362–400.
Clive, P. J. (2008). Non-linearity in MCP with Weibull distributed wind speeds. Wind
Engineering, 32(3), 319-323.
ČMeS (2014). Meteorologický slovník terminologický a výkladový. Pracovní elektronická
verze. Cit. 15.2.2014.
Dee, D. P., Uppala, S. M., Simmons, A. J., Berrisford, P., Poli, P., Kobayashi, S., ... &
Vitart, F. (2011). The ERA‐Interim reanalysis: Configuration and performance of the
data assimilation system. Quarterly Journal of the Royal Meteorological Society,
137(656), 553-597.

32
Defant, A. (1924). Die Windverhältnisse in Gebiete der ehemaligen Österr.-ungar.
Monarchie.
Dellwik, E., Landberg, L., & Jensen, N. O. (2004). WAsP in the forest. In: Proceedings of
the European wind energy conference.
EMD International A/S (2008). WindPRO 2.6 User Guide. Aalborg, Denmark. Dostupné
z: http://www.emd.dk/download/UK-WindPRO2.6-manual.pdf.
Enveco GmBH. BDB Index – general information. Dostupné z:
http://enveco.de/enveco.php?lang=en&content=0301. Staženo 15.5.2014.
Farrugia, R. N., & Sant, T. (2013). Modelling wind speeds for cup anemometers mounted
on opposite sides of a lattice tower: A case study. Journal of Wind Engineering and
Industrial Aerodynamics, 115, 173-183.
Foken, T. (2008). Micrometeorology. Springer.
García-Rojo, R. (2004). Algorithm for the estimation of the long-term wind climate at a
meteorological mast using a joint probabilistic approach. Wind Engineering, 28(2),
213-223.
Gregor, A. (1953). Příspěvek k charakteristice "místního" počasí na jižní Moravě.
Meteorologické Zprávy, 6, 53-57.
Gregor, Z. (1957). Orografické deformace jihovýchodního proudění ve střední Evropě.
Meteorologické Zprávy, 10, 3-6.
Haines-Young, R., Weber, J. L., et al. (2006). Land accounts for Europe 1990–2000:
Towards integrated land and ecosystem accounting. EEA, Copenhagen, Denmark.
Hanslian, D., Chládová, Z., Pop, L., & Hošek, J. (2012). Modely pro konstrukci větrných
map v ČR. Meteorologické zprávy, 65(2), 36-44.
Harman, I. N., & Finnigan, J. J. (2007). A simple unified theory for flow in the canopy
and roughness sublayer. Boundary-layer meteorology, 123(2), 339-363.
Harstveit, K. (2004). Estimating long-term wind distributions from short-term data set
using a reference station. In: Proceedings of the European wind energy conference.
IEA (1999). Recommended practices for wind turbine testing and evaluation. Wind speed
measurement and use of cup anemometry.
Kalnay, E., Kanamitsu, M., Kistler, R., Collins, W., Deaven, D., Gandin, L., ... & Joseph,
D. (1996). The NCEP/NCAR 40-year reanalysis

33
King, C., & Hurley, B. (2004). The Moulded Site Data (MSD) wind correlation method;
description and assessment. Wind Engineering, 28(6), 649-666.
King, C., & Hurley, B. (2005). The SpeedSort, DynaSort and Scatter wind correlation
methods. Wind Engineering, 29(3), 217-242.
Kolektiv autorů (1958). Atlas podnebí Československé republiky. Ústřední správa
geodesie a kartografie, Praha.
Landberg, L. (2000). The mast on the house. Wind Energy, 3(3), 113-119.
Lindelöw, P. J. P., Pedersen, F. T., Gottschall, J., Vesth, A., Wagner, R., Paulsen, S. U.,
& Courtney, M. (2010). Flow distortion on boom mounted cup anemometers.
Danmarks Tekniske Universitet, Risø Nationallaboratoriet for Bæredygtig Energi.
MEASNET (2008). Evaluation of site-specific wind conditions. Version 1. Dostupné z:
http://www.measnet.com/wp-content/uploads/2012/04/Measnet_SiteAssessment_V1-
0.pdf
Mortimer, A. A. (1994). A new correlation/prediction method for potential wind farm
sites. In Proceeding of the 16th BWEA wind energy conference.
Nielsen, M., Landberg, L., Mortensen, N. G., Barthelmie, R. J., & Joensen, A. (2001).
Application of the measure-correlate-predict approach for wind resources
assessment. In: Proceedings of the European wind energy conference, 773–776.
Oke, T. R. (2006). Initial guidance to obtain representative meteorological observations
at urban sites. WMO, Instruments and observing methods report No. 81.
Orlando, S., Bale, A., & Johnson, D. A. (2011). Experimental study of the effect of tower
shadow on anemometer readings. Journal of Wind Engineering and Industrial
Aerodynamics, 99(1), 1-6.
Perera, M. D. A. E. S. (1981). Shelter behind two-dimensional solid and porous fences.
Journal of Wind Engineering and Industrial Aerodynamics, 8(1), 93-104.
Perea, A. R., Amezcua, J., & Probst, O. (2011). Validation of three new measure-
correlate-predict models for the long-term prospection of the wind resource. Journal
of Renewable and Sustainable Energy, 3(2).
Perrin, D., McMahon, N., Crane, M., Ruskin, H. J., Crane, L., & Hurley, B. (2007). The
effect of a meteorological tower on its top-mounted anemometer. Applied Energy,
84(4), 413-424.

34
Petrovič, Š., et al. (1969). Podnebí ČSSR. Souborná studie. Hydrometeorologický ústav,
Praha.
Raupach, M. R. (1994). Simplified expressions for vegetation roughness length and zero-
plane displacement as functions of canopy height and area index. Boundary-Layer
Meteorology, 71(1-2), 211-216.
Riedel, V., Strack, M., & Waldl, H. P. (2001). Robust approximation of functional
relationships between meteorological sata: alternative measure-correlate-predict
algorithms. In Proceedings of the European Wind Energy Conference, 806-809.
Rienecker, M. M., Suarez, M. J., Gelaro, R., Todling, R., Bacmeister, J., Liu, E., ... &
Molod, A. (2011). MERRA: NASA''s Modern-Era Retrospective Analysis for
Research and Applications. Journal of Climate, 24(14).
Rogers, A. L., Rogers, J. W., & Manwell, J. F. (2005). Comparison of the performance of
four measure–correlate–predict algorithms. Journal of Wind Engineering and
Industrial Aerodynamics, 93(3), 243-264.
Salmon, J. R., & Walmsley, J. L. (1999). A two-site correlation model for wind speed,
direction and energy estimates. Journal of Wind Engineering and Industrial
Aerodynamics, 79(3), 233-268.
Sobíšek, B. (1969). Reprezentativnost větroměrných údajů meteorologických stanic v
České socialistické republice. In: Sborník prací HMÚ, 14, HMÚ, Praha, 145-182.
Sobíšek, B. (1982). Metodika kvantitativního hodnocení reprezentativnosti
větroměrných údajů získaných ve staniční síti. Meteorologické Zprávy, 35, 103-107.
Sobíšek, B. (1992). Kontrola kvality větroměrných dat ve staniční síti v České republice
v roce 1989. Národní klimatický program, 2, Praha.
Sobíšek, B. (1995). Reprezentativnost větroměrných dat meteorologických stanic v
období 1961-1990. Meteorologické Zprávy, 48, 45-49.
Sobíšek, B. (2000). Rychlost a směr větru na území České republiky v období 1961-
1990. Národní klimatický program, 29, Praha, 86 s.
Sokol, Z. & Štekl, J. (1994). 3-D mesoscale analysis of selected elements from SYNOP
and SYRED reports. Meteorologische Zeitschrift, 3, 242–246.
Svoboda, J., Chladova, Z., Pop, L., & Hosek, J. (2013). Statistical-dynamical
downscaling of wind roses over the Czech Republic. Theoretical and Applied
Climatology, 112(3-4), 713-722.

35
Stickland, M., Scanlon, T., Fabre, S., Oldroyd, A., & Mikkelsen, T. (2012, April).
Measurement and simulation of the flow field around a triangular lattice
meteorological mast. In European Wind Energy Conference.
Stuchlík, F., & Křivánková, H. (1966). Vymezení oblastí s převládajícími směry větru a
rychlostí větru v západní polovině ČSSR, Meteorologické Zprávy, 19, 43-48.
Tolasz, R., Brázdil, R., Bulíř, O., Dobrovolný, P., Dubrovský, M., Hájková, L., ... &
Žalud, Z. (2007). Altas podnebí Česka. Český hydrometeorologický ústav, Universita
Palackého.
Troen, I. E. L. P., & Petersen, E. L. (1989). European wind atlas. Risø National
Laboratory.
Verhoef, A., McNaughton, K. G., & Jacobs, A. F. G. (1997). A parameterization of
momentum roughness length and displacement height for a wide range of canopy
densities. Hydrology and Earth System Sciences Discussions, 1(1), 81-91.
Wieringa, J. (1993). Representative roughness parameters for homogeneous terrain.
Boundary-Layer Meteorology, 63(4), 323-363.
WMO (2008). Guide to Meteorological Instruments and Methods of Observation.
Woods, J. C., & Watson, S. J. (1997). A new matrix method of predicting long-term wind
roses with MCP. Journal of Wind Engineering and Industrial Aerodynamics, 66(2),
85-94.
Zhang, J., Hodge, B. M., Florita, A., Lu, S., Hamann H. F., & Banunarayanan V. (2013).
Metrics for evaluating the accuracy of solar power forecasting. To be presented at
3rd International Workshop on Integration of Solar Power into Power Systems,
London, England.

36
List of publications
(reviewed)
Kolektiv autorů (2010): Větrná energie v České republice: hodnocení prostorových
vztahů, environmentálních aspektů a socioekonomických souvislostí. Ústav Geoniky
AV ČR, Brno, 208 s. ISBN 978 -80 -86407 -84 -5; ; Štekl, J., Hanslian, D., Hošek,
J., Pop, L., & Svoboda, J.: kapitoly 1 a 2, 16-54.
Hanslian, D. (2011). Technický potenciál větrné energie v České republice. Energetika,
61(8-9), 467-471.
Kolektiv autorů (2012): Obnovitelné zdroje energie. Profi Press, Praha, 208 s. ISBN 978-
80-86726-48-9; Hanslian, D.: kapitola Větrné elektrárny, 116-139.
Hanslian D. (2012): Větrné podmínky pro malé větrné elektrárny. TZB-info, 12.3.2012.
http://oze.tzb-info.cz/vetrna-energie/8358-vetrne-podminky-pro-male-vetrne-
elektrarny
Hanslian, D., Chládová, Z., Pop, L., & Hošek, J. (2012). Modely pro konstrukci větrných
map v ČR. Meteorologické zprávy, 65(2), 36-44.
Hanslian, D., Hošek, J., Chládová, Z., & Pop, L. (2013). Větrné podmínky v České
republice ve výšce 10 m nad povrchem I. TZB-info, 15.4.2013. http://oze.tzb-
info.cz/vetrna-energie/9770-vetrne-podminky-v-ceske-republice-ve-vysce-10-m-nad-
povrchem-i
Hanslian, D., Hošek, J., Chládová, Z., & Pop, L. (2013). Větrné podmínky v České
republice ve výšce 10 m nad povrchem II. TZB-info, 22.4.2013. http://oze.tzb-
info.cz/vetrna-energie/9770-vetrne-podminky-v-ceske-republice-ve-vysce-10-m-nad-
povrchem-ii
Hanslian, D., Chládová, Z., Pop, L., & Hošek, J. (2014). Větrná mapa České republiky
ve výšce 100 m nad povrchem. Meteorologické zprávy. [accepted]
Hanslian, D., & Hošek, J. Combining the WAsP model and the VAS 3D interpolation
method to produce a high-resolution wind resource map for the Czech Republic.
Wind Energy. [under review]
Pop, L., Hošek, J., & Hanslian, D. Mapping of extreme wind speed for landscape
modelling of the Bohemian Forest, Czech Republic. Natural Hazards and Earth
System Sciences. [under review]

37
(selected other results)
Hanslian, D., Hošek, J., Chládová, Z., Pop, L., Svoboda, J., & Štekl, J. (2007): Určení
technického potenciálu větrné energie na území České republiky. <Neveřejná
výzkumná zpráva> Ústav fyziky atmosféry AV ČR, Praha, 78p.
Sokol, Z., Štekl, J., Hanslian, D., Hošek, J., & Jež, J. (2007): Časová a prostorová
variabilita rychlostí větru se zřetelem na činnost větrných elektráren. <Neveřejná
výzkumná zpráva> Ústav fyziky atmosféry AV ČR, Praha, 60p.
Hanslian, D., Hošek, J., & Štekl, J. (2008). Odhad realizovatelného potenciálu větrné
energie na území České republiky. Ústav fyziky atmosféry AV ČR, Praha, 32p.
http://www.ufa.cas.cz/vetrna-energie/doc/potencial_ufa.pdf.
Hanslian, D. & Pop, L. (2008). The technical potential of wind energy and a new wind
atlas of the Czech Republic. In: Proceedings of the European wind energy
conference.
Hanslian, D. (2008). Two measure-correlate-predict methods and their performance. In:
Proceedings of the European wind energy conference.
Hošek, J., & Hanslian, D. (2010): Území s dostatečným větrným potenciálem pro
výstavbu větrných elektráren. <Specializovaná mapa s odborným obsahem.>
http://geoportal.gov.cz
Hošek, J., Hanslian, D., Svoboda, J., Chládová, Z., & Pop, L. (2010): Mapa průměrné
rychlosti větru ve 100 m nad zemským povrchem. <Specializovaná mapa s odborným
obsahem.> http://geoportal.gov.cz
Hanslian, D., & Hošek, J. (2012): Aktualizovaný odhad realizovatelného potenciálu
větrné energie z perspektivy roku 2012. Ústav fyziky atmosféry AV ČR, Praha, 23p.