ust alternative inspection program & u.s. energy policy act of
TRANSCRIPT

EI-97150001-0 STATE INNOVATION GRANT PROGRAM
December 29, 2009
UNDERGROUND STORAGE TANKS: ALTERNATIVE INSPECTION PROGRAM AND
THE U.S. ENERGY POLICY ACT OF 2005 FINAL REPORT
Rhode Island Department of Environmental Management Office of Customer and Technical Assistance
235 Promenade Street Providence, RI 02908-5767
(401)222-4700
PREPARED FOR: U.S. ENVIRONMENTAL PROTECTION AGENCY
NATIONAL CENTER FOR ENVIRONMENTAL INNOVATION

ACKNOWLEDGEMENTS This project was carried out by the Rhode Island Department of Environmental Management with technical support from the University of Rhode Island’s (URI) Center for Pollution Prevention and Environmental Health, and Department of Computer Science and Statistics. Authors and Contributors Richard T. Enander, Ph.D. RIDEM Ronald N. Gagnon, P.E., M.B.A. RIDEM Eugene Park, Ph.D. URI/Center for Pollution Prevention R. Choudary Hanumara, Ph.D. URI/Computer Sci. and Statistics Christopher Vallot, RIDEM/Intern Richard Genovesi, URI/Undergraduate Civil Eng. Student Kobayashi Hisanori, URI/Graduate student, Computer Sci. and Statistics Cynthia Souther, URI/Graduate Student, Computer Sci. and Statistics Jennifer Carvalhal, URI/Graduate Student, Computer Sci. and Statistics Kevin Gillen, RIDEM/Office of Waste Management Roberta Dusky, FLDEP/Storage Tank Regulation Michael Redig, FLDEP/RCRA Program
ii

BACKGROUND To prevent leaks and protect groundwater resources, the U.S. Energy Policy Act of 2005 (the Act) requires that state environmental agencies inspect all Underground Storage Tank (UST) facilities at least once every three years. The Act also allows the U.S. Environmental Protection Agency (EPA) to work with a state to study alternative programs and submit a report to Congress. To assist EPA in the preparation of this Congressional report, the Rhode Island Department of Environmental Management (RIDEM) and University of Rhode Island’s Departments of Chemical Engineering (Center for Pollution Prevention and Environmental Health) and Computer Science and Statistics partnered to conduct a study to assess whether an alternative program, the Environmental Results Program (ERP) model, can be as effective or more effective in achieving regulatory compliance, at reduced cost, as traditional facility-by-facility inspection and enforcement programs—the ERP model was first developed by the Massachusetts Department of Environmental Protection in 1997. This work was funded by an EPA National Center for Environmental Innovation State Innovation Grant, EI-97150001-0.
iii

1.0 EXECUTIVE SUMMARY The Environmental Results Program is an integrated, “evidence-based” approach to industry environmental compliance—consisting of regulatory/technical assistance, compliance certification using standardized checklists,1 independent agency inspections, and statistically-based performance measurement. Initially, randomized field inspections are conducted by agency staff to establish baseline compliance rate conditions; i.e., before any state-led intervention is launched. Once independent baseline field data are in, a detailed plain-English guidebook and self-audit checklist package is mailed to each facility in the regulated universe. Facilities are provided a defined time interval to conduct comprehensive self-evaluations, complete audit checklists, and return all certified results to the state—while agency technical expertise and training are provided, it is not unusual for companies to hire outside third-party inspectors to complete the initial self-audit requirement. At the conclusion of the self-audit time period, an additional set of comprehensive, randomized agency field inspections are carried out to assess whether compliance performance improvements have occurred. Criteria established by regulation and beyond compliance measures are then quantitatively assessed using objective on-site field inspection data and accepted statistical techniques. Alternative UST Inspection Program: Rhode Island’s Experience The RI UST alternative inspection grant study was carried out as follows: 96 baseline and 93 post-ERP intervention field inspections (randomly selected from a universe of 608 federally regulated facilities) were conducted by regulatory staff from RIDEM’s Office’s of Waste Management (OWM) and Compliance & Inspection (OC&I) using a standardized inspection checklist. Forty-one (41) checklist indicators were evaluated to determine overall industry compliance at baseline—reflective of Rhode Island’s traditional facility-by-facility inspection and enforcement program that had been in place for more than 15 years at the time baseline inspections occurred (2004)—and post-intervention. Below are major project team (i.e., the RI Department of Environmental Management and University of Rhode Island) findings:
• Comparisons of overall industry compliance at baseline and post-ERP intervention by negative binomial regression analysis found statistically significant improvements in compliance by checklist “category”. Overall, significant improvements in compliance were found for 4 of 5 compliance categories (p-values <.05 for 3 categories; p-value <.10 for 1 category with small sample size); the average observed compliance performance improvement for these four categories ranged from 6% to 38%.
• Using field data from randomly selected facilities, statistically significant
improvements (p-values <.01) in compliance were found for all three EPA Office of Underground Storage Tank (OUST) “Significant Operational Compliance” (SOC)
1 A similar checklist intervention approach is recommended by the World Health Organization (WHO) for use in surgical settings. In a Harvard led study published in the New England Journal of Medicine, investigators found that the WHO self-administered checklist intervention approach—with baseline/post-intervention statistical assessment and technical assistance in the form of written materials, lectures, direct guidance, training, and site visits—was successful at reducing surgical death rates by nearly one-half (P=0.003) and inpatient complications from 11% to 7% (P=0.001). Source: World Health Organization. Implementation Manual Surgical Safety Checklist (2008 First Edition): Safe Surgery Saves Lives. Available at: http://www.who.int/patientsafety/safesurgery/tools_ resources/ SSSL_Manual_finalJun08.pdf; Hayes AB et al. A Surgical Safety Checklist to Reduce Morbidity and Mortality in a Global Population. N Engl J Med. 2009:360(5):491-499.

categories—i.e., release prevention, release detection, and release detection and prevention; observed performance improvements post-intervention, using standardized SOC reporting metrics, ranged from 18 to 22%.
• Statistically significant improvements in performance among ungrouped “individual
compliance indicators” were found subsequent to ERP implementation, as follows: 1) at the 95% confidence level, 12 out of 41 compliance indicators showed statistically significant improvements using the Fisher exact test, 2) after applying the Holm’s modified Bonferroni adjustment for multiple comparisons, 3 of the 12 indicators with p-values <.05 were no longer considered significant, and 3) at the 90% confidence level, 19/41 indicators showed significant improvement. Among 19 additional high performing indicators (i.e., indicators showing compliance levels between 96 and 100% at baseline), no statistically significant decreases in compliance performance were observed post-intervention; that is, high levels of compliance performance were sustained throughout the first ERP cycle.
• A first order analysis of the costs associated with the traditional UST inspection
program in RI was performed and compared with the costs needed to support the alternate ERP approach. Based on 2008 figures, approximately $172,000 is needed annually to fund the traditional program (250 inspections per year). Various ERP models were analyzed where both sample size (100 or 250 inspections) and frequency (every 1-3 years) were combined in five different scenarios. Because of the fewer inspections required for ERP, costs associated with inspections would be reduced for each scenario. Additional expenses to support ERP-related activities (workshops, data gathering, statistical analysis, oversight) are incurred, but the overall costs (reduced inspections and ERP activities) are still lower than that for the traditional program. “Payback” or time to recover ERP start-up costs and realize savings was shown to vary from 0.65 to 1.22 years.
• Interstate Comparative Analysis. Research to compare Rhode Island and Florida
statewide UST compliance rates was undertaken. Although comprehensive “one-to-one, indicator-by-indicator” comparisons could not be achieved due to an inability to “precisely” match recorded UST inspection data (i.e., interstate differences in compliance checklists, recordkeeping and reporting requirements), comparison of 2004 and 2008 “grouped” EPA OUST SOC data showed statistically significance improvements in compliance performance for both RI and FL over time. The percentage of facilities in compliance with SOC “release prevention” requirements, was shown to be similar for both Rhode Island (94 %) and Florida (92%) in the 2008 post-intervention settings—under the assumption that Florida’s data were reflective of statewide facility compliance levels. Although the remaining two SOC categories (release detection, and release detection and prevention) showed significant improvement, point estimates for overall compliance in Rhode Island post-intervention were lower than those shown for Florida. While Florida showed significant improvements of 2-3% across all categories over time, performance improvements in Rhode Island were found to be higher at 18-22%—Rhode Island, however, started from a lower baseline level of compliance. Considering Florida’s extraordinary
2

resources—where 90+% of Florida’s entire UST universe is inspected each year by 139 Department of Health/Environmental Protection and county government staff—and the fact that, unlike Florida, Rhode Island reports noncompliance statistics based on requirements that are more stringent than the federal SOC requirements in the areas of release prevention (operation and maintenance), release detection (testing), tank tightness testing schedule, and leak detection, these findings were both positive and encouraging.
• Study Limitations. Some bias in the results may exist, as the timeframe for the study
bracketed the 2005 Energy Act requirements. Observed performance improvements, however, are believed to be largely attributable to ERP-related activities as data trends cannot be explained solely by the targeted facility inspections conducted pursuant to the US Energy Policy Act of 2005 (i.e., the Act required facilities that had not been inspected since 22 December 1998, to undergo an on-site inspection by 8 August 2007, and subsequently once every 3 years thereafter)—see the “Discussion and Conclusions” section of this report.
• Study Recommendation. Based on the results of this study, we recommend that the
U.S. Energy Policy Act of 2005 be amended to allow relief from Subtitle B Sec.1523 (C)(2)—on-site inspection of each underground storage tank once every 3 years. States should be allowed flexibility to enforce their own inspection requirements if an alternative program provides effective compliance.
While the ERP model was first developed by the Massachusetts Department of Environmental Protection in 1997, Rhode Island was the first other state to adopt this approach and the first to apply it to the UST sector, with EPA funding support. Though these data represent 1st round results only, the weight-of-evidence—from prior ERP implementation experience in Rhode Island2 and the positive results obtained by other states in other industry sectors3—shows that the ERP model compliments existing regulatory structures and can provide a sound alternative to traditional inspection programs. Due to the comprehensive and iterative nature of the UST ERP, we believe that statewide compliance levels will increase over time as facilities become accustomed to the self-audit, certification, and disclosure/reporting components of the program; ultimately, an upper threshold may be reached—as was experienced by Florida in four consecutive annual reports of 85% significant operational compliance for release detection and prevention, FY04-FY07. For those states that are having difficulty in meeting the U.S. Energy
2 See: Enander RT, Gagnon RN, Hanumara RC, Park E, Armstrong T, Gute DM. Environmental Health Practice: Statistically Based Performance Measurement. American Journal of Public Health. 2007. 97(5):819-824; Natalya D, Hanumara RC, Enander RT, Gagnon RN. Statistically Speaking: Use of the Global Test Statistic as a Performance Measurement in a Reanalysis of Environmental Health Data. American Journal of Public Health. 2009. 99(10):1739-1741; Auto Salvage, Auto Body, and Exterior Lead Paint ERP descriptions—Available at: http://www.dem.ri.gov/programs/benviron/assist/index.htm 3 See: ERP States Produce Results 2007 Report: States’ Experience Implementing the Environmental Results Program. U.S. Environmental Protection Agency, National Center for Environmental Innovation. Available at: www.epa.gov/innovation. The increasing interest and growing body of ERP knowledge has led to the creation of the States Environmental Results Program Consortium in October 2006, which now includes a third of all States [Source: States ERP Consortium Fact Sheet, May 2008. Available at: www.erpstates.org].
3

Policy Act 3-yr inspection requirement, for example, a risk-based approach (similar to that recommended by the U.K. Environment Agency in its report Delivering for the environment: a 21st Century approach to regulation4) where high risk facilities requiring more intervention are inspected more frequently and where the ERP model is applied to lower risk facilities may be appropriate. Overall, we believe that the grant’s research findings are positive and should be used by EPA to help inform the upcoming report to Congress that is mandated by the Energy Act and to seek greater state flexibility in the design of UST inspection programs. Richard T. Enander, Ph.D., RIDEM Ronald N. Gagnon, P.E., M.B.A., RIDEM R. Choudary Hanumara, Ph.D., URI Computer Sci. & Statistics Eugene Park, Ph.D., URI Center for Pollution Prevention/Chemical Eng. Dept 4 Available at: http://www.environment-agency.gov.uk/static/documents/Business/delivering_1906007.pdf
4

2.0 RHODE ISLAND’S UST GRANT PROJECT Groundwater contamination with constituents of fuel such as benzene (a known human carcinogen) and methyl tertiary butyl ether (MTBE), has resulted in the impairment of potable water supplies for millions of people nationwide with more than $1 Billion per year spent in state and federal funds.5 In Rhode Island, for example, public water drawn from a well field used to service more than 4,000 people in the village of Pascoag was found to be contaminated with MTBE at levels an order of magnitude higher than the drinking water health advisory of 40 ppb.6 Nationally, more than 418,000 underground storage tank (UST) releases were recorded as of 30 September 2001, while more than 260,000 contaminated sites were investigated and cleaned up.7 To prevent leaks and protect groundwater resources, the Energy Policy Act of 2005 requires that state environmental agencies inspect all USTs at least once every three years. While a key feature of the Act is the assumption that more inspections by state inspectors will prevent further leaks, some states do not have enough inspectors to meet this requirement and have turned to alternate programs—such as 3rd party inspectors—or have experienced difficulty in trying to inspect all tanks on a 3-yr cycle. In response to these concerns, the Act allows the EPA to work with a state to study an alternative program and submit a report to Congress. To assist EPA in the preparation of its Congressional report, the Rhode Island Department of Environmental Management undertook a comprehensive study to assess whether an alternative program—i.e., the Environmental Results Program—can be just as or more effective in achieving regulatory compliance as traditional enforcement programs. Project partners included the University of Rhode Island Chemical Engineering and Computer Science & Statistics Departments, and the Florida Department of Environmental Protection (FLDEP). Rhode Island selected FLDEP as a partner for the interstate comparison component of the study. FLDEP conducts traditional UST facility inspections on a yearly basis and has historical inspection data dating back to 1983. Rhode Island’s UST ERP significant operational compliance measures were matched against corresponding measures from FLDEP’s reports to EPA. 2.1 The Rhode Island UST ERP Program With EPA support, Rhode Island was the 1st state in the country to apply the ERP model to the regulation of underground storage tanks. The Rhode Island program is mandatory and requires facilities to certify to compliance standards using a comprehensive checklist and workbook that were developed by EPA Region I, RI DEM and a large group of external stakeholders over the course of many months. [Note: RIDEM revised the federal UST ERP workbook8 and incorporated state-specific UST requirements, including Stage II vapor recovery.] The UST Sector is the second sector to which RIDEM applied ERP. Across the state, there were 1,910 5 US EPA. Cleaning Up Underground Storage Tank System Releases. Available at: http://www.epa.gov/ swerust1/cat/index.htm 6 RI DEM. Pascoag Water District Environmental Response Plan. Available at: http://www.dem.ri.gov/ programs/benviron/waste/Pascoag/erp.pdf. 7 US EPA. op. cit. 8 The model federal ERP workbook is a tool to help state underground storage tank programs improve owner and operator compliance with UST regulations. The primary audience for the workbook is UST owners and operators who either volunteer or are required to use the workbook to determine whether or not their facilities comply with UST requirements. The 164-page federal workbook contains general information about ERP; instructions on how to use the workbook; regulatory requirements, best management practices, and compliance checklists for USTs; and draft forms and worksheets in the appendices. [Source: EPA’s Office of Underground Storage Tanks website http://www.epa.gov/OUST/pubs/erp.htm.]
5

federally regulated tanks at 608 facilities and approximately 1,500 heating oil tanks, all of which were required to register with RIDEM. To kick-off the ERP project, Rhode Island conducted a series of six stakeholder trainings to educate owner/operators on requirements under the UST ERP. The trainings explained the UST and Stage II regulations as well as the yearly self-certification ERP process that RIDEM was implementing. Independent agency inspections were conducted by RIDEM’s OWM and OC&I pre-(2004) and post-ERP intervention (2007/08) to assess whether any improvements in compliance could be measured using established statistical techniques. RIDEM’s Office of Customer and Technical Assistance (OCTA) led the overall ERP study. 2.2 Environmental Results Program Elements The Environmental Results Program is an innovative approach to improving regulatory compliance and achieving environmental protection. RIDEM adopted a statewide UST ERP as it believed that the integrated model could assist UST system owners and operators in their efforts to understand and comply with UST system regulations. The ERP provides relevant information necessary for owners/operators to understand maintenance and operational requirements pertaining to UST systems, while improving accountability to the public for environmental performance. Key elements of the Rhode Island Environmental Results Program9 are:
• Certification Workbook for Underground Storage Tank Facilities which specifies compliance requirements and best management practices, • Compliance Certification Checklist and Forms Booklet that consists of Self-Audit Checklist (yes/no questions), Certification Statement and Return to Compliance Plan forms required to be completed by the owner/operator. On the Certification Statement form (described below), the UST system owner/operator must certify the current compliance status of the facility and acknowledge that the facility must comply with all applicable environmental laws. The Return to Compliance Plan form is used for compliance problems (identified in the process of filling out the Compliance Certification Checklist) that cannot be corrected prior to submittal of the certification forms. The Return to Compliance Plan describes what steps the facility will take to meet its requirements and when it will return to full compliance, • Independent State Agency Facility Inspections to confirm the accuracy of the self-reported audit results and compliance with the UST system regulations, and • Workshops and Technical Assistance to inform owners and operators of their responsibilities under ERP, available online at www.state.ri.us/dem/programs/ benviron/assist/usterp/index.htm, by phone at (401) 222-2797 or by e-mail by contacting RIDEM’s Office of Customer and Technical Assistance or the Office of Waste Management (regulatory division).
9 Environmental Results Program Certification Workbook for Underground Storage Tanks, December 2004 (rev. 1). Available at: http://www.dem.ri.gov/programs/benviron/assist/usterp/pdf/ustwb04.pdf
6

The submittal of self-audit data to RIDEM is accompanied by a Certification Statement (bullet 2 above) which the owner/operator must sign under penalty of law. The certification language was written and approved by RIDEM and USEPA Region I, and reads as follows:
“I ____________________________________________, as the UST owner(s) attest, 1) That I/we have personally examined and am/are familiar with the information contained in this submittal, including any and all documents accompanying this certification statement; 2) That, based on my/our inquiry of those individuals responsible for obtaining the information, the information contained in this submittal is, to the best of my/our knowledge, true, accurate and complete; 3) That I/we am/are fully authorized to make this attestation on behalf of this facility; 4) That __________________________ is/are the Operator(s) of this facility. I have discussed the division of duties with the operator(s). I understand that the Department of Environmental Management may pursue either the owner, operator or both for any violations of the Rules and Regulations For Underground Storage Facilities Used For Petroleum Products and Hazardous Materials, where owner/operator is mentioned. 5) I/we am/are aware that there are significant penalties for submitting false information. If owner and operator are separate individuals, Operator must also sign: I/we as the operator(s) of the Facility attest that I/we am/are fully authorized by the Facility owner(s) to sign this certification statement. I acknowledge that I am the operator of this facility. I have discussed the division of duties with the owner(s) and clearly understand my/our responsibilities. I/we understand that the Department of Environmental Management may pursue either the owner, operator or both for any violations of the Rules and Regulations For Underground Storage Facilities Used For Petroleum Products and Hazardous Materials, where owner/operator is mentioned. I/we am aware that there are significant penalties for submitting false information, including the possibility of fine and imprisonment for knowing violations.” 10
2.3 Facility Compliance To be in compliance a facility participating in ERP must meet minimum RIDEM requirements for its UST system. Facilities must meet all environmental requirements for each regulated UST system. The UST system requirements include spill, overfill, corrosion protection; release detection; financial responsibility; proper installation, correct operation, maintenance, repair, and testing of each system; controlling, reporting, and remediating releases; reporting and recordkeeping; and temporary and permanent closure. Under state law and in accordance with ERP provisions, owners and operators of one or more UST systems are responsible for preventing and quickly detecting UST system releases—facilities are also responsible for reporting and cleaning up any releases that occur and are held accountable for UST system(s) leaks. The RIDEM ERP is designed to help ensure that regulatory requirements are routinely met and that releases do not occur. 2.4 Agency Compliance and Inspection Program Supported by ERP Rhode Island UST system owners/operators are required to comply with the Rules and Regulations For Underground Storage Facilities Used For Petroleum Products and Hazardous Materials, December 2008. Prior to the U.S. Energy Policy Act of 2005, RI General Law 46-12-30.2 required facility inspections to be conducted once every 2 years. In order to meet this 10 Environmental Results Program Compliance Certification Checklist and Forms Booklet for Underground Storage Tanks, December 2004 (rev. 1). Available at: http://www.dem.ri.gov/programs/benviron/assist/usterp/pdf/ ustcl04.pdf
7

inspection mandate, RIDEM made a policy decision to use the ERP model; due to historic resource constraints, comprehensive inspections of each regulated facility were conducted just once every 6 years. Today, statewide compliance efforts and agency facility inspections, conducted in accordance with the 2005 U.S. Energy Policy Act requirements, are supported by the RI UST Environmental Results Program which requires all registered facilities to complete and submit self-audit/certification checklists and return-to-compliance plan forms on a 3-year cycle.
8

3.0 UST ERP STUDY METHODS The Rhode Island UST ERP collects binary (yes/no), count and descriptive data 1) submitted in the form of self-certification checklist responses and Return-to-Compliance (RTC) plans, and 2) collected during the course of independent baseline and post-ERP implementation facility audits conducted by agency staff. For each registered UST system, operators were required to complete and submit a Compliance Certification Checklist and Certification Statement (and, if required, an RTC form) to RIDEM by June 30, 2005. The Compliance Certification Checklist, Statement, and Return to Compliance Plan forms were included in a Forms Booklet that was mailed to all Rhode Island registered facilities. To determine whether compliance improvements occurred sector-wide, data collected from a statistically predetermined number of randomly selected facilities, inspected at baseline and post-certification, were subjected to statistical analysis. 3.1 Determining Sample Size The total number of baseline and post-intervention field audits that needed to be conducted in order to statistically compare compliance proportions over time was predetermined in accordance with the following equation and as described by Enander et al. in “Environmental Health Practice: Statistically Based Performance Measurement”, American Journal of Public Health. 2007. 2
n = 2 Z 1-β √ P1(1-P1) + P2(1-P2) + Z 1-α √2P (1 - P) Δ
where: P1 = assumed baseline UST compliance rate proportion P2 = assumed post intervention UST compliance rate proportion
Δ = | P1 – P2 | Z 1-α = significance level test statistic Z 1- β = power test statistic
( ) 221 PPP +=
Considering the above equation, available inspection resources and potential study outcomes, we chose a target sample size of n = 100 facilities to be inspected at baseline and post-intervention. Using an alpha level of 5% (α =.05, Z0.95 = 1.645) and power of 80% (Z0.80 = 0.842), in agreement with conventional practice, our goal was to measure a minimum difference (Δ) of 15% performance improvement post-intervention. Alternatively, the EPA ERP Results Analyzer demonstrated that for a difference in proportions of 15%, 2 samples of size n =100 would be sufficient; also, EPA’s ERP Sample Planner for estimating “sample sizes required for a specified margin of error for a difference in proportions (two samples)” showed that for a desired margin of error of ± 12-15% (at the 95% confidence level)—with a universe of 608 UST facilities—a sample size of ~100 in each round of inspections was required.11 Ultimately, we conducted 96 baseline and 93 post-intervention inspections. 11 The most recent versions of the ERP Results Analyzer and ERP Sample Planner, developed by EPA’s National Center for Environmental Innovation, are available at: http://www.epa.gov/erp/toolsandresources.htm.
9

3.2 Collection of Field Data UST baseline (n=96) inspections were conducted April-September 2004 by four RIDEM regulatory staff (Offices of Waste Management and Compliance and Inspection) using the standardized self-certification ERP checklist. In December 2004, ERP self-certification workbooks and checklists were mailed to each registered UST facility (n=608). Six outreach workshops were held in February and March 2005 with 297 people attending. A total of 462 ERP self-certification booklets were returned to RIDEM on time by June 30, 2005. On July 28, 2005 a Notice of Intent to Enforce (NOI) was sent from the UST program to 146 owners/operators (facilities) that had not submitted. The NOI stated that facilities had until August 31, 2005 to submit their self-certification checklists and return-to-compliance plans; as a result, 131 additional self-certification booklets were submitted to RIDEM. In total, 283 facilities ultimately submitted 1,291 RTCs during the 1st round of the UST ERP. More than 30 formal enforcement actions, 100 violations and $300,000 in penalties were assessed for noncompliance with ERP requirements (based on failures to submit self-certification statements and violations discovered during post-intervention inspections). Post-intervention facility inspections (n=93), for statistical comparison with baseline data, were conducted May 2007 through August 2008. Following several meetings with project interns and other team members, baseline and post-intervention field data were entered into ten Excel worksheets. In total, more than 45,000 data points were entered into spreadsheets by URI student interns; each student crosschecked the others data for accuracy and completeness. 3.3 Data Evaluation and Grouping Baseline and post-intervention inspections were conducted by RIDEM regulatory staff using a UST ERP Facility Profile and UST Facility Inspection Report compliance inspection checklist. The checklist contained 118 Y/N regulatory compliance questions (i.e., requiring a return-to-compliance plan for “N” responses) addressing tank corrosion protection, tank leak detection, piping corrosion protection, piping leak detection, spill prevention and overfill protection, spill containment, and groundwater monitoring.12 Data from each of the 118 environmental compliance indicator questions were evaluated and then grouped into three tables according to their expected utility for measuring UST sector performance improvements in future years. First, all potentially measurable indicators were grouped together in one key table. Using analyses by the Fisher Exact test, it was determined that responses to 41 of the original 118 UST compliance checklist questions could be used for future performance measurement purposes—that is, calculations showed that it was mathematically possible to measure statistically significant improvements (if observed) in these variables over time.13 Rather than winnowing down the list of potentially measurable indicators into a smaller number or subset of
12 Available at: http://www.dem.ri.gov/programs/benviron/assist/usterp/pdf/ustcl04.pdf 13 For example, of 9 facilities to which the indicator “E.22 System calibrated and inspected last yr” applied, 44% (p1 = 0.44) were found to be in compliance with the identified regulatory standard at baseline. Trial runs of the Fisher Exact test using an online statistical program (http://www.quantitativeskills.com/sisa/ statistics/fisher.htm), showed that if a second round sample of facility inspections (post-intervention) were to result in a performance improvement of 47% over baseline, for example, then this difference (i.e., increase in compliance) would be statistically significant at the P<.04 level.
10

Environmental Business Practice Indicators (EBPIs),14 all 41 variables were carried forward in the performance measurement calculations. Using readily available software, this approach assured that all areas of noncompliance were identified and statistically characterized. Since indicator variables were not screened out at the beginning of the process, all statistically significant changes in performance could be monitored over time; adjustments for multiple comparisons were made during the analysis. A second table was created for 19 of the 118 indicators that showed 96 to 100% compliance at baseline. Due to high performance at baseline, these indicators could not be used to demonstrate statistically significant improvements in future years—they could be used, however, to evaluate future trends (i.e., whether observed compliance rates were being sustained over time). Further, since most of the identified “performance trend” indicators were technology/equipment driven (i.e., compliant equipment—such as, fill pipes equipped with drop tubes; drop tubes end within 6” of bottom; spill buckets have a minimum of 3 gal. capacity; and CARB hoses certified—were installed prior to baseline audits), statistically significant compliance rate decreases in performance are unlikely to be found in future years. Finally, a third table was created for 24 indicators that were not suitable for measurement purposes either due to small sample size or because the indicators were not applicable to any of the facilities in the random sample at baseline; 34 additional indicators, related to Stage I/II vapor recovery, could not be evaluated further since data were not collected during the post-intervention site inspection phase (even if post-intervention data had been collected, Stage II facility vapor recovery indicators would not have been measurable after 2013 as vehicles will be equipped with onboard vapor recovery equipment). Therefore, only 41 of 118 original checklist questions/indicators (or 35%) had the potential to show statistically significant improvements over time. 3.4 Indicator Hypothesis Testing The Fisher exact probability test was used to test for performance improvements among the 41 potentially measurable indicators. The objective was to determine whether “improvement” over baseline conditions occurred in the post-intervention setting for each compliance variable—hence a one-sided statistical test was chosen and study hypotheses were defined as Ho = no difference in the proportion of facilities in compliance at baseline and post-intervention, and Ha = improvement in compliance post-intervention (see Environmental Health Practice: Statistically Based Performance Measurement, American Journal of Public Health. 2007;97(5):819-824). P values for each indicator variable were calculated and compared to the nominal level of significance of .05 to determine whether statistically significant improvements occurred over time. 3.5 Test for Multiple Comparisons The Holm’s modified Bonferroni adjustment15 for multiple comparisons was applied to 14 EBPIs are “industry-specific performance measures that provide a snapshot of a facility’s environmental performance.” They can be viewed as a subset of measures that have been selected from a larger pool of potentially measurable environmental performance indicators. Source: About the Massachusetts Environmental Results Program, http://www.mass.gov/dep/service/about11.htm 15 Holm, S. A simple sequentially rejective multiple test procedure. Scandinavian Journal of Statistics. 1979. 6:65–70
11

indicators showing significance at the .05 level. This procedure avoids inflation of the Type I error rate and was carried out in two steps:
1) P values were ordered from smallest to largest, and 2) The smallest P value was compared against .05/k followed by comparison of the next
smallest P value against .05/(k-1) and so on, until the largest value was compared to .05 (where k = total number of tests).
3.6 Negative Binomial Regression Analysis To address the contribution of both positive and negative values to overall compliance performance, a negative binomial regression analysis was performed on grouped data for 5 compliance categories: tank corrosion protection, tank leak detection, piping leak detection, spill prevention and overfill protection, and groundwater monitoring and tank pad observation wells. For example, in the category “piping leak detection”, the number of measurable indicators (a1) were at most 11. A facility was designated to be in compliance for a specific indicator if each of the tanks within that facility were in compliance; facilities were in non-compliance if one or more of tanks were non-compliant. Thus, the compliance score (a2) for a facility was “0” (non-compliant on all indicators) to “1” (compliant on all a1 indicators). The analysis of all data on a1 and a2 at baseline and post- intervention was performed using two methods. Since the compliance score on each facility was count data, Poisson regression and negative binomial regression methods were considered to be viable and used. Among these two methods, negative binomial regression analysis was judged to be appropriate based on Aikake Information Criteria (AIC). The p-value for the regression coefficient compared compliance at baseline and post intervention. For example, for the piping leak detection category, the p-value was reported to be .016 (.008 for one-sided tests). 3.7 Interstate Comparison RIDEM partnered with the Florida Department of Environmental Protection to compare UST compliance performance data. Because the FLDEP inspects such a large proportion of its facilities every year (90+% of Florida’s entire UST universe of ~10,000 facilities are inspected each year by 139 Department of Health/Environmental Protection and county government staff), investigators thought that Florida would offer somewhat of a "look into the future" of UST regulation under the Energy Act's current requirements, and serve as a high performing control state for the study; by comparison RIDEM historically inspected <20% of its entire universe of 608 federally regulated facilities using only four inspectors each year. Florida was selected as an early partner for the interstate comparison component of the study due to its success with the traditional approach to UST regulation and availability of statewide UST historical inspection data dating back to 1983. 3.71 Significant Operational Compliance Data Twice each year, states submit comprehensive UST inspection compliance data to EPA’s Office of Underground Storage Tanks. The percentage of facilities in Significant Operational Compliance with release prevention, release detection, and release detection and prevention regulations are reported to OUST at mid-year and year end. OUST defines SOC to mean that the UST systems at a facility have proper equipment/procedures in place, and are being properly
12

operated and maintained in order to detect a release. The OUST “End of Year Activity Reports” describe the reported data sets as follows:
Compliance rates are based on the percentage of inspected facilities found to be in significant operational compliance (SOC) with federal UST requirements over the course of a federal fiscal year. In accordance with EPA guidelines, states are allowed to report based on requirements more stringent than the federal SOC requirements. Furthermore, states have different approaches to targeting inspections. For example, some states focus inspections on suspected non-compliant facilities, while other states conduct random inspections.
Based on how the data were collected, RIDEM found that it was not possible to make statistically valid interstate comparisons of compliance performance over time, using OUSTs “aggregated” SOC data sets since Rhode Island’s data, like most other states, largely represents changing proportions of nonrandom samples over time—i.e., with the exception of ERP data, Rhode Island’s inspections were largely targeted inspections representing a small proportion of the regulated universe in any given year. The % SOC data, therefore, represent those facilities that comprise a target group in each end of year activity report and were not reflective of the universe of facilities as a whole. For example, the US Energy Policy Act required facilities that had not been inspected from 1998 through 2005, to be inspected by August 2007 and Rhode Island focused most of its inspection resources on complying with this requirement. Further, unlike Florida, Rhode Island reports noncompliance statistics based on requirements that are more stringent than the federal SOC requirements in the areas of release prevention (operation and maintenance), release detection (testing), tank tightness testing schedule, and leak detection. Since Florida routinely inspects nearly all instate UST facilities on an annual basis through a decentralized county-based inspection program (i.e., using 139 DOH, DEP and county government staff inspectors), their year end FY reports can be assumed to represent the compliance status of the regulated facilities population (vs. a subset of facilities like Rhode Island). Since direct comparisons between Rhode Island and Florida OUST data, as reported, were not possible, RIDEM focused its efforts on comparing the ERP baseline and post-intervention “random sample data sets” with the census data collected by Florida on an annual basis. This required RIDEM regulatory staff to review historic field inspection checklist data (i.e., for the 96 baseline and 93 post-intervention ERP “random” inspections) and calculate aggregate %SOC scores for the three standard EPA OUST compliance categories: release prevention, release detection, and release detection and prevention. 3.72 Indicator-by-Indicator Comparisons An attempt was made to compare Rhode Island and Florida UST facility compliance inspection checklist data on a one-to-one basis (vs. the aggregated/grouped SOC data analysis discussed above). To investigate interstate differences in compliance performance, RIDEM included in its ERP “alternate inspection approach” study a side-by-side comparison of compliance performance using Florida as a traditional partner state. This effort was initially designed to follow the “comparative/historical approach”—where “EPA would study a State that has already embarked upon its ERP approach (i.e., Rhode Island), and compare its results to results from other control states”—as described in the draft White Paper: Considerations in Studying the Efficacy of the Environmental Results Program (ERP) Approach for Underground Storage
13

Tanks (USTs).16 Although this approach was anticipated to be “perhaps the easiest study approach to implement [in terms of performing interstate comparisons]” it was also viewed as the “most complex analytically” for a number of reasons including that “cross-state data, may not be precisely comparable.” To perform this work, Florida was selected as an early partner for conducting the interstate comparison due to its success with its traditional approach to UST regulation and availability of statewide UST historical inspection data dating back to 1983; as of January 2004, a total of about 400,000 inspections had been completed since 1983. For this part of the study, data for 9,963 UST compliance inspections were extracted from Florida’s combined database of 19,193 UST and AST (aboveground storage tank) inspection reports for 2007. 3.8 Economic Analysis A first order analysis of the costs associated with the traditional (Energy Act-mandated) UST inspection program in RI was performed and compared with the costs needed to support the alternate ERP approach. Various ERP models were assessed where both sample size (100 or 250 inspections) and frequency (every 1-3 years) were combined in five different scenarios. Because of the fewer inspections required for ERP, costs associated with inspections would be reduced for each scenario. Additional expenses to support ERP-related activities (workshops, data gathering, statistical analysis, oversight) and “payback” or time to recover ERP start-up costs and realize savings were also evaluated. All analyses were performed on an annual cost basis. Costs associated with data gathering and analysis occur only once per cycle, so these costs were spread out over the time period of the cycle. Fixed cost items that had to be evaluated included a staff person responsible for collecting and organizing self-certification forms as well as other ERP administrative duties throughout the entire cycle ($20,000/year). When ERP was programmed to include inspections every 2 or 3 years, costs associated with data gathering and analysis in each round were divided accordingly to show costs on a yearly basis and then added to the fixed staff cost of $20,000. For example, if 100 random inspections were conducted every year, the projected cost to support ERP activities would be calculated as $20,000 (staff person) + $X (ERP Manager) + $Y (Intern) + $Z (mailing costs). If the ERP cycle were extended to once every 2 years, the work required to support ERP would cost $40,000 (2 years of staff person) + $X (ERP Manager) + $Y (Intern) + $Z (mailing costs). For the larger sample size of 250, one year cycles were not applicable since 250 inspections/year would be the current, "traditional" program, so analyses for 2 and 3 year cycles are presented using the same approach. The costs to start-up ERP were also evaluated and included workbook development, workshops, etc. Annualized inspection costs were calculated for the different ERP scenarios. The payback was calculated by dividing the net savings of ERP into start-up costs. 3.9 Statistical Analyses for Determinants of Non-compliance Facility and tank-level 2004 baseline data were analyzed using regression analysis for determinants of non-compliance. Telephone and field survey research was conducted by URI student interns to collect additional information on relevant attributes of the 96 previously randomly selected facilities for on-site baseline audits. Of the 96 facilities sampled at baseline,
16 Crow M, Krop R. UST ERP White Paper (1.5) Option 4: Comparative/Historical Approach. Cadmus Group, Inc. 16 August 2005.
14

data on 87 facilities were used in the regression analyses. Additional descriptive data on 9 facilities could not be collected due to site closure, changed operations, or for other reasons. Not all variables (baseline inspection and descriptive data) were recorded at each of the facilities so there were unequal observations. 3.91 Facility-Level Regression Analysis The noncompliance status of each facility was assessed on a number of variables (checks) under the general categories: facility profile, tank profile, tank leak detection, piping leak detection, spill prevention and vapor recovery. For each facility, we compiled data on the number of checks (FY1) and the number of instances of noncompliance (FY2). We were interested to see which regressors (independent variables) explained the noncompliance (dependent variable) status. The average number of checks (FY1) and instances of non-compliance (FY2) were 196.4 and 22.3, respectively. Four regression models to analyze the data on noncompliance and the variable data on facilities were investigated. The independent variables, listed in the results section of this report, and the qualitative descriptive variable data collected by the student interns were introduced as dummy variables in the modeling process. In general, for any qualitative variable with k choices, (k-1) dummy variables were chosen. For tank and facility level analyses, the number of X’s came out to be 20 and 16, respectively. The dependent variables in the first two standard linear regression models were FY3=FY2/FY1 and FY4=Arcsin(FY3**.5). Since the non-compliance data FY2 was count by nature, the subsequent modeling techniques used were Poisson and Negative binomial regression. 3.92 Tank-Level Regression Analysis From the 96 facilities sampled, data on 301 tanks were grouped by category for a number of variables; not all variables were recorded/or applied to each of the tanks so there were unequal observations. The noncompliance status of each tank was assessed using variables (checks) in four broad categories: tank corrosion protection, tank leak detection, piping leak detection, and spill prevention and vapor recovery. The average number of checks (Y1) and instances of noncompliance (Y2) were 41.5 and 5.2 , respectively. Four regression models for the analysis of count data on non-compliance and profile variable data on tanks were investigated. The independent variables were tank age (X1) and tank capacity (X2), and the qualitative variables were as listed in the results section of this report. The qualitative variables were introduced into the model as dummy variables resulting in a total of 20 independent variables used in the model. The dependent variables in the first two regression models were Y3=Y2/Y1 and Y4=Arcsin (Y3**.5), applying standard linear modeling techniques. Since the non-compliance data Y2 were count by nature, subsequent modeling techniques used were Poisson regression and Negative binomial regression.
15

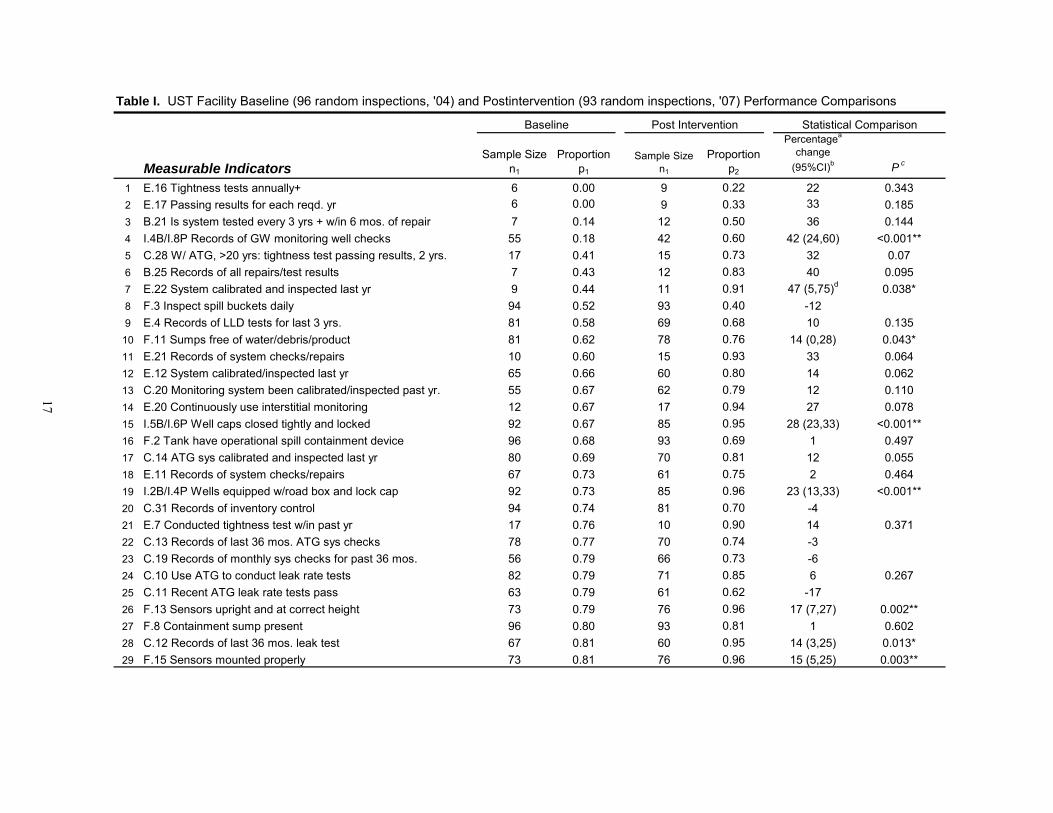
4.0 UST ERP STUDY RESULTS 4.1 Indicator-by-Indicator Analysis Data resulting from the 96 randomized baseline and 93 post-intervention field inspections were organized into three tables as discussed in 3.3 above. The 41 measurable indicators, from the original list of 118 checklist questions, were the primary focus of the statistical analysis component of this study. The Fisher exact probability test was used to test for performance improvements among all 41 indicators—on an indicator-by-indicator basis. The objective was to determine whether “improvement” over baseline conditions occurred in the post-intervention setting for each compliance variable. 4.11 Measurable Indicators and Hypothesis Testing Table I is comprised of eight columns and lists data for the 41 indicators determined to be potentially measurable. The first two columns provide the indicator number and checklist question descriptor (the full checklist question, to which the descriptor relates, can be found at: http://www.dem.ri.gov/programs/benviron/assist/ usterp/pdf/ustcl04.pdf). The next four columns list sample size and compliance proportion data for sampled facilities at baseline (n1, p1) and post-intervention (n2, p2). Data provided in column “n1” under the “Baseline” header, for example, show the total number of UST facilities inspected, and to which the specified regulatory requirement was found to apply, before the ERP initiative was launched; corresponding proportions (p1) for those facilities found to be in compliance at baseline with the relevant indicator is also shown. Though 96 facilities were inspected at baseline, n1 is shown to range from 6 to 96 as regulatory criteria did not uniformly apply to all facilities within the baseline sample—i.e., the applicability of any given regulatory requirement varied according to technology/operations present. More than 75% of the indicators applied to ≥55 of the sampled facilities; in general, as sample size increases, smaller improvements in compliance performance can be detected. The “Percentage Change” column shows the difference in compliance rate proportions for each indicator at baseline and post-intervention levels; the 95% confidence interval for those indicators showing statistically significant improvements—at the .05 level of significance, P value in the final column—is also shown. For hypothesis testing, the Fisher Exact probability test was chosen as many values used in the calculations were relatively small and the Fisher test allowed an exact probability to be calculated for each indicator showing an improvement in performance; the software program at: http://www.quantitativeskills.com/sisa/statistics/ fisher.htm allowed for the rapid calculation of p-values. In addition to checking each of the p-values against the nominal level of significance of .05 to determine which indicators showed improvement, a modified Bonferroni approach was used. This was done to avoid inflation of the overall Type I error rate. Baseline compliance at the sampled facilities ranged from 0 to 95% for the 41 indicators listed in Table I; by comparison, post-ERP intervention compliance ranged from 22 to 100%. In Table I, the median compliance rate proportion at baseline (column p1) is shown to be 76%, indicator number 21 (the second Quartile or 50th percentile); whereas the median for all post-ERP intervention data was 85% (column p2). A comparison between indicators below the median, containing the lowest compliance rate proportions, to those above the median showed that the
16
Measurable IndicatorsSample Size
n1
Proportion p1
Sample Size n1
Proportion p2
Percentagea
change (95%CI)b P c
1 E.16 Tightness tests annually+ 6 0.00 9 0.22 22 0.3432 E.17 Passing results for each reqd. yr 6 0.00 9 0.33 33 0.1853 B.21 Is system tested every 3 yrs + w/in 6 mos. of repair 7 0.14 12 0.50 36 0.1444 I.4B/I.8P Records of GW monitoring well checks 55 0.18 42 0.60 42 (24,60) <0.001**5 C.28 W/ ATG, >20 yrs: tightness test passing results, 2 yrs. 17 0.41 15 0.73 32 0.076 B.25 Records of all repairs/test results 7 0.43 12 0.83 40 0.0957 E.22 System calibrated and inspected last yr 9 0.44 11 0.91 47 (5,75)d 0.038*8 F.3 Inspect spill buckets daily 94 0.52 93 0.40 -129 E.4 Records of LLD tests for last 3 yrs. 81 0.58 69 0.68 10 0.135
10 F.11 Sumps free of water/debris/product 81 0.62 78 0.76 14 (0,28) 0.043*11 E.21 Records of system checks/repairs 10 0.60 15 0.93 33 0.06412 E.12 System calibrated/inspected last yr 65 0.66 60 0.80 14 0.06213 C.20 Monitoring system been calibrated/inspected past yr. 55 0.67 62 0.79 12 0.11014 E.20 Continuously use interstitial monitoring 12 0.67 17 0.94 27 0.07815 I.5B/I.6P Well caps closed tightly and locked 92 0.67 85 0.95 28 (23,33) <0.001**16 F.2 Tank have operational spill containment device 96 0.68 93 0.69 1 0.49717 C.14 ATG sys calibrated and inspected last yr 80 0.69 70 0.81 12 0.05518 E.11 Records of system checks/repairs 67 0.73 61 0.75 2 0.46419 I.2B/I.4P Wells equipped w/road box and lock cap 92 0.73 85 0.96 23 (13,33) <0.001**20 C.31 Records of inventory control 94 0.74 81 0.70 -421 E.7 Conducted tightness test w/in past yr 17 0.76 10 0.90 14 0.37122 C.13 Records of last 36 mos. ATG sys checks 78 0.77 70 0.74 -323 C.19 Records of monthly sys checks for past 36 mos. 56 0.79 66 0.73 -624 C.10 Use ATG to conduct leak rate tests 82 0.79 71 0.85 6 0.26725 C.11 Recent ATG leak rate tests pass 63 0.79 61 0.62 -1726 F.13 Sensors upright and at correct height 73 0.79 76 0.96 17 (7,27) 0.002**27 F.8 Containment sump present 96 0.80 93 0.81 1 0.60228 C.12 Records of last 36 mos. leak test 67 0.81 60 0.95 14 (3,25) 0.013*29 F.15 Sensors mounted properly 73 0.81 76 0.96 15 (5,25) 0.003**
Statistical ComparisonBaseline Post Intervention
Table I. UST Facility Baseline (96 random inspections, '04) and Postintervention (93 random inspections, '07) Performance Comparisons
17

1
Table I. Continued
NOTES: CI = Confidence Interval; n = number of facilities in sample; p1 = no. of facilities; B=Basline; P=Postinterventionin compliance at baseline/number of facilities in the sample; p2 = no. of facilities in compliance postintervention/number of facilites in the sample; For all n cells, counted facility if one or more "Y's" or "N's" recorded. For all p cells, counted facility as in compliance only if one or more "Y's" recorded and no "N's". aCalculated as 100(p2 – p1).
Sample Size n1
Proportion p1
Sample Size n1
Proportion p2
Percentage change (95%CI) P
30 C.30 Perform inventory control properly 91 0.81 81 0.77 -431 F.12 Sumps have sensors 82 0.82 78 0.97 15 (6,24) 0.001**32 F.19 Qualified UST contractor check device 87 0.84 90 0.98 14 (6,22) 0.001**33 I.3B/I.5P Wells equipped w/ pipe not screened at top 91 0.85 85 0.95 10 (1,19) 0.017**34 C.26 W/ ATG, <20 yrs: tightness test passing results 22 0.86 14 1.00 14 0.21635 E.1 Leak detection method in place for each run 93 0.91 85 0.98 7 0.06736 C.7 Leak detection system operating properly 93 0.92 90 0.94 2 0.40637 F.14 Sensors functioning properly 72 0.93 76 0.95 2 0.46638 F.6 Fill pipes/box covers labeled/marked 96 0.94 93 0.94 039 E.10 Interstitial monitoring for leaks 71 0.94 61 0.97 3 0.41540 F.17 Secondary piping test boot disconnected 75 0.95 75 0.95 041 I.6B/I.7P Are any well caps submerged under water 91 0.95 85 1.00 5 (3,7) 0.035**
b95% CIs calculated for indicators showing statistical significance at α= .05; 95% CIs calculated as (p2–p1) ± 1.96×squareroot [p1(1.00 – p1) / n1 + p2(1.00 – p2) / n2].cP values were calculated with the Fisher exact test online, available at http://www.quantitativeskills.com/sisa/statistics/fisher.htm; dDue to small sample size, computation of the confidence interval on the difference of proportions for E.22 followedAgresti A and Caffo B (2000), American Statistician, pages 280-288.P values calculated only for performance indicators showing improvement (1-tailed test).*Statistically significant at the .05 (95%) confidence level without an adjustment for multiple comparisons**P value = Holm's-modified Bonferroni adjustment for multiple comparisons calculated on a category by category basis (i.e.,B,C , and I)
Statistical ComparisonBaseline Post Intervention
,E,F
18

indicators in the lower half of the data set related predominantly to periodic equipment testing/calibration, recordkeeping and inspection requirements, whereas those in the upper half are weighted more toward technology and operational requirements, along with some recordkeeping/inspection requirements—compliance rate proportions for these indicators range from 77 to 95%. Statistically significant improvements in performance among the 41 ungrouped “individual compliance indicators” were found subsequent to ERP implementation, as follows: 1) at the 95% confidence level, 12 out of 41 (29%) compliance indicators showed statistically significant improvements using the Fisher exact test, 2) after applying the Holm’s modified Bonferroni adjustment for multiple comparisons, 3 of the 12 indicators with p-values <.05 were no longer considered significant, 3) at the 90% confidence level, 19/41 (46%) indicators showed significant improvement (Table I). For 6 of the 41 measurable indicators, the change was negative, as reported in Table I. Of these 6, only two (F3 and C11) showed a large negative change—i.e., >10%; small changes of 4 or 6% are to be expected. Since our objective in the UST ERP intervention study was to test for improvement in the post-intervention setting—i.e., improvement over baseline conditions—we conducted a one-sided statistical test and defined the study hypotheses for testing as: Ho = no difference in the proportion of facilities in compliance at baseline and post-intervention, and Ha = improvement in compliance post-intervention. In a two-sided test, investigators look for changes in any direction which was not our objective in the original study design and therefore the magnitude of the 2 negative changes were not evaluated. To address the contribution of both positive and negative values to overall compliance performance, a negative binomial regression analysis was performed as discussed in 3.6 above. Finally, it should be noted that all of the performance improvement measures (p2 - p1) listed in Table I are observed values resulting from small samples. Different sets of randomly drawn samples of equal size would be expected to produce values different from those given in the “Percentage Change” column. The calculation of an 95% Upper and Lower Confidence Limit (UCL, LCL), therefore, provides an interval within which one would expect the true difference (P2 – P1) in industry performance to lie (i.e., with only a 1 in 20 chance that the true difference would be found outside this range). Thus the confidence intervals make it easier to recognize the differences that are too small to be of statistical significance. Confidence limits for all statistically significant results are given. 4.12 Performance Trend Indicators Table II lists 19 indicators that showed 96 to 100% compliance at baseline and, due to sample size or high performance at baseline, cannot be used to demonstrate statistically significant improvements in future years—these indicators may be used, however, to evaluate future trends (i.e., whether observed compliance rates are being sustained over time). Further, since most of the Table II indicators are technology/equipment driven (i.e., compliant equipment—such as, tank equipped with submerged fill drop tube, boots sealed to prevent infiltration—was installed prior to baseline audits), statistically significant compliance rate decreases in performance are unlikely to be found in future years; minor variations in performance (“Percentage Change” column) of -3 or +4%, as shown, are to be expected. Table III lists 24 indicators that are not suitable for measurement purposes either due to small sample size (n=2/3) or because they did not apply to any of the facilities in the random sample at baseline.
19

Table II. UST Facility Baseline (96 random inspections, '04) and Postintervention (93 random inspections, '07) Comparisons
Performance Trend IndicatorsSample Size
n1
Proportion p1
Sample Size n1
Proportion p2
Percentage changea
1 F.24 Device set to shutoff at 90% full 24 0.96 50 1.00 42 C.1 Have leak detection in place for each tank 89 0.97 91 0.99 23 D.1 Corrosion protection for piping (each tank) 93 0.97 92 0.97 04 C.18 Continuously use interstial monitoring for leaks 63 0.97 68 0.94 -35 B.1 Corrosion protection for each tank 90 0.98 92 1.00 26 C.33 Measure water in tank once every 30 dys 94 0.98 82 0.96 -27 F.7 Tank equipped w/ submerged fill drop tube 96 0.98 93 0.97 -18 F.16 Boots sealed to prevent infiltration 80 0.99 78 1.00 19 F.18 Properly operating overfill protection 96 0.99 94 0.99 0
10 B.10 Cathodic protection system operate continuously 7 1.00 2 1.00 011 B.20 Cathodic protection operate continuosly 8 1.00 12 1.00 012 B.24 System pass most recent test 5 1.00 11 1.00 013 C.32 Measuring equip. nearest 1/8th" over tank height 94 1.00 82 0.99 -114 F.1 Tank fill equipped w/ spill containment 96 1.00 94 1.00 015 F.21/F.24 Device set for 95% full 19 1.00 50 1.00 016 F.22 Alarm audible/visible to delivery person 23 1.00 29 1.00 017 F.26 Set to restrict flow when tank 90% full 61 1.00 53 1.00 018 F.4 Spill bucket surrounded by impervious surface 94 1.00 30 1.00 019 F.5 Spill bucket capacity >=3 gal. 96 1.00 93 1.00 0
NOTES: n = number of facilities in sample; p1 = no. of facilities in compliance at baseline/number of facilities in the sample; p2 = no. of facilities in compliance postintervention/number of facilites in the sample; For all n cells, counted facility if one or more "Y's" or "N's" recorded. For all p cells, counted facility as in compliance only if one or more "Y's" recorded and no "N's". aCalculated as 100(p2 – p1).
Baseline Post Intervention
20

Table III. UST indicators not measurable at 2004 baseline, n=96 facilities
Indicators Not MeasurableNumber of
facilities (n)Proportion in
compliance p 1
1 B.6 Tanks pass most recent liner inspection 1 1.002 C.24 No ATG: Tightness test passing results for past 5 yrs. 2 0.003 D.6 Cathodic protection system operate continuously 0 -4 D.7 Inspect rectifier every 60 dys/keep log 0 -5 D.9 System tested every2yrs/6mos. of repair 0 -6 D.12 System pass most recent test 0 -7 D.13 Records of repairs/test results 0 -8 D.16 Cathodic protection sys operate contin. 0 -9 D.17 System tested every 3 yrs. 0 -
10 D.20 System pass most recent test 0 -11 D.21 Records of repair/test results 0 -12 F.28 Stage I vapor recovery installed 0 -13 F.40 Poppet cap close tight 0 -14 F.41 Vapor lid in good condition 0 -15 F.42 Vapor lid color-coded orange 0 -16 G.7 Stage II vapor recovery installed 0 -17 G.23 Nozzles out of service/tagged out 0 -18 G.28 Defective parts repaired/replaced 0 -19 G.29 All three test performed annually 0 -20 G.30 Leak test annually 0 -21 G.31 Vapor space tie test annually 0 -22 G.32 Ten-gal per minute test annually 0 -23 G.33 Air to liquid ratio test performed annually 0 -24 G.34 Records of all Stage II testing maintained 0 -
21

4.2 Negative Binomial Regression Analysis Negative binomial regression analysis was used to assess compliance performance over time by “grouping” the 41 measurable indicators into five “categories”—i.e., tank corrosion protection, tank leak detection, piping leak detection, spill prevention and overfill protection, and groundwater monitoring and tank pad observation wells. Comparisons of overall industry compliance at baseline and post-ERP intervention found statistically significant improvements in compliance by “category” as shown in Table IV. Overall, significant improvements in compliance were found for 4 of 5 compliance categories (p-values <.05 for 3 categories); the average observed compliance performance improvement for these four categories ranged from 6 to 38%. The Global Test Statistic, which is a one-sided test that also takes into account both positive and negative findings, could not be used to make a statement on overall compliance performance due to insufficient data (methodology published in Natalya D, Hanumara RC, Enander RT, Gagnon RN. Statistically Speaking: Use of the Global Test Statistic as a Performance Measurement in a Reanalysis of Environmental Health Data. American Journal of Public Health. 2009. 99(10):1739-1741). 4.3 Interstate Comparisons: 4.31 Significant Operational Compliance RIDEM found that it was not possible to make statistically valid interstate comparisons of compliance performance over time using OUSTs “aggregated” SOC data sets as Rhode Island’s data, like many other states, largely represents changing proportions of nonrandom samples over time. The % SOC data derived from OUST online reports (“UST and LUST Program Performance Measures”, available at: http://www.epa.gov/OUST/cat/camarchv.htm and shown in Table V), therefore, represent those facilities that comprise a target group in each end of year activity report and are not reflective of the universe of facilities as a whole—with the exception of Florida and possibly a minority of other states. Further, unlike Florida, Rhode Island reports noncompliance statistics based on requirements that are more stringent than the federal SOC requirements in the areas of release prevention (operation and maintenance), release detection (testing), tank tightness testing schedule, and leak detection. In order to compare Rhode Island baseline and post-intervention compliance rates, RIDEM regulatory staff reviewed historic field inspection checklist data for the 96 baseline and 93 post-intervention ERP “random” inspections and calculated aggregate %SOC values for the three standard EPA OUST compliance categories: release prevention, release detection, and release detection and prevention. Since direct comparisons between Rhode Island and Florida OUST data, as reported, were not possible, RIDEM focused its efforts on comparing the ERP baseline and post-intervention “random sample data sets” with the census data collected by Florida on an annual basis. This involved converting Florida and Rhode Island’s 2004 and 2008 % SOC data into compliance proportions and making statistical comparisons using the Fisher Exact test. The results of these analyses are shown in Table VI. The Rhode Island %SOC FY04 and FY07/08 data presented in Tables V and VI are quite different. The baseline and post-intervention field data based on “random samples” in Table VI more nearly reflect the compliance status of all UST regulated facilities during the indicated time periods, as the compliance data reported to OUST (Table V) were based on targeted inspections.
22

Table IV. Comparison of Compliance Performance at Baseline and Post-Intervention
Categories with Measurable IndicatorsAverage %
Improvement (n)a 95% CI p-valueb
B. Tank Corrosion Protection 38 (2) -.011, .773 .078** - repair/test records kept, 3-yr system tests C. Tank Leak Detection 4 (12) -.037, .111 .703 - proper operation, leak rate tests, systems calibration, tightness tests, recordkeeping, inventory control E. Piping Leak Detection 9 (11) .004, .170 .016* -system check/repairs recordkeeping, leak detection, interstitial monitoring, tightness tests, system calibrationF. Spill Prevention and Overfill Protection 6 (11) .008, .118 .012* - labeling/marking, spill containment, sensors functioning, inspections/recordkeeping, equipment in good condition I. Groundwater Monitoring Wells and Tank Pad Observation Wells 21 (5) .164, .268 <.001* - equipped w/ road box, locked caps, not screened, caps not submerged/closed tightly, recordkeepingaAverage performance improvement for measurable indicators by compliance category; n = total number of measurable indicators in each category; CI = Confidence Interval; Average % improvement calculated as the difference between means postintervention (m2) and at baseline (m1) * 100; Baseline/postintervention means = the proportion of allindicators in compliance (x's) at each facility, summed across all facilities within a given category and divided by thenumber of facilities in that category at baseline (n1) and postintervention (n2); sample variance (s) = ((x1-xbar)**2 +…+(xn-xbar)**2)/(n-1); 95% CI's on the difference between means = (m2-m1)±1.96*((s1/n1)+(s2/n2))**.5, t-value for B.=2.11, 17 degrees of freedom.bp-value calculated using negative binomial regression analysis on categorical data; one-sided p-values were: .039 (B), .552 (C), .008 (E), .006 (F), and .001 (I)*p≤.05, statistically significant at the 95% confidence level**p≤.10, statistically significant at the 90% confidence level
23

Table V. UST Compliance Data from EPA-OUST End of Year Activity Reportsa
State
Compliance Measurement
Timeframe (Federal Fiscal
Year)
% in SOC w/ Release
Prevention Regulations
% in SOC w/ Release Detection
Regulations
% in SOC w/ UST Release Detection & Release Prevention
Regulations
Rhode Island FY08 90 71 63FY07 88 71 68FY06 86 67 61FY05 64 46 37FY04 87 59 52
Florida FY08 92 89 88FY07 88 87 85FY06 88 87 85FY05 88 87 85FY04 90 87 85
a Available at: http://www.epa.gov/OUST/cat/ca_043_4.pdf
24

25
Table VI. UST Facility Significant Operational Compliance Comparisons
Rhode% in SOC w% i% in SOC wPr
Fl% in SOC w% i% in SOC wPrNOTora
n(yb
c
Sample Sizea
n1
Proportion p1
Sample Size n2
Proportion p2 (95%CI)b
Percentage changec
(95% CI)d P e
Island / Release Prevention 96 0.75 93 0.94 (.89,.99) 19 (9,29) <.001*
n SOC w/ Release Detection 96 0.53 93 0.75 (.67,.84) 22 (9,35) .001*/ Release Detection &
evention 96 0.51 93 0.72 (.63,.81) 21 (8,35) .002*
orida / Release Prevention 10,000 0.90 10,000 0.92 2 <.001*
n SOC w/ Release Detection 10,000 0.87 10,000 0.89 2 <.001*/ Release Detection &
evention 10,000 0.85 10,000 0.88 3 <.001*ES: n = number of facilities in sample; p = proportion = no. of facilities in compliance/number of facilities in the sample
assumed universe of facilities; CI = Confidence IntervalThe term "sample size" applies to RI data only as the data reflect a random sample taken from a population of ~600 UST facilities.
1 and n2 for Florida = the entire regulated universe (i.e., population) of registered facilities estimated to be 20,000 based on personal communication with FLDEP) for calculation purposes. Since the FLDEP inspects >90% of all facilites each ear, p1, p2 and "percentage change" data are assumed to reflect proportions and changes in the entire population. Wald CI calculated using online program at: http://www.measuringusability.com/wald.htmCalculated as 100(p2 – p1)
d95% CIs calculated for indicators showing statistical significance at α= .05; 95% CIs calculated as (p2–p1) ± 1.96×squareoot [p1(1.00 – p1) / n1 + p2(1.00 – p2) / n2].p-values calculated with the Fisher exact test online, available at http://www.quantitativeskills.com/sisa/statistics/fisher.htm ≤.05, statistically significant at the 95% confidence level
Baseline ('04) Post Intervention ('07/'08) Statistical Comparison
re
*p

A comparison of facility compliance, using OUST SOC reporting metrics, at baseline to that post-ERP intervention (Table VI) shows statistically significant improvements in performance over time—which is in agreement with previous findings. Statistically significant improvements across all three SOC categories were found with point estimates ranging from 19 to 22 percent (95% Confidence Intervals, are also provided). The percentage of facilities in compliance with SOC “release prevention” requirements, is shown to be similar for Rhode Island post-intervention (94 %; 89-99%, 95% CI) and Florida (92%), under the assumption that Florida’s data are reflective of statewide facility compliance; the remaining two categories showed statistically significant improvements over time, though point estimates for Rhode Island were lower than those shown for Florida. While Florida showed significant improvements of 2 and 3% over time across all categories, performance improvements in Rhode Island were far higher (19-22%)—of course, Rhode Island started from a lower baseline level of compliance. 4.32 Indicator-by-Indicator Comparisons Once data for 9,963 UST compliance inspections were extracted from Florida’s combined database of 19,193 UST and AST (aboveground storage tank) inspection reports for 2007, an attempt was made to compare compliance performance indicators on a one-to-one basis. Due to an inability to “precisely” match recorded UST inspection data, however—and despite many months of effort, “comprehensive” one-to-one, indicator-by-indicator comparisons could not be achieved (see Appendix I). Instead, Florida’s grouped Significant Operational Compliance data submitted to EPA OUST were used as a basis for the interstate compliance performance review; from a statistical perspective, this was possible as—unlike most other states—Florida essentially takes an annual census of compliance among all in-state facilities. A major barrier encountered in this part of the data comparison study was that many differences in format and content of inspection checklist questions exist between the two states. Other obstacles—such as, Rhode Island reports noncompliance statistics based on requirements that are more stringent than those at the federal level; Florida’s database contains aggregated data (e.g., tank system/piping, cathodic protection criteria) that are not separated out like in Rhode Island; and regulations that involve differing timeframes (e.g., Florida often requires yearly certified testing vs. every 2/3 years for some criteria in Rhode Island)—were also encountered. Of the 41 measurable indicators developed from RI’s database, fewer than 20% of Florida’s indicators were found to be directly comparable on a one-to-one basis (see Appendix I). For example, data for Rhode Island checklist question/indicator “F.11 (Spill Prevention – sumps clean of debris, water, product)” were also collected by Florida inspectors and entered into the state’s computer database using a similar description. For the majority of Rhode Island’s measurable indicators, however, no direct comparisons could be made. 4.4 Economic Analysis Table VII presents the results of a first order comparative analysis of costs associated with operating the traditional (Energy Act-mandated) UST inspection program in Rhode Island verses the alternate ERP approach. Various ERP models were assessed where both sample size (100 or 250 inspections) and frequency of inspection (every 1-3 years) were combined in five different scenarios; all analyses presented in the table are based on annual costs, as displayed in Lines 4 to 7. Costs associated with data gathering and analysis occur only once per cycle, so these costs were spread out over the time period of the cycle. There was only one fixed cost item included
26

in the calculations—a staff person responsible for collecting and organizing self-certification forms as well as other ERP administrative duties throughout the entire cycle ($20,000/year). When ERP was programmed to include inspections every 2 or 3 years, the other costs associated with the data gathering and analysis in each round were divided accordingly to show costs on a yearly basis and then added to the fixed staff cost of $20,000. For example:
• On Line 5, if 100 random inspections were conducted every year, then the projected cost to support ERP activities is shown to be $20,000 (staff person) + $12,000 (ERP Manager) + $1500 (Intern) + $2000 (mailing costs) = $35,500.
• If the ERP cycle is extended to once every 2 years, the work required to support ERP
would cost $40,000 (2 years of staff person) + $12,000 (ERP Manager) + $1500 (Intern) + $2000 (mailing costs) = $55,500 every 2 years or $55,500/2 = $27,750 per year.
• If the ERP cycle is extended to once every 3 years, the work required to support ERP
would cost $60,000 (3 years of staff person) + $12,000 (ERP Manager) + $1500 (Intern) + $2000 (mailing costs) = $75,500 every 3 years or $75,500/3 = $25,167 per year.
For sample sizes of 250, one year cycles were not applicable since 250 inspections/year would be the current "traditional program” so analyses for 2 and 3 year cycles are presented using the same approach. The costs to start-up ERP are also presented in line 8 of Table VII and includes workbook development, workshops, etc. Annualized inspection costs are presented in Lines 1-4 for the different ERP scenarios. The payback is calculated by dividing the net savings of ERP (Line 7) into start-up costs (Line 8) and is shown to range from 0.65 to 1.22 years. 4.5 Determinants of Non-compliance: Regression Analyses 4.51 Tank-Level Regression Analysis Table VIII gives a summary profile of the tanks. From the 96 facilities sampled, data on 301 tanks were collected for a number of variables. For the analysis, the non-compliance variable was denoted by Y2 and the number of checks made was denoted by Y1. First, investigators fitted two standard linear regression models using Y3=Y2/Y1 and Y4=Arcsin (Y3**.5) as response variables. Both these analyses assumed normal theory. Since Y3 was proportion data, the literature suggested using arcsin transformation to Y4. In both of these analyses, the coefficient of determination (R**2) as a measure of how good the fit was came out to be about 0.3. The SAS program has a selection procedure that selects all significant independent variables. For Y3 as response variable, the significant regressors were product stored, type of tank, type of piping, safe or US suction pipe, impressed current cathodic protection, and sacrificial anodes. Investigators fit the models with all x variables and chose from Type 1 and Type 3 sum of squares to determine which regressors appeared to be significant. A fit of the Negative Binomial regression indicated that the type of piping, safe or US suction pipe, pressure submersible pump system, and impressed current cathodic protection were significant variables explaining the noncompliance status of tanks; we note the same variables were also selected in the linear and
27

ble VII. Rhode Island Underground Storage Tank Inspection Program Economic Analysis
100 per year 100 per 2 years 100 per 3 years 250 per 2 years 250 per 3 years40% Inspector1 36,964 $14,786 $7,393 $4,929 $18,482 $12,32120% Inspector2 16,698 $6,679 $3,340 $2,226 $8,349 $5,566
Personnel Required 90% Inspector3 95,566 $38,226 $19,113 $12,742 $47,783 $31,8555% Inspector4 5,878 $2,351 $1,176 $784 $2,939 $1,95910% Insp. Supervisora 13,676 $13,676 $13,676 $13,676 $13,676 $13,676
Annual Personnel Cost(Salary, benefits, overtime) $168,782 $75,718 $44,697 $34,357 $91,229 $65,378Travel Expense30 miles ave./trip, @ $.48/mile $3,600 $1,440 $720 $480 $1,440 $960
$172,382
1
2
3
4 A $77,158 $45,417 $34,837 $92,669 $66,338
ERP Annual Operating Costsb $35,500 $27,750 $25,167 $32,000 $28,000$112,658 $73,167 $60,004 $124,669 $94,338$59,724 $99,215 $112,378 $47,713 $78,044$73,000 $73,000 $73,000 $73,000 $73,000
1.22 0.74 0.65 1.53 0.94rvisor time/cost same for whatever program exists; other inspector costs linearly related to number of inspectionsal operating costs include ERP Manager ($12,000 for 100; 18,000 for 250), staff person ($20,000 per year, fixed cost), data entry (intern - $1,500 for
NET ANNUAL SAVINGS FROM TRADITIONAL PROGRAM (4A-6)ERP START-UP COSTSc
Years to Recover ERP Start-up Costs (Payback) 8 divided by 7
TOTAL ANNUALINSPECTION
OPERATING COSTS
TOTAL ANNUAL INSPECTION AND ERP COSTS (4+5)
III. ERP (250 Sample Size)~250 per yearSCENARIO I. Traditional Inspection II. ERP (100 Sample Size)
56789
aSupebAnnu100, $4,000 for 250), mailing costs for 750 facilities ($2,000). For sample size of 100: ERP Supervisor (10% of time of $120,000 annual salary/benefits), QA/QC data analysis, calculate post-ERP inspection proportions, Fisher/Bonferonni analyses, report writing and review; Data Entry - three weeks work, $1500For sample size of 250: ERP Supervisor (15% of time of $120,000 annual salary/benefits); Data Entry - eight weeks work, $4000 mailing costs of workbookand checklist to all 750 facilities, $2000 staff person used to organize and track all self-certification forms returned to DEM (20% of time of $80,000annual salary/benefits)cFunds equal to EPA grant received by RI to develop workbook, checklist and run 6 workshops ($67,000); 5% of ERP Supervisor time for baseline analysis($6000)--will vary by state
Line
Ta
28

Table VIII. Tank Level Regression Analysis
Variable Frequency Average PercentageAge of Tank 289 13.70Capacity of Tank 297 8575Product StoredGasoline 243 80.7Diesel 33 11Heating oil 7 2.3Fuel oil 3 1Kerosene and waste oil 11 3.7Other 4 1.3Type of TankSteel 28 9.3Fiberglass 172 57.1Steel with jacket 91 30.2Other 10 3.4Repair StatusNo 170 56.5Yes 11 3.7Unknown 120 39.8Col. WSingle walled 121 40.3Double walled 179 59.7Tank ManifoldYes 74 26No 211 74Tank CompartmentYes 23 7.9No 269 92.1PipingSingle walled 59 19.6Double walled 221 73.4Unknown 21 7Safe/Suction PumpYes 27 10No 243 90Interior LinerYes 20 6.6Unknown 281 93.4Impressed CurrentYes 18 6Unknown 283 94Sacrificial AnodesYes 20 6.6Unknown 281 93.4
29

Table IX. Facility Level Regression Analysis
Variable Frequency Average PercentageFaclity TypeLarge convenience store 40 46Small snack express 28 32.2Only selling gas 19 21.8Corporate OversightYes 58 66.7No 29 33.3Number of Employees 87 5.90OwnershipIndependent 47 54Otherwise 40 46FranchiseYes 25 28.7No 62 71.3Full Service GarageYes 27 31No 60 69Age of Tank 86 16.5Capacity of Tanks 87 8942Tanks MakeAll single walled 31 35.6All double walled 52 59.8Mixed 4 4Number of Tanks1 2 22 19 21.83 44 50.64 13 14.95 5 56,7 4 4Tank ManifoldedAll yes 1 1All no 54 64.3Mixed 29 34.5PipingAll single walled 25 30.5All double walled 50 61.0Mixed 7 8
.6
.3
.7
.6
.2
.5
30

Poisson regression modeling. The value of R**2 was only 0.3—it may be that there could be other regressors, interaction terms between regressors, and quadratic terms for regressors to improve the value of R**2. 4.52 Facility-Level Regression Analysis Table IX gives a summary profile of the facilities included in the analysis. The facility analysis was carried out using the same methodology applied to tank data. There was evidence of over dispersion—deviance/degrees of freedom was much larger than (1) in the Poisson regression model. Hence, Negative binomial regression was a better choice over Poisson regression. A fit of Negative binomial regression indicated that the only significant independent variable was the average capacity of the tanks at the facility. The same variable was also significant in the Poisson regression model. In the standard linear regression modeling with FY3 (same as Y3 except for facilities) as the dependent variable, the only significant independent variable found was whether the facility was a franchise or not. Using FY4 (same as Y4 except for facilities) as the dependent variable, the significant independent variables were franchise and the piping status of the tanks. The coefficient of determination R**2 in the linear regression modeling was only 0.11. A fit of Negative Binomial regression indicated that the only significant independent variable was the average capacity of the tanks at the facility. The same variable was also significant in the Poisson regression model.
31

5.0 DISCUSSION AND CONCLUSIONS Application of the Environmental Results Program model to the Rhode Island UST sector has produced positive, measurable results. Prior to conducting the 96 randomized baseline facility inspections in 2004, RIDEM did not have a clear or reliable picture of historic compliance levels for this industry sector. Inspections conducted in prior years were targeted and, therefore, not statistically representative of the entire regulated universe. By applying ERP methodology, 2004 baseline levels of compliance performance for measurable indicators were found to range from 0 to 95%, with a median of 76%. By itself, the use of this ERP benchmarking component allowed investigators to obtain a statistically valid understanding of facility compliance levels prior to implementation of the sector-wide ERP or the U.S. Energy Policy Act of 2005—that is, these data were reflective of compliance levels (across the industry) achieved using traditional regulatory methods and a standard facility-by-facility, inspection-enforcement approach. ERP interventions consisting of stakeholder involvement, self-administered checklists, certified reporting of inspection results, and training and outreach appeared to have been effective in producing statistically significant performance improvements above baseline compliance levels. [Note: The self-education process that derives from reading workbook tutorials and conducting “detailed” walkthrough facility assessments have been found to result in significant performance improvements in a variety of environmental health settings (see footnotes 1-3)] Post-intervention assessments conducted among UST facilities drawn at random from the original pool of regulated facilities, resulted in a separate and distinct set of compliance data that were reflective of sector-wide conditions 3-years after baseline inspections were performed. The change or observed improvement in compliance among the post-intervention facilities for 41 measurable indicators were found to range from 22 to 100%, with a median of 85%. The use of EPA OUST SOC metrics, standard ERP indicator analysis methods, and more sophisticated statistical approaches all produced the same result—statistically significant improvements in compliance performance post-ERP intervention. In addition to the facility-level performance improvement analyses described in the Methods section of this report, investigators also analyzed tank-level compliance data using Chi-square tests based on cluster sampling. The objective of this analysis was to take advantage of the larger data set available for individual tanks. Of the 41 original indicators, only 36 could be used in the Chi-square analysis as 5 indicators were applicable at the facility-level only. Of the 36 indicators, 28 showed some improvement while 21 showed significant improvement at the .05 level using ordinary χ2 tests and 11 remained significant using a cluster adjusted χ2 procedure. The URI Computer Science and Statistics graduate student who conducted this part of the analysis described the results in this way: “In the facility level analysis, the Fisher Exact tests suggested that almost 30% of potentially measurable indicators showed significant improvement of compliance performance. On the other hand, in the tank level analysis, ordinary χ2 tests suggested that almost 55% of the indicators showed significant improvement. Also, the cluster adjusted χ2 test suggested that 31% of the indicators showed significant improvement. Usually, cluster adjusted results tend to be more conservative. Thus, this result was expected. The difference between the facility level
32

and tank level results was the difference of the sample sizes and procedures (i.e., 1 sided Fisher exact test vs. χ2 tests).”17
Results of regression analyses conducted to identify significant variables contributing to non-compliance of facilities/tanks, showed that not all statistical methods yielded the same set of variables. It may be argued, therefore, that a variable which was found to be significant for non-compliance in any method is a candidate for special attention by regulatory inspectors and facility owners/operators. The variables found to be associated with non-compliance were: average tank capacity, fuel oil storage, type of piping, suction pipes, and impressed cathodic protection. A first order analysis of the costs associated with the traditional (Energy Act-mandated) UST inspection program in RI was also performed and compared with the costs needed to support the alternate ERP approach. Several ERP implementation models were analyzed where both sample size and inspection frequency were varied and combined into five different scenarios. Since fewer inspections are required for ERP, costs associated with inspections were shown to be reduced for each scenario. Considering expenses to sustain ERP-related activities (workshops, data gathering, statistical analysis, oversight), overall costs were still found to be lower than that for the labor intensive facility-by-facility inspection and enforcement approach mandated by the Energy Policy Act. Based on Rhode Island’s experience, it is anticipated that states having difficulty (due to limited funding or field resources, for example18) in meeting the U.S. Energy Policy Act 3-yr inspection requirement would particularly benefit from the cost efficiencies and statistical strengths of the ERP approach. In addition to adopting the ERP model, these states might also consider the integration of a risk-based approach (similar to that recommended by the U.K. Environment Agency in its report Delivering for the environment: a 21st Century approach to regulation19) where high risk facilities requiring more intervention are inspected more frequently and where the ERP model is 17 See H. Koybayashi. Statistical Analysis of Environmental Results Program. A Thesis Submitted in Partial Fulfillment of the Requirements for the Degree of Master of Science in Statistics. University of Rhode Island. 2009. 18 In his article A Long View: Parting Thoughts from a Veteran Tank Regulator, Marshall Mott-Smith, a 31 year Florida Department of Environmental Protection veteran (with 22 years as administrator of the Storage Tank Regulation Section) wrote in 2008 that the future of groundwater protection “will not be easy, as many state resources are strained with lower tax revenues, and state legislators are faced with difficult funding decisions. Travel, training, and expense budgets have been slashed, and managers must prioritize their efforts on inspecting those facilities that pose the greatest risk to groundwater.” LUSTLine Bulletin 58, September 2008, pp. 8,9. 19 In the UK model, compliance and enforcement resources are concentrated “where the risks are highest, including the highest hazards and the poorest performing operators”, with less intervention for low risk facilities. The report finds that: “Traditional regulation has achieved much. But the nature of regulation has to change to keep pace with changes in the economy and society. The Environment Agency is further developing its approach to regulation… This approach is outcome-focused and risk-based, clearly communicated and is delivered in a consistent manner. We call this modern regulation… Modern regulation aims to find the right balance—a proportionate, risk-based response, that will drive environmental improvements, reward good performance, but still provide the ultimate reassurance that tough action will be taken on those who fail to meet acceptable standards.” Available at: http://www.environment-agency.gov.uk/static/documents/Business/delivering_1906007.pdf
33

applied to lower risk facilities, for example. Indeed, exploratory work for a risk-based approach has already been undertaken by EPA Region 3 in The Mid-Atlantic States’ MTBE Pilot Project which developed “a GIS application and a site ranking software tool that can be used by EPA or states to consider relative potential risk when prioritizing UST facility inspections or LUST site corrective action oversight” 20; additional relevant information and data exist.21 To investigate interstate differences in compliance performance, RIDEM expanded its ERP “alternate inspection approach” study to include a side-by-side comparison of compliance performance using a traditional partner state. This effort was initially designed to follow the “comparative/historical approach”—where “EPA would study a State that has already embarked upon its ERP approach (i.e., Rhode Island), and compare its results to results from other control states”—as described in the draft White Paper: Considerations in Studying the Efficacy of the Environmental Results Program (ERP) Approach for Underground Storage Tanks (USTs).22 Although this approach was anticipated to be “perhaps the easiest study approach to implement [in terms of performing interstate comparisons]” it was also viewed as the “most complex analytically” for a number of reasons including that “cross-state data, may not be precisely comparable.” To perform this work, Florida was selected as an early partner for conducting the interstate comparison due to its success with its traditional approach to UST regulation and availability of statewide UST historical inspection data dating back to 1983; as of January 2004, a total of about 400,000 inspections had been completed since 1983. Due to an inability to “precisely” match recorded UST inspection data (see section 4.32), however—and despite many months of effort, “comprehensive” one-to-one, indicator-by-indicator comparisons could not be achieved. Instead, Florida’s grouped significant operational compliance data submitted to EPA OUST were used as a basis for the interstate compliance performance review; from a statistical perspective, this was possible as—unlike most other states—Florida essentially takes an annual census of compliance among all in-state facilities. By comparing Rhode Island’s random sample data to that of Florida’s 2008 OUST data sets, one cycle of ERP was shown to produce 1) statistically significant performance improvements (ranging from 19 to 22%) across all three broad operational compliance categories, and 2) similar high-performing operational compliance results for “release prevention” requirements (94% RI point estimate to 92% FL); though significantly improved, point estimates for the categories “release detection” and “release detection and prevention” for Rhode Island were lower than those shown for Florida. Considering Florida’s extraordinary resources—where 90+% of Florida’s entire UST universe is inspected each year by 139 Department of Health/Environmental Protection
20 Report on The Mid-Atlantic States’ MTBE Pilot Project, Public Water Supply Sampling, GIS Plotting of UST & LUST sites and Public Drinking Water Wells, and Ranking Tool Development. U.S. Environmental Protection Agency, Mid-Atlantic Region, Philadelphia, PA. May 2004. Available at: http://www.epa.gov/reg3wcmd/ pdf/MTBE.pdf 21 For example: Florida’s Cause of Leak Study. Available at: http://www.neiwpcc.org/neiwpcc_docs/ ustlust_shows/mott_smith.pdf; Assessing the Risk of Groundwater Contamination from Petroleum Product Storage, University of Missouri. Available at: http://extension.missouri.edu/publications/ DisplayPub.aspx?P=WQ65422 Crow M, Krop R. UST ERP White Paper (1.5) Option 4: Comparative/Historical Approach. Cadmus Group, Inc. 16 August 2005.
34

and county government staff—and the fact that, unlike Florida, Rhode Island reports noncompliance statistics based on requirements that are more stringent than the federal SOC requirements in the areas of release prevention (operation and maintenance), release detection (testing), tank tightness testing schedule, and leak detection, these findings are positive and encouraging. Regarding study limitations, some bias in the results may exist, as the timeframe for the study bracketed the 2005 Energy Act requirements. Observed performance improvements, however, are believed to be largely attributable to ERP-related activities as data trends cannot be explained solely by the targeted inspections of neglected facilities conducted pursuant to the US Energy Policy Act of 2005 (i.e., the Act required facilities that had not been inspected since 22 December 1998, to undergo an on-site inspection by 8 August 2007, and subsequently once every 3 years thereafter). Supporting evidence includes: 1) only 10 to 23% of all UST facilities (comprised entirely of neglected sites that had not been inspected for 5 – 7 years) were subjected to targeted inspections in any given year (for the years 2005 to 2008)—which was consistent with a historical inspection rate of 17% (or once every 6 years) in Rhode Island (by comparison, FL inspects 90+% of its regulated facilities each year), 2) comprehensive ERP interventions took place in 2005 with: 6 statewide workshops attracting 297 attendees (no mention of the Energy Act requirements was made), telephone technical assistance, and self-audit workbook/checklist mailings to all federally regulated facilities, 3) strong enforcement follow-up of non-ERP certifiers/incomplete plan submittals was undertaken in 2005 and 2006 [i.e., 146 Notices of Intent to enforce were sent to non-certifiers and more than 30 formal enforcement actions, 100 violations and $300,000 in penalties were assessed for noncompliance with ERP requirements], and 4) 1,291 RTC plans were submitted to RIDEM with commitment dates for returning to compliance. Taken together, Rhode Island field data and project information indicate that the first round of Rhode Island’s mandatory UST ERP was successful at producing statistically significant improvements in industry-wide compliance. Both categorical (for tank corrosion protection, piping leak detection, spill prevention and overfill protection, and groundwater monitoring wells and tank pad observation wells) and individual compliance inspection checklist indicator performance improvements were observed over time. Though these data represent 1st round results only, the weight-of-evidence—from prior ERP implementation experience in Rhode Island23 and the positive results obtained by other states in other industry sectors24—shows that the ERP model compliments existing regulatory structures and can provide a sound alternative to traditional inspection programs. Due to the comprehensive and iterative nature of the UST ERP, we believe that statewide compliance levels will increase over time as facilities become accustomed to the self-audit, certification, and disclosure/reporting components of the program; ultimately, an upper threshold may be reached—as was experienced by Florida in four consecutive annual reports of 85% significant operational compliance for release detection and prevention, FY04-FY07. The success
23 See Footnote 2. 24 See Footnote 3.
35

of this ERP initiative may be attributed to a number of factors, especially the 1) collaborative efforts between EPA Headquarters/Region I and RIDEM’s Offices of Waste Management (within which the UST regulatory program resides) and Customer & Technical Assistance (which championed ERP), 2) early stakeholder involvement through face-to-face meetings and information exchanges, 3) statewide industry training and outreach, and 4) research partnership with the University of Rhode Island Department’s of Chemical Engineering and Computer Science and Statistics. NOTE: This study included a number of statistical procedures that go beyond a traditional ERP. A typical business sector ERP only needs a Fisher Exact test or similar type analysis to compare pre- and post-intervention random sampling results. The advanced statistical procedures used in this study were applied to more rigorously test the ERP results. We do not recommend that a typical application of ERP use these tools, but we hope that future ERP users gain confidence in the results based on this advanced study.
36

37
APPENDIX 1
Rhode Island-Florida Interstate Indicator Comparisons
RIDEM partnered with the Florida Department of Environmental Protection to compare UST compliance performance data. Because the FLDEP inspects such a large proportion of its facilities every year (90+% of Florida’s entire UST universe of ~10,000 facilities are inspected each year by 139 Department of Health/Environmental Protection and county government staff), investigators thought that Florida would offer somewhat of a "look into the future" of UST regulation under the Energy Act's current requirements, and serve as a high performing control state for the study; by comparison RIDEM historically inspected <20% of its entire universe of 608 federally regulated facilities using only four inspectors each year. Florida was selected as an early partner for the interstate comparison component of the study due to its success with the traditional approach to UST regulation and availability of statewide UST historical inspection data dating back to 1983. Indicator-by-Indicator Comparisons Due to an inability to “precisely” match recorded UST inspection data, and despite many months of effort, “comprehensive” one-to-one, indicator-by-indicator comparisons could not be achieved. A major barrier encountered in this part of the data comparison study was that many differences in format and content of inspection checklist questions exist between the two states. Other obstacles—such as, Rhode Island reports noncompliance statistics based on requirements that are more stringent than those at the federal level; Florida’s database contains aggregated data (e.g., tank system/piping, cathodic protection criteria) that are not separated out like in Rhode Island; and regulations that involve differing timeframes (e.g., Florida often requires yearly certified testing vs. every 2/3 years for some criteria in Rhode Island)—were also encountered. Of the 41 measurable indicators developed from RI’s database, fewer than 20% of Florida’s indicators were found to be directly comparable on a one-to-one basis. For example, data for Rhode Island checklist question/indicator “F.11 (Spill Prevention – sumps clean of debris, water, product)” were also collected by Florida inspectors and entered into the state’s computer database using a similar description. For the majority of Rhode Island’s measurable indicators, however, no direct comparisons could be made. At the time of the study, there were a total of 9,963 UST facilities inspected for the calendar year 2007. A total of 11,199 violations relating to UST’s were cited. [Note: It is important to keep in mind that Florida announced the need to complete upgrades to double-walled systems by December 31, 2009. Therefore the number of violations related to single-wall systems could be reduced, due to the upgrading of facilities.] As discussed, indicators were difficult to directly compare based on the wording of rules in each state and the specific requirements. In some cases, each of the two states had different interpretations, one of which may be more stringent than the other, but still meeting the Federal requirements. For example Rhode Island had initial indicators for recordkeeping broken out in individual sections. Florida mandates that the required records must be kept and has an entire section regarding the time frame and keeping of records. When comparing the Rhode Island 41 primary (measurable) indicators to

38
Table A1. 2007 Florida Data Based on 9,963 UST Facility InspectionsRhode Island Reference Cited Violations Florida ReferenceE.16 9 761.610(3)(a)(1)B.21 176 761.700(1)(b)(2)(a)E.10 8 761.640(3)(a)(1)(b).11 1420 761.700(1)(c)(1)
F.2 22 761.500(1)(b)C.14/C20 211 761.600(1)(a)(2)I.4 320 761.640(2)(a)E.20
F
8 761.7640(3)(a)(1)(b)
Table A2. 2007 Rhode Island-Flor
IndicatorI.4 Groundwater Monitoring Wells equipped w/ road box and lock caE.10 Piping Leak Detection Interstitial monitoring for leaksE.20 Piping Leak Detection Continuously use interstitial monitoringF.11 Spill Prevention Sumps free of water/debris/productC.14/C.20 Tank Leak Detection ATG/Monitoring systems calibrated/insF.2 Spill Prevention Tanks equipped w/ operational spill contrB.21 Tank Corrosion Protection System tested 3 yrs/6mths subseqent to rE.16 Piping Leak Detection Conduct annual tightness tests
ida Performance Data Comparisons
Rhode Island Florida
p 0.96 0.97
0.97 0.99
0.94 0.99
0.76 0.86
pected 0.80 0.98
ol device 0.69 0.99
epair 0.50 0.82
0.22 0.99
Chapter 62-761 of the Florida Administrative Code the following indicators could be compared on a closely related basis. When the number of Cited Violations from Table A1 were divided by the total number of inspections conducted during 2007, the interstate comparison data shown in Table A2 result. These data show that compliance performance for 3-4 of the measurable indicators (I.4, E.10, E.20 and F.11) are similar for both Rhode Island and Florida, with rather large differences shown for those remaining.