usscsheehy2 - scotusblog
TRANSCRIPT

No. 16-1161
In TheSupreme Court of the United States
BEVERLY R. GILL, ET AL., Appellants,
v.
WILLIAM WHITFORD, ET AL., Appellees.
On Appeal from the United States District Courtfor the Western District of Wisconsin
BRIEF OF AMICUS CURIAETHE NATIONAL REPUBLICAN CONGRESSIONAL
COMMITTEE IN SUPPORT OF APPELLANTS
LANTAGNE LEGAL PRINTING801 East Main Street Suite 100 Richmond, Virginia 23219 (800) 847-0477
Jason TorchinskyCounsel of RecordJ. Michael BayesShawn Toomey SheehyPhillip M. GordonHoltzman Vogel Josefiak Torchinsky PLLC45 North Hill DriveSuite 100Warrenton, VA 20186(540) 341-8808(540) [email protected]
Counsel for Amicus Curiae August 4, 2017
P. Christopher WinkelmanNational RepublicanCongressional Committee320 First Street, SEWashington, DC 20003202-479-7000202-484-2543

i
TABLE OF CONTENTS TABLE OF AUTHORITIES ...................................... iii STATEMENT OF INTEREST OF THE
AMICUS CURIAE .............................................. 1 SUMMARY OF ARGUMENT ..................................... 2 I. The “Efficiency Gap” is a Deeply Flawed
Methodology that Should Not Be a Component of Any Judicially Manageable Standard. ....................................... 3
II. The “Efficiency Gap” Does Not Account
for the Natural Packing Effect of Political Geography. ........................................... 6
III. The “Efficiency Gap” Requires Bizarrely
Shaped Districts of The Kind That This Court Previously Rejected. ................................. 9
A. Examples from Illinois and
Maryland Demonstrate the Efforts Undertaken to Account for the Democratic Party’s Political Geography. ............................................... 10
B. Wisconsin’s Act 43 Districts
Conform to Traditional Districting Criteria. .................................................... 19

ii
C. The EG, When Combined with Current Political Geography, Mathematically Forces Resettlement of Voters into Non-Similar Voting Communities. .................. 28
D. The “Efficiency Gap” Generally
Fails to Recognize Democratic Gerrymanders. ......................................... 36
E. Appellees’ “Efficiency Gap” Is
Biased Towards Democrats and Is Likely to Cause Constitutional Conflict with Section Two of The Voting Rights Act. .................................... 39
IV. Voters’ Preferences Are Not Monolithic
and Unchanging, Contrary to the Assumptions of the “Efficiency Gap” ............... 41
A. Wisconsin Voters, Much Like
Voters in the Rest of the United States, are not Monolithic. ...................... 50
V. Appellees Reliance on New, Yet
Unpublished, Research is Misguided Because It Mischaracterizes Amicus’ Arguments and Ignores the Methodological Problems of the Research Itself. ................................................................. 56
CONCLUSION .......................................................... 60

iii
TABLE OF AUTHORITIES
CASES Beer v. United States, 425 U.S. 130 (1976) .............. 41 Bush v. Vera, 517 U.S. 952 (1996) .................... passim Colegrove v. Green, 328 U.S. 549 (1946) ................... 40 Comm. for a Fair & Balanced Map v. Ill. State
Bd. of Elections, 835 F. Supp. 2d 563 (N.D. Ill. 2011) ...................................... 11, 12, 38
Cooper v. Harris, 137 S. Ct. 1455 (2017) .................. 41 Davis v. Bandemer, 478 U.S. 109 (1986) ...... 20, 27, 56 Fletcher v. Lamone, 831 F. Supp. 2d 887 (D.
Md. 2011) .................................................... 14, 15 Gaffney v Cummings, 412 U.S. 735 (1973) ........ 56, 58 Gomillion v. Lightfoot, 364 U.S. 339 (1960) . 18, 20, 28 Hunt v. Cromartie, 526 U.S. 541 (1999) ............. 20, 27 Karcher v. Daggett, 462 U.S. 725 (1983) ............ 20, 57 League of United Latin Am. Citizens v. Perry
(LULAC), 548 U.S. 399 ............................... 55, 60 League of Women Voters of Fla. v. Detzner,
172 So. 3d 363, 369 (Fla. 2015) ........................ 18

iv
Shapiro v. McManus, 203 F. Supp. 3d 579 (D. Md. 2016) (denying motion to dismiss) (after remand from this Court in Shapiro v. McManus, 136 S.Ct. at 456 (2015)) .............. 17
Shaw v. Reno, 509 U.S. 630 (1993) ................... passim Vieth v. Jubelirer, 541 U.S. 267 (2004) .... 7, 40, 42, 60 Whitford v. Gill, 218 F. Supp. 3d 837, 947
(W.D. Wis. 2016) ....................................... passim
OTHER AUTHORITIES Andrew Mercer, Claudia Deane, & Kyley
McGeeney, Why 2016 Election Polls Missed Their Mark, Pew Research Center (Nov. 9, 2016) ........................................ 42
Ballotpedia, Georgia’s 6th Congressional
District, https://ballotpedia.org/Georgia%27s_6th_Congressional_District (last visited July 21, 2017) ............................................................. 47
Ballotpedia, Governor of Wisconsin,
https://ballotpedia.org/Governor_of_Wisconsin (last visited July 25, 2017) ...................... 51
Ballotpedia, New Jersey’s 5th Congressional
District, https://ballotpedia.org/New_Jersey%27s_5th_Congressional_District (last visited July 26, 2017) .............................................. 48, 49

v
Barone & Ujifusa, Almanac of American Politics 1996 ................................................ 24, 25
Chris Tausanovitch & Christopher Warshaw,
Representation in Municipal Government, Am. Pol. Sci. Rev. 605, 609 fig. 1 ............................................................. 29, 30
Courtney Kueppers, Trump Becomes First
Republican Presidential Candidate Since 1984 to Win Wisconsin, Wisconsin Public Radio (Nov. 8, 2016) ................................... 50, 58
David Nir, Daily Kos Elections’ Presidential
Results by Congressional District for the 2016 and 2012 Elections, Daily Kos, https://www.dailykos.com/stories/2012/11/19/1163009/-Daily-Kos-Elections-presidential-results-by-congressional-district-for-the-2012-2008-elections (last visited July, 31 2017) .................................. 49, 55
Election 2016, Maryland Results, N.Y. Times
(Aug. 1, 2017, 11:22 AM) .................................. 17 Expert Report of Sean P. Trende at ¶ 103,
Common Cause v. Rucho, Nos. 16-1026, 2017 U.S. Dist. LEXIS 30242 (M.D.N.C. 2017) .......................................................... passim
Geoffrey Skelley, Just How Many Obama
2012-Trump 2016 Voters Were There?, Rasmussen Reports
(June 01, 2017) ............................... 43, 44, 45, 46

vi
Hope Kirwan, Ron Kind Running Unopposed For Congressional Seat, Wisconsin Public Radio (Nov. 3, 2016, 9:40 AM) .......................... 55
Jessica Taylor, The Counties that Flipped
from Obama to Trump, in 3 Charts, National Public Radio (Nov. 15, 2016, 12:26 PM) .......................................................... 44
Jowei Chen & David Cottrell, Evaluating
Partisan Gains from Congressional Gerrymandering: Using Computer Simulations to Estimate the effect of Gerrymandering in the U.S. House, 44 Electoral Stud. 329, 336 (2016) ........................ 40
Jowei Chen & Jonathan Rodden, Don’t Blame
the Maps, N.Y. Times (Jan. 24, 2014) ................................ 10, 11, 34, 38 Jowei Chen & Jonathan Rodden,
Unintentional Gerrymandering: Political Geography and Electoral Bias in Legislatures, 8 Q.J. of Pol. Sci. 239, 245 (2013) .................................................................. 8
Jowei Chen, The Impact of Political
Geography on Wisconsin Redistricting: An Analysis of Wisconsin’s Act 43 Assembly Districting Plan, Election L. J.: Rules, Pol., Pol’y (June 2017) ..................... 57, 58
Kyle Bentle, In Illinois, Chicago-area Clinton
Votes Overtook Rest of State, Chi. Trib. (Nov. 9, 2016) .................................................... 13

vii
Malia Jones & Caitlin McKown, How and Where Trump Won Wisconsin in 2016, WisCONTEXT (Nov. 21, 2016, 3:00 PM) . 32, 33
Mark Fahey & Nicholas Wells, The Places
That Flipped and Gave the Country to Trump, CNBC, http://www.cnbc.com/heres-a-map-of-the-us-counties-that-flipped-to-trump-from-democrats/ ......................................................... 44
Md. Dept. of Planning, Maryland’s 2011
Congressional Districts, available at http://planning.maryland.gov/PDF/Redistricting/2010maps/Cong/Statewide.pdf ........... 15
Mark Brown, Illinois Gerrymandering
Doesn’t Measure Up to Wisconsin, Chi. Sun Times (06/19/2017) ................................. 10
Micah Cohen, Growth of Suburban D.C. Is
Felt Politically in Maryland, N.Y. Times, FiveThirtyEight (Sept. 27, 2012, 8:48 PM) .................................................................... 16
Michael Kang, The Bright Side of Partisan
Gerrymandering, 14 Cornell J.L. & Pub. Pol'y 443, 464 (2005) ......................................... 58
Nicholas Stephanopoulos & Eric McGhee,
Partisan Gerrymandering and the Efficiency Gap, 82 U. Chi. L. Rev. 831, 853 (2015) .................................................... 37, 47

viii
Paul L. McKaskle, Of Wasted Votes and No Influence: An Essay on Voting Systems in the United States, 35 Hous. L. Rev. 1119, 1144-45 (1998) ............................................ 33, 34
Political Polarization in the American Public:
Section 3: Political Polarization and Personal Life, Pew Research Center (June 12, 2014) ................................................. 31
Real Clear Politics, Polls: Georgia 6th District
Run-Off Election – Handel vs. Ossoff (June 20, 2017) .................................................. 48
Real Clear Politics, Polls, Wisconsin: Trump
vs. Clinton, https://www.realclearpolitics.com/epolls/2016/president/wi/wisconsin_trump_vs_clinton-5659.html#polls (last visited July 17, 2017) ............................................................ 58
Saturday Night Live: The Bubble (NBC
television broadcast November 19, 2016) .......... 7 Simone Pathe, It’s Election Day in the Most
Expensive House Race Ever, Roll Call (June 20, 2017 5:04 AM)................................... 48
US Election Atlas, 1992 Presidential Election
Results - Wisconsin, http://uselectionatlas.org/RESULTS/state.php?year=1992&fips=55&f=0&off=0&elect=0&minper=0 (last visited July 14, 2017) .................................................................. 59

ix
USGS, The National Map Small Scale: Illinois, Congressional Districts – 113th Congress, available at https://nationalmap.gov/small_scale/printable/congress.html ........................................... 35
Wis. Elections Comm., 2014 Fall General
Election Results, Ward-by-Ward Election Results for All Offices (2014) ................... 8, 9, 54
Wis. Elections Comm., 2016 Fall General
Election Results, Ward by Ward Original and Recount President of the United States.xlsx (2016) ............................................... 8
Wis. Legislative Tech. Serv. Bureau,
Statewide Congressional Maps, available at http://legis.wisconsin.gov/ltsb/ gis/maps/ ................................................... passim

1
STATEMENT OF INTEREST OF THE AMICUS CURIAE
The National Republican Congressional
Committee (“NRCC”) is the principal national political party committee focused on electing Republican candidates to the United States House of Representatives. Members of the NRCC include all incumbent Republican House Members. A Chairman and the Executive Committee, composed of the Republican House Members, govern the NRCC.1 Most of the NRCC’s Members—excluding only those from states with only one congressional district—each represent a single congressional district whose boundaries are re-established after each decennial census.2
Consequently, a ruling from this Court will directly impact amicus.
1 No party’s counsel authored any part of this brief. No person other than the amicus curiae made a monetary contribution intended to fund the preparation or submission of this brief. On July 13 and July 17, 2017, counsel for Appellants and Appellees, respectively, provided consent to all timely filed amicus briefs. The parties’ letters consenting to the filing of amicus briefs have been filed with the Clerk. 2 The RNC and NRCC jointly filed a brief in this case at the jurisdictional statement stage, and the NRCC hereby readopts that brief.

2
SUMMARY OF ARGUMENT The so-called ‘Efficiency Gap’ is the latest in a
series of quantitative measures put forward in order to attempt to convince Federal and State courts that the ‘problem’ of ‘political gerrymandering’ can be subjected to a manageable, mathematical standard. The ‘Efficiency Gap’ is in reality nothing more than an attempt to impose a state-wide proportional vote requirement for legislative bodies on the basis of statewide vote for candidates in otherwise individualized district by district contests who affiliate with a particular political party.
This proposed ‘Efficiency Gap’ measure, along
with every other quantitative method so far presented, fails to prove a Constitutional and workable test.
First, the ‘Efficiency Gap’ fails because it does
not account for natural political geography. The reality of population distribution in the United States today is that voters who support Democratic candidates tend to live in more densely populated areas. This presents a challenge to the Democratic Party as it seeks to win elections in districts drawn in accordance with traditional redistricting principles – starting with equal population and compactness. We will illustrate this problem by further examining the political geography of Wisconsin and other states.
Second, the remedy to meet the ‘Efficiency
Gap’ test requires bizarrely shaped districts that carve up certain jurisdictions and pair far flung and

3
disparate communities into the same representative districts. In this case, the Wisconsin districts challenged complied with all of the traditional districting criteria and with the requirements of the Wisconsin Constitution. We will present this Court with examples of bizarrely shaped maps adopted by Democrat politicians attempting to preserve political power while eschewing traditional redistricting principles and carving up communities to create districts that they hope will achieve their political goals. While this choice was made in Illinois and Maryland, this Court should not impose such conditions as a national and constitutional requirement.
Third, the ‘Efficiency Gap’ assumes that
voters are monolithic and unchanging in the candidates they support, and will only support candidates of a particular political party. This is simply not the case in the United States. We will present this Court with numerous examples of cases where voters changed candidate of the party they supported both from election cycle to election cycle, and even within the same election cycle.
Finally, the appellee’s attempts to introduce
new research to defend their case fails because it mischaracterizes arguments and ignores the other methodological problems identified herein.
I. The “Efficiency Gap” is a Deeply
Flawed Methodology that Should Not Be a Component of Any Judicially Manageable Standard.

4
“[T]he court... is being asked to elevate the efficiency gap theory from the annals of a single non-peer-reviewed law review article to the linchpin of constitutional elections jurisprudence. This request is made despite the efficiency gap’s significant... limitations....” Whitford v. Gill, 218 F. Supp. 3d 837, 947 (W.D. Wis. 2016) (Griesbach, J., dissenting). In order to show these limitations, amicus has previously argued that the EG is a poor choice for a statistical model on multiple grounds. See Brief of Amici Curiae the Republican Nat’l Comm. & the Nat’l Republican Cong. Comm. in Support of Appellants at 3-8, Whitford v. Gill, (2017) (No. 16-1161) (hereinafter Jurisdictional Brief). First, the EG treats certain votes as “wasted” if they do not assist a candidate’s victory.3 Id. Second, the EG does not take into consideration the political geography of the United States as a whole and urban areas specifically. Id. Third, the EG assumes that proportional representation is constitutionally required. Id at 27-30.
Unsurprisingly there is an additional area where the efficiency gap fails. The math of the EG calculation can itself lead to some very strange
3 As amicus stated in the jurisdictional brief, and it bears repeating here: “Labeling any vote as a ‘wasted’ vote is anathema to any conception of a representative form of government... no vote should ever be considered by the courts or by the people as ‘wasted.’ Every vote and every voter in every precinct plays a vital role in our system of government.” See Jurisdictional Brief at 3-4 n.2.

5
results.4 See Whitford, 218 F. Supp. 3d at 957 (Griesbach, J., dissenting) (noting that ultimately the logic of the efficiency gap is circular). For instance, imagine Scenario 1, which is a heavily gerrymandered state (“State A”) where the “packing” and “cracking” of voters was extreme. This hypothetical state has 4 districts. District 1 and 2 has a ratio of Democrats to Republicans of 70% to 30%. Districts 3 and 4 has a ratio of Democrats to Republicans of 30% to 70%. Assume that the vote total matched those same percentages. The result would be an EG of 0. Therefore, according to the Authors of the EG, there is no evidence in State A of a partisan gerrymander. Cf. id. at 959 (showing that a 75%-25% district results in no efficiency gap because the “wasted” votes cancel each other out.).
Now, imagine Scenario 2. Scenario 2 is a
different state (“State B”) and has been redistricted to have a nearly equal 50/50 split between Democrats and Republicans. Assume the election results are the following: All districts are closely contested but because of a variety of factors (none of which are factored in by the EG) the Democrats sweep every contest, winning by no more than 6% in any district. This election would result in an extremely large EG for State B even though each candidate was
4 As a reminder to the Court, the mathematical formula can be expressed in the following way, EG = Wr/n - Wd/n, where W = “wasted” votes, d and r = individual political parties, and n = total number of votes in the election. See Whitford, 218 F. Supp. 3d at 904 n.276.

6
competitive in each district. The actual EG calculation for Scenario 2 would be as follows: District 1 had a vote of 53% Democrat to 47% Republican; District 2 and 3 each had a vote of 52% Democrat to 48% Republican; and District 4 was the closest contest with a vote of 51% Democrat to 49% Republican. The total EG of this very closely contested election is .47 or 47%. If Appellees succeed, then State A, with completely non-competitive elections, is a non-partisan redistricting and State B is an extremely aggressive Democratic partisan gerrymander that should be reviewed by the courts and found unconstitutional. This result is, of course, absurd. See id. at 956 (“[T]he efficiency gap is merely a somewhat more sophisticated way of saying that [a political party] won a large number of close elections.”); see also id. (“[S]imply stating that there is a high gap does not tell us anything about gerrymandering... even if partisan intent is present; it simply means one side won significantly more close elections than the other.”).
II. The “Efficiency Gap” Does Not Account for the Natural Packing Effect of Political Geography.
In its Jurisdictional Brief, the RNC and
NRCC argued that the political geography of the United States in general, and Wisconsin in particular, has a pronounced effect on the efficiency gap. See Jurisdictional Brief at 3-12. This is a phenomenon that the majority and dissent below and this Court have noted in prior cases. Whitford, 218 F. Supp. 3d at 919 (“Wisconsin’s political geography affords Republicans a modest natural advantage in

7
districting.”); see also Vieth v. Jubelirer, 541 U.S. 267, 290 (2004) (“[P]olitical groups that tend to cluster (as is the case with Democratic voters in cities) would be systematically affected by what might be called a ‘natural’ packing effect.”); id. at 309 (Kennedy, J., concurring) (citing a study on political geography stating that “[c]ompactness standards help Republicans because Democrats are more likely to live in high density regions.”).5 Amicus further argued that the natural result of the EG as a justiciable standard is picking political winners and losers. See Jurisdictional Brief at 6.
Amicus has also argued that Republicans have a natural advantage in redistricting due to political geography. See Jurisdictional Brief at 8-14. This advantage is due to many factors. Id. First, Democrats are highly concentrated in cities while Republicans tend to be disbursed throughout more rural and exurban areas. Id. at 9-10; see also infra Figures 17, 18, 19, and 20. This is a phenomenon that repeats itself in Wisconsin. Jurisdictional Brief at 11. By using examples from other states, amicus argued that maintaining traditional districting criteria coupled with Democratic clustering in cities results in additional Republican seats. Id at 12-14.
5 This natural clustering effect is so widely known that it is accepted as fact in popular culture. See generally Saturday Night Live: The Bubble (NBC television broadcast November 19, 2016) (available at http://www.nbc.com/saturday-night-live/video/the-bubble/3428577?snl=1) (comically describing Brooklyn New York as a progressive utopia of “likeminded freethinkers, and no one else”).

8
By way of example, amicus showed that, in Florida for the Bush-Gore presidential election, “Bush received over 80% of the vote in only 80 precincts, Gore received over 80% [of the vote] in almost 800 precincts.” Jowei Chen & Jonathan Rodden, Unintentional Gerrymandering: Political Geography and Electoral Bias in Legislatures, 8 Q.J. of Pol. Sci. 239, 245 (2013). This same type of phenomenon exists at the ward level in Wisconsin.
For example, in the 2016 presidential election
in Wisconsin, President Trump received 80% or more of the vote in 43 wards, Secretary Clinton received 80% or more of the vote in 260 wards. Wis. Elections Comm., 2016 Fall General Election Results, Ward by Ward Original and Recount President of the United States.xlsx (2016), available at http://elections.wi.gov/elections-voting/results/2016/fall-general. This is not just limited to presidential elections. In the 2014 Wisconsin governor’s race, Republican Scott Walker received 80% or more of the vote in 65 wards. Wis. Elections Comm., 2014 Fall General Election Results, Ward-by-Ward Election Results for All Offices (2014), available at http://elections.wi.gov/elections-voting/results/2014/fall-general. The Democratic challenger received 80% or more of the vote in 248 wards. Id. Finally, there is the 2014 Secretary of State race in which Wisconsin elected a Democrat for Secretary of State but Republicans for all other statewide offices. See infra Table 5. The Republican Secretary of State challenger received 80% or more of the vote in 28 wards, compared to Democrat Doug La Follette receiving 80% or more of the vote in 257

9
wards. Wis. Elections Comm., 2014 Fall General Election Results, Ward-by-Ward Election Results for All Offices (2014). It is also interesting to note that Democratic candidate for Secretary of State, Doug La Follette, outperformed all other Democratic challengers in the 2014 statewide election. See infra Table 1.
Table 1: Data retrieved from Wis. Elections Comm., 2014 Fall General Election Results, Statewide Summary Election Results for All Offices (2014), available at http://elections.wi.gov/elections-voting/results/2014/fall-general.
There are more than 3,000 wards in Wisconsin. The data shows that, while Democratic candidate support is geographically concentrated, Republican support is geographically dispersed. Taken together, this is simply more evidence that Democrats are densely clustered while Republicans are spread out geographically.
III. The “Efficiency Gap” Requires Bizarrely Shaped Districts of The Kind That This Court Previously Rejected.

10
Amicus previously argued that requiring states to apply the EG to their redistricting methodology would result in bizarrely shaped maps that this Court has attempted to avoid. See Jurisdictional Brief at 25-27. Amicus further argued that this Court should refuse to adopt the EG as it will only result in the Court choosing political winners and losers due to political geography. Id at 27.
A. Examples from Illinois and Maryland
Demonstrate the Efforts Undertaken to Account for the Democratic Party’s Political Geography.
Illinois has been cited as a partisan
gerrymander. See Jowei Chen & Jonathan Rodden, Don’t Blame the Maps, N.Y. Times (Jan. 24, 2014), https://www.nytimes.com/2014/01/26/opinion/sunday/its-the-geography-stupid.html (hereinafter Chen, Don’t Blame the Maps); see also Expert Report of Sean P. Trende at ¶ 103, Common Cause v. Rucho, Nos. 16-1026, 16-1164, 2017 U.S. Dist. LEXIS 30242 (M.D.N.C. 2017) ECF No. 73-1 (hereinafter Trende, Expert Report) (stating that Democrats sought to eliminate 5 Republican seats). One of the authors of the EG has stated that Illinois has “quite small efficiency gaps....” Mark Brown, Illinois Gerrymandering Doesn’t Measure Up to Wisconsin, Chi. Sun Times (06/19/2017), http://chicago.suntimes.com/chicago-politics/illinois-gerrymandering-doesnt-measure-up-to-wisconsin/ (quoting Nicholas Stephanopoulos, stating that the EG for Illinois is “below 5 percent” and “they average out to very close to zero”); see also Trende,

11
Expert Report at ¶ 103 (noting that in some years the current Illinois redistricting plan has seen EG’s that indicate the plan favors Republicans.). Comparing the Illinois congressional map to the Wisconsin map, it appears obvious that the reason the efficiency gap is so low in Illinois is because of the Democratic partisan gerrymander not despite it. See infra Figures 1, 7, & 21.
“By artfully dividing up Chicago into pie-sliced districts extending from Lake Michigan into the suburbs, the Illinois Democrats have done better for themselves than the outcome of... nonpartisan simulations.” See Chen, Don’t Blame the Maps. Furthermore, population alone does not force Chicago to be divided up like slices of pizza. A map can be, and has been, drawn that complies with traditional districting principals more so than the current Illinois map. See Comm. for a Fair & Balanced Map v. Ill. State Bd. of Elections, 835 F. Supp. 2d 563, app. C at 596 & app. E at 598. (N.D. Ill. Dec. 15, 2011) (three-judge court); see also infra Figure 1.

12
Figure 1: This figure shows a side-by-side comparison of the Democratic Party gerrymander of Congressional districts in the Chicago area. The figure on the left shows Illinois’ adopted Congressional Districts, which takes great pains to extruded pancake-like shapes reach from the center of Chicago into the suburbs and exurbs. This is in obvious contrast to the map presented by Plaintiffs in Illinois challenging the alleged partisan gerrymander. The “Fair Congressional Map” more faithfully follows traditional districting principles. Pls.’ Mot. for Prelim. Inj. & Expedited Disc. at 26, Comm. for a Fair & Balanced Map v. Ill. State Bd. of Elections, 835 F. Supp. 2d 563 (N.D. Ill. Dec. 15, 2011) (No. 1:11-cv-05065) ECF No. 24.
The same geographic concentrations that are present in other states are present in Illinois, as represented in the following graphic representations of votes received by the Democratic candidate for President in 2016:

13
Figure 2: Kyle Bentle, In Illinois, Chicago-area Clinton Votes Overtook Rest of State, Chi. Trib. (Nov. 9, 2016).

14
http://www.chicagotribune.com/news/data/ct-illinois-president-results-20161108-htmlstory.html.
When the maps from figures 1 and 2 are compared, the reason for the tortured shapes in the enacted Illinois congressional map becomes clear. The Illinois map did exactly what the Plaintiffs in Wisconsin are asking this Court to impose as a constitutional requirement. See supra Figures 1 & 2. Essentially, these maps pancaked the Congressional Districts in northeastern Illinois to minimize the impact of the geographic concentration of regular Democratic Party voters across as many Congressional districts as possible.
Furthermore, in 2011, Maryland’s Democrat controlled legislature adopted a similarly bizarrely shaped map. In the course of rejecting a political gerrymandering claim in Fletcher v. Lamone, Judge Titus’ concurring opinion declared that the intent of Maryland’s enacted congressional map was to disadvantage the incumbent Republican legislator. Fletcher v. Lamone, 831 F. Supp. 2d. 887, 905-06 (D. Md. 2011) (Titus, J., concurring). Judge Titus noted that the enacted congressional map added “several hundred thousand residents of far more densely populated Montgomery County... to the district[]” shattering communities of interest. See id. at 906 (emphasis added). Suburban and highly Democratic Montgomery County differs from rural Garrett County in that Garret County residents farm, mine, and work in paper mills, while Montgomery County

15
residents “do not know what a coal mine or paper mill even looks like.” Id. Judge Titus further explained, “The shape of congressional district three is almost impossible to describe. It includes a snippet of Baltimore City, portions of Baltimore County, a small segment of Montgomery County, a large chunk of Anne Arundel County, and an isolated snippet that includes Annapolis that is detached from the rest of the district and can only be reached by water.” Id.
Figure 3: Md. Dept. of Planning, Maryland’s 2011 Congressional Districts, available at http://planning.maryland.gov/PDF/Redistricting/2010maps/Cong/Statewide.pdf.
Similar to Illinois, the far more densely populated Montgomery County has a substantially different partisan composition than the rural

16
Garrett County, the western-most county in Maryland.
Figure 4: This map reflects the 2008 Presidential vote margins by county. Micah Cohen, Growth of Suburban D.C. Is Felt Politically in Maryland, N.Y. Times, FiveThirtyEight (Sept. 27, 2012, 8:48 PM), https://fivethirtyeight.blogs.nytimes.com/2012/09/27/growth-of-suburban-d-c-is-felt-politically-in-maryland/?mcubz=0.

17
Figure 5: This map reflects the 2016 Presidential vote margins by county. Election 2016, Maryland Results, N.Y. Times (Aug. 1, 2017, 11:22 AM), https://www.nytimes.com/elections/results/maryland?mcubz=0.
The Maryland congressional map is currently the subject of pending litigation in Shapiro v. McManus, 203 F. Supp. 3d 579 (D. Md. 2016) (denying motion to dismiss) (after remand from this Court in Shapiro v. McManus, 136 S.Ct. at 456 (2015)).
The maps in Maryland are yet another illustration of the types of maps and bizarrely shaped districts required for the Democratic Party to deal with their political geography problem when trying to apply traditional districting criteria – particularly the equal population and compactness requirements.
Wisconsin’s General Assembly and

18
congressional district maps by comparison lack any of the snakes, “sacred Mayan bird[s],” “Rorschach ink-blot test[s],” and “uncouth twenty-eight-sided figure[s]” that the Court has identified in other maps. See Shaw v. Reno, 509 U.S. 630, 635, 658 (1993); Gomillion v. Lightfoot, 364 U.S. 339, 340 (1960); Bush v. Vera, 517 U.S. 952, 974 (1996) (O’Connor, J., concurring); see also Figures 9-16; compare Whitford, 218 F. Supp. 3d at 939-40 (Griesbach, J., dissenting) (explaining that Appellees made no attempt to show that districting lines because Act 43 does not violate traditional districting criteria); with Figures 6-8.6
6 This is not to suggest that the states and Congress are powerless to devise limitations on the drafters of maps. States and Congress are free, with certain limitations, to develop and impose redistricting criteria. Congress has so far chosen not to exercise this power for congressional districts beyond requiring the use of single-member districts for seats in the U.S. House of Representatives and the Voting Rights Act. However, several states have imposed enforceable criteria pursuant to state constitutional or legislative authority. See, e.g., League of Women Voters of Fla. v. Detzner, 172 So. 3d 363, 369 (Fla. 2015) (describing Florida’s 2010 constitutional amendment that prohibits the drawing of any district with the intent to favor or disfavor a political party or incumbent).

19
Figure 6: Wis. Legislative Tech. Serv. Bureau, Statewide Congressional Maps, available at http://legis.wisconsin.gov/ltsb/gis/maps/.
B. Wisconsin’s Act 43 Districts Conform to Traditional Districting Criteria.
Compactness, contiguity, respect for jurisdictional boundaries, and incumbent protection

20
have all been identified as traditional districting criteria by the courts. See, e.g., Karcher v. Daggett, 462 U.S. 725, 740 (1983). Act 43 meets all of the typical traditional districting criteria that are used as evidence to determine if specific districts are impermissible gerrymanders. See Whitford, 218 F. Supp. 3d at 940 (Griesbach, J., dissenting) (“Act 43 does not violate any of the redistricting principles that traditionally govern the districting process....”). Furthermore, Appellees did not even argue that Act 43’s districts violated traditional districting criteria. Id. (“[Plaintiffs] conced[e] that the districts drawn by Act 43 are sufficiently compact, contiguous and respectful of political boundaries.”).
Compare Figures 6, 7 and 8 to maps of districts more traditionally identified as gerrymanders. See Vera, 517 U.S. at 987 app. A, 988 app. B, 989 app. C; Shaw, 509 U.S. at 635, 658 app.; Davis v. Bandemer, 478 U.S. 109, 180 n. 21, 183 n. 24 (1986); Hunt v. Cromartie, 526 U.S. 541, at 543, app. (1999); Gomillion, 364 U.S. at 340, app.; compare infra Figures 9-16; with supra Figure 6; and infra Figures 7-8. It is hard not to notice a significant difference between these various maps. The reasons shapes are important is not just visual preference but also so that legislators may identify potential gerrymanders. See Whitford, 218 F. Supp. 3d at 944-45 (Griesbach, J., dissenting). “[M]apmakers (and their critics) will immediately be able to detect when their efforts have produced unusual and suspicious visual results-dragons in flight, salamanders, sick chickens, or any other of the flamboyantly monikered chimeras that creative cartographers have conjured up over the decades.” Id.

21
Figure 7: Wis. Legislative Tech. Serv. Bureau, Statewide Assembly Maps, available at http://legis.wisconsin.gov/ltsb/gis/maps/.

22
Figure 8: Wis. Legislative Tech. Serv. Bureau, Statewide Senate Maps, available at http://legis.wisconsin.gov/ltsb/gis/maps/.

23
Figure 9: “District 30 shows substantial disregard for the traditional districting principles of compactness and regularity....” Vera, 517 U.S. at 966.

24
Figure 10: District 18 “has some of the most irregular boundaries of any congressional district in the country...” Vera, 517 U.S. at 973 (quoting Barone & Ujifusa, Almanac of American Politics 1996, at 1307). Taken together, “Districts 18 and 29 interlock ‘like a jigsaw puzzle... in which it might be impossible to get the pieces apart.’” Id. (quoting Barone & Ujifusa, Almanac of American Politics 1996, at 1307-1308).

25
Figure 11: District 29 “resembles 'a sacred Mayan bird, with its body running eastward along the Ship Channel from downtown Houston until the tail terminates in Baytown. Spindly legs reach south to Hobby Airport, while the plumed head rises northward almost to Intercontinental airport.... In the western extremity of the district, an open beak appears to be searching for worms in Spring Branch. Here and there, ruffled feathers jut out at odd angles.'” Vera, 517 U.S. 973-74 (quoting Barone & Ujifusa, Almanac of American Politics 1996, at 1335).

26
Figure 12: District 12 “winds in a snakelike fashion through tobacco country, financial centers, and manufacturing areas....” Shaw, 509 U.S. at 635.
Figure 13: “[O]ne Democratic voter remarked when the Senate plan was unveiled: People who live near the [district line separating Senate districts 33 and

27
34] are going to need an Indian guide and a compass to figure out which district they're in.” Bandemer, 478 U.S. at 183 n. 24 (Powell, J., concurring in part and dissenting in part) (internal quotations omitted).
Figure 14: This map “shows... grotesque gerrymandering.” Bandemer, 478 U.S. at 180 n. 21 (Powell, J., concurring in part).
Figure 15: “[W]hile District 12 is wider and shorter than it was before, it retains its basic ‘snakelike’ shape...” Cromartie, 526 U.S. at 543, app.

28
Figure 16: Probably one of the most famous example of gerrymandering is the “uncouth twenty-eight-sided figure” in Gomillion v. Lightfoot. Gomillion, 364 U.S. at 340, app.
C. The EG, When Combined with Current Political Geography, Mathematically Forces Resettlement of Voters into Non-Similar Voting Communities.
As previously shown, Democratic voters tend
to cluster in population centers and Republican voters tend to live in more rural areas. The question remains, is this phenomenon reflective of party affiliation or also political ideology? The data on the concentration of liberals in major urban areas is extensive. For example, in 50 of the 67 cities in the

29
United States with a population of over 250,000, the people lean liberal in their political outlook. See Chris Tausanovitch & Christopher Warshaw, Representation in Municipal Government, Am. Pol. Sci. Rev. 605, 609 fig. 1 (hereinafter Tausanovitch, Municipal Government).

30
Figure 17: Tausanovitch, Municipal Government at fig. 1.
The underlying issue is not one of pure happenstance, but rather is a complex set of variables that includes history and personal

31
preference. A study from 2014 asked individuals where they would prefer to live “if they could live anywhere in the U.S.” Political Polarization in the American Public: Section 3: Political Polarization and Personal Life, Pew Research Center (June 12, 2014), http://www.people-press.org/2014/06/12/section-3-political-polarization-and-personal-life/; see infra Figure 18.
Figure 18: Id.
As amicus has shown, this result is not
surprising given the current distribution of voters.

32
Of those individuals who consider themselves “consistently liberal” 66% of them prefer to live in urban or suburban environments. Id. Compare that to the 76% of people who consider themselves as consistently conservative who would choose to live in rural areas and small towns. Id.
Similarly, those who view themselves as
“consistently conservative” prefer more space than those who identify as “consistently liberal.” Id.; see infra Figure 19.
Figure 19: Id.
Wisconsin, for example, has its primary population centers to the east-southeast of the state. See Malia Jones & Caitlin McKown, How and Where Trump Won Wisconsin in 2016, WisCONTEXT (Nov. 21, 2016, 3:00 PM), https://www.wiscontext.org/how-and-where-trump-

33
won-wisconsin-2016 (hereinafter Jones, How and Where Trump Won); see infra Figure 20. The majority of Wisconsin is geographically rural. See Id. Only state legislatures are equipped to balance all of the various legal requirements of redistricting along with the needs of the people and their chosen communities.
Figure 20: Jones, How and Where Trump Won.
Grouping people into compact districts is not
an end in and of itself. Compact districts allow citizens to better engage in the political process. Whitford, 218 F. Supp. 3d at 944 (Griesbach, J., dissenting) (quoting Paul L. McKaskle, Of Wasted

34
Votes and No Influence: An Essay on Voting Systems in the United States, 35 Hous. L. Rev. 1119, 1144-45 (1998)). “Disregard of compactness... destroys some of the advantages of single-member districts, including a sense of community and an awareness of what areas a district includes.... Disregard of compactness also substantially impairs the ability of candidates to organize on a grass-roots basis.” Id; see also id (“[L]iving in a bizarrely-shaped district is part of the injury a voter suffers in an unconstitutional gerrymander.”). The EG does not factor into its calculations traditional districting criteria. The natural result of the EG’s mathematical formula is to create non-compact districts to achieve a lower EG, irrespective of how communities and political subdivisions are actually organized. Thankfully, no state has as of yet been forced to redistrict in order to comply with the EG. However, one need look no further than Illinois to see what may result in a redistricting informed by the EG. The Illinois redistricting carved up Chicago into pie like slices in order to crack more suburban Republican voters. See Chen, Don’t Blame the Maps; see also infra 35-36; infra Figure 21; supra Figure 1. Democrats did this because so much of their voting base is concentrated in Chicago. See supra Figure 2. Researchers have shown that non-partisan simulations result in more Republican seats than the current plan. See Chen, Don’t Blame the Maps. However, Democrats show a small EG, likely due to the political geography of the state. See Trende, Expert Report at ¶ 103; see also supra pp. 10-19. It appears likely that, under the EG, densely populated Democratic strongholds in Dane and Milwaukee

35
Counties would be similarly carved up to spread Democratic influence to the more Republican outlying areas.
Figure 21: USGS, The National Map Small Scale: Illinois, Congressional Districts – 113th Congress, available at https://nationalmap.gov/small_scale/printable/congress.html.

36
By comparison, the Wisconsin districts are
easily understandable because they are compact instead of being grotesquely shaped to account for the political geography of Democrats. It is easy to see, if one compares Illinois to Wisconsin, that the lines in Wisconsin are quite straight by comparison. Compare supra Figures 1, 2, & 21, with supra Figures 6-8 & 20. The districts, of course, very by size due to population considerations. However, the Wisconsin map generally keeps people who live in similar communities together. See supra Figures 6-8.
The EG does not “care about” voters - it
simply groups voters based on votes cast in district-by-district elections aggregated statewide to satisfy a mathematical formula. “It may be worth pointing out that the Justices’ desire for normal-looking districts is not a purely aesthetic conceit, or a “beauty contest.” Whitford, 218 F. Supp. 3d at 944 (Griesbach, J., dissenting) (citing Vera, 517 U.S. at 977 (1996)). This Court should allow legislatures and not mathematical formulas decide how voters are grouped.
D. The “Efficiency Gap” Generally Fails to Recognize Democratic Gerrymanders.
A natural outgrowth of the current political
geography of the United States is that the EG fails to regularly identify what are obvious Democratic gerrymanders. As has been previously noted, the EG results in some very strange outcomes due to how it is calculated and the fact that the EG ignores political geography only serves to amplify that fact.

37
See supra pp. 4-6, 10-19. The EG has as its baseline for a completely even election at 0% EG, and essentially distributes all votes across any state into competitive districts. Nicholas Stephanopoulos & Eric McGhee, Partisan Gerrymandering and the Efficiency Gap, 82 U. Chi. L. Rev. 831, 853 (2015) (hereinafter Stephanopoulos, Efficiency Gap). If spatial clustering of voters exists, it places into question one of the EG’s principal assumptions: should the baseline of the EG in a state with significant vote clustering be 0%?
The expert report of Sean P. Trende in
Common Cause v. Rucho illustrates this concern. See Rucho, 2017 U.S. Dist. LEXIS 30242 (denying motion to dismiss political gerrymandering claim). Because of the natural clustering effect of Democrats, an argument to minimize a Republican EG “effectively becomes a constitutional requirement for states to make ‘make up calls’ for inefficient vote distributions, rather than a remedy for gerrymandering.” Trende, Expert Report at ¶¶ 35-38. This is not simply a hypothetical phenomenon, one need only look at past gerrymanders to see this at work.
For example, the Illinois redistricting of 2011, where Democrats controlled the state legislature and the governor’s office, created a map that was designed to eliminate up to six Republican seats. There, Republicans were blocked from participating in drawing maps. For example, Republican legislators were prevented from receiving the “shape” files—the census block numbers—and thus Republicans were not able to effectively evaluate the

38
Democrat proposed maps. Comm. for a Fair & Balanced Map v. Ill. State Bd. of Elections, 835 F. Supp. 2d 563, 572 (N.D. Ill. 2011) (three-judge court). The Democratic Congressional Campaign Committee communicated with Illinois Democrat legislators stating that the goal of its redistricting efforts was to maximize Democrat performance. See id. See also Trende, Expert Report at ¶ 102. Accordingly, “by artfully dividing up Chicago into pie-sliced districts extending from Lake Michigan into the suburbs, the Illinois Democrats have done better for themselves than the outcome of our nonpartisan simulations.” Chen, Don’t Blame the Maps; see supra Figure 1. However, “over the course of the plan’s implementation, its efficiency gap has actually been negative, indicating a slight Republican lean.” Trende, Expert Report at ¶ 103. Ultimately, the three-judge court upheld the map from a partisan gerrymandering challenge because the plaintiffs failed to present a workable standard to adjudicate a partisan gerrymandering claim. See Comm. for a Fair & Balanced Map, 835 F. Supp. 2d at 567.
Another good example of this phenomenon is in North Carolina, shown in Figure 22. North Carolina’s 1992 12th district, and the entire 1992 statewide map, is a rather infamous example of Democratic gerrymandering. See generally Shaw, 509 U.S. at 630. However, in 1994, this map produced an EG that shows a Republican gerrymander. Trende, Expert Report at ¶ 126. Furthermore, the maps drawn in 1998 and 2000 both produce slight Republican EG’s but the State sought to defend these maps in court, “in part on the

39
grounds that they were a Democratic gerrymander.” Id. at ¶ 129; see generally Shaw, 509 U.S. at 630.
Figure 22: 1991 North Carolina Congressional District Map. Trende, Expert Report at ¶ 126.
The EG is a bad metric for attempting to determine partisan gerrymanders on many fronts. However, the most dangerous way the EG fails is at the same time its most insidious. Once again, due to political geography and compliance with traditional districting criteria the EG simultaneously over-exaggerates Republican enacted maps, showing them as gerrymanders, and under-exaggerates Democrat enacted maps, showing them as non-gerrymanders. A mathematical equation that appears biased in its application cannot and should not be adopted by this Court.
E. Appellees’ “Efficiency Gap” Is Biased Towards Democrats and Is Likely to Cause Constitutional Conflict with Section Two of The Voting Rights Act.

40
Amicus has previously argued that adopting the “efficiency gap” as a test for partisan gerrymandering creates conflicts between districting plans and Section 2 of the Voting Rights Act (“VRA”). See Jurisdictional Brief at 15-25. Amicus has further argued, through a set of hypotheticals proposed by Professor M.V. Hood III, that the VRA and the EG reveal an underlying bias in “efficiency gap” analysis. See id. Specifically, the EG disguises the typical Democratic political gerrymander while falsely labeling Voting Rights Act remedial plans as political gerrymanders. See id; Vieth, 541 U.S. at 308-09 (Kennedy, J., concurring); Colegrove v. Green, 328 U.S. 549, 556 (1946) (exhorting that courts should not enter the “political thicket” of redistricting). Therefore, amicus concluded, the “efficiency gap” is a defective and deficient standard for determining an equal protection violation.
Speaking broadly, the Voting Rights Act
intersects with the EG by mandating that states create minority-majority or minority crossover districts. This fact further exacerbates the political geography problem already discussed. Chen et al. observed that “[s]ince minority groups protected under the VRA tend to vote overwhelmingly Democratic, districts produced by racial gerrymandering will likely be as distinct... as those produced by partisan gerrymandering.” Jowei Chen & David Cottrell, Evaluating Partisan Gains from Congressional Gerrymandering: Using Computer Simulations to Estimate the effect of Gerrymandering in the U.S. House, 44 Electoral Stud. 329, 336 (2016). Since the EG does not take into account VRA districts the EG is just as likely to measure an effect

41
mandated by the VRA as it is a partisan gerrymander.
Since the submission of amicus’ jurisdictional
statement, the Court decided Cooper v. Harris. The recent decision in Cooper v. Harris does nothing to fundamentally change amicus’ analysis of how the EG interacts with VRA districts. The Voting Rights Act still requires legislatures to allow for “racial minorities to elect their preferred candidates” as long as race does not predominate over other considerations and, if it does, the state was compelled in order to comply with the VRA. Cooper v. Harris, 137 S. Ct. 1455, 1464 (2017) (quoting Beer v. United States, 425 U.S. 130, 141 (1976)). Section 2 remedial plans still require majority-minority districts depending on the outcome of the application of the Gingles preconditions. Cooper, 137 S.Ct. at 1470. Furthermore, if approximately 90% of African-American voters continue to vote for Democrats then the Voting Rights Act will continue to significantly impact the political redistricting landscape. See Cooper, 137 S.Ct. at 1488 n.3 (Alito, J. dissenting).
IV. Voters’ Preferences Are Not Monolithic and Unchanging, Contrary to the Assumptions of the “Efficiency Gap”
There is also a basic assumption that most
academic commentators and even legislatures make when drawing districts. Namely, when they identify voters by party affiliation, the voters will always vote for the political party with which they have been identified. This is a rather large assumption

42
that appears to be unfounded. “Party affiliation is not set in stone or in a voter’s genes...” Whitford, 218 F. Supp. 3d at 936 (Griesbach, J., dissenting) (“The assumption underlying Plaintiffs’ entire case is that party affiliation is a readily discernable characteristic in voters and that it matters above all else in an election.”); see Vieth, 541 U.S. at 287 (“Political affiliation is not an immutable characteristic, but may shift from one election to the next; and even within a given election, not all voters follow the party line. We dare say (and hope) that the political party which puts forward an utterly incompetent candidate will lose even in its registration stronghold.”).
The 2016 presidential election shows how
voting preference can drastically change based, not on party identification, but on the appeal of individual candidates. Since November 2016, multiple studies have undertaken to show how many citizens switched party allegiances based on candidate preference in the presidential election.7 Specifically, these studies have looked at how many people who voted for President Obama in 2012
7 It should be noted that the rush to study this phenomenon was largely based on the failures of statistical polling methods that agreed that Hillary Clinton had a 70-99% chance of wining the election. Andrew Mercer, Claudia Deane, & Kyley McGeeney, Why 2016 Election Polls Missed Their Mark, Pew Research Center (Nov. 9, 2016), http://www.pewresearch.org/fact-tank/2016/11/09/why-2016-election-polls-missed-their-mark/.

43
switched their vote to candidate Trump in 2016. See Geoffrey Skelley, Just How Many Obama 2012-Trump 2016 Voters Were There?, Rasmussen Reports (June 01, 2017), http://www.rasmussenreports.com/public_content/political_commentary/commentary_by_geoffrey_skelley/just_how_many_obama_2012_trump_2016_voters_were_there (hereinafter Skelley, Rasmussen).
Figure 23: Map Showing Change in Republican Vote Margin by County. Skelley, Rasmussen at Map 1.
Figures 23 and 24 show just how big a swing
voter preferences can have at the county level. The Midwestern United States specifically shows a striking change in voter preferences. In fact, a

44
significant number of counties in Michigan, Pennsylvania, and Wisconsin (states President Obama won in 2012) all increased in Republican margin by at least 10 points in favor of President Trump. Skelley, Rasmussen. For example, Juneau County, Wisconsin voted for President Obama over Mitt Romney 52% to 47%. Mark Fahey & Nicholas Wells, The Places That Flipped and Gave the Country to Trump, CNBC, http://www.cnbc.com/heres-a-map-of-the-us-counties-that-flipped-to-trump-from-democrats/ (accessed on 7/20/2017) (mouse over specific counties for county-by-county results). However, the same county voted for President Trump 62% to Secretary Clinton’s 35%. Id. Twenty-two Wisconsin counties that voted for President Obama in 2012 voted for President Trump in 2016. See generally Jessica Taylor, The Counties that Flipped from Obama to Trump, in 3 Charts, National Public Radio (Nov. 15, 2016, 12:26 PM), http://www.npr.org/2016/11/15/502032052/lots-of-people-voted-for-obama-and-trump-heres-where-in-3-charts.

45
Figure 24: Id.
Additionally, there have been three different studies that looked at the number of President Obama to President Trump vote switchers. Each of the studies mark a significant shift in voter preference based on the candidate.
Table 2: Makeup of Clinton and Trump Voters by 2012 Presidential Vote. Skelley, Rasmussen at Tbl. 1.

46
Table 3: Makeup of Clinton and Trump Voters by 2012 Presidential Vote. Skelley, Rasmussen at Tbl. 2.
Table 4: Makeup of Clinton and Trump Voters by 2012 Presidential Vote. Skelley, Rasmussen at Tbl. 3.
Tables 1-3 demonstrate the phenomenon represented in Figures 23 and 24 except now at the national level. Based on the three polling studies represented, Trump won between 11% and 13% of President Obama’s 2012 voters. See Skelley, Rasmussen. Appellee’s expert proposed that an EG of just 7% would be a threshold for proving partisan effect. See Whitford, 218 F. Supp. at 860-61. The authors of the EG argue instead for an EG of 8% as prima facie evidence of unconstitutionality in state

47
house plans. See Stephanopoulos, Efficiency Gap. However, under either proposal the latest presidential vote seems to lay bare the assertion that any perceived electoral lead or voter block is monolithic and inflexible.
It is not just in nationwide elections where voter preferences show flexibility. Congressional districts are just as susceptible to changing voter preferences based, not on party affiliation, but on the individual candidate. A recent example of voter preferences rather than party affiliation at work is the recent election in the Georgia 6th congressional district.
Secretary Tom Price won the 2016 election for
his then-Congressional seat by 23%, the 2014 election by 32%, and the 2012 election by 29%. Ballotpedia, Georgia’s 6th Congressional District, https://ballotpedia.org/Georgia%27s_6th_Congressional_District (last visited July 21, 2017). In fact, a Republican has been the congressional representative of the Georgia 6th since Newt Gingrich won the seat in 1978. Id. One could assume that Republicans are nearly invincible in the Georgia 6th. However, Karen Handle, a Republican, only defeated the Democratic Party challenger by 3.6%. Id. Appellees and other proponents of the EG would have us believe that the Georgia 6th was an unwinnable partisan gerrymander, when in fact the Republican candidate was able to hold on to victory after a vigorous electoral competition resulting in the most expensive House race in the history of the

48
United States.8 Even more telling, is that the majority of polling leading up to this election had the Democratic challenger winning by as much as 7%.9 Real Clear Politics, Polls: Georgia 6th District Run-Off Election – Handel vs. Ossoff (June 20, 2017), https://www.realclearpolitics.com/epolls/2017/house/ga/georgia_6th_district_runoff_election_handel_vs_ossoff-6202.html.
Another example of crossover or split ticket
voting can be found in New Jersey’s 5th congressional district. The New Jersey 5th includes portions of Warren, Sussex, Passaic, and Bergen counties. Ballotpedia, New Jersey’s 5th Congressional District, https://ballotpedia.org/New_Jersey%27s_5th_Congressional_District (last visited July 26, 2017) (hereinafter Ballotpedia, New Jersey 5th. A Republican has held the New Jersey 5th for the entirety of the last two redistricting cycles. Id. President Trump won a majority of votes in this
8 See Simone Pathe, It’s Election Day in the Most Expensive House Race Ever, Roll Call (June 20, 2017 5:04 AM) http://www.rollcall.com/news/politics/most-expensive-house-race-jon-ossoff-karen-handel. As much as this is an argument that voter preferences matter it is also a reminder that incumbency matters. Any method of calculating partisanship, like the EG, that does not address the issue of incumbency is a poor metric indeed. 9 The fact that so many statistical models were wrong about so many elections should give the Court pause before adopting any statistical method to determine the outcome of redistricting cases nationwide.

49
congressional district in the 2016 presidential election. David Nir, Daily Kos Elections’ Presidential Results by Congressional District for the 2016 and 2012 Elections, Daily Kos, https://www.dailykos.com/stories/2012/11/19/1163009/-Daily-Kos-Elections-presidential-results-by-congressional-district-for-the-2012-2008-elections (last visited July, 31 2017) (hereinafter Nir, Daily Kos Elections).
If voters choose candidates by political party
and nothing else, then one should be able to safely assume a Republican won this district in 2016. However, a Democrat won the district 51.1% to 46.7% against an incumbent who held the seat since 2003. Ballotpedia, New Jersey 5th. Democrats in congress also won a number of districts in which President Trump won the popular vote in those respective districts.10 Nir, Daily Kos Elections. Conversely, Republicans won a number of districts in which Secretary Clinton won the popular vote.11 Id.
10 The following is a list of all congressional districts held or gained by Democrats but won by President Trump in 2016: Arizona 1st, Illinois 17th, Iowa 2nd, Minnesota 1st, 7th, and 8th, New Hampshire 1st, New Jersey 5th, New York 18th, Nevada 3rd, Pennsylvania 17th, and the Wisconsin 3rd. See Nir, Daily Kos Elections. 11 The following is a list of all congressional districts held or gained by Republicans but won by Secretary Clinton: Arizona 2nd, California 10th, 21st, 25th, 39th, 45th, 48th, and 49th, Colorado 6th, Florida 26th and 27th, Illinois 6th, Kansas 3rd, Minnesota 3rd, New Jersey 7th, New York 24th, Pennsylvania 6th and 7th,

50
This illustrates precisely how nearly any district can be won or made competitive by a candidate with the proper mix of effort, policy positions, public appeal, and media attention. Or to put it a different way,
Imagine a voter who votes for a Democratic assemblyman, a Republican state senator and a Republican governor. What are we to make of such a ballot, except to conclude that the voter is expressing individual preferences about individual races, rather than some kind of global desire to increase seats for a given party? Whitford, 218 F.Supp. 3d at 956 (Griesbach,
J., dissenting).
A. Wisconsin Voters, Much Like Voters in the Rest of the United States, are not Monolithic.
There have been several high-profile examples
of Wisconsin voters opting for candidates based, not on party preference, but on the candidates themselves. Until 2016, the state of Wisconsin has voted for a Democrat in every presidential election since 1984. See Courtney Kueppers, Trump Becomes First Republican Presidential Candidate Since 1984 to Win Wisconsin, Wisconsin Public Radio (Nov. 8, 2016), http://www.wpr.org/trump-becomes-first-republican-presidential-candidate-1984-win-
Texas 7th, 23rd and 32nd, Virginia 10th, and the Washington 8th. Id.

51
wisconsin. However, Wisconsin has had a Republican Governor since 2010. Ballotpedia, Governor of Wisconsin, https://ballotpedia.org/Governor_of_Wisconsin (last visited July 25, 2017). Typically, Wisconsin voters do not vote for President and Governor in the same year, however, in 2012 Wisconsin voters held a recall election in an attempt to remove Governor Walker. Id.

52
Figure 25: Wis. Legislative Tech. Serv. Bureau, 2012 Republican Gubernatorial Map, available at http://legis.wisconsin.gov/ltsb/gis/maps/.
.

53
Figure 26: Wis. Legislative Tech. Serv. Bureau, 2012 Republican Presidential Election Map, available at http://legis.wisconsin.gov/ltsb/gis/maps/.
Figures 25 and 26 show just how big the vote difference was between the 2012 presidential election
54
and gubernatorial recall election.12 Wards throughout the western half of the state voted for Governor Walker in June and President Obama in November. See supra Figures 25, 26; see also Whitford, 218 F.Supp. 3d at 937 (Griesbach, J., dissenting) (explaining the difference in voter preference between presidential and gubernatorial elections, “[c]andidates for state offices run on different issues than candidates for national offices, which presumably explains the difference in voter turn-out and results...”).
This is not a phenomenon limited to elections
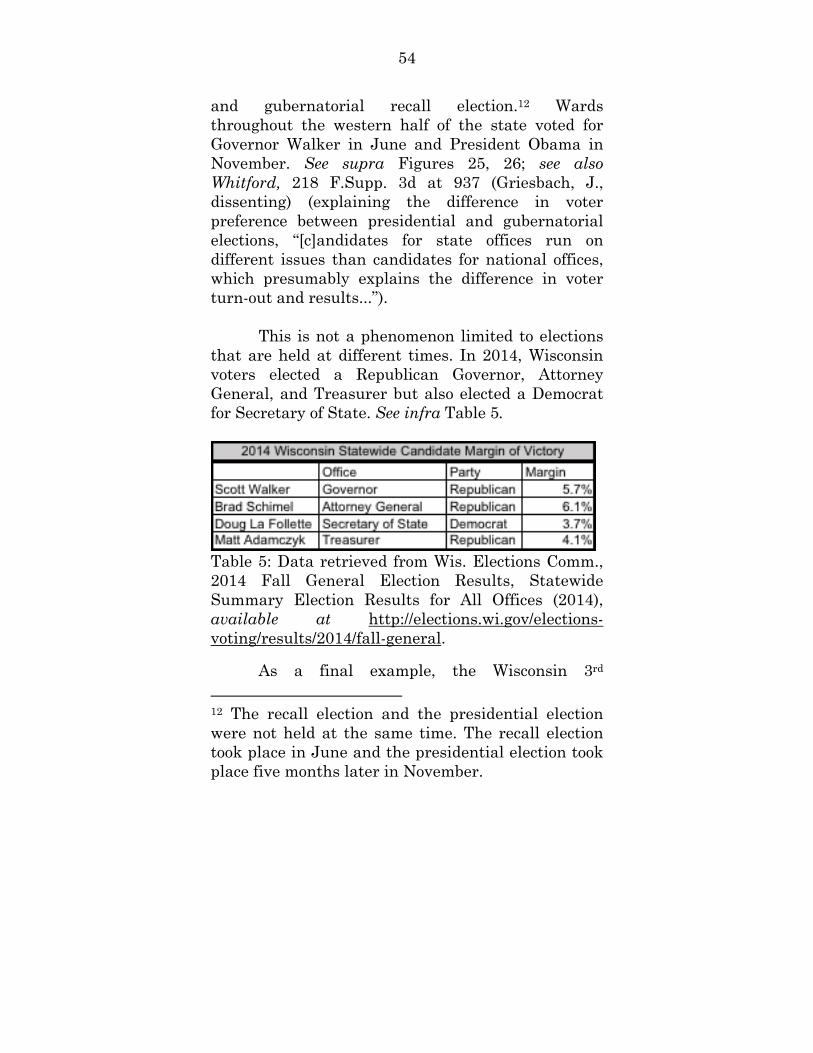
that are held at different times. In 2014, Wisconsin voters elected a Republican Governor, Attorney General, and Treasurer but also elected a Democrat for Secretary of State. See infra Table 5.
Table 5: Data retrieved from Wis. Elections Comm., 2014 Fall General Election Results, Statewide Summary Election Results for All Offices (2014), available at http://elections.wi.gov/elections-voting/results/2014/fall-general.
As a final example, the Wisconsin 3rd 12 The recall election and the presidential election were not held at the same time. The recall election took place in June and the presidential election took place five months later in November.
55
congressional district was won by a Democrat incumbent who ran unopposed. Hope Kirwan, Ron Kind Running Unopposed For Congressional Seat, Wisconsin Public Radio (Nov. 3, 2016, 9:40 AM) https://www.wpr.org/ron-kind-running-unopposed-congressional-seat (Republican District Chair for the 3rd District Brian Westrate stated that conservation of resources was more important than “a placeholder campaign” in the Wisconsin 3rd.). President Trump won the vote in the same district. Nir, Daily Kos Presidential Elections. No one knows what would have happened had the Republican Party put a challenger in that district. However, it does illustrate the point that more goes into congressional elections than placing a person with the “correct” party affiliation on the ballot.
Furthermore, this Court has presciently stated
that “[t]he existence or degree of asymmetry may in large part depend on conjecture about where possible vote-switchers will reside.” League of United Latin Am. Citizens v. Perry (LULAC), 548 U.S. 399, 420 (plurality opinion). Any method for determining partisan gerrymandering thus far presented assumes no, or very little, vote switching. The fact that the EG looks backwards at previous elections does little to abate the fact that in politics, past success does not automatically result in future success. One need look no further than the 2016 presidential election to see this at work.

56
V. Appellees Reliance on New, Yet Unpublished, Research Is Misguided Because It Mischaracterizes Amicus’ Arguments and Ignores the Methodological Problems of the Research Itself.
Appellees note in their Motion to Affirm that a
recent paper “disprove[s] any assertion that Wisconsin voters’ spatial patterns are responsible for Act 43’s skew.”13 Appellees’ Mot. to Affirm at 15, Whitford v. Gill, (2017) (No. 16-1161). This paper, which does not appear to have been publicly available at the time of the trial in this matter, simply affirms what Amicus has previously argued which is that the political geography of Wisconsin has a noticeable effect on any attempt at even a “neutral” districting.14 For example, using a computer simulation of 200 “non-partisan” districting plans and then calculating those plans’ EG resulted in the vast majority of simulated plans
13 It is important to note here that this paper was not published at the time Appellee’s relied on it in their brief. Furthermore, at the time of this brief the paper cited has still not been published. 14 Whenever the idea of “neutral” redistricting standards are introduced it is important to note the words of this Court that, “[i]t may be suggested that those who redistrict and reapportion should work with census, not political, data... [b]ut this politically mindless approach may produce... the most grossly gerrymandered results." Bandemer, 478 U.S. at 129 (White, J., plurality opinion) (quoting Gaffney v Cummings, 412 U.S. 735, 753 (1973)).

57
having a noticeable Republican electoral advantage. See Jowei Chen, The Impact of Political Geography on Wisconsin Redistricting: An Analysis of Wisconsin’s Act 43 Assembly Districting Plan, Election L. J.: Rules, Pol., Pol’y (June 2017) (not yet published) (hereinafter Chen, Wisconsin Redistricting).15 The author attempts to show that Act 43 is an outlier compared to the computer simulations that were run based on the EG metric. See Chen, Wisconsin Redistricting at Figures 1-7.
There are several problems with Appellee’s
reliance on this paper. First, the paper never addressed incumbency, which is a key traditional neutral redistricting criterion. Vera, 517 U.S. at 964 (“[W]e have recognized incumbency protection, at least in the limited form of, ‘avoiding contests between incumbents,’ as a legitimate state goal.”) (quoting Karcher v. Daggett, 462 U.S. 725, 740 (1983). The papers’ lack of addressing incumbency related concerns is even more perplexing since incumbency protection was specifically at issue in the court below. See Whitford, 218 F. Supp. 3d at 849 n.34 (Senate Majority Leader staff member, Tad Ottman testified, “where incumbents lived ‘matter[s] because in the end this was a map that we were going to ask the Legislature to vote for and we knew that was one of the considerations that was going to be very important’ [to them].”).
In fact, there are several notable examples of
so-called “bipartisan gerrymanders” where mixed
15 Not yet published article available at http://www-personal.umich.edu/%7Ejowei/.

58
legislatures who could not pass their own plan, instead brokered a deal where each party’s incumbents retained their seats. Michael Kang, The Bright Side of Partisan Gerrymandering, 14 Cornell J.L. & Pub. Pol’y 443, 464 (2005). See Gaffney v. Cummings, 412 U.S. 735 (1973).
Second, the author uses Mitt Romney’s share
of the November 2012 two party presidential vote, which is both out of date and not reflective of the vote in assembly or congressional voting districts. See Chen, Wisconsin Redistricting at 11. It is likely that data from the latest Presidential election would greatly impact Chen’s results.16 President Trump was the first Republican to win Wisconsin since Ronald Reagan did in 1984. See Courtney Kueppers, Trump Becomes First Republican Presidential Candidate Since 1984 to Win Wisconsin, Wisconsin Public Radio (Nov. 8, 2016), http://www.wpr.org/trump-becomes-first-republican-presidential-candidate-1984-win-wisconsin.17 Conversely, Secretary Clinton received the lowest
16 Keep in mind that this was not a paper published before the election, the date listed on the as yet unpublished piece is June 2017, there was plenty of time to incorporate new data into the model. 17 The statistical polling models also predicted President Trump would lose by between 3 and 16 percentage points. Real Clear Politics, Polls, Wisconsin: Trump vs. Clinton, https://www.realclearpolitics.com/epolls/2016/president/wi/wisconsin_trump_vs_clinton-5659.html#polls (last visited July 17, 2017). In fact, no published poll showed President Trump winning Wisconsin. Id.

59
percentage of any Democratic candidate in Wisconsin since President Clinton did, in a three-way race that had Ross Perot getting over 20% of the vote. US Election Atlas, 1992 Presidential Election Results - Wisconsin, http://uselectionatlas.org/RESULTS/state.php?year=1992&fips=55&f=0&off=0&elect=0&minper=0 (last visited July 14, 2017). This seemingly large switch in partisan voters will drastically effect any EG calculation.
Finally, amicus has never contended, and do
not contend here, that political geography is the only reason for the make up of Wisconsin’s current redistricting plan. See Whitford, 218 F. Supp. 3d at 963 (Griesbach, J., dissenting) (“Even if geography does not explain the entire gap, and even if it plays only a ‘modest’ role... it would seriously undermine the notion that the Republicans in this case engaged in a partisan gerrymander of historic proportions.”) (emphasis in the original).
Amicus has instead argued the following: 1)
the political geography of Wisconsin has an effect on redistricting, 2) the EG ignores political geography, 3) because the EG ignores the realities of political geography it overstates the partisanship of Act 43, and 4) the EG fails to account for the reality of incumbent officials who are generally well known in their districts seeking re-election.
Additionally, as this Court has said, “we are
wary of adopting a constitutional standard that invalidates a map based on unfair results that would occur in a hypothetical state of affairs.” LULAC, 548

60
U.S. at 420 (discussing the reliability of choosing a model that does not take into account possible vote switchers). Can there be anything more hypothetical than running 200 computer simulations based on years old non-district specific voting data and then applying a metric based on proportional voting, the EG, to tell a state legislature that they should have, and were constitutionally required, to do better?
CONCLUSION
In conclusion, despite Justice Kennedy’s hope in Vieth that technology may be a way forward in determining partisan gerrymanders, the EG, as a metric of determining those gerrymanders, is hopelessly flawed. See Vieth, 541 U.S. at 313 (Kennedy, J., concurring) (“[T]echnologies may produce new methods of analysis that make more evident the precise nature of the burdens gerrymanders impose on the representation rights of voters and parties.”).
Amicus urges the Court, for the
aforementioned reasons, to reject the efficiency gap as a metric in gerrymandering cases and reverse the district court’s ruling.
Respectfully submitted, Jason Torchinsky Counsel of Record J. Michael Bayes Shawn Toomey Sheehy Phillip M. Gordon Holtzman Vogel Josefiak Torchinsky PLLC

61
45 North Hill Drive Suite 100 Warrenton, VA 20186 (540) 341-8808 (540) 341-8809 [email protected] P. Christopher Winkelman National Republican Congressional Committee 320 First Street, SE Washington, DC 20003 202-479-7000 202-484-2543
August 4, 2017.