using vprobes for intrusion detection
TRANSCRIPT
Using VProbes for Intrusion Detection
by
Alexander Worthington Dehnert
Submitted to the Department of Electrical Engineering and ComputerScience
in partial fulfillment of the requirements for the degree of
Master of Engineering in Computer Science and Engineering
at the
MASSACHUSETTS INSTITUTE OF TECHNOLOGY
June 2013
@ Massachusetts Institute of Technology 2013. All rights reserved.
A uthor ...... ...............
Department of Electrical Engineering and Computer ScienceMay 24th, 2013
Certified by............-----V M. Frans Kaashoek
Charles Piper Professor, MIT EECSThesis Supervisor
C ertified by ... .............................Ricardo Gonzalez
Manager, VMware VProbesThesis Supervisor
Accepted by .... ........
Prof. Dennis M. Freeman
Chairman, Masters of Engineering Thesis Committee

Using VProbes for Intrusion Detection
by
Alexander Worthington Dehnert
Submitted to the Department of Electrical Engineering and Computer Science
on May 24th, 2013, in partial fulfillment of the
requirements for the degree ofMaster of Engineering in Computer Science and Engineering
Abstract
Many current intrusion detection systems (IDSes) are vulnerable to intruders because
they are running under the same operating system (OS) as a potential attacker. Since
an attacker will often be attempting to co-opt the OS, this leaves the IDS vulnerable
to subversion by the attacker. While some systems escape this threat, they typically
do so by running the OS inside a modified hypervisor. This risks of adding new bugs
that reduce the correctness or security of the hypervisor, and may make it harder
to incorporate upstream improvements. VMware has a technology called VProbes
that allows setting breakpoints, examining machine state, and inspecting memory
from a VM host. This thesis introduces VProbe Instrumentation for VM Intrusion
Detection (VIVID), which makes subverting the instrumentation much harder while
still allowing the use of an off-the-shelf hypervisor.
Thesis Supervisor: M. Frans KaashoekTitle: Charles Piper Professor, MIT EECS
Thesis Supervisor: Ricardo GonzalezTitle: Manager, VMware VProbes
3

4

Acknowledgments
VMware's VProbes team - Ricardo Gonzalez, Janet Bridgewater, Martim Carbone,
Hemant Joshi, Alok Kataria, Radu Rugina, and Vivek Thampi - helped throughout
the process, particularly with working at VMware and learning how to use VProbes.
Professor M. Frans Kaashoek provided extensive comments on both my thesis
proposal and this writeup, for which I am exceedingly grateful.
5

6
Contents
1 Introduction
2 Background and related work
2.1 Intrusion detection systems ..... .......................
2.1.1 System call traces . . . . . . . . . . . . . . . . . . . . . . . . .
2.1.2 Kernel module or userspace approaches . . . . . . . . . . . . .
2.1.3 Virtual machine approaches . . . . . . . . . . . . . . . . . . .
2.2 Instrumentation tools . . . . . . . . . . . . . . . . . . . . . . . . . . .
2.2.1 D Trace . . . . . . . . . . . . . . . . . . . . . . . . . . . . . . .
2.2.2 V Probes . . . . . . . . . . . . . . . . . . . . . . . . . . . . . .
3 Goals and design
3.1 D esign . . . . . . . . . . . . . . . . . . . . . . . . . . . . . . . . . . .
4 Instrumentation component
4.1 Relevant kernel data structures
4.1.1 Linux structures . . . .
4.1.2 Windows structures . . .
4.2 Accessing fields from Emmett .
4.2.1 Finding offsets at runtimE
4.2.2 Encoding offsets in scriptE
4.2.3 Linux gatherer: kernel mc
4.2.4 Windows gatherer: pdbpa
7
13
17
17
18
19
20
22
22
24
27
27
31
32
33
36
38
38
41
42
43
. . . . . . . . . . . . . . . . . . . . .
. . . . . . . . . . . . . . . . . . . . .

4.3
4.4
Structure of instrumentation . . . . . .
Performance . . . . . . . . . . . . . . .
4.4.1 Different workloads . . . . . . .
4.4.2 Optimization opportunities . .
5 Analysis component
5.1 W hitelist . . . . . . . . . . . . . . . . .
5.2 Sequence time-delay embedding (stide)
6 Conclusion & future work
6.1 Future Work . . . . . . . . . . . . . . .
A Selected code
A.1 Windows instrumentation . . . . . . .
A.1.1 pdbparse: extracting offsets . .
A.1.2 Preload . . . . . . . . . . . . .
A.1.3 Instrumentation proper .....
A.2 Linux instrumentation . . . . . . . . .
A.2.1 Kernel module . . . . . . . . .
A.2.2 Preload . . . . . . . . . . . . .
A.2.3 Instrumentation proper . . . . .
8
. . . . . . . . . . . . 4 4
. . . . . . . . . . . . 4 7
. . . . . . . . . . . . 4 7
. . . . . . . . . . . . 4 8
51
. . . . 51
53
55
55
57
. . . . . . . . . . . 57
. . . . . . . . . . . 57
. . . . . . . . . . . 64
. . . . . . . . . . . 68
. . . . . . . . . . . 69
. . . . . . . . . . . 69
. . . . . . . . . . . 75
. . . . . . . . . . . 80
List of Figures
1-1 Typical host-based IDS . . . . . . . . . . . . . .
1-2 Virtualization-enabled host-based IDS . . . . .
4-1
4-2
4-3
4-4
4-5
4-6
4-7
4-8
Key offsets from a Linux kernel . . . . . . . . . . . . .
Linux preload's path-toascii function . . . . . . . .
ucs2ascii: Convert Windows' UCS-2 strings to ASCII
Using off atstrcpy with gettaskcomm . . . . . . . .
Disassembled get-task-comm function . . . . . . . . .
Sample /proc/vprobe-offsets . . . . . . . . . . . . .
Windows strace-like implementation . . . . . . . . . .
Performance of instrumentation variants . . . . . . . .
9
14
14
34
35
37
39
40
43
45
49

10

List of Tables
4.1 Key fields in the Linux and Windows process structures . . . . . . . . 36
11

12
Chapter 1
Introduction
One common mechanism for defending computers against malicious attackers is in-
trusion detection systems, or IDSes. Network IDSes monitor network traffic to detect
intrusions, while host-based IDSes monitor activity on a specific machines. One com-
mon variety of host-based IDS watches the kernel-application interface, monitoring
the system calls that are used [12][6][18][19]. Based on the sequences of syscalls used
and/or their arguments, these IDSes aim to determine whether or not an attack is
underway. Naturally, intrusion detection systems are not fully effective, but they have
proven to be useful tools for catching some attacks.
However, because a host-based IDS runs on the host it is protecting (see Figure 1-
1), it is vulnerable to a virus or other attacker that seeks to disable it. An attacker
might block network connectivity the IDS requires to report results, disable hooks it
uses to gather information, or entirely kill the detection process. This is not merely a
theoretical risk - viruses in the wild, such as SpamThru, Beast, Win32.Glieder.AF,
or Winevar [16], directly counter anti-virus software installed on their hosts.
Our contribution is VProbe Instrumentation for VM Intrusion Detection (VIVID),
which provides a host-based intrusion detection system that resists attacks by avoid-
ing running any software within the host being monitored. Instead, we leverage
virtualization to look into the guest virtual machine from the host (see Figure 1-2).
In addition, we do so while using a common hypervisor, without making any changes
to the hypervisor itself.
13
Applications
DB Mail .. Web Normalserver server server users
ljalicious'user
monitor
EOperating Systern
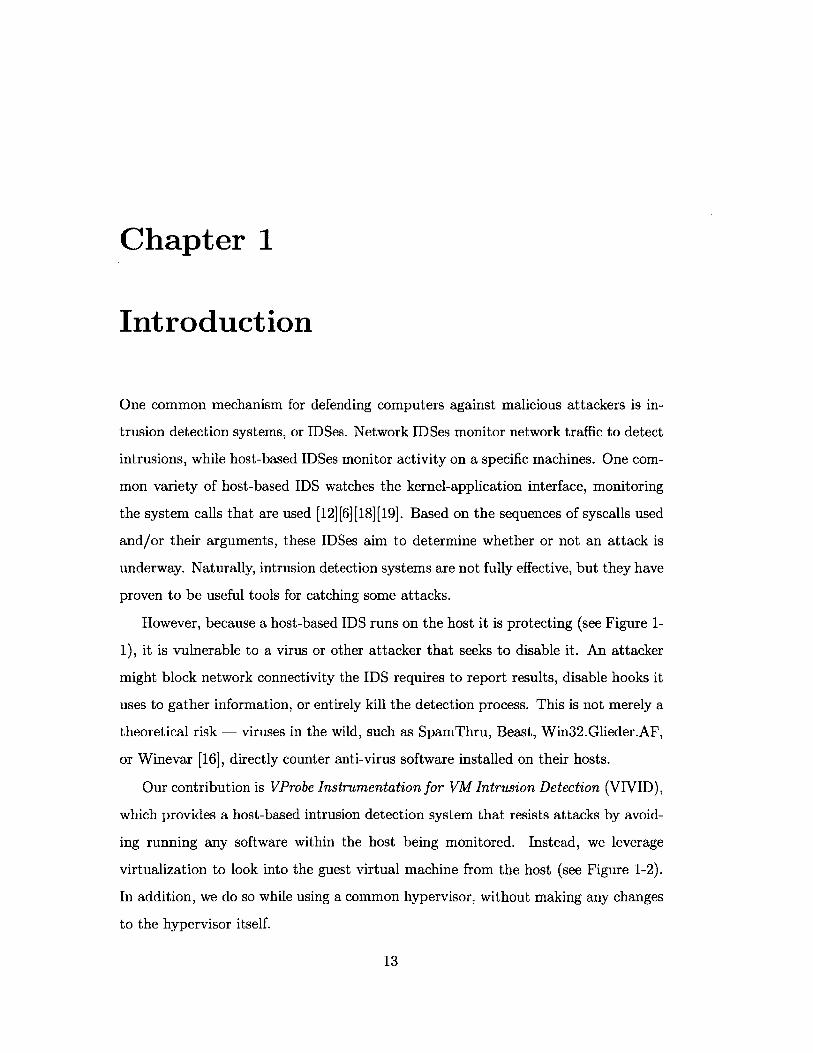
HardwareFigure 1-1: Typical host-based intrusion detection system (IDS). An IDS typically
will have a userspace and/or kernelspace agent which monitors behavior of other
programs on the machine and reports anomalous behavior to an administrator.
monitor
0
0
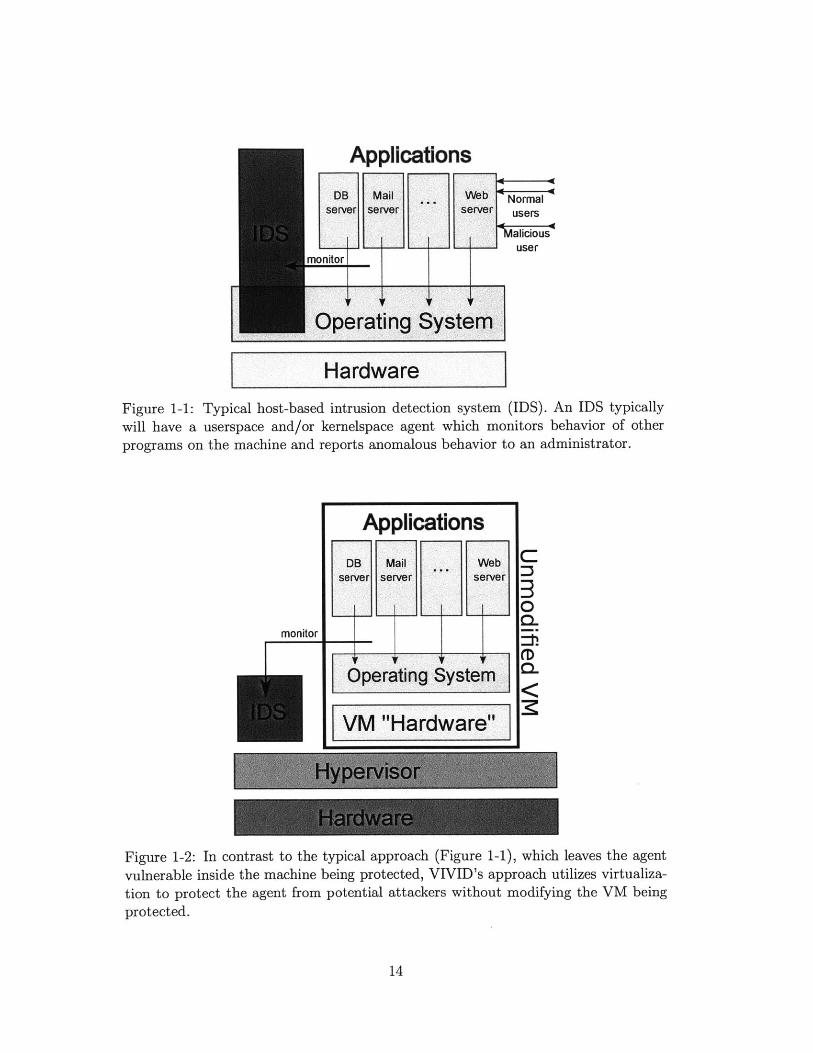
Figure 1-2: In contrast to the typical approach (Figure 1-1), which leaves the agent
vulnerable inside the machine being protected, VIVID's approach utilizes virtualiza-
tion to protect the agent from potential attackers without modifying the VM being
protected.
14
Applications
DB Mail Web,server server server
Operating System
VM "Hardware"

In Chapter 2, I discuss related work. Chapter 3 describes goals and design. Chap-
ter 4 describes the instrumentation I developed. Chapter 5 describes two proof-
of-concept analysis modules that determine if a system call sequence is suspicious.
Finally, in Chapter 6 I conclude.
15

16

Chapter 2
Background and related work
This project focuses on detecting attackers by examining traces of system calls, while
avoiding subversion by using virtual machines to gather the required data.
First, I present related work on intrusion detection systems, which falls into three
main categories. In Section 2.1.1, I cover the extensive literature in how to use system
call data to detect attacks. In Section 2.1.2, I discuss intrusion detection systems that
use kernel or userspace code. In Section 2.1.3, I discuss virtual machine techniques
for extracting data such as system calls from a running system.
Next, I present background information on the tools I'm using for instrumentation.
I begin by describing DTrace in Section 2.2.1, and move on to its spiritual descendant
VProbes, which I use for the instrumentation, in Section 2.2.2.
2.1 Intrusion detection systems
Host-based intrusion detection systems are well-studied in academic literature. Many
systems are based on using system call patterns to detect attacks. While my work
focuses on gathering the data rather than analyzing those patterns, I was influenced
in what data to gather and in building my prototype by those systems, described
in Section 2.1.1. Most host-based intrusion detection systems use an in-guest agent,
running in userspace or kernelspace, to gather their data. These systems, described
further in Section 2.1.2, suffer by being possible for an attacker to compromise them
17
in various ways. In Section 2.1.3, I describe several more recent projects that use
virtualization to protect their agent. Unlike most of these tools, I use hooks already
included in the shipping VMware monitor to build my instrumentation.
2.1.1 System call traces
The largest category of related work is using system call traces for intrusion detection.
Techniques are quite variable. Some of the systems attempt define policies of what
system calls are allowed to be used, and what arguments are permissible. Others are
based just on the system call numbers, and do not use the arguments at all.
Warrender, Forrest, and Pearlmutter[19] review several techniques for detecting
intrusions. The techniques presented achieve 60+% success rate for true positives,
with several techniques achieving 95+% true positives. The frequency of false neg-
atives versus false positives can be tuned by altering parameters of the models they
use; predictably, higher rates of true positives tend to correspond to higher rates of
false positives. The average false positive rate seems to be under 0.1% for all values
tried, however.
The most popular approach from my survey of the literature, covered in Warrender
et al. among other papers, appears to be sequence time-delay embedding (stide). In
stide, a listing is made of all k-tuples of system calls that appear during normal
operation. System call traces are seen as deviant if there is a high enough rate of
unknown k-tuples over a period of time.
Kosoresow and Hofmeyr present work using deterministic finite automata to recog-
nize patterns [12]. System call numbers are used, but not syscall arguments. System
calls are grouped into blocks that are usually seen together, and then each block is
used as a single token for training the DFA.
Systrace[15] is one of many systems that use system call arguments in addition
to system call numbers. Systrace does its learning interactively; when an unexpected
system call is used, Systrace will give the user an opportunity to refine the policy or
just block the operation. This methodology is probably unacceptable for server use,
where I would expect my tool to be primarily deployed, though an interactive training
18
phase followed by non-interactive deployment to production may be effective.
Unfortunately, the literature also suggests numerous weaknesses of detecting in-
trusions using syscalls.
Tan et al. focus on argument-oblivious systems like stide [18]. To exploit these,
an attacker can insert additional system calls that are common in the real system
but do nothing significant. By spreading out the suspicious system calls, an attacker
can hope to avoid triggering anything unusual. There is also a risk that a suspicious
system call might be entirely replaced - while an execve might be unusual, an open
and a write might not be. On the other hand, if the file being opened and edited is
/etc/passwd, the open/write may be no less dangerous.
Garfinkel suggests that Unix may be too complicated for system call techniques to
work[6]. Features like hardlinks and the dup2 system call make it hard to do any sort
of tracking based on arguments; there are too many different ways to name objects
for it to be effective.
2.1.2 Kernel module or userspace approaches
Many intrusion detection systems are based on a kernel module and/or a userspace
component that uses kernel hooks to gather system call data. If the operating system
does not already provide hooks to gather system call data, adding new hooks into
the kernel to do so is generally easy. That data is then typically exported to a
userspace process on the machine being monitored. The kernel can easily pass the
data along, and by doing the analysis in userspace instead of in the kernel developers
get a generally easier environment to develop in, including more choices of language
and libraries to use.
Janus[6] is one system with this split. Janus secures a single process at a time.
A process being run under Janus has an associated userspace janus process which
is responsible for making decisions about what system calls to allow, along with a
kernel module that catches system calls and forwards them to the janus process to
make the decision.
Systrace[15] is another project with a similar split. It has a kernel module that
19
catches system calls. The kernel module will then forward most system calls to a
userspace process to make policy decisions about whether to allow or deny the call.
That userspace process may request input from the user to make the decision, rather
than making it automatically.
2.1.3 Virtual machine approaches
While kernel or userspace approaches have significant advantages, they do present
some weaknesses. An attacker who can kill a userspace process or change a policy file
(as an attacker with limited or complete root access likely can) is able to neutralize
the system. Similarly, if the attacker can get new code into the kernel, such as by
loadable kernel modules or some kernel exploit, they can disable the kernel component.
Because of these risks, several systems instead use virtualization technology to protect
the monitoring software from being hampered.
Lares[14] is one such tool. While we use the hypervisor to place hooks outside the
guest being monitored, Lares instead runs the hooks inside the virtual machine. It
then uses a hypervisor modified to prevent code running in the guest from interfering
with those hooks. It also modifies the hypervisor to allow communication between
the untrusted guest and a trusted security VM. In contrast, we use facilities that
VMware already provides for inspecting the guest without significant modifications
to the guest kernel.
BackTracker[11] uses a UMLinux virtual machine to gather information about how
processes interact with each other and with files and filenames on the system. Using
this data, it can help track an intrusion back to its source. It modifies the virtual-
machine monitor to gather records of syscalls that can result in such interactions,
incurring a 9% performance penalty on a loaded system. Unfortunately, the paper
contains little detail on the precise modifications, so I cannot tell how the mechanism
compares to our mechanism. The use the data is put to is certainly different. King et
al aim to backtrack a detected intrusion to find the source, doing it offline and often
at a significant delay. We aim to detect intrusions, generally in roughly real-time.
Ether[4] uses hardware virtualization in a modified version of Xen to analyze
20
malware. Its focus is on analyzing malware for research purposes, rather than live
detection on a production system. It has two modes - instruction-level and syscall-
based. The first mode is prohibitively slow for a production system, while the system
call mode varies from a couple percent overhead to 70%, depending on the benchmark.
Antfarm[10] does not principally focus on security. It aims to identify processes
without customizing for the operating system in use. While Jones et al. use this
to implement an anticipatory disk scheduler, they suggest that the same techniques
might be usable for security software that remains relatively oblivious of the operating
system being monitored.
VSyscall[13] tracks system calls within a VM using a modified KVM or QEMU
hypervisor. Li et al. describe two applications: integrity measurement and an in-
trusion detection system much like our own. VSyscall's approach involves much less
knowledge of the guest kernel's internals, preferring to treat CR3 values as an opaque
token rather than examining the kernel data structures to get PID and program, as
we do. We also, of course, differ in which hypervisor we support, and can use VProbes
to avoid modifying the hypervisor as Li et al. do.
As with VIVID, VMwatcher[9] accesses the memory of the process running in
the virtual machine to gain semantic information available to the kernel. From the
paper, it is unclear to me how their "guest view casting" works, but my impression
is that for Linux they run Linux kernel code to do it: for example, that they use
the Linux ext3 driver in their intrusion-detection system. If true, this suggests that
their system may include a large quantity of C code that is shared with the guest
operating system. While surely helpful for accurately reconstructing guest state, it
suggests that the intrusion detection system might be vulnerable to the same buffer
overflows and other bugs as the guest kernel is, which seems concerning. The paper
is unclear about whether VMwatcher is able to trigger execution on specific events in
the VM, as we do, or merely scans periodically.
LiveWire[7 is in some respects the most similar project to ours. As with our
project, it uses hooks in VMware's monitor to inspect memory and registers. However,
LiveWire predates VProbes, so while we are able to use a stock VMware installation,
21

LiveWire depends on a modified version. LiveWire also uses the third-party crash
program to introspect the OS and exposes a broader variety of information, while
our project uses custom introspection code and focuses on just examining a syscall
stream.
Many of these projects depend on using a modified hypervisor to gather the infor-
mation they need. One advantage of our project is that, due to VMware's VProbes
tool, we are able to use hooks exposed by VMware to trap events of interest in a VM
and analyze the VM's behavior without modifying the hypervisor at all. We cover
VProbes and its predecessor DTrace in the next section.
2.2 Instrumentation tools
To instrument an unmodified hypervisor, we use a VProbes, a tool provided by
VMware that is inspired by Sun's "DTrace". The design and motivation for DTrace
is described below, followed by an explanation of what VProbes adds and how it is
used.
2.2.1 DTrace
VProbes is based upon Sun's "DTrace" tool. DTrace[3] is designed to improve observ-
ability into a running machine. Historically, there has been an unfortunate conflict
between production and test. Most test infrastructure has a performance impact at
run time. The simplest approach is just scattering printf statements throughout
the code, which has an obvious impact. A slightly more complicated approach is to
insert statements like if (debug) printf ("we got here");. While this has less of
a performance impact - no need to parse format strings or write data out - it still
takes time to check the value of debug. In order to avoid unacceptable overhead,
debugging statements like these are generally included only in "test" builds, and are
left out of "production" builds.
As a result of the production / test build dichotomy, when a performance or cor-
rectness issue is found in production, fixing it requires a time-consuming, error-prone,
22
and complicated process. Installing a test build is not generally an option; it may be
too slow for even temporary diagnostic use; it may present different bugs, which might
be an unacceptable risk; and restarting the system to run the replacement build may
be too slow or disruptive. As result, problems need to be fixed in a lab environment
instead. First, the problem needs to be reproduced, as closely as possible, on another
machine running a test build. Then, engineers must iteratively test and try possible
fixes until they find something that appears to fix the problem. Finally, they deploy
the fix and see if it works.
Problems can creep in during any phase of this work. Replicating the problem
can be hard, due to race conditions that vanish in the debug build, complicated
interactions of the system with its environment, or configuration settings that nobody
realizes need to be copied over. Bryan Cantrill describes one case in which a machine
was accidentally configured as a router; when another router failed, the server would
take over, ruining performance of the other processes on the machine. Replicating
the configuration in the lab, including elements like the unreliable router and the
configuration setting making the server a router, requires significant effort and has a
high chance of failure. Once a potential fix is identified, there is no guarantee that
it will fix the observed problem; there is always a chance that while the symptoms
match, the underlying problem is entirely different, necessitating several iterations of
the process.
This difficulty prompted Sun to develop DTrace as a diagnostic tool. DTrace aims
to allow the debugging to occur in production. It does this by allowing customized
diagnostic callbacks to be inserted in a number of locations in the running Solaris ker-
nel. This necessitates careful safety work; if engineers grow used to DTrace breaking
their system (even due to their own error), they or their managers will be unwilling
to risk using it. Additionally, when not in use, DTrace must not introduce a perfor-
mance penalty. Finally, enabling DTrace should be possible without restarting the
system. DTrace accomplishes each of these goals.
23
2.2.2 VProbes
Unfortunately, while DTrace is a huge step towards improved debugging, it has a few
critical limitations. It does not work with all operating systems; while it has spread
beyond Solaris, it does not run on Windows, and Linux support requires a separate
kernel module maintained separately from Linux itself. Additionally, DTrace cannot
be used to debug issues involving virtualization stacks like VMware's, nor early in
the boot sequence before the operating system has a chance to initialize it[1].
VProbes solves these problems. It is implemented within VMware's virtualiza-
tion stack, which allows it to analyze activity within the virtualization system itself.
Additionally, it is independent of kernel support, and can therefore be used at any
phase of the boot process, and with any operating system. Getting useful information
often requires customizing it for the operating system - for example, to determine
the current PID, process name, or system call in the appropriate platform-dependent
fashion. However, for common platforms like Windows and Linux, substantial work
has already been done by VMware's VProbes team; for other platforms, this work
can generally be done by a motivated user, rather than requiring complicated changes
to the VProbes infrastructure.
VProbes allow developers to define custom probes. Probes can be set as break-
points at arbitrary addresses in a VM guest's execution. VProbes also comes with a
number of predefined probes that fire at a variety well-defined times - when a net-
work packet is sent, disk 10 occurs, an interrupt fires, and so forth. The body of the
probe can perform various actions, including reading memory and doing conditional
branching. Various data structures are provided for storing data, to be read from
other probes or output to a log.
As with DTrace, a great deal of the effort goes into ensuring that probes will be
safe and cannot harm the virtual machine that they run against. This is partially
implemented through two languages, Emmett and VP. Recent probes are generally
written in Emmett, a C-like language developed by VMware for the purpose. This is
convenient when trying to probe code written in C. In addition to easing familiarity,
24
Emmett syntax resembles C sufficiently that struct definitions can often be copied
directly from C source code into the Emmett source, which saves time. VP is a
simpler and lower-level language, which can be directly interpreted by the VMware
monitor. A custom compiler converts Emmett, which is relatively easy to write, to
VP, which is relatively easy to check for safety and then execute.
25

26

Chapter 3
Goals and design
The project aims to produce an intrusion detection system that is robust against
attackers disabling it. Previous work has shown that analyzing system call traces
can be effective in detecting attacks. We hope to add to that work by being more
robust in the face of rootkits or other tools that try to disable or otherwise hide from
detection systems.
Further, we want users to be able to run the system on a production machine.
This requires that it be stable and produce acceptably low performance impact. While
that will vary from user to user, less than 10% overhead on typical workloads seems
a good rule of thumb.
In summary, the system should be difficult or impossible to disable, and should
detect standard rootkits and other attacks quickly. Safety and performance are also
necessary.
3.1 Design
VProbe Instrumentation for VM Intrusion Detection (VIVID) builds on VMware's
VProbes, which provides a tool to inspect the behavior of a virtual machine. Like
previous work, we base detection on system call traces. The software is architected as
two components - the instrumentation and the analyzer. The former is responsible
for instrumenting the guest virtual machine to gather system call information. This
27
component uses VProbes to allow it to run outside of the guest, while still gathering
information from within the guest. Figure 1-2 shows the relationship between the
IDS instrumentation, the VM, and applications. The analyzer component analyzes
the data gathered, and contains the logic that decides whether a syscall sequence is
suspicious or not.
One advantage of splitting the instrumentation from the analysis component is
modularity. The split allows implementing Linux and Windows support in the in-
strumentation, various attack recognition strategies in the analysis component, and
combining them arbitrarily. The instrumentation need not change based on the at-
tack recognition strategy in use, and the analysis component can be oblivious to the
operating system or architecture. In addition, it would be possible to run several
analyzers in parallel, alerting when any of them alerted, or using some more com-
plicated scheme. We could also run the analyzers with saved data, rather than live
data; this might be useful for regression testing of analyzers or detecting additional
past exploits as better analyzers are developed.
However, the division is as strict as it is for a different reason: language. VProbes
provide limited support for string manipulation and data structures. Additionally,
by default the interpreter has relatively low limits on how much code probes can
include. As a result of these two limitations, we separate the two roles. While the
latter limitation is easily solvable and the former would be fixable with enough work,
splitting up the components seemed a much easier solution. A split allows using all the
functionality of Python or other modern languages, without needing to reimplement
it.
The instrumentation outputs data that resembles the output of strace[17]. The
instrumentation is also responsible for outputting the thread, process, and parent
process IDs corresponding to each syscall, as well as the process name (specifically,
the comm value and binary path).
The Linux instrumentation supports decoding the names and arguments of some
system calls. However, the current analysis components do not use this data, so
the Windows instrumentation outputs only system call numbers. If future analy-
28
sis components were to want this information, it could be added to the Windows
instrumentation easily.
Analysis scripts use this data to build a model of what normal behavior looks like,
and search for deviations. Generally, these scripts build separate models for each
program, as different programs will have different normal behavior.
The focus of this project is on building the instrumentation, which is covered in
depth in Chapter 4. Proof-of-concept analysis modules are discussed in Chapter 5.
29

30

Chapter 4
Instrumentation component
The data gathering component uses VProbes to gather syscall traces from the kernel.
Gatherers have been written for 32-bit and 64-bit Linux (across a wide range of
versions), and 64-bit Windows 7. The Linux gatherers share the bulk of their code;
the Windows gatherer is similar in structure and gathers similar data, but does not
share any code.
To run the gatherer, we set a probe on the syscall entry point in the kernel code.
To implement this, VProbes will set a breakpoint on that location, and when the
breakpoint triggers will run a callback that we define. The callback extracts the
system call number and arguments from the registers or stack where they are stored.
In addition, the callback is responsible for retrieving data about the currently running
process. The analysis components can use process data to associate the syscalls with
the correct per-program profile, or to sequence system calls on a per-thread basis.
When a syscall starts to execute, the breakpoint will activate, transferring execution
to our callback.
Optionally, the gatherer can decode system call names and arguments. The Linux
callback has the name and argument format for several system calls hard-coded in.
For numeric arguments, the probe will simply print the argument value. For system
calls that take strings or other types of pointers as arguments, it will print out the
referenced data. It also prints the name of the system call in use. However, the
current analysis scripts do not examine syscall arguments, so this capability was not
31

implemented for the Windows gatherer.
Another optional feature is to report the return values from the system calls. As
with argument values, no current analysis scripts utilize this data, however. Conse-
quently, while support is available for Linux, it was not implemented for Windows.
Writing a gatherer requires a couple key steps. First, relevant kernel data struc-
tures storing the required information must be identified, as described in Section 4.1.
Once the relevant structures and fields are identified, we need to make the offsets of
the fields within the structures available to the Emmett script. While the general
layout changes little from version to version of a kernel, the precise offsets do vary,
so an automated mechanism to find and make available these offsets is desirable. In
Section 4.2 we discuss two techniques for finding those offsets and exposing them to
Emmett code. Finally, in Section 4.3 we address how the instrumentation is assembled
from these components.
4.1 Relevant kernel data structures
The first step in implementing the gatherer is to find where the Linux or Windows
kernel stores the data we want. While a userspace IDS would use a relatively well-
defined, clearly documented, and stable interface like system calls or reading /proc
to gather the required information, we are unable to run code from the target sys-
tem. As a result, we must directly access kernel memory. Our goal at this stage is
essentially to determine what fields we need and how we would access them if we had
full structure definitions but could not call any accessor functions. Determining the
relevant structures is a process that involves reading the source, disassembling system
call implementations, or looking at debugging symbols.
Naturally, because we are accessing memory directly instead of using a supported
kernel interface, we are vulnerable to changes in the operating systems' implementa-
tion. In practice, we have found that major rearrangements of structures (as opposed
to minor changes in offsets) are rare enough to be manageable. We surveyed changes
to the key Linux structures since April 2005. During that time about three rele-
32
vant changes occurred. By limiting supported kernels to those since April 2008, we
avoided all but one of those changes; that change, to struct vfsmount, proved easy
to support. Thus, while this approach theoretically involves exposes us to the risk of
structures changing, in practice we found the risk was small.
4.1.1 Linux structures
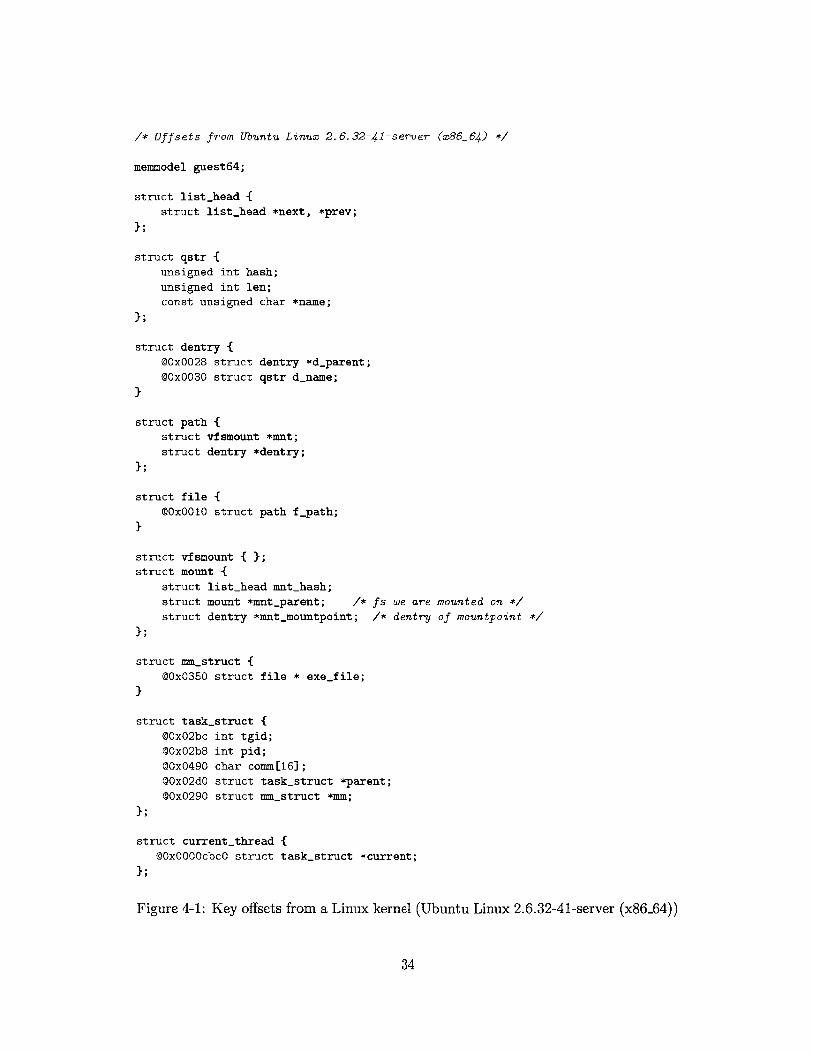
In Linux, the key data structure is the struct taskstruct for the current process.
(In Figure 4-1 we show details of what relevant Linux structures and fields look like
on one 64-bit Linux kernel.)
The first part of extracting the taskstruct is finding the per-CPU area. With
sufficiently old kernels this must be located by masking off part of Xrsp, while for
more recent kernels we can use the FSBASE or GSBASE registers to find it. Once
the per-CPU area is located, one field supplies a pointer to the current taskstruct.
The instrumentation needs access to the following information about the process:
" pid: The process ID; in the kernel, this is known as the thread group ID (tgid)
" tid: The thread ID; in the kernel, this is known as the process ID (pid)
" ppid: The pid of the process's parent
" Program identity: Some mechanism for identifying programs for the purposes
of building a profile
The PID and TID are directly available as fields on the taskstruct.
The ppid is only slightly more complicated. Unfortunately, ppid is not a field,
but the taskstruct does have a parent field which is a pointer to the parent
process's taskstruct. Thus, the instrumentation can find the ppid by reading
task->parent->tgid.
Identifying what program is running is surprisingly difficult. The simplest piece
of information to retrieve is the comm field within Linux's taskstruct. This is
the first 16 characters of the process's name, without any sort of path information.
Unfortunately, this makes it difficult to distinguish an init script (which tends to use
33
/* Offsets from Ubuntu Linux 2.6.32-41-server (x86_64) */
memmodel guest64;
struct list-head {struct list-head *next, *prev;
};
struct qstr {unsigned int hash;
unsigned int len;const unsigned char *name;
};
struct dentry {@OxOO28 struct dentry *d-parent;@OxOO30 struct qstr dname;
}
struct path {struct vfsmount *mnt;struct dentry *dentry;
};
struct file {0x0010 struct path f-path;
}
struct vfsmount { };struct mount {
struct list_head mnt_hash;
struct mount *mnt-parent; /* fs we are mounted on
struct dentry *mnt-mountpoint; /* dentry of mountpoint */
};
struct mm-struct {@OxO350 struct file * exe-file;
}
struct task-struct {@OxO2bc int tgid;@OxO2b8 int pid;QOxO490 char comm[16];@OxO2dO struct task-struct *parent;@OxO290 struct mm-struct *mm;
};
struct currentthread {@OxOOOOcbcO struct task-struct *current;
};
Figure 4-1: Key offsets frorm a Linux kernel (Ubuntu Linux 2.6.32-4 1-server (x86_64))
34
string path-toascii(struct mount * mnt, struct dentry * dentry)
string ret, parent-path;
if(dentry == dentry->d-parent)
if(mnt == mnt->mnt-parent It mnt->mnt-parent == NULL)
ret =} else {
ret = pathto-ascii(mnt->mntparent, mnt->mntmountpoint);}
} else {parent-path = pathto.ascii(mnt, dentry->d-parent);sprintf (ret, "%s/%s", parent-path, get-qstrname(&dentry->d-name));
}return ret;
}
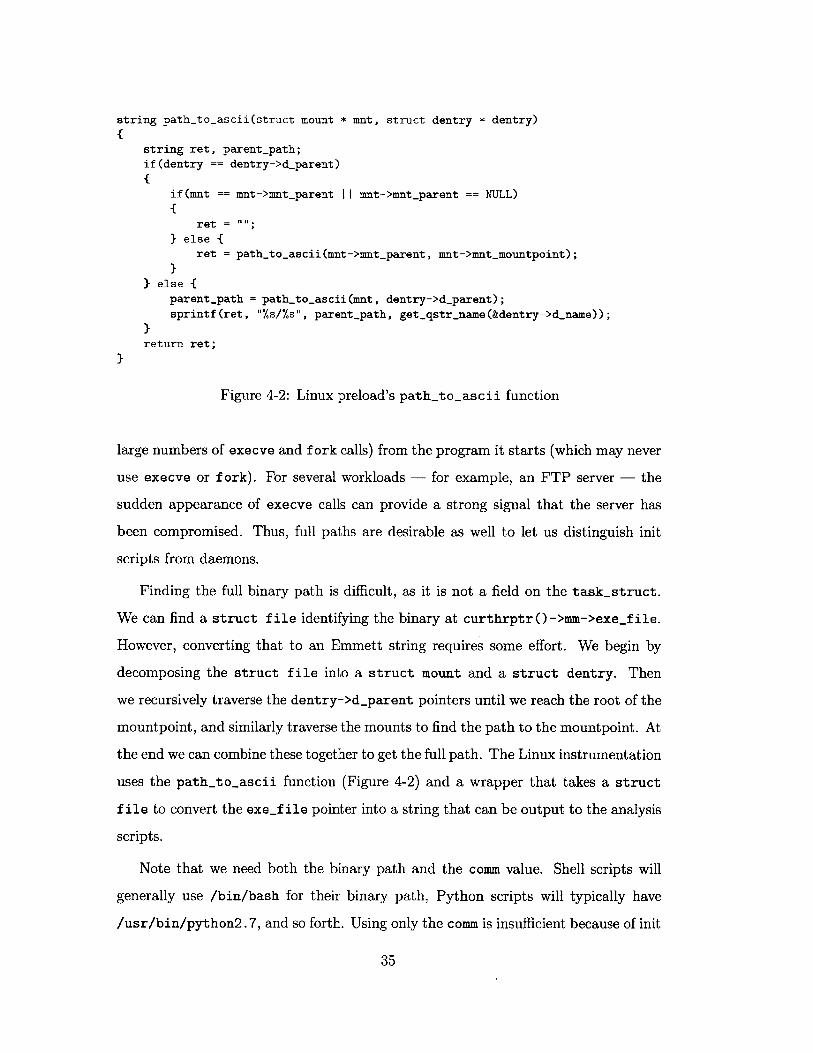
Figure 4-2: Linux preload's path-toascii function
large numbers of execve and f ork calls) from the program it starts (which may never
use execve or f ork). For several workloads - for example, an FTP server - the
sudden appearance of execve calls can provide a strong signal that the server has
been compromised. Thus, full paths are desirable as well to let us distinguish init
scripts from daemons.
Finding the full binary path is difficult, as it is not a field on the taskstruct.
We can find a struct file identifying the binary at curthrptr O->mm->exe_file.
However, converting that to an Emmett string requires some effort. We begin by
decomposing the struct file into a struct mount and a struct dentry. Then
we recursively traverse the dentry->d.parent pointers until we reach the root of the
mountpoint, and similarly traverse the mounts to find the path to the mountpoint. At
the end we can combine these together to get the full path. The Linux instrumentation
uses the path-toascii function (Figure 4-2) and a wrapper that takes a struct
f ile to convert the exe_f ile pointer into a string that can be output to the analysis
scripts.
Note that we need both the binary path and the comm value. Shell scripts will
generally use /bin/bash for their binary path, Python scripts will typically have
/usr/bin/python2.7, and so forth. Using only the comm is insufficient because of init
35
Linux Windows
Key structure taskstruct ETHREAD, EPROCESS32-bit: syscall.call,
Breakpoint at sysenter-docall;
64-bit: system-call nt !KiSystemServiceStart
Thread ID pid Cid.UniqueThread
Process ID tgid Cid.UniqueProcess
Parent PID parent .tgid InheritedFromUniqueProcessId
Program name comm ImageFileName
Program binary mm->exe_file SeAuditProcessCreationInfo
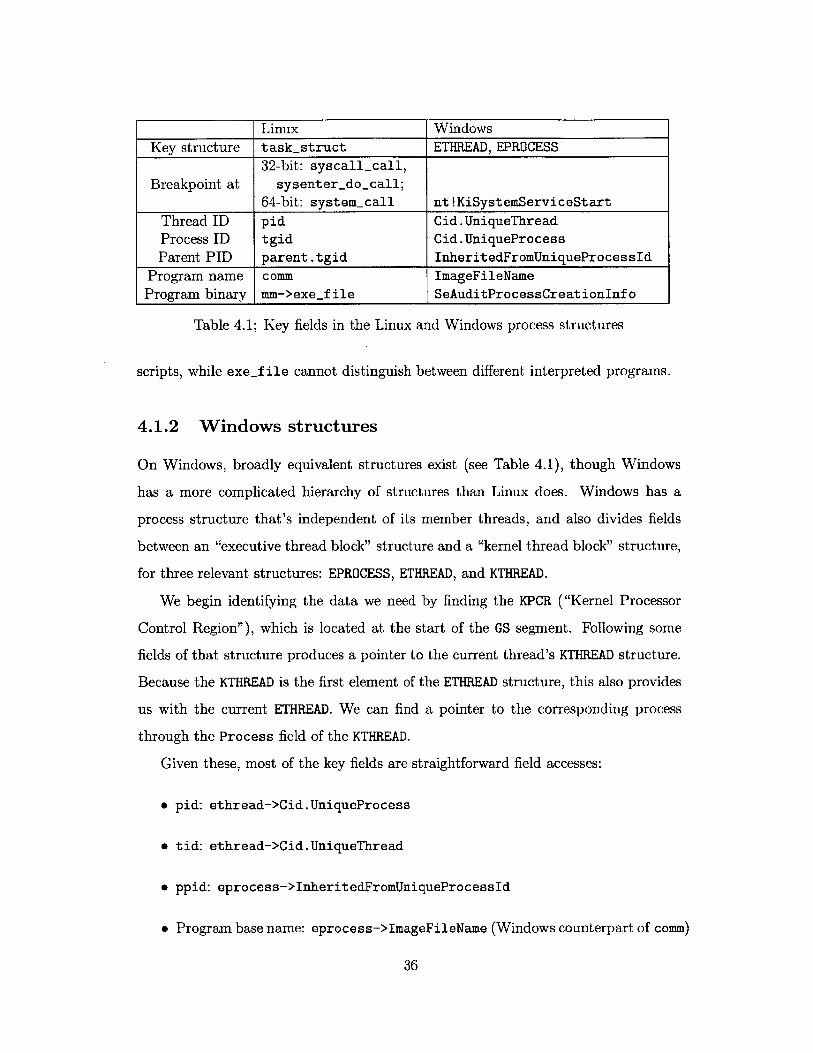
Table 4.1: Key fields in the Linux and Windows process structures
scripts, while exef ile cannot distinguish between different interpreted programs.
4.1.2 Windows structures
On Windows, broadly equivalent structures exist (see Table 4.1), though Windows
has a more complicated hierarchy of structures than Linux does. Windows has a
process structure that's independent of its member threads, and also divides fields
between an "executive thread block" structure and a "kernel thread block" structure,
for three relevant structures: EPROCESS, ETHREAD, and KTHREAD.
We begin identifying the data we need by finding the KPCR ("Kernel Processor
Control Region"), which is located at the start of the GS segment. Following some
fields of that structure produces a pointer to the current thread's KTHREAD structure.
Because the KTHREAD is the first element of the ETHREAD structure, this also provides
us with the current ETHREAD. We can find a pointer to the corresponding process
through the Process field of the KTHREAD.
Given these, most of the key fields are straightforward field accesses:
" pid: ethread->Cid.UniqueProcess
" tid: ethread->Cid.UniqueThread
" ppid: eprocess->InheritedFromUniqueProcessId
" Program base name: eprocess->ImageFileName (Windows counterpart of comm)
36
string ucs2ascii(UNICODESTRING *str) {int i;string ret;// Reset the string to empty on each call --- needs to be split across two// statements because all Emmett variables are essentially static.ret = ""It;for(i = 0; i < str->Length; i += 2) {
ret = ret + (string)&((char*)str->Buffer)[i];
Ireturn ret;
}
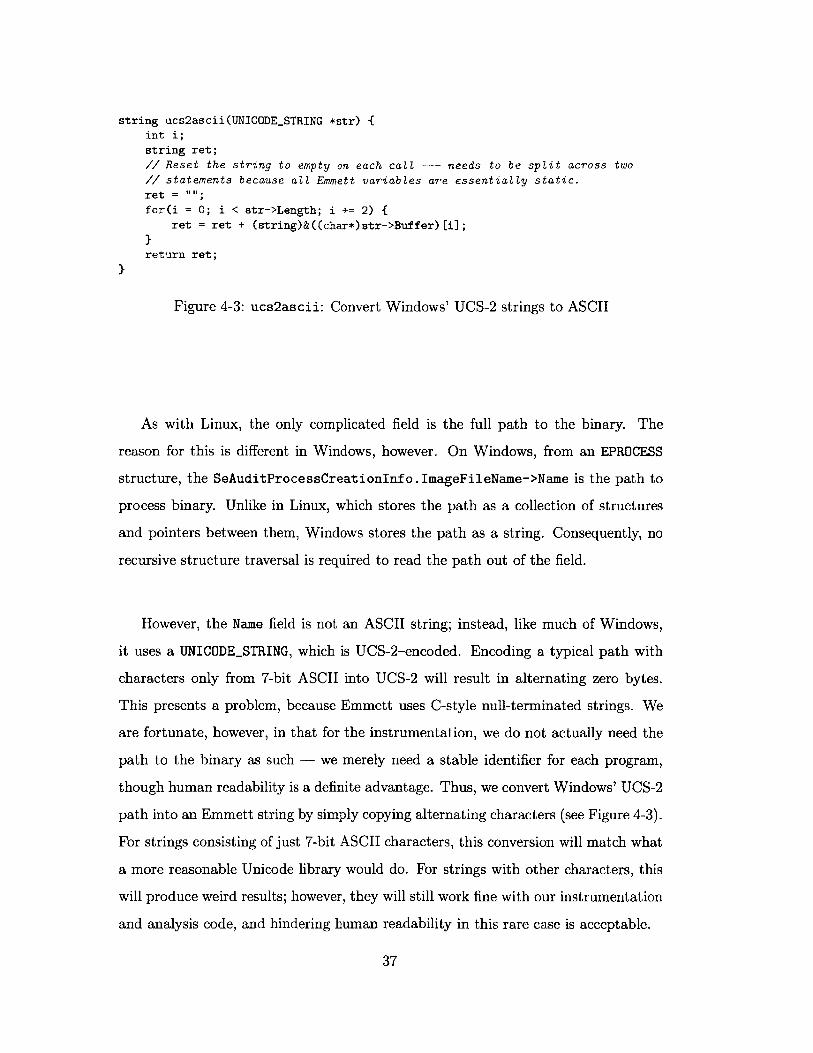
Figure 4-3: ucs2ascii: Convert Windows' UCS-2 strings to ASCII
As with Linux, the only complicated field is the full path to the binary. The
reason for this is different in Windows, however. On Windows, from an EPROCESS
structure, the SeAuditProcessCreationInfo.ImageFileName->Name is the path to
process binary. Unlike in Linux, which stores the path as a collection of structures
and pointers between them, Windows stores the path as a string. Consequently, no
recursive structure traversal is required to read the path out of the field.
However, the Name field is not an ASCII string; instead, like much of Windows,
it uses a UNICODESTRING, which is UCS-2-encoded. Encoding a typical path with
characters only from 7-bit ASCII into UCS-2 will result in alternating zero bytes.
This presents a problem, because Emmett uses C-style null-terminated strings. We
are fortunate, however, in that for the instrumentation, we do not actually need the
path to the binary as such - we merely need a stable identifier for each program,
though human readability is a definite advantage. Thus, we convert Windows' UCS-2
path into an Emmett string by simply copying alternating characters (see Figure 4-3).
For strings consisting of just 7-bit ASCII characters, this conversion will match what
a more reasonable Unicode library would do. For strings with other characters, this
will produce weird results; however, they will still work fine with our instrumentation
and analysis code, and hindering human readability in this rare case is acceptable.
37

4.2 Accessing fields from Emmett
Once the correct structures and fields are found, a challenge remains. When the
instrumentation has the address of a structure, it needs to know the offset of each
field of interest within the structure, so that it can access the appropriate memory
and read out the data. However, kernels are not designed to make the format of
internal data structures easily accessible to third-party software. Emmett has two
main features that make this feasible: the off at* family of built-in functions, and
sparse structure definitions.
4.2.1 Finding offsets at runtime
The of f at* family of functions allows finding these offsets at run-time. Each function
scans memory from a specified address, checking for instructions that use offsets in
particular ways. Frequently, symbol files are used to find the appropriate address.
Emmett supplies three functions in this family.
The first is offatret, which finds the ret instruction in a function. It then
scans backwards to find when 1rax was loaded. Assuming that %rax was loaded
by accessing the memory at some pointer plus an offset, off atret will return the
offset in question. By passing the address of a simple accessor function like Windows'
nt!PsGetProcessImageFileName to offatret, we can find the offset of a structure
field like ETHREAD's ImageFileName.
The second is offatseg, which finds the first offset applied to the FS or GS seg-
ment registers. These registers are commonly used for thread-local state, making
them helpful for finding thread-specific structures like Linux's taskstruct or Win-
dows' ETHREAD. With a Windows guest, off atseg(&nt ! PsGetCurrentProcess) will
find the offset of the CurrentThread pointer within the KPCR structure.
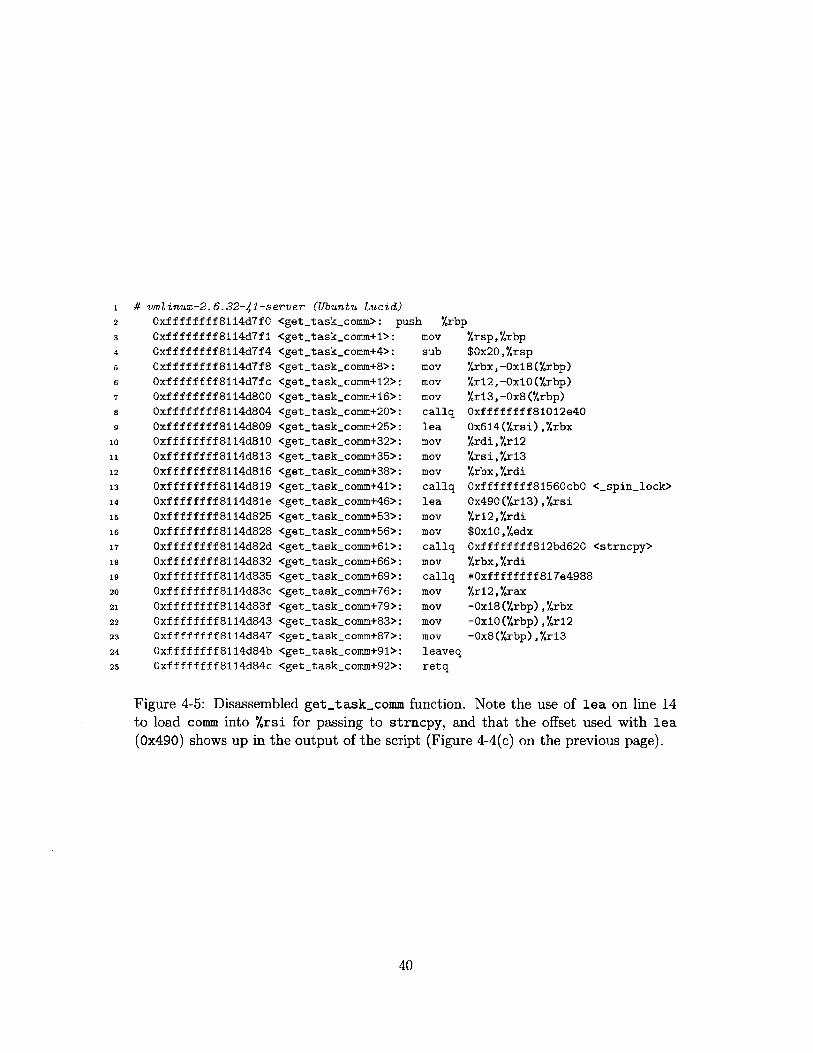
Finally, of f atstrcpy searches for calls to a specific function address, and returns
the offset used to load Xrsi for the call. This could be used to find the offset of a
string element in a structure, but is not current used by any of the gatherers. See
Figures 4-4 and 4-5 for an example.
38
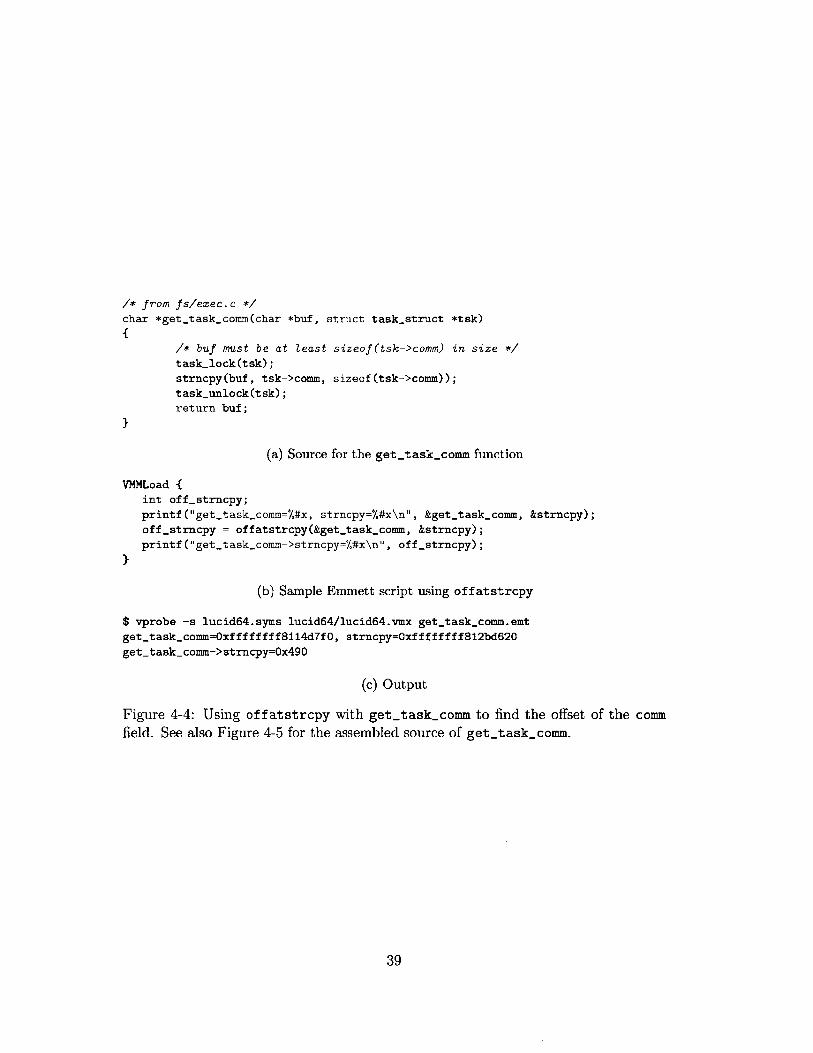
/* from fs/exec.c */char *get-task comm(char *buf, struct task-struct *tsk)
{/* buf must be at ,east sizeof(tsk->comm) in size */
task_lock(tsk);strncpy(buf, tsk->comm, sizeof(tsk->comm));taskunlock(tsk);
return buf;
}
(a) Source for the get-taskcomm function
VMMLoad {int off-strncpy;
printf("gettask_ comm=%#x, strncpy=X#x\n", &gettaskcomm, &strncpy);
offstrncpy = offatstrcpy(&gettaskcomm, &strncpy);printf ("gettask comm->strncpy=%#x\n", of f _strncpy);
}
(b) Sample Emmett script using off atstrcpy
$ vprobe -s lucid64.syms lucid64/lucid64.vmx get-taskcomm.emt
get-task-comm=Oxffffffff8ll4d7f0, strncpy=Oxffffffff8l2bd620get-task-comm->strncpy=0x490
(c) Output
Figure 4-4: Using off atstrcpy with get-taskcomm to find the offset of the commfield. See also Figure 4-5 for the assembled source of get _taskcomm.
39
1 # vmlinux-2.6.32-41-server (Ubuntu Lucid)Oxffffffff8114d7f 0Oxffffffff8114d7f1Oxffffffff8114d7f4Oxffffffff8114d7f8Oxffffffff8l14d7fcOxffffffff8114d800Oxffffffff8114d804Oxffffffff8114d809Oxffffffff8114d810Oxffffffff8114d813Oxffffffff8114d816Oxffffffff8114d819Oxffffffff8114d81eOxffffffff8114d825Oxffffffff8114d828Oxffffffff8114d82dOxffffffff8114d832Oxffffffff8114d835Oxffffffff8114d83cOxffffffff8114d83fOxffffffff8114d843Oxffffffff8114d847Oxffffffff8114d84bOxffffffff8114d84c
<get-taskcomm>: push %rbp<get-taskcomm+1>:<get-taskcomm+4>:
<get-taskcomm+8>:<get-task-comm+12>:
<get.taskcomm+16>:<get-taskcomm+20>:<get-task-comm+25>:<get-task-comm+32>:
<get-taskcomm+35>:
<get-taskcomm+38>:<get-task-comm+41>:<get-task-comm+46>:
<get-taskcomm+53>:<get-taskcomm+56>:
<get-taskcomm+61>:
<get-taskcomm+66>:<get-taskcomm+69>:
<get-taskcomm+76>:<get-taskcomm+79>:<get-taskcomm+83>:
<get-taskcomm+87>:
<get-taskcomm+91>:<get-taskcomm+92>:
movsub
movmovmovcallqleamovmovmovcallqleamovmovcallqmovcallqmovmovmovmovleaveqretq
%rsp,%rbp$0x20,%rsp
%rbx,-0x18(%rbp)
%r12,-OxlO(%rbp)%r13,-0x8(%rbp)Oxffffffff81012e400x614(%rsi),%rbx%rdi,%r12
%rsi,Y.r13%rbx,YXrdiOxffffffff81560cb0 <_spinlock>Ox490(r13),Xrsi%r12,Yrdi$OxlO,%edxOxffffffff812bd620 <strncpy>%rbx,%rdi*Oxffffffff817e4988%r12,%rax-0x18(%rbp),%rbx-OxlO(%rbp),%r12-Ox8(%rbp),Xr13
Figure 4-5: Disassembled get-taskcomm function. Note the use of lea on line 14to load comm into %rsi for passing to strncpy, and that the offset used with lea(0x490) shows up in the output of the script (Figure 4-4(c) on the previous page).
40

An advantage of the of f at* functions are that they allow a single Emmett script
to be used against kernel binaries with different offset values. As a result, the VProbes
distribution comes with library code using of f at* to find the current PID and certain
other fields. However, the off at* functions require finding an appropriate accessor
to search for offsets in, and are dependent on the precise assembly code generated by
the compiler. Thus, for new gatherer code, another mechanism was desirable.
4.2.2 Encoding offsets in scripts
Emmett also supports sparse structure definitions, which allow the required offsets
to be conveniently encoded in the script itself. A sparse structure is defined like a
normal C structure, except that some of the fields can be left out. By prefixing a
field definition with an 0 and an offset, Emmett will use the specified offset instead
of computing an offset based on the preceding fields in the structure and their size.
Given a way to find offsets, this allows specifying only the relevant fields, and ignoring
the ones that a script does not need.
While this technique requires updating the script for different kernel versions, we
find it generally more convenient than using of f at* to find offsets at runtime. One
way to make those updates easy is to automatically generate files with offsets and then
use Emmett's preprocessor to incorporate the current offsets into the rest of the code.
Using sparse structures allows the Emmett compiler to perform type-checking. The
process of writing scripts is much less error prone when the compiler will distinguish
between pointer and non-pointer members, or an offset in the ETHREAD and EPROCESS
structures. The code is also much clearer when the same syntax and names can be
used as are present in the source or debugger output. Thus, while early versions of the
Linux and Windows gatherers used of f at*, later revisions exclusively use structures.
In the next two sections, we address how the Linux and Windows gatherers find
the requisite offsets.
41
4.2.3 Linux gatherer: kernel module
The information we want to retrieve - the comm, pid, and so forth - are all easy
to access from kernel code. The requisite structures are all defined in various header
files, so it is simple to write C code that uses them. Parsing those header files outside
of the context of compiling C code, on the other hand, is much harder, since they
contain a variety of #if def, #def ine, and similar preprocessor directives.
Because of these constraints, the approach that we took to obtaining the required
offsets was to build a kernel module. It uses a collection of #if's to ensure source
compatibility with both 32-bit and 64-bit kernels as far back as Linux 2.6.11.
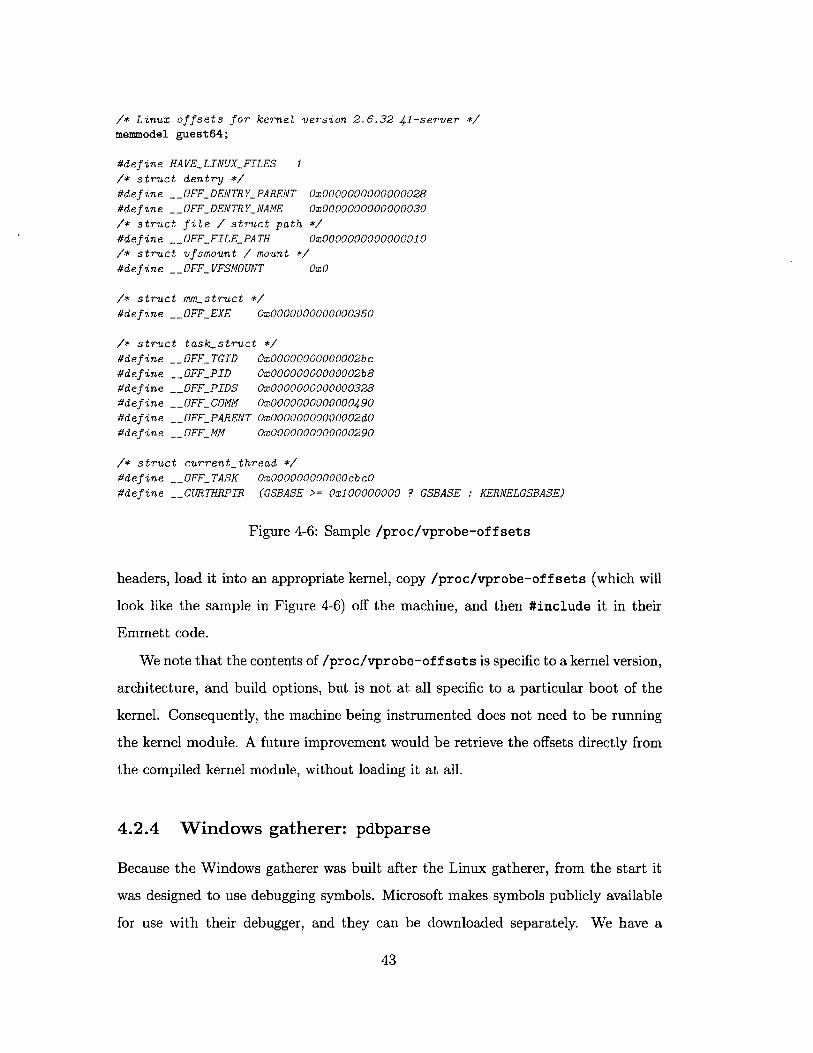
When the module is loaded into a running instance of the kernel it was compiled
for, it will generate a file /proc/vprobe-offsets. That file contains a variety of
information, formatted as a series of #defines, that is useful to the Linux gatherer.
Most of that information is a numerical offset of a field within a structure, retrieved
using a simple call to offsetof, but there are some significant exceptions.
Depending on the version and the architecture, finding the current thread storage
area and the offset of the current taskstruct within it varies greatly. As a result, the
curthrptr is printed as a complete Emmett expression selected using preprocessor
#if's. The taskstruct offset is a simple number, but the module finds it using any
of a call to offsetof, the per.cpu-var macro, or the currenttask symbol when
available.
The other somewhat difficult piece to handle is traversing mountpoints. Starting in
Linux 3.3, much of what had been in struct vf smount was moved into a new struct
mount in order to improve encapsulation. The Linux instrumentation now assumes
that all kernel versions have both structures, with pre-3.3 kernels simply having an
offset of zero between the two structures' starts. Because struct vf smount is always
allocated as part of a struct mount, converting between the two is safe (Linux itself
uses containerof to convert from a vf smount to a mount).
To use these offsets in an Emmett script such as our instrumentation, a user can
take the source for the kernel module, compile it against an appropriate set of kernel
42
/* Linux offsets for kernel version 2.6.32-41-server */
memmodel guest64;
#define HAVELINUX_FILES 1/* struct dentry */
#define __OFFDENTRY_PARENT 0x0000000000000028#define __OFFDENTRYNAME 0x0000000000000030/* struct file / struct path */
#define __OFFFILEPATH Ox0000000000000010/* struct vfsmount / mount */
#define __OFF_VFSMOUNT Ox0
/* struct mm struct */
#define __OFFEXE 0x0000000000000350
/* struct task_ struct */
#define __OFF_TGID Ox000000000002bc#define __OFF_PID 0x00000000000002b8#define __OFF_PIDS 0x0000000000000328#define __OFFCOMM Ox0000000000000490#define __OFF_PARENT Ox000000000002dO
#define _ _FF_MM Ox0000000000000290
/* struct current_ thread */
#define __OFFTASK OxOOOOOOOOOOOOcbcO
#define __CURTHRPTR (GSBASE >= Ox1OOOOOOOO ? GSBASE KERNELGSBASE)
Figure 4-6: Sample /proc/vprobe-of f sets
headers, load it into an appropriate kernel, copy /proc/vprobe-offsets (which will
look like the sample in Figure 4-6) off the machine, and then #include it in their
Emmett code.
We note that the contents of /proc/vprobe-of f sets is specific to a kernel version,
architecture, and build options, but is not at all specific to a particular boot of the
kernel. Consequently, the machine being instrumented does not need to be running
the kernel module. A future improvement would be retrieve the offsets directly from
the compiled kernel module, without loading it at all.
4.2.4 Windows gatherer: pdbparse
Because the Windows gatherer was built after the Linux gatherer, from the start it
was designed to use debugging symbols. Microsoft makes symbols publicly available
for use with their debugger, and they can be downloaded separately. We have a
43
script pdb2structs.py that uses the third-party pdbparse Python library[5] to ex-
tract selected fields and structures from a PDB file (Windows debugging information)
into an Emmett file containing sparse structures. We run this with an input file of
Microsoft's ntkrnlmp.pdb, downloaded from their website, to produce the requisite
offset information. Since we directly produce Emmett structures, the Windows kernel
structures can be traversed just as they would be in kernel code.
There is also room for future improvement in the Windows offset-extraction ma-
chinery, though it is much more convenient than the Linux machinery is. One option
would be to extend pdb2structs.py to handle a wider variety of types. It already
handles simple structures, arrays, and most primitive data types, but it does not sup-
port a variety of less-used types in C, such as typedefs, enums, unions, bitfields, or
nested structures. None of these are currently needed, but support could be helpful
in the future. The pdbparse library also has a printctypes script. An alternative
approach would be to adapt it to be a better fit for what we need, which might be
easier than adding more features to our current script.
4.3 Structure of instrumentation
The VProbes distribution has long included "preloads" for various operating sys-
tems, which are libraries with basic support for examining a running operating
system. The bulk of the instrumentation comes in the form of improved machin-
ery for finding field offsets and encoding them in scripts (already described in Sec-
tion 4.2.2) and enhanced preloads (which are a straightforward combination of the
structures described in Section 4.1 and the field offset work). The improved ma-
chinery and enhanced preloads are now available in the VProbes distribution, at
https://github.com/vmware/vprobe-toolkit.
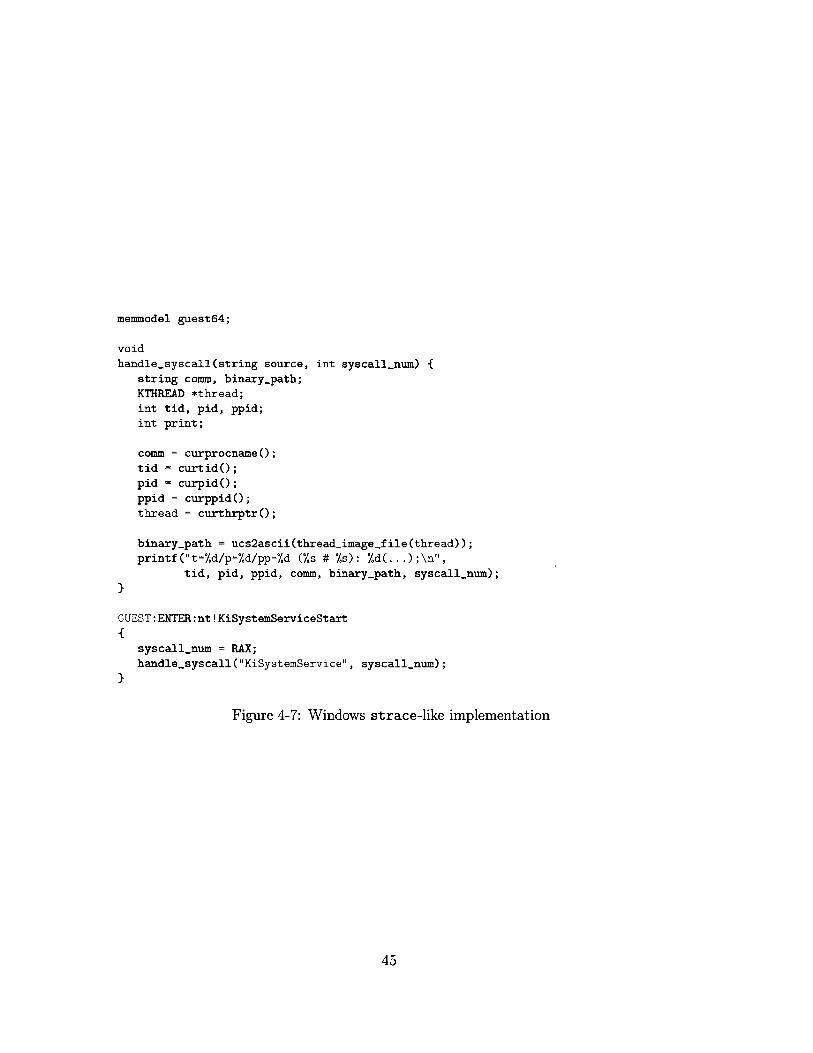
The instrumentation itself is quite simple, especially for Windows. It uses a
preload to find the current program and thread process information, retrieves the
system call number from %rax, and prints out the accumulated data. The source is
shown in Figure 4-7.
44
memmodel guest64;
voidhandle-syscall(string source, int syscall-num) {
string comm, binary-path;
KTHREAD *thread;
int tid, pid, ppid;int print;
comm = curprocname (;tid = curtido;pid = curpidO;ppid = curppid(;thread = curthrptr(;
binary-path = ucs2ascii(thread-image-file (thread));printf ("t=d/p=Xd/pp=%d (Ms # %s): %d(... );\n",
tid, pid, ppid, comm, binary-path, syscall-num);
}
GUEST: ENTER: nt! KiSystemServiceStart
{syscall-num = RAX;handle-syscall("KiSystemService", syscallnum);
}
Figure 4-7: Windows strace-like implementation
45
For the proof-of-concept analysis work described in Chapter 5, the data supplied
by the Windows instrumentation is sufficient. The Linux instrumentation was devel-
oped earlier, before determining precisely what data we wanted, so is consequently
able to print more data with an associated increase in complexity.
The principal additions to the Linux module are:
Decoding syscalls. The Linux module can be configured to identify the name and
arguments of certain syscalls. In this mode the resemblance to strace is par-
ticularly strong, although it does decoding for only about a dozen syscalls, and
argument decoding is limited to printing arguments as numbers or strings as
appropriate (no strace-style decoding of open's flags parameter is done, for
example).
Syscall filtering. The Linux module can be configured to only report a relatively
small number of particularly important syscalls. Since a significant portion of
the performance cost is due to formatting and outputting syscall information,
this can provide a significant performance improvement.
Binary path printing. Printing of the binary path can be disabled, which provides
a significant performance boost.
Return tracing. In addition to reporting the syscalls, the Linux module can also
report the return values. It takes some work on the analysis module's part to
match calls and returns, but the Linux module can output the raw data.
Support for both 32-bit and 64-bit Linux. Unlike the Windows version, which
was developed for Windows 7 64-bit only, the Linux version supports both
32-bit and 64-bit variants. While the bulk of the code is shared, there is
an architecture-specific component that contains information about the syscall
numbers, calling convention, and correct kernel functions to hook (for example,
system-call vs. syscall-call and sysenter-docall).
The differences, as well as increased commenting, make the Linux version sub-
stantially larger, at about 250 lines instead of 25 lines for the Windows code shown
46
in Figure 4-7.
4.4 Performance
One concern for security software such as anti-virus software or an intrusion detection
system is the performance overhead that it entails. We analyze the performance
impact from two perspectives: in Section 4.4.1. we examine how different workloads
impact the performance, while in Section 4.4.2 we consider the cost of different parts
of the instrumentation and optimizations we could make to improve the performance.
4.4.1 Different workloads
Since VProbes primarily causes a slowdown when the probe triggers, we would expect
the performance to depend largely on how often system calls occur: in a workload
involving many system calls, we expect performance to suffer relatively heavily; in a
largely computational workload, however, we expect performance to be roughly the
same as without the instrumentation.
To measure the performance overhead of the instrumentation, we ran an Apache
httpd instance in a VM and ran ab[2] on the host to measure how long it took to make
a large number of requests to the server. The VM had two virtual CPU's and ran
under VMware Workstation, while the host was a Dell Precision T3400 workstation.
We tested with several different file sizes and both static and dynamic content to
get a sense of how different syscall patterns might affect performance. We expected
that large file sizes would require substantially fewer syscalls per unit time than
small files, because more time will be spent streaming the response from disk to the
network, and comparatively less time will be spent doing short reads or connection
setup and teardown. Similarly, we expected dynamic content to require fewer syscalls
per unit time, because more time will be spent parsing and executing the content.
Consequently, we would expect small static files to have high overhead from the
instrumentation, and large files or dynamic content to have lower overhead.
For each file size and source, we ran ab several times in a row, discarding the first
47
run from our results. The number of times we had ab download each file depended
on the file size; we aimed to have each run of ab take several seconds, and varied the
number of repetitions appropriately - from 500 repetitions for dynamic content or
large files up to 50,000 for a tiny file. For this test, we used a version of the Linux
instrumentation that printed about a dozen syscalls and decoded their arguments.
We found that for small static files (a couple hundred or thousand bytes), per-
formance was prohibitive. (Indeed, VProbes automatically disables probe fires when
they are causing excessively high overhead; this check triggered with particularly
small files.) Larger files were more reasonable: a 13KB file had roughly 5% overhead
compared to an uninstrumented server, and 20KB or larger files had overhead well
under 1%. We also considered a common web application - MediaWiki - to see
how dynamic sites compared. An 11KB page saw about 13% overhead, while a 62KB
page saw 3% overhead.
4.4.2 Optimization opportunities
Our current instrumentation is entirely unoptimized. We wanted to get a better sense
of what portions of the instrumentation are slow. In order to make the performance
overhead more apparent, we enabled printing of all system calls and used a moderately
sized file to ensure that the performance overhead was readily apparent but that the
probe still executed.
As before, we did our tests using ab on the same host against Apache httpd in
a VM. For this test, we used a standardized 10KB file that we downloaded 10,000
times for each run. To perform the experiment, we systematically removed parts of
the instrumentation to see how much time each part required.
We tested four variants of the instrumentation. First, we tested without VProbes
running at all. Second, we tested setting the breakpoint we use, but without running
any code when the breakpoint triggered. Third, we ran the full instrumentation
code except for computing the path to the executing binary. Finally, we ran the full
instrumentation, including finding the binary path.
With no instrumentation, we found that our test took 4.7 seconds on average.
48
16
14
12
10.3 secs10
*08 - 7.4 secs
0
6 --
4.7 aecs
4
2
0No instrumentation Null inatrumentation No binary path printing Full instrumentation
(breakpoint only)
Instrumentation Variant
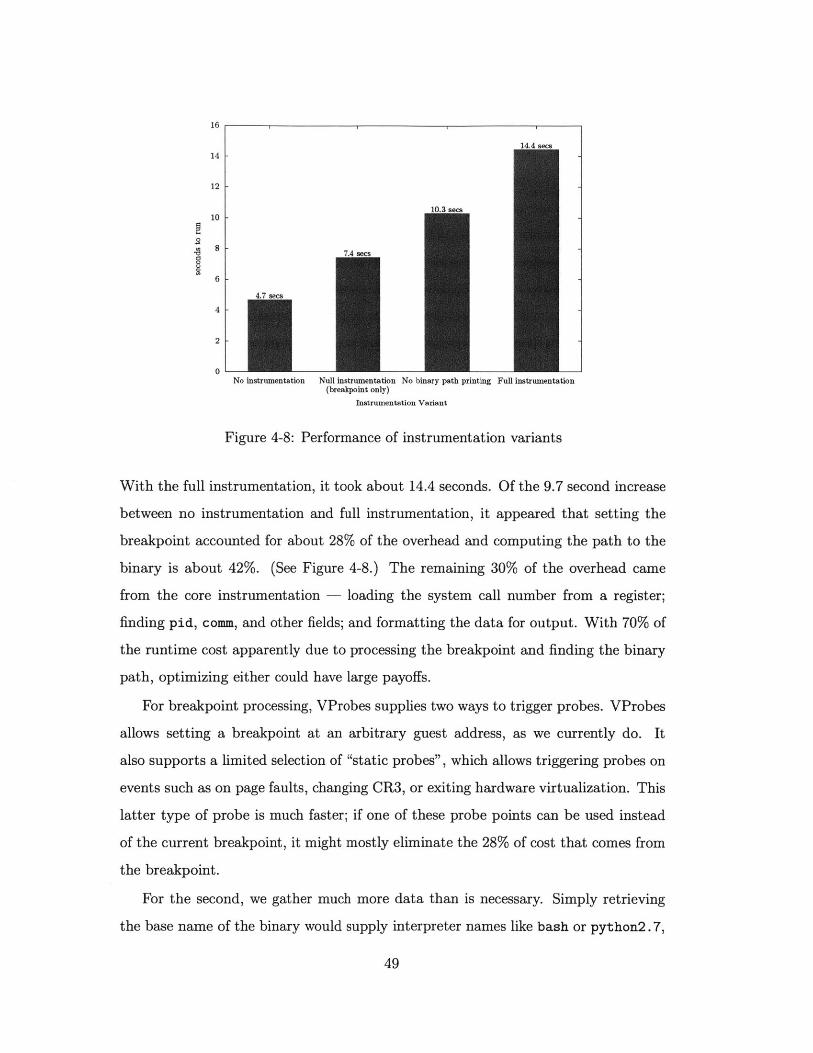
Figure 4-8: Performance of instrumentation variants
With the full instrumentation, it took about 14.4 seconds. Of the 9.7 second increase
between no instrumentation and full instrumentation, it appeared that setting the
breakpoint accounted for about 28% of the overhead and computing the path to the
binary is about 42%. (See Figure 4-8.) The remaining 30% of the overhead came
from the core instrumentation - loading the system call number from a register;
finding pid, comm, and other fields; and formatting the data for output. With 70% of
the runtime cost apparently due to processing the breakpoint and finding the binary
path, optimizing either could have large payoffs.
For breakpoint processing, VProbes supplies two ways to trigger probes. VProbes
allows setting a breakpoint at an arbitrary guest address, as we currently do. It
also supports a limited selection of "static probes", which allows triggering probes on
events such as on page faults, changing CR3, or exiting hardware virtualization. This
latter type of probe is much faster; if one of these probe points can be used instead
of the current breakpoint, it might mostly eliminate the 28% of cost that comes from
the breakpoint.
For the second, we gather much more data than is necessary. Simply retrieving
the base name of the binary would supply interpreter names like bash or python2.7,
49
or the program name for compiled languages. This is substantially faster than finding
the full path, and with the comm value is likely sufficient. However, because finding
even the first dentry requires traversing a large number of pointers, this is still fairly
slow. An alternative, and likely more fruitful technique, would be to print the binary
path much less often. For example, we could store a list of all current->mm or
current->mm->exe_f ile values we have seen. Normally, we could display only the
address, and only print the full path when we see a new value. Because the mm value
is directly available from the current taskstruct with no extra pointer loads, this
should be quite fast, and VProbes provides a "bag" structure that allows quick lookup
of integer keys.
Overall, the instrumentation performance is already likely acceptable for some use
cases, and several large optimization opportunities still remain.
50

Chapter 5
Analysis component
The instrumentation component produces a stream of system calls and information
about the program making the system calls. The analysis component takes one such
list from normal behavior and a stream from current behavior and must turn that
into a signal "probably uncompromised" or "probably compromised". In a production
IDS, another system would take this information and take some appropriate action,
such as firewalling the machine, pausing it, or notifying an administrator.
There is ample academic literature on how to use system call records to determine
whether a system is compromised. For a description of many relevant articles, see
Section 2.1.1. Because of this ample history, our focus was on developing the in-
strumentation, with our analysis component work primarily done to ensure that the
instrumentation component was producing sufficient data that included all necessary
information to detect attacks.
We developed two different analysis modules for this work. The first uses a simple
whitelist, while another uses sequence time-delay embedding, or stide [19].
5.1 W hitelist
The first module is a simple whitelist, which builds a list of all system calls used in
normal operations, and assumes that new system calls are a sign of a compromise.
While simple, this analyzer can detect some attacks. We installed a proftpd
51
server that was vulnerable to the buffer overflow described in CVE-2010-4221, and
attacked it using the Metasploit Project's exploit [8]. Under normal operation, a
FTP server has a simple syscall pattern: it mostly just opens, reads, writes, and
closes files. An attack, however, will often use execve. Since the FTP daemon does
not normally use execve, it will not show up on the whitelist, and the analyzer will
immediately trigger.
For this module, we do not analyze the arguments to the system calls or the relative
ordering of system calls. This approach has the advantage of being relatively simple
to understand and write (making it an excellent first check on the instrumentation
producing useful data). Additionally, it has a low false positive rate, since the profile
is simple enough that building a complete "normal" profile is manageable. However,
it is effectively useless for a large class of legitimate workloads. For example, a
typical web server running CGI scripts will routinely be forking and executing new
programs, which will blind a whitelist-based system to any attack whose payload
involves compromising the web server and then executing malicious commands.
We assign each system call to a calling program's profile based on the combination
of the comm value (or Windows equivalent) and the full binary path. As we describe in
Section 4.1.1, both are needed to produce a good profile. We need comm to distinguish
multiple programs written in the same interpreted language from each other, as the
binary path will just be the path to the interpreter. For this analysis module, the full
binary path is particularly critical - it allows us to distinguish a server like proftpd
from its init script. Since we look at only a single system call at a time, we want to
be able to trigger when an FTP server makes an execve call, which means that the
server must use a different profile than the init script.
We used the whitelist-based analyzer primarily to verify that the instrumentation
was generating enough data to be usable. We tested this using a vulnerable Debian
i386 system with proftpd 1.3.3a. To generate a normal profile, we instrumented the
virtual machine, rebooted it, and let it run for an several minutes to generate enough
data. We then attacked it using Metasploit's proftp.telnetiac exploit, using a
payload that ran a shell command. Because the exploit forks and proftpd does not,
52
the whitelist analyzer detected the exploit successfully.
For an additional test, we also installed Tomcat on the same machine and used a
similar exploit. This test demonstrated why simply whitelisting system calls is not a
usable mechanism to detect attackers - even in normal operation the Tomcat Java
process makes execve and clone calls, which we had been depending on to identify
an attacker.
5.2 Sequence time-delay embedding (stide)
A more powerful mechanism commonly used in the academic intrusion detection
literature is sequence time-delay embedding, or stide. In this technique, a program's
profile consists of all n-tuples of consecutive system calls. For example, with n = 3
and a syscall sequence of open, read, write, read, write, close, the 3-tuples would be
(open, read, write), (read, write, read), (write, read, write), and (read, write, close).
To scan a trace for an intrusion, the analyzer checks for tuples that are not found in
the training data. If enough such tuples are found in some sliding window, then an
intrusion is likely. The length of the tuples, size of the sliding window, and threshold
of how many tuples are required to trigger the system can all be tuned to achieve an
acceptable level of false positives and negatives.
We tried testing stide with both the proftpd and Tomcat exploits mentioned
above, after training stide with a short trace from normal operation. When we tested
it with new traces from when the servers were operating as normal and while being
exploited, however, it detected an attack in both cases. We were unable to get stide
to ignore traces from normal behavior while still alerting on traces from a sample
attack - that is, to reduce false positives to a reasonable level without drastically
reducing the correct positives. However, there are several approaches that we have
not adequately explored.
There is a wide range of tweaks we could try making to the parameters, and some
opportunities to refine our stide implementation. We might consider excluding some
system calls from the tuples, if they are incredibly common and seem to merely bloat
53
the set of tuples we see. Additionally, because there are so many syscalls and tuples
are several syscalls in length, stide needs much more input data, so it might work
substantially better with, for example, several days of production data rather than
tens of minutes of lab data.
The biggest untapped opportunity may come from the thread ID outputted by
the instrumentation. Right now, we entirely ignore the process and thread IDs
while building profiles, and build our sequences entirely by looking at the time-
ordered sequences of system calls made by one program name. This results in a
less-deterministic set of sequences, since multiple threads or instances of a program
will be interleaved in a mostly-random fashion. One refinement would be to build
our n-tuples on a per-thread basis, but add each n-tuple to a single profile for each
program.
54
Chapter 6
Conclusion & future work
We developed VIVID, a novel proof-of-concept host-based intrusion detection system.
Unlike most prior host-based IDSes, we avoid an agent on the machine being protected
by instead running our agent on a virtual machine host. This design allows our system
to resist attacks that might attempt to disable an on-machine agent or subvert its
ability to detect, report, or block attackers. By running the agent outside the machine
being protected we benefit from a smaller trusted codebase of the virtual machine
monitor rather than requiring that the entire guest operating system be secure, while
simultaneously being able to more closely examine the machine being protected than
a network-based IDS can.
Our system successfully shows that building the necessary instrumentation on
top of a common, unmodified virtualization product, VMware Workstation or ESX,
is now entirely feasible. Depending on the workload, our system operates with an
acceptable performance overhead. We also developed two proof-of-concept analysis
modules to use the data our instrumentation produces, and verified that VIVID can
successfully detect some attacks.
6.1 Future Work
There is much room for future work, including many opportunities that have been
mentioned in previous chapters. We summarize some of the major possibilities again
55

here.
On the instrumentation front, the system provides the required data. However, the
Linux module (Section 4.2.3) should be converted to use debugging symbols directly
(as with the Windows support using pdbparse), rather than needing to run the kernel
to extract the needed offsets. Additionally, we could optimize the instrumentation,
as described in Section 4.4.
The analysis component has extensive room for improvement, as it was not the
focus of our work. In Section 5.2 we discuss several ways to improve our stide im-
plementation. Beyond stide, academic literature includes many additional techniques
for discerning attacks amongst a stream of system calls, and we could also try imple-
menting more of those.
Finally, more real-world trials would be informative. One option is finding more
real or custom-built malware to test our system against in the lab. We could also
install a honeypot, expose it to the Internet, and examine the attacks targeted against
it. Finally, we could install the system on production servers and refine its usability
in a real-world environment.
56
Appendix A
Selected code
In this section we include some of the code developed for the instrumentation com-
ponent. The scripts for extracting offsets and the preloads have been released for
others to use at https: //github. com/vmware/vprobe-toolkit. The analysis code,
not being particularly novel, is not included here.
A.1 Windows instrumentation
A.1.1 pdbparse: extracting offsets
The Windows instrumentation involves pdb2structs.py, a Python script that uses
the pdbparse[5] library to extract offsets from Windows debugging symbols files (.pdb
files).
pdb2structs.py
#!/usr/bin/python
# pdb2structs.py
# A utility that extracts structures from a .pdb file (Windows debugging
# information).
# pdb2structs.py accepts a .pdb file (Windows debugging information) and a list
# of structure fields, and outputs an Emmett file that defines requested
57
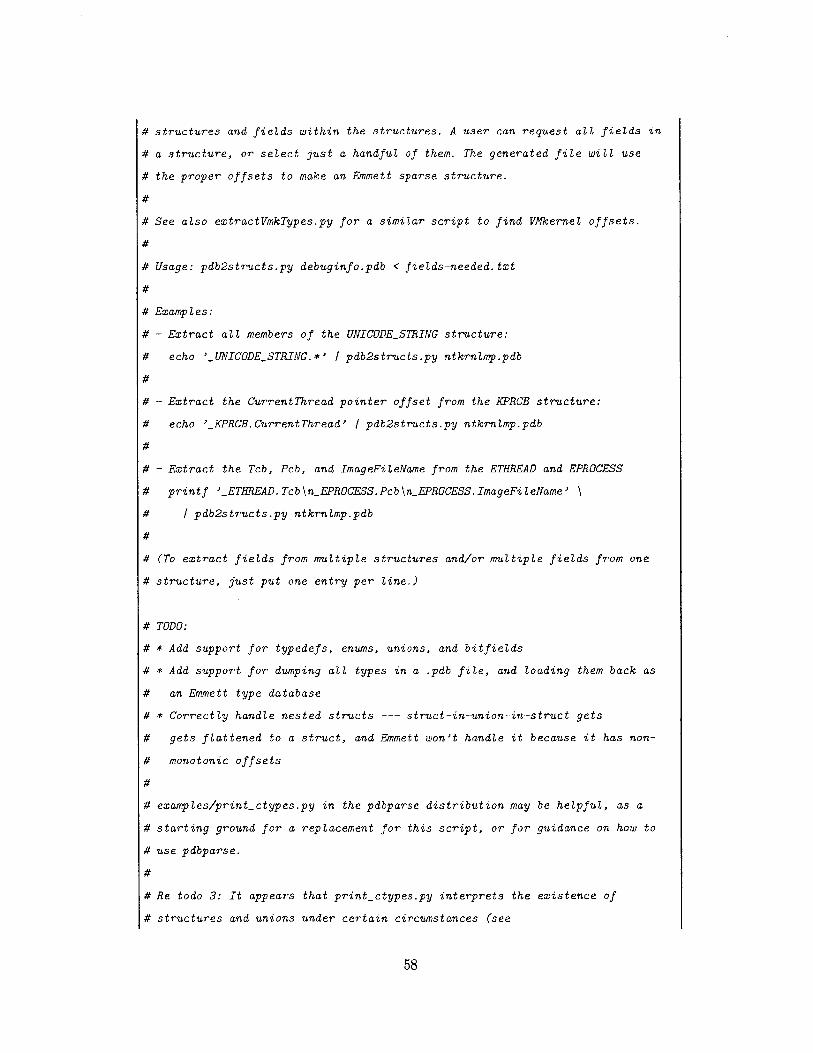
# structures and fields within the structures. A user can request all fields in
# a structure, or select just a handful of them. The generated file will use
# the proper offsets to make an Emmett sparse structure.
# See also extractVmkTypes.py for a similar script to find VMkernel offsets.
# Usage: pdb2structs.py debuginfo.pdb < fieLds-needed.txt
# Examples:
# - Extract all members of the UNICODE_STRING structure:
# echo '_UNICLDESTRING.*' / pdb2structs.py ntkrnlmp.pdb
# - Extract the CurrentThread pointer offset from the KPRCB structure:
# echo '_KPRCB.Current Thread' | pdb2structs.py ntkrnlmp.pdb
# - Extract the Tcb, Pcb, and ImageFileName from the ETHREAD and EPROCESS
# printf '_ETREAD. Tcb\nEPROCESS.Pcb\nEPROCESS.ImageFileName' \
# | pdb2structs.py ntkrnlmp.pdb
# (To extract fields from multiple structures and/or multiple fields from one
# structure, just put one entry per line.)
# TODO:
# * Add support for typedefs, enums, unions, and bitfields
# * Add support for dumping all types in a .pdb file, and loading them back as
# an Emmett type database
# * Correctly handle nested structs --- struct-in-union-in-struct gets
# gets flattened to a struct, and Emmett won't handle it because it has non-
# monotonic offsets
# examples/print-ctypes.py in the pdbparse distribution may be helpful, as a
# starting ground for a replacement for this script, or for guidance on how to
# use pdbparse.
# Re todo 3: It appears that print-ctypes.py interprets the existence of
# structures and unions under certain circumstances (see
58

# member_list_fromoffset_map). We could probably just have multiple members
# with the safe offset (given an Emmett change to eliminate the "Non-monotonic
# offset for field" error), or also imagine structs and unions not in the .pdb
# file.
# Modifying printctypes.py to print Emmett type definitions also looks pretty
# doable. It seems somewhat plausible that the upstream maintainer would accept
# a patch to making hooking in an Emmett theme easy (or even ship with the
# Emmett theme), if we wanted to pursue that. (He's accepted other third-party
# patches without much hassling.)
import collections
import sys
import pdbparse
primitiveTypes = {
"VOID": "void",
"CHAR": "char",
"SHORT": "short",
"LONG": "long",
"QUAD": "long long",
}
def canonicalizeType(typeRef):
"""Convert a type from pdbparse into an Emmett type
@param typeRef: a string or pdbparse structure representing the type
@return: a (typeName, prefix, suffix) describing the type for Emmett
prefix =
suffix =
if type(typeRef) == str:
assert typeRef.startswith("T_"), \
"Primitive types should start with T_; got "%s'" ' (typeRef, )
typeRef = typeRef [2:]
59
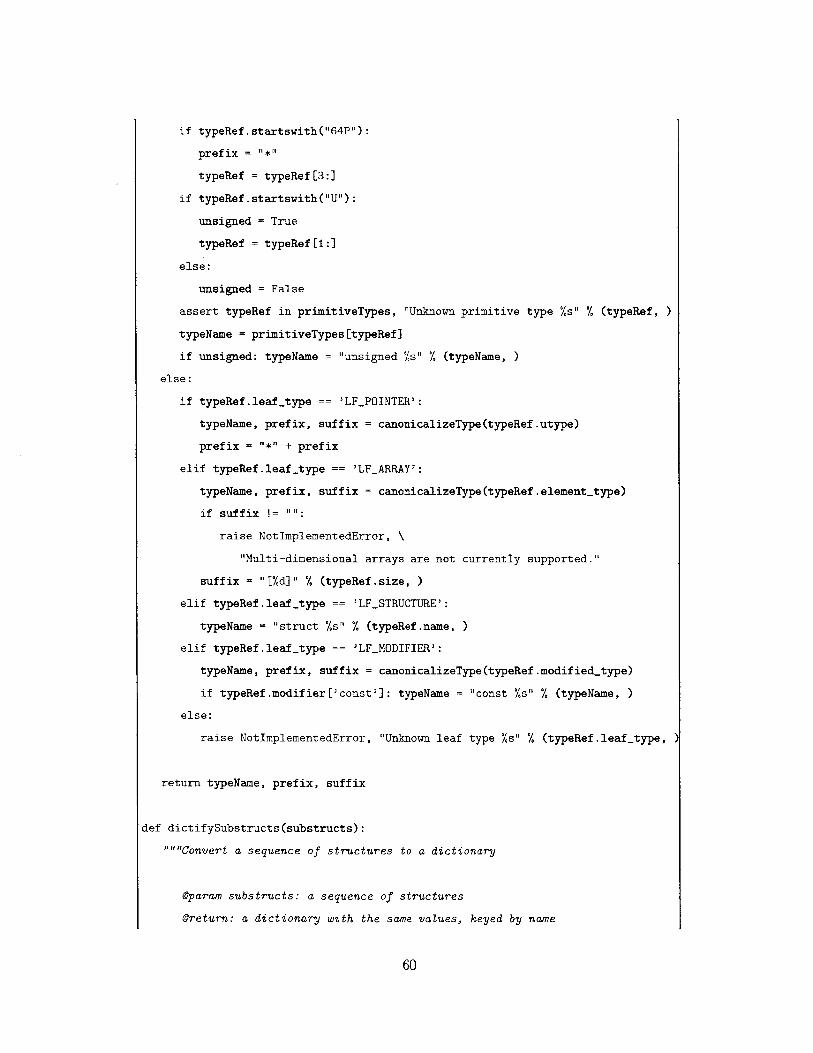
if typeRef.startswith("64P"):
prefix = "*"
typeRef = typeRef[3:]
if typeRef . startswith("U"):
unsigned = True
typeRef = typeRef[1:]
else:
unsigned = False
assert typeRef in primitiveTypes, "Unknown primitive type %s" % (typeRef, )
typeName = primitiveTypes[typeRef]
if unsigned: typeName = "unsigned %s" ' (typeName, )
else:
if typeRef.leaf.type == 'LFPOINTER':
typeName, prefix, suffix = canonicalizeType(typeRef .utype)
prefix = "*" + prefix
elif typeRef.leaf-type == 'LFARRAY':
typeName, prefix, suffix = canonicalizeType(typeRef .element-type)
if suffix != "":
raise NotImplementedError, \
"Multi-dimensional arrays are not currently supported."
suffix = "[Ud]" % (typeRef.size, )
elif typeRef.leaf-type == 'LFSTRUCTURE':
typeName = "struct 's" % (typeRef.name, )
elif typeRef.leaf.type == 'LF-MODIFIER':
typeName, prefix, suffix = canonicalizeType(typeRef.modifiedtype)
if typeRef.modifier['const']: typeName = "const 's" ' (typeName, )
else:
raise NotImplementedError, "Unknown leaf type %s" ' (typeRef.leaf -type, )
return typeName, prefix, suffix
def dictifySubstructs(substructs):
"""Convert a sequence of structures to a dictionary
@param substructs: a sequence of structures
@return: a dictionary with the same values, keyed by name
60

ret = {}
for struct in substructs:
ret[struct.name] = struct
return ret
def formatFieldspec(fieldspec):
"""Format a single field of a structure
@param fieldspec: pdbparse's description of the field to be formatted
@return: string representation of the desired field
fieldOffset = fieldspec.offset
fieldType, fieldPrefix, fieldSuffix = canonicalizeType(fieldspec.index)
fieldName = fieldspec.name
return " @OxX03x %-19s %lsss;" ' C
fieldOffset, fieldType, fieldPrefix, fieldName, fieldSuffix,
)
def formatStruct(structInfo, fields):
"""Format the structure provided with the given fields.
Oparam structInfo: pdbparse's representation of a single structure
@param fields: requested fields (as strings with just the fieldname)
@return: string representation of the desired structure
name = structInfo.name
substructs = dictifySubstructs(structInfo.fieldlist.substructs)
if '*' in fields:
fields = [struct.name for struct in structInfo.fieldlist.substructs]
fieldSpecs = [formatFieldspec(substructs[field]) for field in fields]
return "struct %s {\ns\n};\n" ' (name, "\n".join(fieldSpecs), )
def formatStructs(pdbfile, fields):
"""Format the requested structures from a given .pdb file.
61
1it rIt
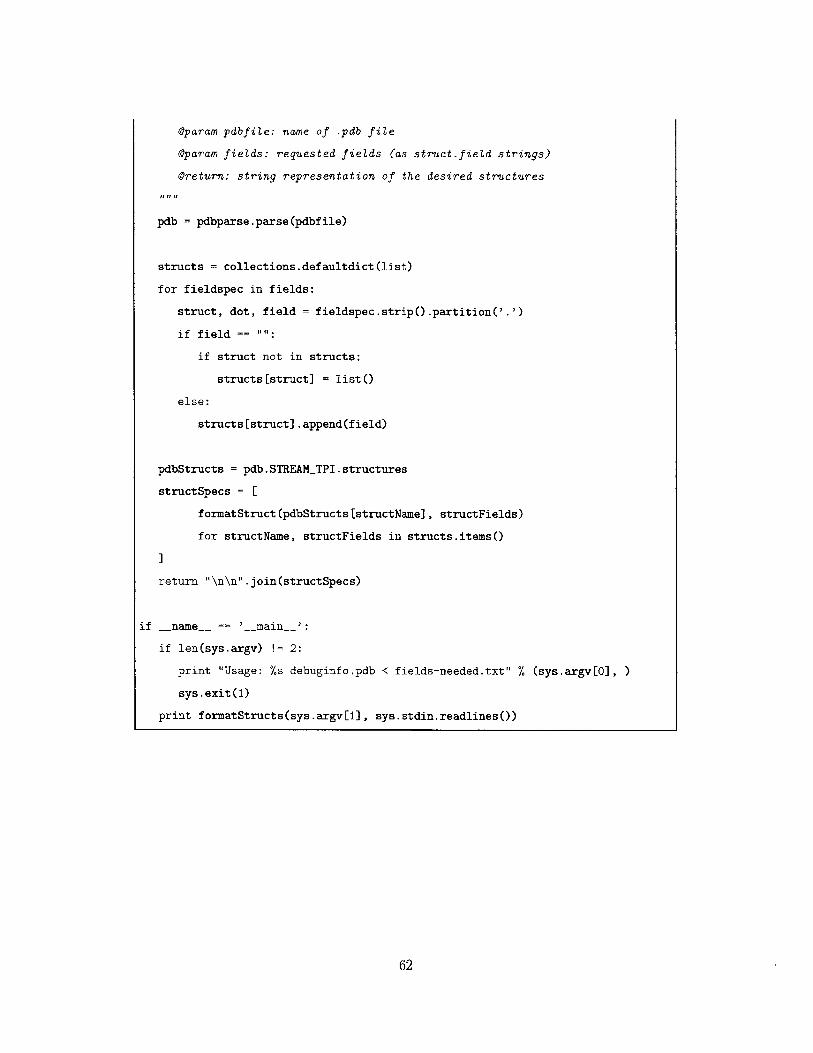
Oparam pdbfile: name of .pdb file
@param fields: requested fields (as struct.field strings)
@return: string representation of the desired structures
pdb = pdbparse.parse(pdbfile)
structs = collections.defaultdict(list)
for fieldspec in fields:
struct, dot, field = fieldspec.strip(O.partition('. )
if field == "":
if struct not in structs:
structs[struct] = list()
else:
structs[struct].append(field)
pdbStructs = pdb.STREAMTPI.structures
structSpecs = [
formatStruct (pdbStructs [structName], structFields)
for structName, structFields in structs.items()
I
return "\n\n".join(structSpecs)
if -_name__ == '-_main__':
if len(sys.argv) != 2:
print "Usage: %s debuginfo.pdb < fields-needed.txt" % (sys.argv[0], )
sys.exit(1)
print formatStructs(sys.argv[1], sys.stdin.readlines()
62
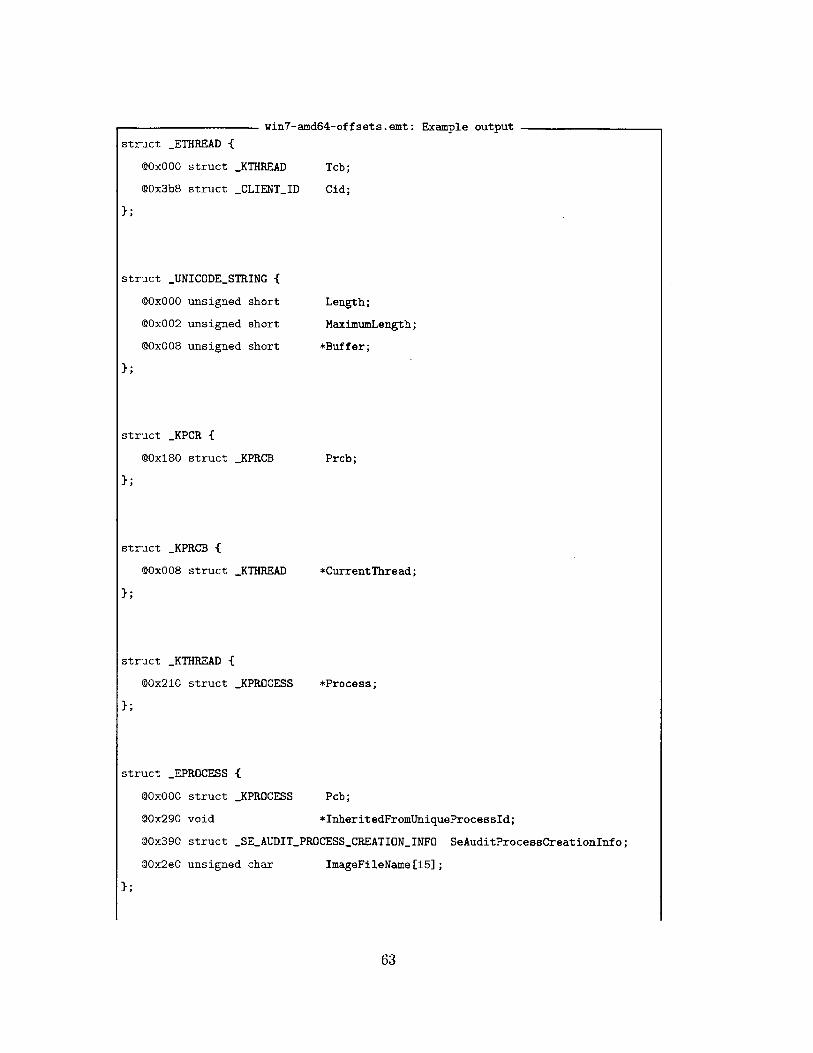
win7-amd64-offsets .emt: Example output
struct _ETHREAD {
QOxOOO struct _KTHREAD
@Ox3b8 struct _CLIENTID
struct _UNICODESTRING {
@OxOOO unsigned short
@0x002 unsigned short
QOxOO8 unsigned short
struct _KPCR {
@Ox18O struct _KPRCB
};
struct _KPRCB {
@OxOO8 struct _KTHREAD
struct _KTHREAD {
@Ox21O struct _KPROCESS
Length;
MaximumLength;
*Buffer;
Prcb;
*CurrentThread;
*Process;
struct _EPROCESS {
QOxOOO struct _KPROCESS Pcb;
QOx290 void *InheritedFromUniqueProcessId;
QOx390 struct _SEAUDITPROCESSCREATIONINFO SeAuditProcessCreationInfo;
@Ox2eO unsigned char ImageFileName[15];
63
Tcb;
Cid;
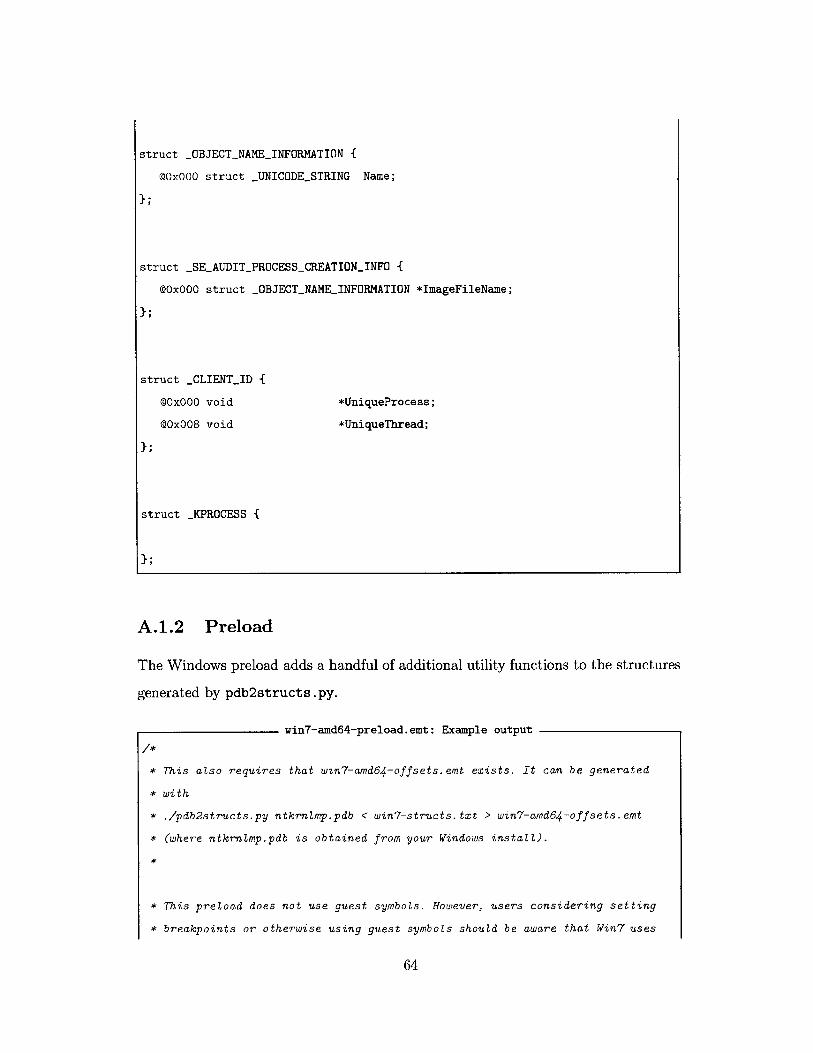
struct _OBJECTNAMEINFORMATION {
QOxOOO struct _UNICODESTRING Name;
};
struct _SEAUDITPROCESSCREATIONINFO {
@OxOOO struct _OBJECTNAMEINFORMATION *ImageFileName;
struct _CLIENTID {
cOxOOO void
OxOO8 void
*UniqueProcess;
*UniqueThread;
struct _KPROCESS {
A.1.2 Preload
The Windows preload adds a handful of additional utility functions to the structures
generated by pdb2structs.py.
win7-amd64-preload.emt: Example output
* This also requires that win7-amd64-offsets.emt exists. It can be generated
* with
* ./pdb2structs.py ntkrnlmp.pdb < win7-structs.txt > win7-amd64-offsets.emt
* (where ntkrnimp.pdb is obtained from your Windows install).
*
* This preload does not use guest symbols. However, users considering setting
* breakpoints or otherwise using guest symbols should be aware that Win7 uses
64
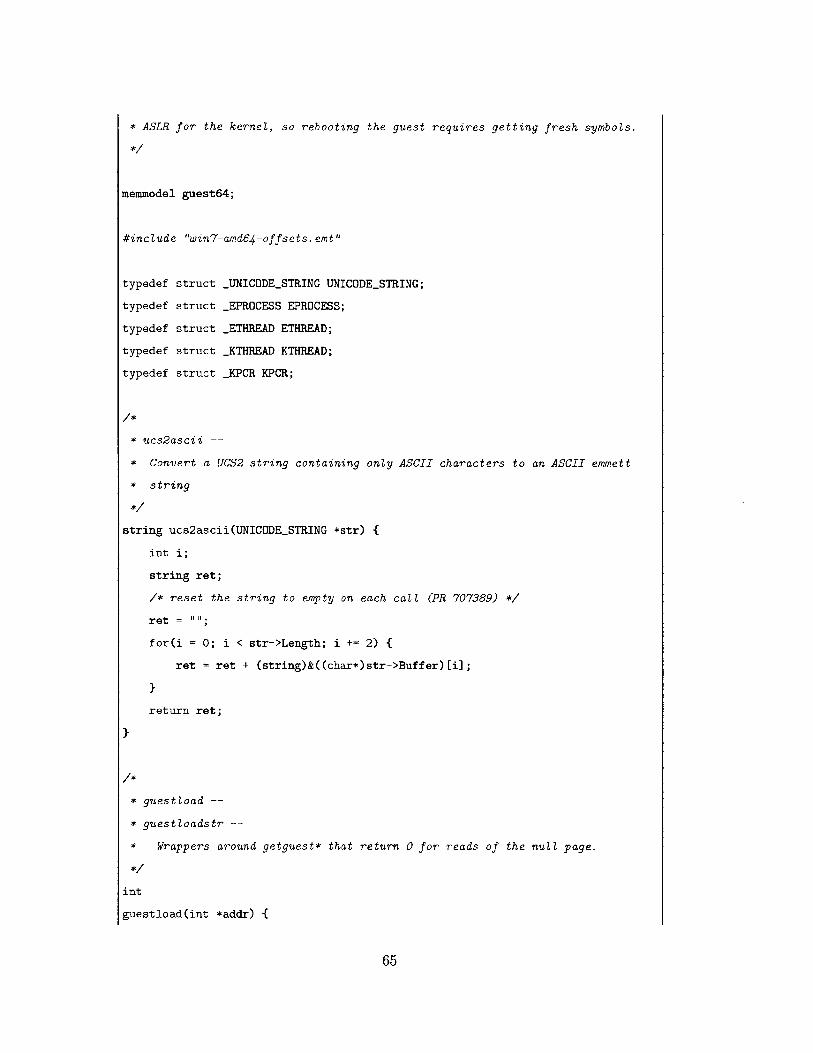
* ASLR for the kernel, so rebooting the guest requires getting fresh symbols.
memmodel guest64;
#include "win7-amd64-offsets. emt"
typedef struct _UNICODESTRING UNICODESTRING;
typedef struct _EPROCESS EPROCESS;
typedef struct _ETHREAD ETHREAD;
typedef struct _KTHREAD KTHREAD;
typedef struct _KPCR KPCR;
* ucs2ascii --
* Convert a UCS2 string containing only ASCII characters to an ASCII emmett
* string
string ucs2ascii(UNICODESTRING *str) {
int i;
string ret;
/* reset the string to empty on each call (PR 707389) */
ret = "
for(i = 0; i < str->Length; i += 2) {
ret = ret + (string)&((char*)str->Buffer)[i];
}
return ret;
}
* guestload --
* guestloadstr --
* Wrappers around getguest* that return 0 for reads of the null page.
int
guestload(int *addr) {
65

return addr < (1 << 12) ? 0 : *addr;
}
long
guestloadlong(long *addr) {
return addr < (1 << 12) ? 0 : *addr;
}
string
guestloadstr(char *addr) {
return addr < (1 << 12) ? "<NULL>" : (string)addr;
}
* Initialize offsets.
int calcPcbOffset() {
struct _EPROCESS *null-process = 0;
int pcbOffset;
pcbOffset = (int)(&null-process->Pcb);
return pcbOffset;
I
int calcTcbOffset() {
struct _ETHREAD *null-thread = 0;
int tcbOffset;
tcbOffset = (int)(&null-thread->Tcb);
return tcbOffset;
I
VMMLoad
{
pcbOffset = calcPcbOffseto;
if(pcbOffset != 0) {
printf("Warning: Pcb is not at the start of the _EPROCESS structure.\n"
66
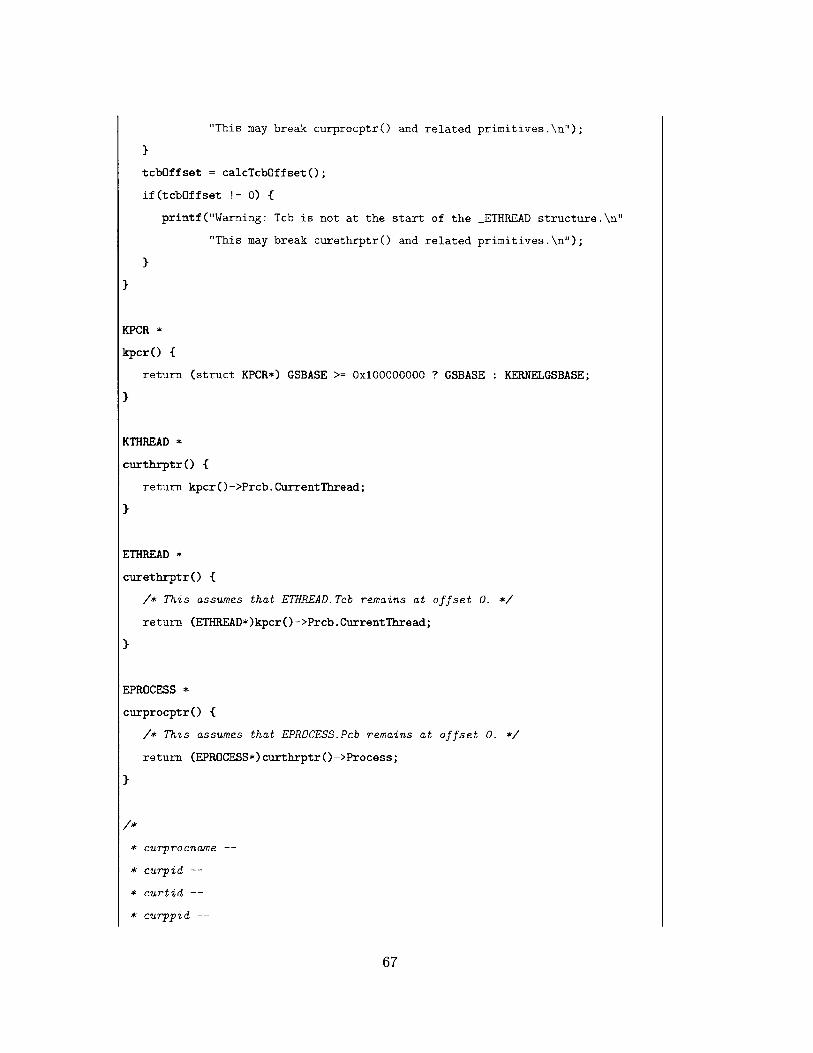
"This may break curprocptr() and related primitives.\n");
}
tcbOffset = calcTcbOffset(;
if(tcbOffset != 0) {
printf("Warning: Tcb is not at the start of the _ETHREAD structure.\n"
"This may break curethrptr() and related primitives.\n");
}
}
KPCR *
kpcr() {
return (struct KPCR*) GSBASE >= OxO0000000 ? GSBASE KERNELGSBASE;
}
KTHREAD *
curthrptr() {
return kpcr(->Prcb.CurrentThread;
}
ETHREAD *
curethrptr() {
/* This assumes that ETHREAD.Tcb remains at offset 0. */
return (ETHREAD*)kpcr()->Prcb.CurrentThread;
}
EPROCESS *
curprocptr() {
/* This assumes that EPROCESS.Pcb remains at offset 0. */
return (EPROCESS*) curthrptr O->Process;
}
* curprocname --
* curpid
* curtid --
* curppid --
67
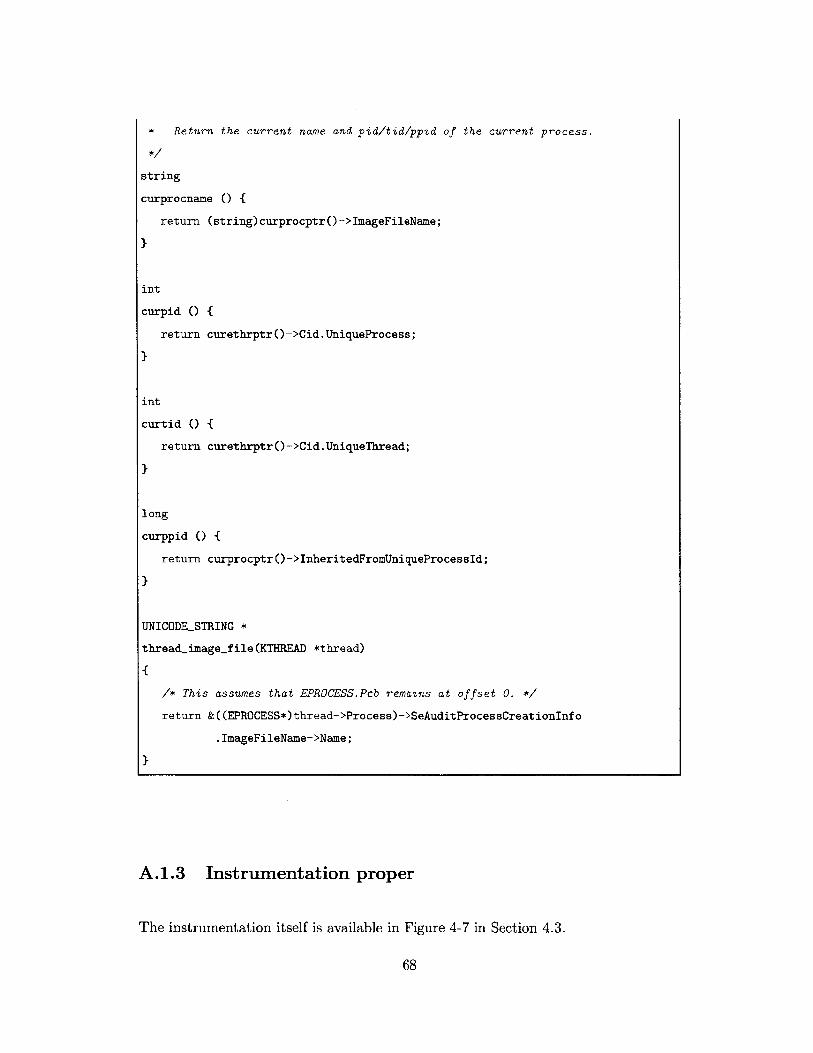
* Return the current name and pid/tid/ppid of the current process.
string
curprocname () {
return (string)curprocptr()->ImageFileName;
}
int
curpid C) {
return curethrptro->Cid.UniqueProcess;
}
int
curtid () {
return curethrptr()->Cid.UniqueThread;
}
long
curppid C) {
return curprocptr()->InheritedFromUniqueProcessId;
}
UNICODESTRING *
threadimage-file (KTHREAD *thread)
{
/* This assumes that EPROCESS.Pcb remains at offset 0. */
return &((EPRCESS*)thread->Process)->SeAuditProcessCreationInfo
.ImageFileName->Name;
}
A.1.3 Instrumentation proper
The instrumentation itself is available in Figure 4-7 in Section 4.3.
68
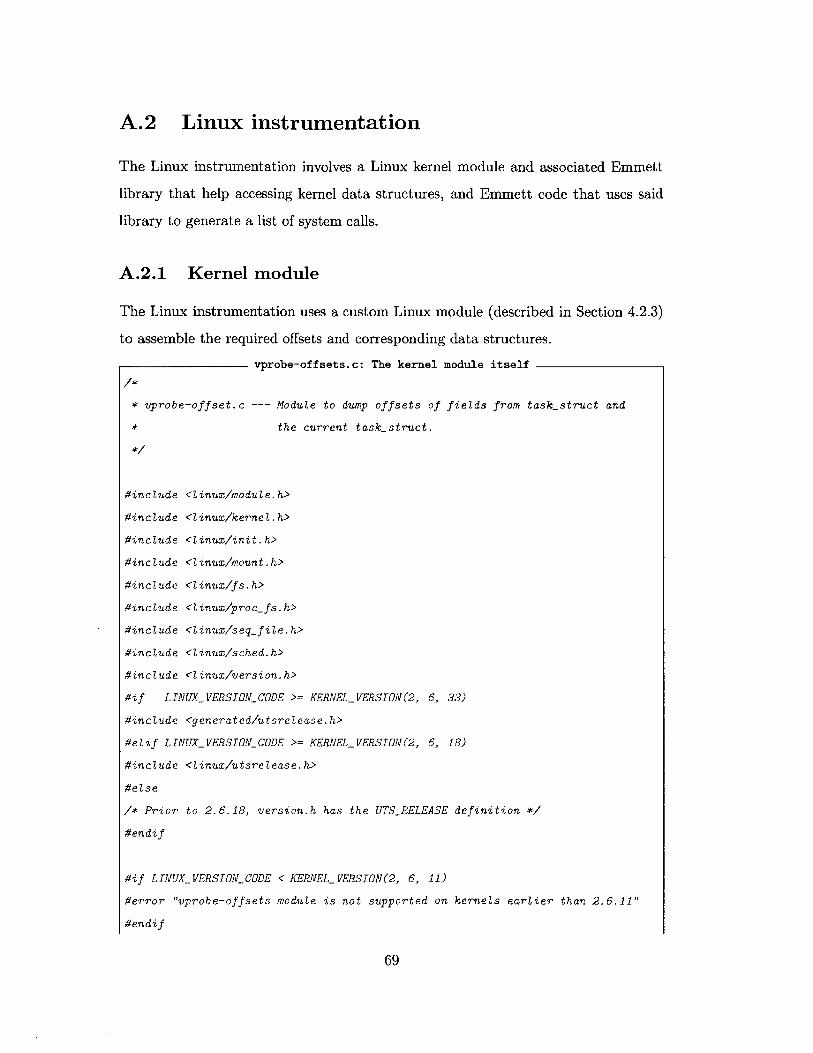
A.2 Linux instrumentation
The Linux instrumentation involves a Linux kernel module and associated Emmett
library that help accessing kernel data structures, and Emmett code that uses said
library to generate a list of system calls.
A.2.1 Kernel module
The Linux instrumentation uses a custom Linux module (described in Section 4.2.3)
to assemble the required offsets and corresponding data structures.
vprobe-offsets.c: The kernel module itself
* vprobe-offset.c --- Module to dump offsets of fields from taskstruct and
* the current task_struct.
#include <Linux/module.h>
#incLude <Linux/kernel. h>
#include <Linux/init.h>
#inc lude < inux/mount .h>
#include <linux/f s. h>
#include <iinux/proc-fs.h>
#include <Zinux/seq-fie.h>
#include <Zinux/sched.h>
#incLude <I inux/version. h>
#if LINUX_ VERSION_CODE >= KERNELVERSION(2, 6, 33)
#include <generated/utsrelease.h>
#elif LINUXIVERSION_ CODE >= KERNEL_ VERSION (2, 6, 18)
#include <Linux/utsrelease.h>
#else
/* Prior to 2.6.18, version.h has the UTS_RELEASE definition */
#endif
#if LINUX VERSION_CODE < KERNELVERSION(2, 6, 11)
#error "vprobe-offsets module is not supported on kernels earlier than 2.6.11"
#endif
69

* Depending on the kernel version, curthrptr gets a pointer to either the,
* thread-info, the pda or the per cpu area for each cpu.
* taskoffset contains the offset to where the current taskstruct is stored
* in the curthrptr area.
#ifdef CONFIG_X86_32
#define MEMMODEL "guest32"
#if LINUXVERSION_CODE >= KERNELVERSION(2, 6, 22)
#define curthrptr "FSBASE"
#if LINUX_ VERSION_CODE >= KERNELVERSION(2, 6, 34)
#define task-offset ¤ttask
#else /* 2.6.22 to 2.6.33 */
#if LINUX_VERSIONCODE < KERNELVERSION (2, 6, 25)
#define percpu-var(var) percpu__##var
#endif
#define task-offset 8per-cpuvar(currenttask)
#endif
#elif LINUX_ VERSION_CODE >= KERNELVERSION(2, 6, 20)
/* No swapgs for i386 */
#define curthrptr "GSBASE"
#define task-offset offsetof(struct i386_pda, pcurrent)
#eise
/* FIXME: This doesn't work in user context */
#if THREADSIZE == 4096
#define curthrptr "(RSP & Oxfffff000)"
#elif THREADSIZE == 8192
#define curthrptr "(RSP & OxffffeoOO)"
#else
#error "Invalid thread size"
#endif
#define task-offset 0
#endif /* LINUXVERSIONCODE */
#else /* !X86_32 */
70
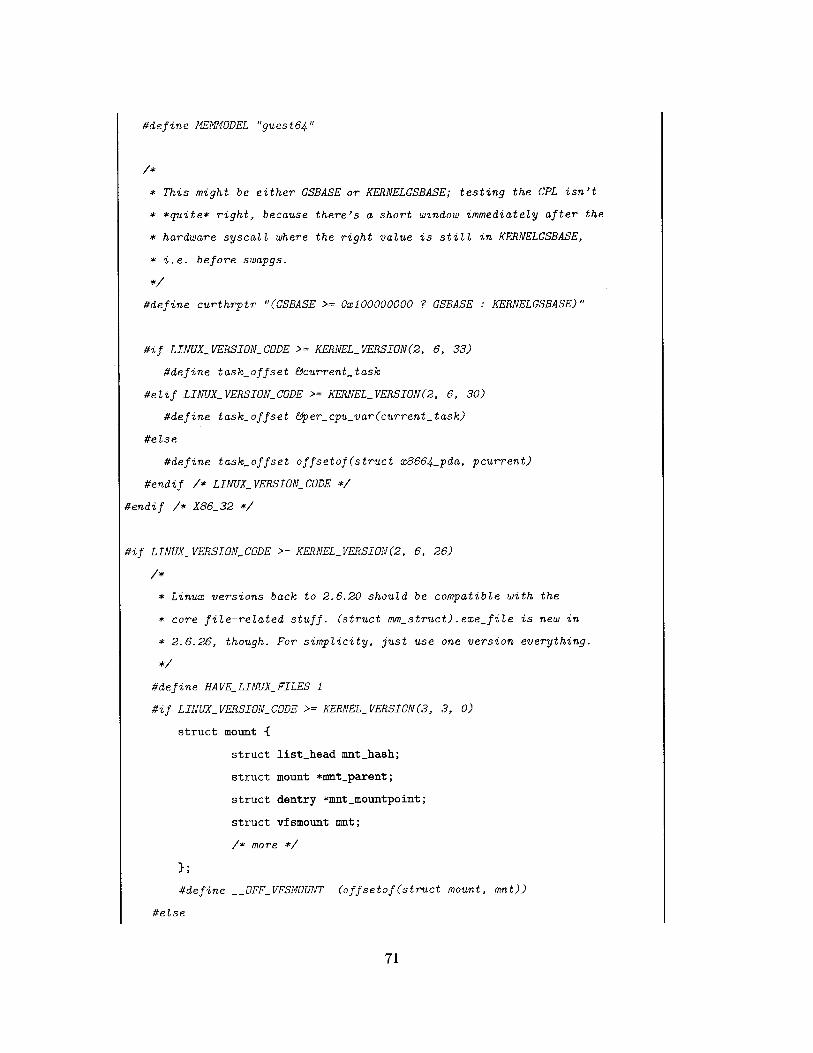
#define MEMMODEL "guest64"
* This might be either GSBASE or KERNELGSBASE; testing the CPL isn't
* *quite* right, because there's a short window immediately after the
* hardware syscaLL where the right value is still in KERNELGSBASE,
* i.e. before swapgs.
#define curthrptr "(GSBASE >= 0x100000000 ? GSBASE : KERNELGSBASE)"
#if LINUX_ VERSIONCODE >= KERNEL_ VERSION(2, 6, 33)
#define taskoffset ¤ttask
#e L if LINUX_ VERSIOA_ CODE >= KERNEL VERSION(2, 6, 30)
#define taskoffset &per-cpu-var(current-task)
#eise
#define taskoffset offsetof(struct x8664_pda, pcurrent)
#endif /* LINUX_ VERSION CODE */
#endif /* X86_32 */
#if LINUX VERSION_CODE >= KERNEL_VERSION(2, 6, 26)
* Linux versions back to 2.6.20 should be compatible with the
* core file-related stuff. (struct mmstruct).exe-file is new in
* 2.6.26, though. For simpLicity, just use one version everything.
#define HAVE_LINUXFILES 1
#if LINUX_VERSION_CODE >= KERNELVERSION (3, 3, 0)
struct mount {
struct list-head mnt.hash;
struct mount *mnt-parent;
struct dentry *mntmountpoint;
struct vfsmount mnt;
/* more
#define __OFF_VFSMOUNT (offsetof(struct mount, mnt))
#else
71

#define __0FF_VFSMDUNT 0
#endif
#endif
static int vprobe-offsetsshow(struct seq.file* m, void *v)
{
seq-printf (m,
"/* Linux offsets for kernel version %s */\n"
"memmodel Xs;\n"
#ifdef HAVELINUX_FILES
"\n#define HAVELINUX_FILES 1\n"
"1/* struct dentry */\n"
"#define __OFFDENTRYPARENT OxYp\n"
"#define __OFFDENTRYNAME OxYp\n"
"/* struct file / struct path */\n"
"#define __OFFFILEPATH OxYp\n"
"/* struct vfsmount / mount */\n"
"#define __OFF_VFSMOUNT OxYx\n"
"\n/* struct mmstruct */\n"
"#define __OFFEXE Oxp\n"
#endif
"\n/* struct task struct */\n"
"#define __OFF_TGID OxYp\n"
"#define __OFFPID Oxp\n"
"#define __OFFPIDS Oxp\n"
"#define __OFFCOMM OxYp\n"
"#define __OFFPARENT Oxp\n"
"#define __OFFMM Oxp\n"
"\n/* struct currentthread */\n"
"#define __OFFTASK Oxp\n"
"#define __CURTHRPTR %s\n"
72
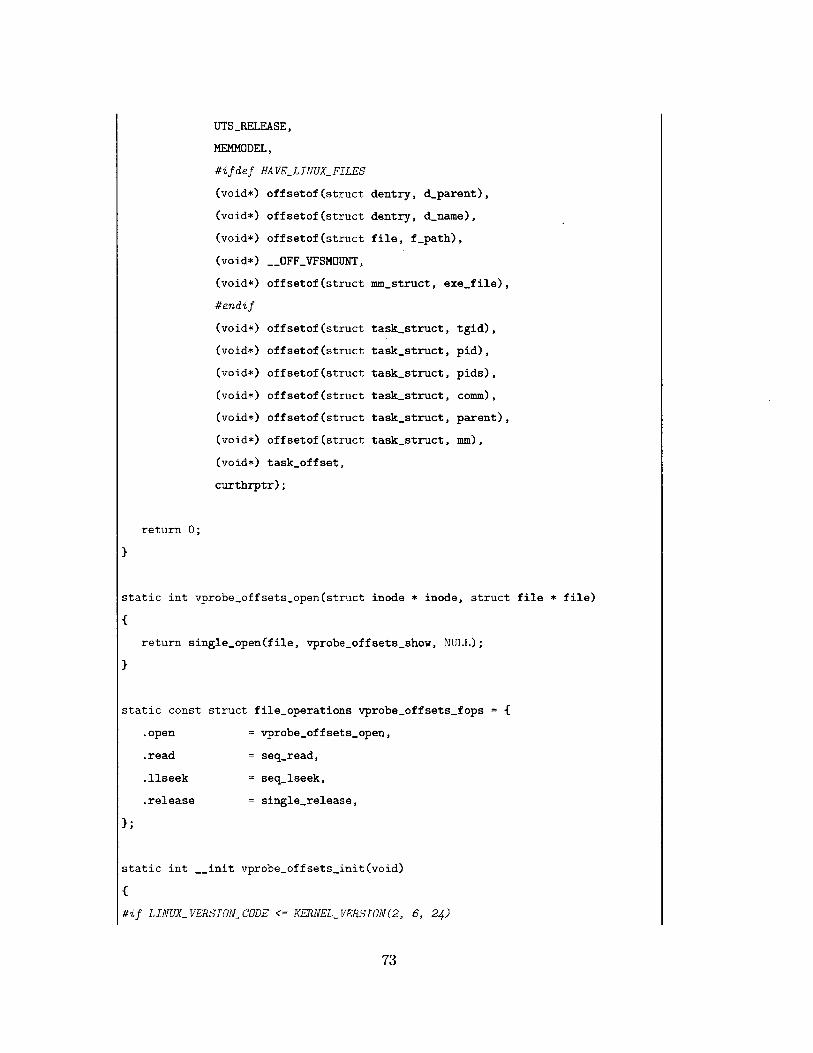
UTSRELEASE,
MEMMODEL,
#ifdef HAVELINUX FILES
(void*) offsetof(struct
(void*) offsetof(struct
(void*) offsetof(struct
(void*) __OFFVFSMOUNT,
(void*) offsetof(struct
#endif
(void*) offsetof(struct
(void*) offsetof(struct
(void*) offsetof(struct
(void*) offsetof(struct
(void*) offsetof(struct
(void*) offsetof(struct
(void*) taskoffset,
curthrptr);
dentry, dparent),
dentry, d_name),
file, f-path),
mm_struct, exefile),
taskstruct,
taskstruct,
task.struct,
taskstruct,
taskstruct,
task-struct,
tgid),
pid),
pids),
comm),
parent),
mm),
static int vprobe-offsets-open(struct inode * inode, struct file * file)
{
return single-open(file, vprobe_offsets-show, NULL);
}
static const
.open
.read
.llseek
.release
};
struct file-operations vprobeoffsets-fops = {
= vprobe-offsetsopen,
= seqread,
= seq_lseek,
= singlerelease,
static int __init vprobe-offsets-init(void)
{
#if LINUXVERSIN_CODE <= KERNELVERSION(2, 6, 24)
73
return 0;
}
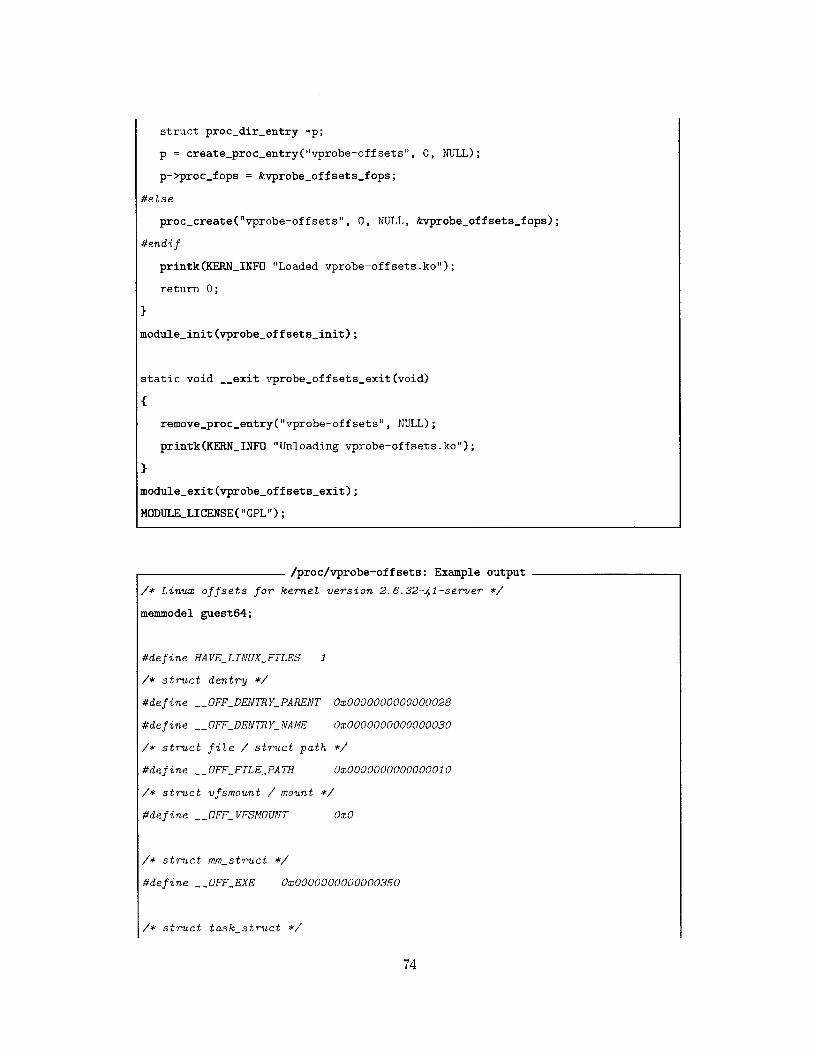
struct proc-dir-entry *p;
p = create.proc.entry("vprobe-offsets", 0, NULL);
p->proc.fops = &vprobe-offsets-fops;
#eLse
proc-create('vprobe-offsets", 0, NULL, &vprobeoffsetsfops);
#endif
printk(KERNINFO "Loaded vprobe-offsets.ko");
return 0;
}
module-init(vprobe-offsets-init);
static void __exit vprobe-offsets-exit(void)
{
remove-proc.entry("vprobe-offsets", NULL);
printk(KERNINFO "Unloading vprobe-offsets.ko");
}
module-exit(vprobeoffsetsexit);
MODULELICENSE("GPL");
/proc/vprobe-offsets: Example output
/* Linux offsets for kernel version 2.6.32-41-server */
memmodel guest64;
#define HAVELINUX_FILES 1
/* struct dentry */
#define __OFFDENTRYPARENT Ox00000000000028
#define __OFFDENTRYNAME Ox0000000000000030
/* struct file / struct path */
#define __OFF_FILE_PATH Ox0000000000000010
/* struct vfsmount / mount */
#define __OFF_VFSMOUNT Ox0
/* struct mmstruct */
#define __OFFEXE Ox0000000000000350
/* struct taskstruct */
74
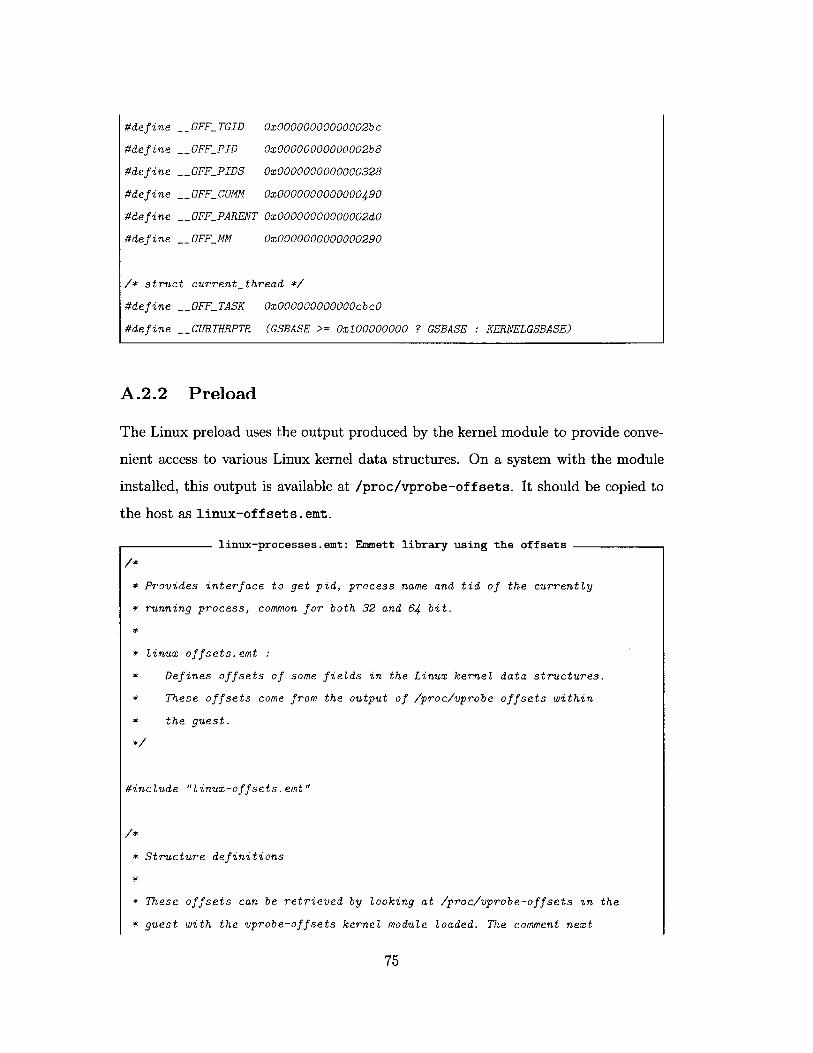
__OFFTGID
__OFFPID
__OFFPIDS
__OFFCOMM
__OFFPARENT
__OFFMM
Ox000000000002bc
0x00000000000002b8
0x0000000000000328
0x0000000000000490
Ox000000000002dO
0x0000000000000290
/* struct current_ thread */
#define __OFF.TASK Ox000000000000cbc0
#define __CURTHRPTR (GSBASE >= 0x100000000 ? GSBASE : KERNELGSBASE)
A.2.2 Preload
The Linux preload uses the output produced by the kernel module to provide conve-
nient access to various Linux kernel data structures. On a system with the module
installed, this output is available at /proc/vprobe-off sets. It should be copied to
the host as linux-offsets.emt.
linux-processes.emt: Emmett library using the offsets
* Provides interface to get pid, process name and tid of the currently
* running process, common for both 32 and 64 bit.
*
* linux-offsets.emt
* Defines offsets of some fields in the Linux kernel data structures.
* These offsets come from the output of /proc/vprobe-offsets within
* the guest.
#include "Linux-offsets.emt"
* Structure definitions
*
* These offsets can be retrieved by looking at /proc/vprobe-offsets in the
* guest with the vprobe-offsets kernel module Loaded. The comment next
75
#define
#define
#define
#define
#define
#define
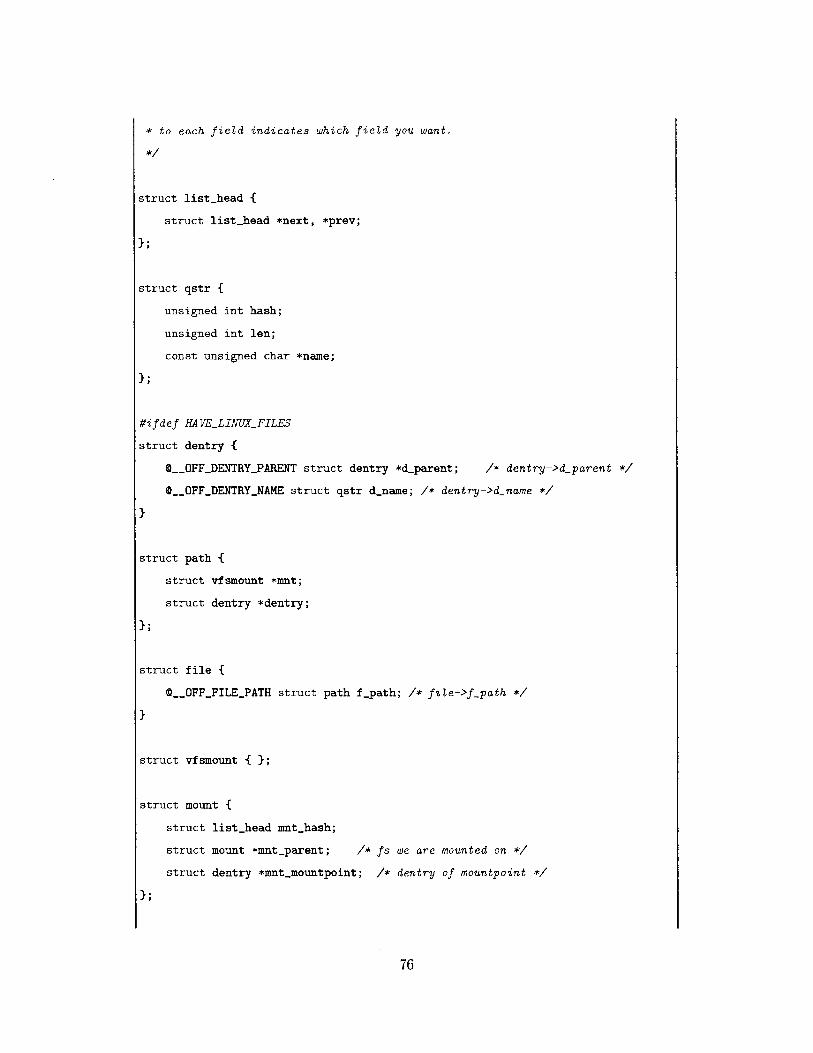
* to each field indicates which field you want.
struct list-head {
struct list-head *next, *prev;
};
struct qstr {
unsigned int hash;
unsigned int len;
const unsigned char *name;
};
#ifdef HAVELINUX_FILES
struct dentry {
0__OFFDENTRYPARENT struct dentry *d-parent; /* dentry->& parent */
D__OFFDENTRYNAME struct qstr d_name; /* dentry->d&name */
}
struct path {
struct vfsmount *mnt;
struct dentry *dentry;
};
struct file {
0__OFFFILEPATH struct path f-path; /* file->f path */
}
struct vfsmount { };
struct mount {
struct list_head mnt_hash;
struct mount *mnt-parent; /* fs we are mounted on
struct dentry *mnt-mountpoint; /* dentry of mountpoint */
76
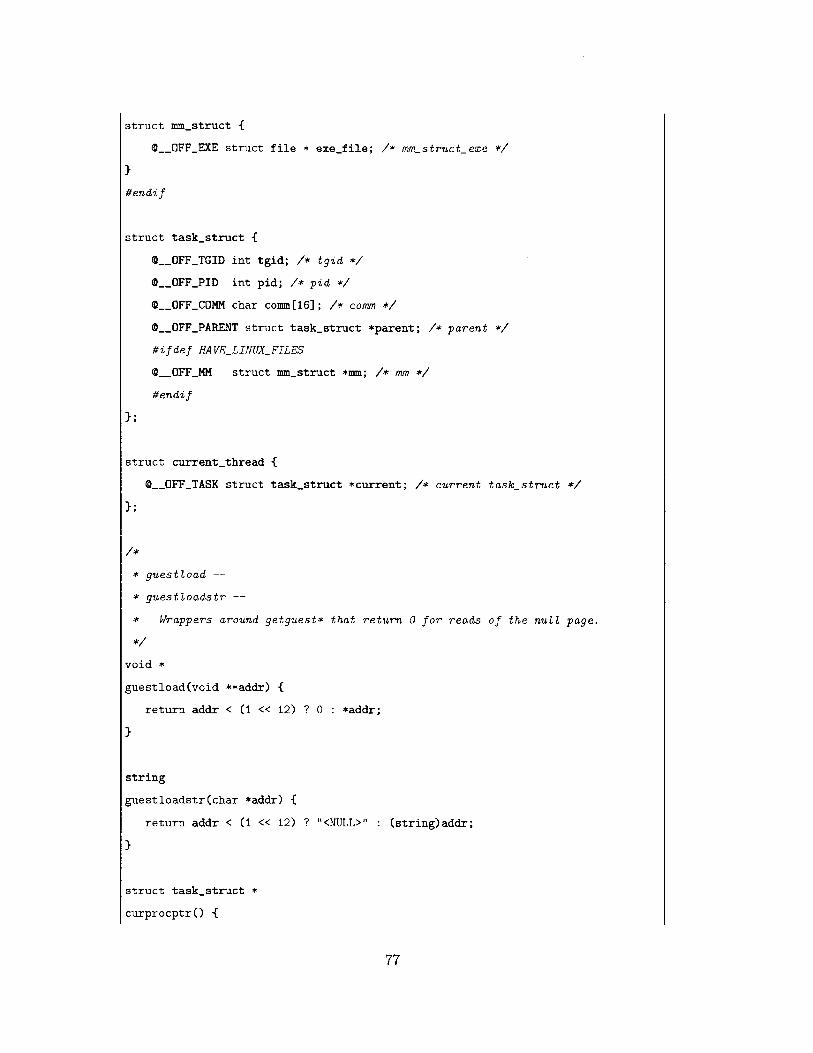
struct mmstruct {
-__OFFEXE struct file * exe-file; /* mm-struct-exe
}
#endif
struct task-struct {
-__OFFTGID int tgid; /* tgid */
0__OFFPID int pid; /* pid */
Q__OFFCOMM char comm[16]; /* comm
__OFFPARENT struct task.struct *parent; /* parent */
#ifdef HAVELINUXFILES
D__OFFMM struct mmstruct *mm; /* mm
#endif
struct current-thread {
0__OFFTASK struct task-struct *current; /* current taskstruct */
* guestload --
* guestloadstr --
* Wrappers around getguest* that return 0 for reads of the null page.
void *
guestload(void **addr) {
return addr < (1 << 12) ? 0 : *addr;
}
string
guestloadstr(char *addr) {
return addr < (1 << 12) ? "<NULL>" : (string)addr;
}
struct task-struct *
curprocptr() {
77

struct currentthread *thrptr;
thrptr = __CURTHRPTR;
return guestload(&thrptr->current);
}
string
curprocname() {
return guestloadstr(curprocptro->comm);
}
int
curtid() {
return curprocptro->pid;
}
int
curpid() {
return curprocptro->tgid;
}
int
curppid() {
return curprocptr()->parent->tgid;
}
/* File-handling related */
string get-qstr-name(struct qstr * str) {
string ret;
getgueststr(ret, str->len, str->name);
return ret;
}
#ifdef HAVELINUX_FILES
struct mount
*realmount(struct vfsmount *mnt)
78
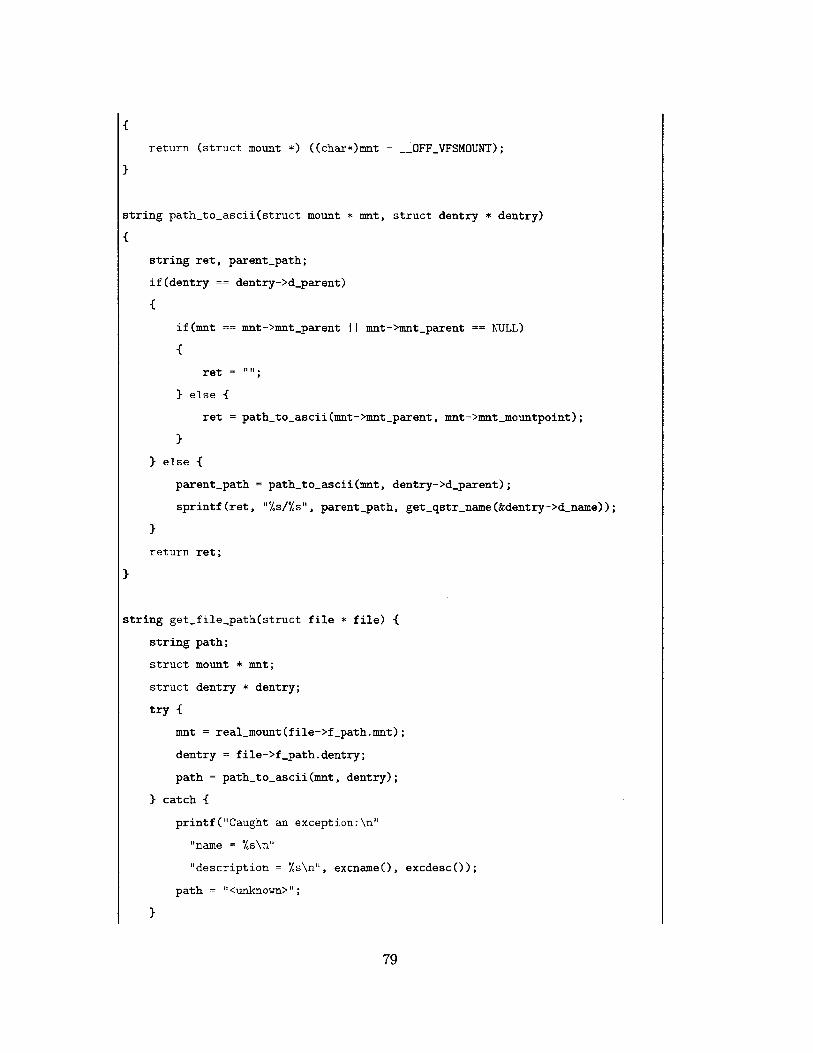
{
return (struct mount *) ((char*)mnt - __OFF_VFSMOUNT);
}
string path-toascii(struct mount * mnt, struct dentry * dentry)
{
string ret, parent-path;
if (dentry == dentry->d-parent)
{
if (mnt == mnt->mnt-parent I mnt->mnt-parent == NULL)
{
ret = "";
} else {
ret = path-toascii(mnt->mnt-parent, mnt->mnt.mountpoint);
}
} else {
parent-path = path-to-ascii(mnt, dentry->d&parent);
sprintf(ret, "%s/%s", parent-path, get.qstr-name(&dentry->d&name));
}
return ret;
}
string getjfile-path(struct file * file) {
string path;
struct mount * mnt;
struct dentry * dentry;
try {
mnt = realmount(file->f_path.mnt);
dentry = file->f-path.dentry;
path = path.to.ascii(mnt, dentry);
} catch {
printf("Caught an exception:\n"
"name = %s\n"
"description = %s\n", excnameo, excdesco);
path = "<unknown>";
}
79

return path;
}
#endif
A.2.3 Instrumentation proper
As described in Section 4.3, the instrumentation itself uses the Linux preload to
display information about syscalls as they are made. Unlike the Windows instrumen-
tation (Figure 4-7), the Linux instrumentation can display certain syscall names and
arguments, return values, and optionally disable printing the binary path. It uses a
small architecture-dependent stub and a larger architecture-independent shared core.
strace-linux32.emt: 32-bit stub
#incLude "strace-Linux-common.emt"
VMMLoad {
NR.open = 5;
NR-read = 3;
NRwrite = 4;
NRgetpid = 20;
NR-clone = 120;
NRfork = 2;
NRvfork = 190;
NR-execve = 11;
NR_chmod = 15;
NRexitgroup = 252;
NR-prctl = 172;
}
GUEST:ENTER:syscall-call {
before.syscall-handlercall("syscall-call");
}
GUEST:ENTER:sysenterdocall {
beforesyscall.handler.call("sysenter-docall");
}
80
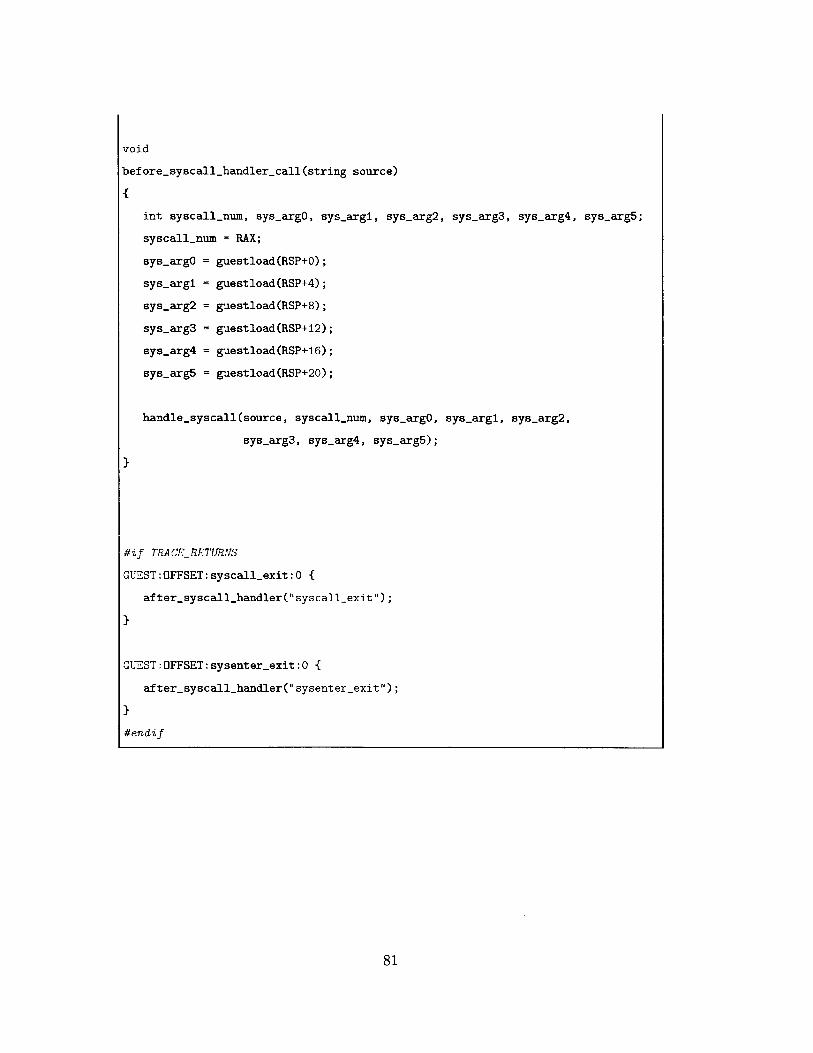
void
before-syscall-handler-call (string source)
{
int syscall-num, sys-argO, sys-argl, sys-arg2, sys-arg3, sys.arg4, sys-arg5;
syscall-num = RAX;
sys.argO = guestload(RSP+0);
sys-argl = guestload(RSP+4);
sys-arg2 = guestload(RSP+8);
sys-arg3 = guestload(RSP+12);
sys-arg4 = guestload(RSP+16);
sys-arg5 = guestload(RSP+20);
handle.syscall(source, syscall.num, sys-argO, sys-argl, sys-arg2,
sys-arg3, sys-arg4, sys.arg5);
}
#if TRACERETURNS
GUEST:OFFSET:syscallexit:0 {
after-.syscallhandler "syscall-exit");
}
GUEST:OFFSET:sysenter-exit:0 {
after syscall-handler("sysenter-exit");
}
#endif
81
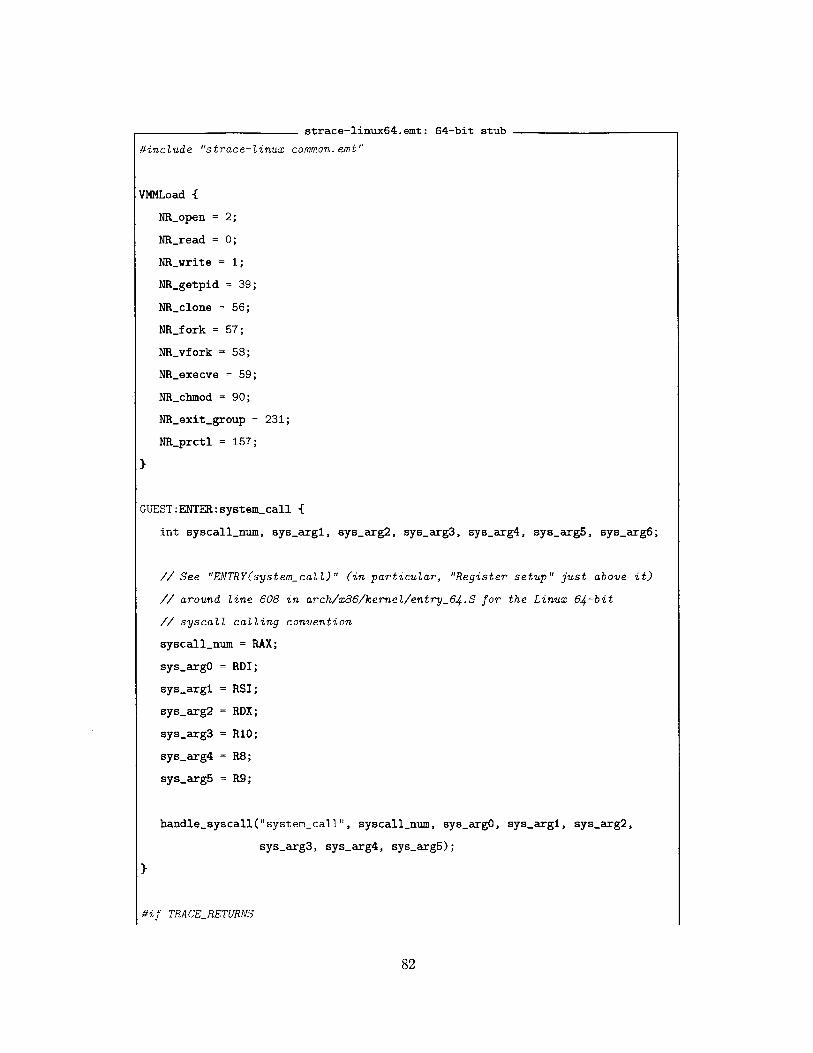
strace-linux64.emt: 64-bit stub#include "strace-Linux-common.emt"
VMMLoad {
NR_open = 2;
NRread = 0;
NRwrite = 1;
NR-getpid = 39;
NR-clone = 56;
NRfork = 57;
NR-vfork = 58;
NRexecve = 59;
NR-chmod = 90;
NR-exit-group = 231;
NR-prctl = 157;
}
GUEST:ENTER:system-call {
int syscall-num, sys-argl, sys-arg2, sys-arg3, sys-arg4, sys-arg5, sys-arg6;
// See "ENTRY(systemrcaLL)" (in particular, 'Register setup" just above it)
// around line 608 in arch/x86/kernel/entry_64.S for the Linux 64-bit
// syscalL calling convention
syscallnum = RAX;
sys-argO = RDI;
sys-argi = RSI;
sys-arg2 = RDX;
sys-arg3 = R10;
sys-arg4 = RB;
sys-arg5 = R9;
handle-syscall("system-call", syscall-num, sysargO, sys-argi, sys-arg2,
sys.arg3, sys-arg4, sys-arg5);
}
#if TRACE_RETURNS
82
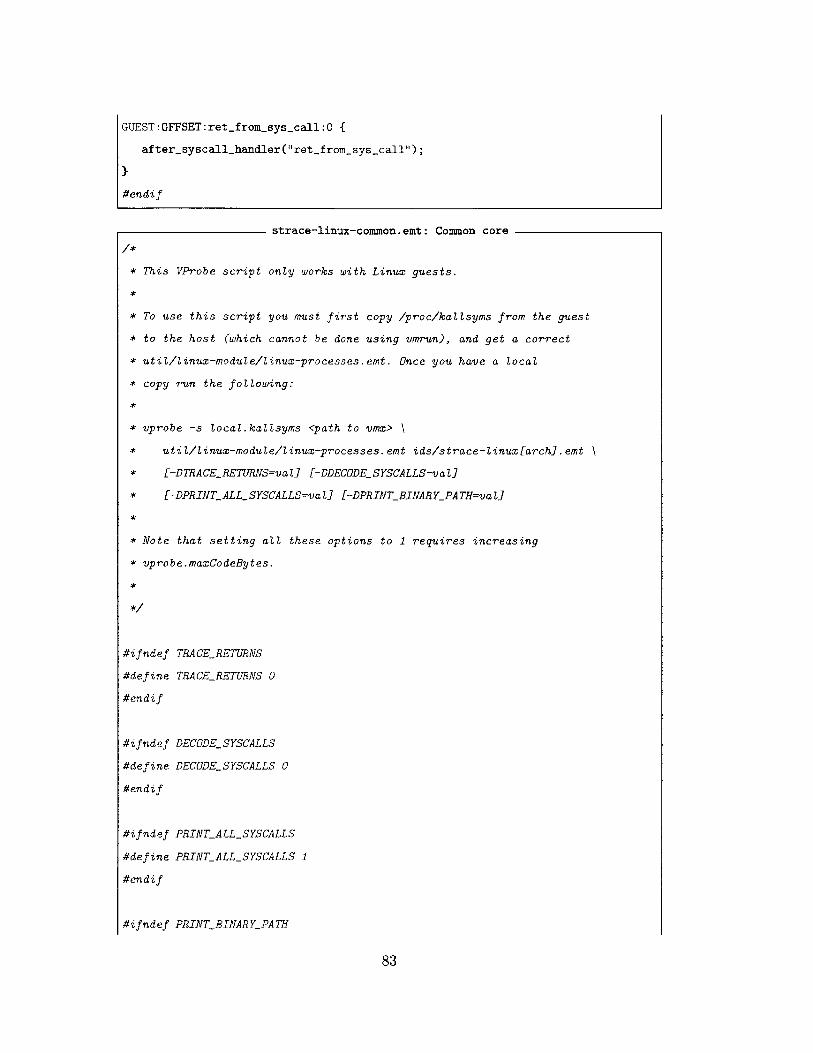
GUEST:OFFSET:ret-from-sys-call:0 {
after-syscall-handler("ret-from-sys-call");
}
#endif
strace-linux-common.emt: Common core
* This VProbe script only works with Linux guests.
*
To use this script you must first copy /proc/kallsyms from the guest
to the host (which cannot be done using vmrun), and get a correct
util/Linux-module/inux-processes.emt. Once you have a local
copy run the following:
* vprobe -s locai.kallsyms <path to vmx> \
* util/linux-module/linux-processes.emt ids/strace-linux[arch].emt \
* [-DTRACE_RETURNS=val] [-DDECODESYSCALLS=val]
* [-DPRINTALLSYSCALLS=val] [-DPRINT BINARY_PATH=valj
*
* Note that setting all these options to 1 requires increasing
* vprobe.maxCodeBytes.
*
TRACERETURNS
TRACERETURNS 0
DECODE_SYSCALLS
DECODE_SYSCALLS 0
PRINTALLSYSCALLS
PRINTALLSYSCALLS 1
#ifndef PRINTBINARY_PATH
83
*
*
*
*
*
#ifndef
#define
#endif
#ifndef
#define
#endif
#ifndef
#define
#endif

#define PRINTBINARYPATH 1
#endif
#if ! (DECODE_SYSCALLS II PRINTALLSYSCALLS)
#warning "Neither decoding syscaLLs nor printing all syscails"
#warning "No syscalLs will be output."
#endif
* The syscall table is in arch/x86/include/asm/unistd_[archi.h
*
* In your appropriate hook file, make sure to define the following
int
NR-open,
NRread,
NR_write,
NR-getpid,
NRclone,
NRfork,
NR_vfork,
NRexecve,
NRchmod,
NR-exit-group,
NR_prctl;
void
handlesyscall(string source, int syscall-num,
int sys-argO, int sys-argl, int sys-arg2,
int sys-arg3, int sys-arg4, int sys-arg5)
{
string syscall-name, syscallargs, arg.path;
string comm, binary-path;
int tid, pid, ppid;
int print;
84
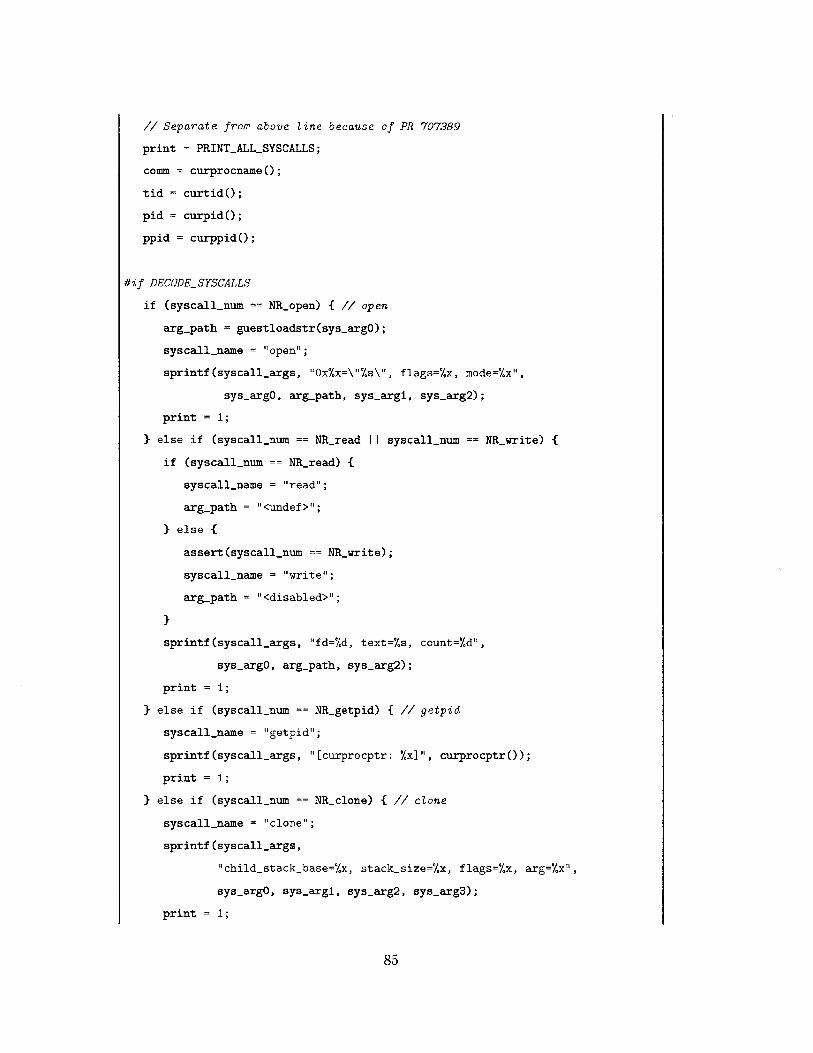
// Separate from above line because of PR 707389
print PRINTALLSYSCALLS;
comm = curprocnameo;
tid = curtidO;
pid = curpidO;
ppid curppidO;
#if DECODESYSCALLS
if (syscallnum == NR.open) { // open
arg-path = guestloadstr(sys-argO);
syscall-name = "open";
sprintf(syscallargs, "Oxx=\"7s\", flags=%x, mode=%x",
sys-argO, arg-path, sys.argl, sys-arg2);
print = 1;
} else if (syscallnum == NR-read 11 syscall-num == NRwrite) {
if (syscall-num == NRlread) {
syscallname = "read";
arg-path = "<undef>";
} else {
assert(syscall-num == NRwrite);
syscall-name = "write";
arg-path = "<disabled>";
}
sprintf(syscall.args, "fd=%d, text=%s, count=%d",
sys-argO, arg-path, sys-arg2);
print = 1;
} else if (syscallnum == NR-getpid) { // getpid
syscall-name = "getpid";
sprintf(syscall.args, "[curprocptr: x]", curprocptr());
print = 1;
} else if (syscall.num == NR-clone) { // cLone
syscall-name = "clone";
sprintf(syscall-args,
"childstackbase=%x, stack-size=%x, flags=%x, arg=%x",
sys-argO, sys-argl, sys-arg2, sys-arg3);
print = 1;
85
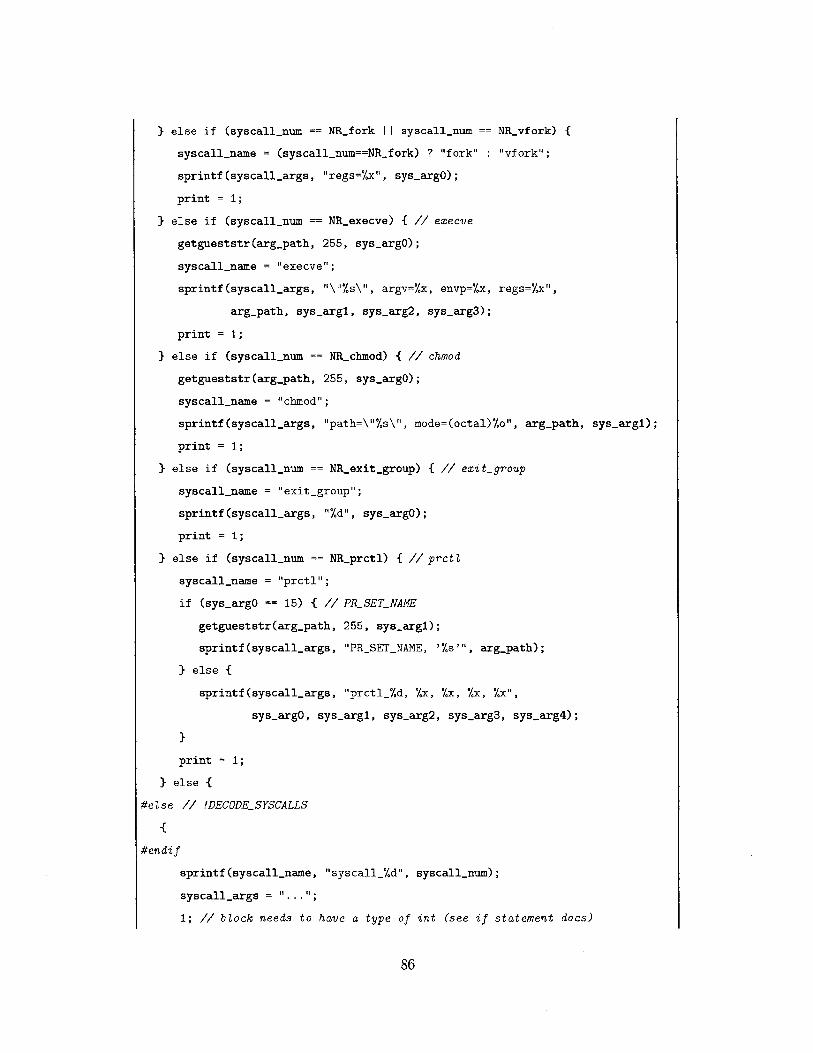
} else if (syscall_num == NRffork 11 syscallnum == NR-vfork) {
syscall-name = (syscall-num==NRffork) ? "fork" "vfork";
sprintf(syscall-args, "regs=%x", sys-argO);
print = 1;
} else if (syscall-num == NRexecve) { // execve
getgueststr(arg-path, 255, sys-argO);
syscall.name = "execve";
sprintf(syscall-args, "\"7s\", argv=Xx, envp=%x, regs=%x",
arg-path, sys-arg, sys-arg2, sys-arg3);
print = 1;
} else if (syscall.num == NR-chmod) { // chmod
getgueststr(arg-path, 255, sys-argO);
syscallname = "chmod";
sprintf(syscall.args, "path=\"%s\", mode=(octal) %o", arg-path, sys-argl);
print = 1;
} else if (syscallnum == NRexitgroup) { // exit-group
syscall-name = "exitgroup";
sprintf (syscall-args, "%d", sysargO);
print = 1;
} else if (syscall-num == NR&prctl) { // prctL
syscall-name = "prctl";
if (sys-argO == 15) { // PRSETNAME
getgueststr(argpath, 255, sysarg);
sprintf(syscallargs, "PRSETNAME, '%s'", argpath);
} else {
sprintf(syscallargs, "prctl_%d, %x, %x, %x, %x",
sys-argO, sys-argl, sys-arg2, sys-arg3, sysarg4);
}
print = 1;
} else {
#eLse // !DECODESYSCALLS
{
#endif
sprintf(syscall-name, "syscallXd", syscall-num);
syscall-args =
1; // bLock needs to have a type of int (see if statement does)
86
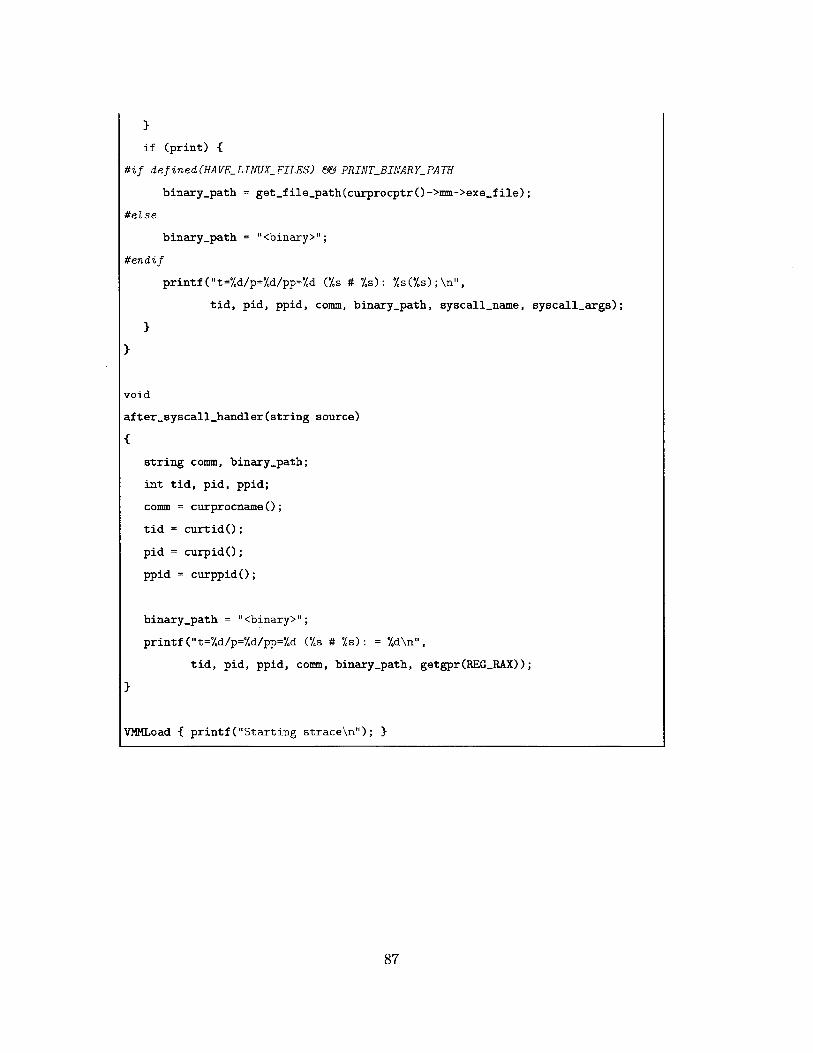
}
if (print) {
#if defined(HAVE_-LINUX FILES) 6 PRINTBINARYPATH
binary-path = get-file-path(curprocptr()->mm->exe-file);
#else
binary-path = "<binary>";
#endif
printf("t=%d/p=%d/pp=%d (%s # %s): Xs(Xs);\n",
tid, pid, ppid, comm, binary-path, syscall-name, syscall-args);
}
}
void
after-syscallhandler(string source)
{
string comm, binary-path;
int tid, pid, ppid;
comm = curprocname (;
tid = curtido);
pid = curpidO;
ppid = curppid(;
binary-path = "<binary>";
printf("t=%d/p=%d/pp=%d (%s # %s): =%d\n",
tid, pid, ppid, comm, binary-path, getgpr(REGRAX));
}
VNMLoad { printf("Starting strace\n"); }
87

88
Bibliography
[1] Matt Amdur. One good probe deserves another, November 2011.
[2] Apache. Apachebench. http://httpd.apache.org/docs/2.2/programs/ab.html.
[3] Bryan Cantrill. Hidden in plain sight. A CM Queue, February 2006.
[4] Artem Dinaburg, Paul Royal, Monirul Sharif, and Wenke Lee. Ether: malwareanalysis via hardware virtualization extensions. In Proceedings of the 15th ACMconference on Computer and communications security, CCS '08, pages 51-62,New York, NY, USA, 2008. ACM.
[5] Brendan Dolan-Gavitt. pdbparse. http://code.google.com/p/pdbparse/.
[6] Tal Garfinkel. Traps and pitfalls: Practical problems in system call interposi-tion based security tools. In Proc. Network and Distributed Systems SecuritySymposium, pages 163-176, 2003.
[7] Tal Garfinkel and Mendel Rosenblum. A virtual machine introspection basedarchitecture for intrusion detection. In Proc. Network and Distributed SystemsSecurity Symposium, pages 191-206, 2003.
[8] jduck. Proftpd 1.3.2rc3 - 1.3.3b telnet iac buffer overflow (linux). http: //www.metasploit . com/modules/exploit/linux/f tp/prof tp-telnetiac.
[9] Xuxian Jiang, Xinyuan Wang, and Dongyan Xu. Stealthy malware detectionthrough vmm-based "out-of-the-box" semantic view reconstruction. In Proceed-ings of the 14th ACM conference on Computer and communications security,CCS '07, pages 128-138, New York, NY, USA, 2007. ACM.
[10] Stephen T. Jones, Andrea C. Arpaci-Dusseau, and Remzi H. Arpaci-Dusseau.Antfarm: tracking processes in a virtual machine environment. In Proceedingsof the annual conference on USENIX '06 Annual Technical Conference, ATEC'06, page 1, Berkeley, CA, USA, 2006. USENIX Association.
[11] Samuel T. King and Peter M. Chen. Backtracking intrusions. ACM Trans.Comput. Syst., 23(1):51-76, February 2005.
89
[12] Andrew P. Kosoresow and Steven A. Hofmeyr. Intrusion detection via system
call traces. IEEE Softw., 14(5):35-42, September 1997.
[13] Bo Li, Jianxin Li, Tianyu Wo, Chunming Hu, and Liang Zhong. A vmm-basedsystem call interposition framework for program monitoring. In Proceedings of
the 2010 IEEE 16th International Conference on Parallel and Distributed Sys-
tems, ICPADS '10, pages 706-711, Washington, DC, USA, 2010. IEEE ComputerSociety.
[14] B.D. Payne, M. Carbone, M. Sharif, and Wenke Lee. Lares: An architecture for
secure active monitoring using virtualization. In Security and Privacy, 2008. SP2008. IEEE Symposium on, pages 233-247, May 2008.
[15] Niels Provos. Improving host security with system call policies. In Proceedings
of the 12th conference on USENIX Security Symposium - Volume 12, SSYM'03,page 18, Berkeley, CA, USA, 2003. USENIX Association.
[16] Raghunathan Srinivasan. Protecting anti-virus software under viral attacks. Mas-
ter's thesis, Arizona State University, 2007.
[17] strace maintainers. strace. http://sourceforge.net/projects/strace/.
[18] Kymie M. C. Tan, Kevin S. Killourhy, and Roy A. Maxion. Undermining ananomaly-based intrusion detection system using common exploits. In RAID,pages 54-73. Springer-Verlag, 2002.
[19] Christina Warrender, Stephanie Forrest, and Barak Pearlmutter. Detecting in-
trusions using system calls: Alternative data models. In IEEE Symposium on
Security and Privacy, pages 133-145. IEEE Computer Society, 1999.
90