using the water-energy-food nexus to enhance egypt’s
TRANSCRIPT

The American University in Cairo
Using the Water-Energy-Food Nexus to Enhance Egypt’s
Cooperation with Nile Basin Countries
A Thesis Submitted to
Sustainable Development Program
in partial fulfillment of the requirements for
the degree of Masters of Science
in
Sustainable Development
by
Aly Kheireldin
900980002
under the supervision of:
Dr. Khaled Abdelhalim (Main Advisor)
Assistant Professor of Urban Policy,
Public Policy and Administration Department,
School of Global Affairs and Public Policy
&
Dr. Hani Sewilam (Co-Advisor)
Professor, Mechanical Engineering Department and
Director, Center of Sustainable Development,
School of Science and Engineering
May 2016

2
To my mother and father who have always given me endless
support
To my wife Dina who has supported me throughout the course
of my study
To my children Tameem and Lina
I dedicate this thesis…

3
“The only matter that could take Egypt to war again is water.”
Mohamed Anwar El-Sadat, 1979

4
Contents
List of Figures ..................................................................................................................... 7
List of Tables ...................................................................................................................... 8
Abbreviations ...................................................................................................................... 9
Abstract ............................................................................................................................. 12
Chapter One: Introduction and Research Problem ........................................................... 14
1.1 Global Challenges in the Water, Energy and Food Sectors .................................... 14
1.2 The Egyptian Context.............................................................................................. 16
1.3 Research Problem .................................................................................................... 17
Chapter Two: Conceptual Framework and Methodology ................................................ 18
2.1 Research Problem .................................................................................................... 18
2.2 Main Research Question ......................................................................................... 18
2.3 Minor Research Question ........................................................................................ 19
2.4 Research Design ...................................................................................................... 19
Chapter Three: Literature Review .................................................................................... 21
3.1 Emergence of the Water-Energy-Food Nexus Globally ......................................... 21
3.2 Linkages among Water, Energy and Food .............................................................. 23
3.2.1 Water for Food and Water for Energy .............................................................. 24
3.2.2 Energy for Food ................................................................................................ 25
3.2.3 Desalination: Energy for Water ........................................................................ 26
3.2.4 Biofuels: Food for Energy ................................................................................ 28
3.3 Danger of Ignoring the Water-Energy-Food Nexus ................................................ 29
3.4 Examples of the Inevitable Water-Energy-Food Interconnections from the World 30
3.5 Egypt’s Water Challenges ....................................................................................... 32
3.5.1 Water Shortage ................................................................................................. 32
3.5.2 Water Pollution ................................................................................................. 34
3.6 Egypt’s Energy Challenges ..................................................................................... 35
3.6.1 Oil ..................................................................................................................... 36
3.6.2 Natural Gas ....................................................................................................... 37
3.6.3 Coal ................................................................................................................... 38

5
3.6.4 Electricity.......................................................................................................... 39
3.7 Egypt’s Food Challenges ........................................................................................ 39
3.7.1 Food Availability .............................................................................................. 40
3.7.2 Rising Food Insecurity...................................................................................... 42
Chapter Four: Analysis of Virtual Water Trade in the Nile Basin and the Ethiopian
Situation ............................................................................................................................ 44
4.1 The Concept of Virtual Water ................................................................................. 44
4.2 The Nile Basin ......................................................................................................... 44
4.2.1 Virtual Water Trade in the Nile Basin .............................................................. 47
4.3 Analysis of the Ethiopian Situation ......................................................................... 51
4.3.1 Energy Security ................................................................................................ 52
4.3.2 Food Security .................................................................................................... 52
4.3.3 Water Security .................................................................................................. 53
4.3.4 Ethiopia’s Grand Renaissance Dam ................................................................. 54
Chapter Five: Proposed Policy Framework for the WEF Nexus in Egypt and the Nile
Basin Countries ................................................................................................................. 59
5.1 Policies Framework within the Egyptian Context................................................... 61
5.2 Institutional Framework and Methodology for WEF Nexus in Egypt and the Nile
Basin Countries ............................................................................................................. 62
5.3 Examples of projects and programs that could benefit from WEF synergy in Egypt
....................................................................................................................................... 71
5.3.1 The Reclamation of 1.5 Million Feddans Project ............................................. 71
5.3.2 Expanding the Power Generation Sector .......................................................... 73
5.4 Examples of projects and programs that can benefit from WEF synergy on the Nile
Basin Level .................................................................................................................... 73
5.4.1 Expanding Green Water Utilization in the Basin ............................................. 73
5.4.2 Integration of electricity grids .......................................................................... 78
5.5 Applying the policy framework to national projects in Egypt and international
projects in the Nile Basin .............................................................................................. 80
5.5.1 Applying the policy framework to the reclamation of 1.5 million feddans
project ........................................................................................................................ 80
5.5.2 Applying the policy framework to the GERD .................................................. 85
Chapter Six: Conclusion and Recommendations .............................................................. 90

6
Bibliography ..................................................................................................................... 93

7
List of Figures
Figure 1 - Schematic of the WFE nexus and its constituent issues (UN ESCAP, 2013).. 24
Figure 2 - Comparative trends of crop commodity and oil price indices from 1990 to
2009 (with 2004 as baseline) (Kim, 2010)........................................................................ 26
Figure 3 - Desalination Technology Market (Koschikowski, 2011) ................................ 27
Figure 4 – Seawater Desalination Processes (Al-Karaghouli et al., 2009) ....................... 28
Figure 5 – The Nile’s water cycle (Barnes, 2012) ............................................................ 34
Figure 6 - Primary energy consumption in Egypt, by fuel, 2013 (U.S. EIA, 2014) ......... 36
Figure 7 - Oil production and consumption in Egypt (U.S. EIA, 2014) ........................... 37
Figure 8 - Natural gas production and consumption in Egypt (U.S. EIA, 2014) .............. 38
Figure 9 – Production of Selected Crops in Egypt (million tons) (WFP, 2013) ............... 41
Figure 10 – Percentage of households citing shocks affecting their financial status after
the revolution by region (WFP, 2013) .............................................................................. 43
Figure 11 – The Nile Basin Hydrological and Political Borders (LWRG, 2007)............. 45
Figure 12 – Average annual total virtual water crop and livestock ‘trade’ between Nile
Basin states and the rest of the world, imports and exports, 1998–2004 (Mm3/y) (Zeitoun
et al., 2010) ....................................................................................................................... 50
Figure 13 - Nile basin showing the expected GERD (Zhang at el., 2015) ....................... 55
Figure 14 – Operational Methodology for WEF Nexus at Egypt and/or Nile Basin Level
........................................................................................................................................... 64
Figure 15 – Harvested rain fed areas in the Nile Basin countries including projections –
developed from (FAO, 2011) ............................................................................................ 75
Figure 16 – Comparative yields for selected food crops 2005-2009 (Nile Basin Initiative,
2012) ................................................................................................................................. 77
Figure 17 – Use of fertilizers in the Nile Basin – 2005 data – developed from (Nile Basin
Initiative, 2012) ................................................................................................................. 78
Figure 18 – Forecast demand for power for Nile Basin countries 2010-45 (Nile Basin
Initiative, 2012) ................................................................................................................. 79

8
List of Tables
Table 1 - Nexus Elements in Major Documents and Initiatives (UN ESCAP, 2013) ...... 22
Table 2 - Water withdrawal by sector, around 2007 (FAO, 2014) ................................... 25
Table 3 - Classification of renewable biofuels based on their production technologies
(Demirbas, 2009) .............................................................................................................. 28
Table 4 – Egypt’s Water Uses and Available Resources in Year 2000 (Allam & Allam,
2007) ................................................................................................................................. 33
Table 5 - Self Sufficiency of selected crops and per capita consumption (WFP, 2013) .. 41
Table 6 - Freshwater resources of the Nile (Zeitoun et al., 2010) .................................... 47
Table 7 - Imports’ within the Nile Basin, main trade items only, average values 1998–
2004 (Zeitoun et al., 2010) ................................................................................................ 48
Table 8 - Imports from the rest of the world, main trade items only, average values 1998–
2004 (Zeitoun et al., 2010) ................................................................................................ 48
Table 9 – Potential hydropower projects in Ethiopia (Derbew, 2013) ............................. 57
Table 10 – Policies of the water, energy and food sectors in Egypt (Trinex, 2015) ......... 61
Table 11 – Digital Logic Weighting ................................................................................. 69
Table 12 –Matrix for Projects/Programmes Evaluation including sub-criteria ................ 70
Table 13 – Groundwater Potential of Nile Basin Countries (Hassan et al., 2004) ........... 74
Table 14 – Ranking the 1.5 million feddans project based on pre-defined scoring matrix
........................................................................................................................................... 82
Table 15 – Ranking the GERD project based on pre-defined scoring matrix .................. 86

9
Abbreviations
AGECC The Secretary-General’s Advisory Group on Energy and Climate Change
BCM Billion Cubic Meters
BG British Gas
BMU German Federal Ministry for the Environment, Nature Conservation and
Nuclear Safety
BMZ German Federal Ministry for Economic Cooperation and Development
BP British Petroleum
CAPMAS Central Agency for Public Mobilization and Statistics
CBE Central Bank of Egypt
CHP Cogeneration of Heat and Power
CIA Central Intelligence Agency
CNG Compressed Natural Gas
CPI Consumer Price Index
CSP Concentrated Solar Power
CTL Coal to Liquid
ED Electrodialysis
EDI Electrodionization
EEHC Egyptian Electricity Holding Company
FAO Food and Agriculture Organization of the United Nations
GERD Grand Ethiopian Renaissance Dam
GDP Gross Domestic Product
GW Gega Watt
HIECS Household Income, Expenditure, and Consumption Survey
IEA International Energy Agency

10
IFPRI International Food Policy Research Institute
IMF International Monetary Fund
IRENA International Renewable Energy Agency
IWRM Integrated Water Resources Management
kWh Kilo Watt Hours
LDC Least Developing Countries
MED Multi Effect Distillation
MOU Memorandum of Understanding
MSF Multi Stage Flash
MW Mega Watt
OPEC Organization of the Petroleum Exporting Countries
PPM Parts per Million
R&D Research and Development
RO Reverse Osmosis
UN The United Nations
UN ESCAP United Nations Economic and Social Commission for Asia and the Pacific
UNEP United Nations Energy Program
UNESCO United Nations Educational, Scientific and Cultural Organization
UNFCCC United Nations Framework Convention on Climate Change
UNDP United Nations Development Program
U.S. EIA United States Energy Information Administration
US$ United States Dollars
WB The World Bank
WEF Water – Energy – Food
WFP World Food Program

11
WMO World Meteorological Organization

12
Abstract
In the coming decades, the World will be facing severe challenges in terms of
water, energy and food through increased water use, increased energy demand and
increased food demand and shifting diets. Those challenges are foreseen to be amplified
due to climate change effects. Egypt is a country struggling to achieve water, energy and
food security, which are key issues in achieving national security. Egypt is facing another
major challenge regarding its main water resource Nile River. Ethiopia is currently
undergoing the construction of a huge dam on the Blue Nile which is the Grand Ethiopian
Renaissance Dam (GERD). The purpose of the research is to attempt to mitigate the
effect of the GERD on Egypt through cooperation with the Nile Basin countries on their
Water-Energy-Food Nexus (WEF Nexus).
The grand Ethiopian Renaissance dam (GERD) is a mega hydro-electric project
currently under construction on the Blue Nile. It is planned to have a 74 BCM capacity
reservoir and a power generation capacity of 6,000 MW. If not agreed appropriately, the
filling of the GERD reservoir might have significant impacts on the Aswan High Dam.
A policy framework was developed for the water-energy-food nexus for Egypt
and the Nile Basin. In Egypt, it is suggested to create a Supreme Council for Water,
Energy and Food which includes all the relevant ministries. For the Nile Basin, a Nile
Basin WEF is suggested, whose decisions should be legally binding for Nile Basin
countries. Examples were provided on the project/programme level that could have
benefited from the WEF synergy, like the reclamation of 1.5 million feddans and the
expansion of the electricity generation sector. An institutional arrangement was
developed, which is applicable for Egypt and the Nile Basin countries. The arrangement
is done through a methodology which encourages the prioritization of projects that take
into consideration the WEF nexus. On the Nile Basin level, examples were given for
potential projects that could benefit from the WEF synergy if the basin is thought of as
one unit. Examples provided included the expansion of green water utilization and
integration of electricity grids. The policy framework showed that the GERD itself can be

13
viewed as an opportunity for cooperation if the right policy framework is developed
among the basin countries.

14
Chapter One: Introduction and Research Problem
1.1 Global Challenges in the Water, Energy and Food Sectors
Water, energy and food security are far from being achieved globally. A large
number of people globally lack basic services. About 0.9 billion people do not have
access to an improved water source, 2.6 billion are deprived of safe sanitation, 1.3 billion
do not have electricity access, 1.5 billion lack access to modern cooking energy forms
and 1 billion suffer from hunger regularly (BMU and BMZ, 2011). Many people are
deprived of basic human rights and are not even given any opportunity for development.
Nevertheless, and despite this situation, the world has reached and exceeded sustainable
limits of resource consumption. The world is in need to the development of innovative
and well-integrated solutions to achieve sustainable growth.
In the coming decades, the world will be facing severe challenges in terms of
water, energy and food:
Increased water use: Historically, freshwater withdrawals have increased at rates
higher than population growth rates. This implies that the growth in freshwater
demand will increase even more than the population growth rate (World
Economic Forum, 2011). A recent study suggested that the World could be facing
a shortage of 40% in available freshwater as compared to the water demand by
2030 (McKinsey & Company, 2009). A large number of countries are already
using ground water at rates faster than renewed, including Mexico, China, India
and Jordan (UNDP, 2007). If water continues to be used in this unsustainable
manner, it is expected that two thirds of the world’s population will suffer from
water stress by 2030 (FAO, 2007).
Increased energy demand: It is forecasted that the world will need 40% more
energy by 2030 compared to the current levels (IEA, 2009). For example, by
2030, China is expected to expand its electricity generation capacity by at least
1,300 GW, while India will need an additional 400 GW (Project Catalyst, 2009).
Many countries prioritize access to energy. Currently, 1.5 billion people lack

15
electricity access, while more than 3 billion people still utilize biomass for their
thermal requirements (AGECC, 2010).
Increased food demand and shifting diets: The demand for food will continue to
increase in the coming decades due to the growth of the World population by an
additional 2.7 billion people, increasing incomes, and additional meat
consumption. The growing population of the world will need more and different
types of food. As the living standards improve and population become more
urban, the demand will increase for resource intensive types of food such as meat.
The global meat demand is expected to increase by 50% by 2025, leading also to
a 42% increase in the demand for grain (UNEP, 2009). This is expected to limit
the purchasing power of the poor even further in a world where currently one
billion people suffer from hunger (World Economic Forum, 2011).
The above-mentioned challenges are even expected to be amplified by climate change
effects. Climate change is expected to increase water stress in large parts of the World,
causing 75-220 million people to suffer from fiercer water shortages by 2020. Shrinking
agricultural land, distorted growing seasons and increased uncertainty on suitable crops to
grow are expected to reduce agricultural productivity. Crops depending on rain are
expected to drop by as much as 50% by 2020. This is expected to worsen the situation of
food security, pushing more people into hunger in the coming few decades (UNFCCC,
2007). For example, in East Africa small farmers depending on marginal land are already
suffering from big variations in rainfall patterns. In addition, they are facing low yields
due to dropping soil fertility, erosion and drought. People in these areas depend on maize
and beans for their livelihood, but are currently highly vulnerable to adverse climate
change effects (WMO, 2012).
Climate change is expected to increase nexus challenges. Temperatures are
expected to increase, soil is expected to dry out, storms are expected to intensify and
glaciers are expected to reduce in size. Power production especially that is based on
hydroelectricity is threatened as a result of droughts. Both the energy and food sectors are
contributing sectors to climate change through emitting greenhouse gases and they will
also be affected by climate change (BMU and BMZ, 2011).

16
1.2 The Egyptian Context
Egypt is a country struggling to achieve water, energy and food security.
Achieving security in these three sectors is a key issue in achieving national security. The
failure of the State to provide the population’s water, energy and food requirements might
be a reason for social instability leading to riots and political instability.
In terms of water, Egypt is mainly relying on the Nile River, from which it
currently receives 55.5 BCM per year as per the 1959 Nile Waters agreement. Egypt’s
total annual renewable water resources are currently around 700 m3 per capita, which
puts Egypt in the water scarcity zone as per the United Nations classification (UN, 2014).
This figure is expected to reach 550 m3 per capita per year by 2025 (The Brookings
Institution, 2012).
In the energy sector, Egypt has experienced during the years following the 2011
revolution its worst energy crisis in decades. In addition to the fact that the current
installed capacity of around 27 GW does not meet the peak demand, there are huge
shortages of fossil fuels, mainly natural gas. This has led to major blackouts during the
years after the 2011 revolution. The country is also unable to keep regular energy supply
to the industry especially energy intensive industries. By the end of April 2014, the
government owed its oil & gas foreign partners US$ 6 billion (Adel, 2014) . In order to
overcome an expected deficit of 2.4 billion cubic feet per day of natural gas, the
government is heading towards importing coal, a carbon intensive fuel (Adel, 2014). The
cement industry is currently opting for importing coal, to overcome the irregularities of
the supply of natural gas from the government.
Looking at food security, Egypt is a net importing country; it currently imports
45-55% of its wheat consumption (IFPRI, 2013). This makes Egypt highly vulnerable to
international price fluctuations. With higher international prices and lower foreign
currency income in the years post the 2011 revolution from tourism, exports and foreign
direct investments, the balance of payments deficit has become much wider (IFPRI,
2013). The current situation thus places serious question marks on Egypt’s energy, water
and food security.

17
1.3 Research Problem
In addition to the above challenges, Egypt is facing another major challenge
regarding its main water resource Nile River. Ethiopia is currently undergoing the
construction of a major dam on the Blue Nile: The Grand Ethiopian Renaissance Dam
(GERD). Other dams are also planned to be built as the total potential for hydropower in
Ethiopia is estimated around 45,000 MW of which only 3% is being currently utilized.
The purpose of the research is to study possible mitigation of the effect of the GERD on
Egypt through developing its WEF nexus locally and the cooperation with the Nile Basin
countries using the WEF nexus.

18
Chapter Two: Conceptual Framework and Methodology
The aim of this section is to explain how the key research questions in this thesis
were developed. It will also explain the methodology followed in order to reach the
answers to the research questions through a systematic research approach.
2.1 Research Problem
Egypt is already facing huge challenges in terms of energy, water and food
security. The three sectors are very well interconnected and deficiencies in one sector
cause shortages in the other two sectors. The Grand Ethiopian Renaissance Dam (GERD)
is expected to have negative impacts on Egypt’s water security. This will in turn affect
Egypt’s food security and energy security due to the interconnections between the three
sectors.
2.2 Main Research Question
The main research question is whether developing a policy framework for a WEF
Nexus for the Nile Basin can help Egypt overcome the additional stress on its water
resources caused by the GERD. The hypothesis is that developing such a nexus will help
Egypt both internally through coordinating its policies in the three sectors and on the Nile
Basin level will help overcome the problem and open new opportunities for cooperation
among the Nile Basin countries in the three sectors.
Egypt has always held the position that it will not give up on one drop of its
“historical rights” in the Nile water. In addition, all previous agreements and initiatives
have been focused solely on the water issue. The problem is that when looking at the
water alone, the negotiation process turns into a win-lose process. Since the Nile water is
a finite resource, whatever water Ethiopia gains Egypt has to lose. The main hypothesis
in this thesis is that the situation with the Nile Basin countries can be turned into a win-
win situation if we zoom out to include the water, energy and food sectors into the
equation. This means for example that Ethiopia can withhold part of the Nile water in
return for power transmitted through the integration of the power grids of the Nile Basin

19
countries or through giving Egypt the opportunity to plant parts of the Ethiopian land
which receives adequate rainfall for agriculture.
2.3 Minor Research Question
In addition to the main research question mentioned above, the thesis also
examines whether creating a policy framework for a WEF nexus for Egypt can help the
country face the upcoming challenges in the three sectors. It also tackles whether it is
possible to have a complete integration with the Nile Basin countries through the concept
of virtual water trade.
2.4 Research Design
The research conducted in this thesis relies mainly on a desk study of a literature
review including the following sources:
Reports from international organizations on the WEF nexus and its global
emergence in the past few years. Those included UNESCO, UN ESCAP,
UNDP, FAO, the World Bank and the World Food Program.
Journal articles and studies to assess the issue of virtual water trade in the Nile
Basin. Those included the Journal of Global Environmental Change, the
Journal of Hydrology, studies by FAO and the Nile Basin Initiative, a PhD
Thesis from Delft University and a study from King’s College in London.
Journal articles and studies to assess Ethiopia’s water, energy and food
security situation and its plans to build dams on the Blue Nile. Those included
the Journal of the American Water Resources Association, Journal of Asian
and African Studies, Water Policy, Hydrology and Earth System Sciences,
Mountain Research and Development, Journal of Water Resources Planning
and Management, in addition to reports from Oxfam, the World Water
Council, UNDP, the World Bank, FAO, World Food Program
After the above literature is examined and analyzed, a policy framework for the
WEF nexus in Egypt and the Nile Basin countries will be developed. There were no
previous attempts to propose such a policy framework for Egypt or the Nile Basin. The

20
framework will tackle cooperation from a WEF nexus perspective and will not be only
limited to water issues.

21
Chapter Three: Literature Review
3.1 Emergence of the Water-Energy-Food Nexus Globally
During the period from the 16th till the 18th of November, 2011, roughly 550
people gathered in Bonn in order to attend a conference called “The Water, Energy and
Food Security Nexus – Solutions for the Green Economy”. The German government
organized the conference in order to bring key stakeholders from the three sectors
together, with the aim of collaboration and brainstorming solutions for cross-cutting
problems. The conference gave the first opportunity for both experts and politicians from
a large number of countries from all three sectors to collectively develop the nexus steps
(Martin-Nagle et al., 2011).
The nexus approach offers huge potential to improve resource efficiency and
provide benefits related to production and consumption through addressing externalities
across the sectors. The nexus focuses on overall system efficiency and not merely
isolated sectors productivity, and hence maximizes benefits provided to societies. A
better integrated process of developing policy accounting for cross-sectoral external costs
will improve overall resource efficiency and provide more equitable benefit sharing, as
opposed to conventional approaches which only improve sectoral resource productivity
(Martin-Nagle et al., 2011).
The benefits from the Nexus approach should encourage governments, private
sectors, and the civil society to collaborate. Those include for example addressing
intensive agriculture which utilizes less water but uses more energy than traditional
agriculture. The nexus approach would address the energy intensity of desalination, water
requirements for renewable energy production and water requirements for afforestation.
Management across the sectors can help improve overall resource efficiency. It is
possible in multi-use systems to utilize waste and un-useful by-products to be resources
to other products and services. The nexus approach can also use economic instruments to
improve resource efficiency. Governance, institutions and policy coherence can help
guide investments that minimize negative externalities. Capacity building is also needed
to manage the complexity of cross-sectoral approaches (Hoff, 2011).

22
The WEF Nexus has become part of the international development efforts and is
acknowledged as a policy paradigm. Table 1 examines how the WEF nexus is portrayed
in different documents and initiatives of international organizations.
Table 1 - Nexus Elements in Major Documents and Initiatives (UN ESCAP, 2013)
Entity Views on the Nexus Documents/Meeting
1 Food and Agriculture
Organisation of the United
Nations
The FAO views the energy-
agriculture as a coherent
system. Bioenergy could be
used to improve agricultural
productivity for rural
development. It links
between energy, biomass
and carbon flows.
The Energy and Agriculture
Nexus, 2000. Energy and
Natural Resources Working
Paper No. 4
2 United Nations Economic
and Social Commission for
Asia and the Pacific
WEF security is considered
as one of the resource
efficiency strategies.
Low Carbon Green Growth
Roadmap for Asia and the
Pacific, 2012
3 Asian Development Bank Adopts the nexus
perspective as one its 12
key messages.
Asian Water Development
Outlook 2013: Measuring
Water Security in Asia and
the Pacific
4 Transatlantic Academy Looks at the WEF security
from a broader perspective
which includes land and
minerals.
The Global Resource Nexus:
The Struggles for Land,
Energy, Food, Water and
Minerals, 2012
5 Stockholm Environment
Institute
Pushes for reducing trade-
offs and generating more
benefits among the nexus
elements.
Prepared the background
paper for Bonn 2011 Nexus
6 International Food Policy Publishes article on the
food-water-climate change
A co-organizer of the Bonn

23
Research Institute nexus in a number of
scientific journals.
2011 Nexus Conference
7 International Energy
Agency
Focuses on water
requirements for energy
generation and estimates
freshwater needs by energy
source and region.
World Energy Outlook 2012
8 The World Bank Issued a report on the
importance of river
resources for the WEF
nexus.
Overcoming Barriers to
International Cooperation of
River Basins Critical for
Food, Water, Energy
Security, 2012
9 United Nations Conference
on Sustainable
Development
Covered the topics of food
security, water and
sanitation, and energy.
Outcome document “The
Future We Want”, 2012
10 Asia- Pacific Center for
Water Security, Tsinghua
and Peking Universities
Collaborated with ADB for
publishing the Third Water
Development Outlook for
Asia and the Pacific.
Established a regional
program on R&D on WFE
security, 2013
3.2 Linkages among Water, Energy and Food
Connections among food, energy, and water are numerous and complex. This
section examines the most important links among the three sectors. The main inter-
relationships between water, energy and food are shown in Figure 1.

24
Figure 1 - Schematic of the WFE nexus and its constituent issues (UN ESCAP, 2013)
3.2.1 Water for Food and Water for Energy
The most evident inter-relation in the WEF nexus is agriculture, which has been
practiced by humans for many thousands of years. The largest consumer of freshwater
worldwide is agriculture for food and fiber production. Table 2 shows that the amount of
water withdrawals for agriculture worldwide is around 69%. Large amounts of water are
also used for energy production. That includes extraction of fossil fuels, mining, refining
processing and electricity generation. Water is also used for growing biofuel feedstock.
On the other hand, energy is used for water pumping, treatment and distribution as well
as for the treatment of the resulting waste water. We should however differentiate
between electricity generation which returns most of the withdrawn water and agriculture
which does not (Finley & Seiber, 2014). Between 15% and 35% of global water
withdrawals are not sustainable, meaning that water usage is used faster than it can be
replenished (Dupont & Thirlwell, 2011).

25
Table 2 - Water withdrawal by sector, around 2007 (FAO, 2014)
Region Total withdrawal by sector Total water
withdrawal
(BCM/year)
Total freshwater
withdrawal
(BCM/year)
Municipal Industrial Agricultural
BCM/year % BCM/year % BCM/year %
Africa 27 13 11 5 174 82 213 199
Americas 130 15 288 34 430 51 847 843
Asia 228 9 244 10 2035 81 2507 2373
Europe 72 22 188 57 73 22 333 332
Oceania 5 26 3 15 11 60 18 17
World 462 12 734 19 2722 69 3918 3763
3.2.2 Energy for Food
The food sector is globally also highly dependent on energy. The production of
food and the associated supply chain consume around 30% of the World energy
consumption. That includes the energy required for primary production; energy used for
drying, cooling and storage; energy used for food transportation; processing of food and
beverage; and preparation and cooking (FAO, 2011).
In agriculture, farmers use energy inputs to improve processes that occur naturally
so that a given piece of land or amount of water would actually yield more product than it
would naturally do. The significant fossil fuel consumption in all phases of the food
system helped meet the amount of food required globally by a growing population in the
past 100 years. Transportation of food in vessels, tractors, trucks and other vehicles
consume oil products. Chemical fertilizers and pesticides consume natural gas. Electricity
and heat generated by fossil fuels are used to process, refrigerate and package food.
Cooking also consumes a wide range of fossil fuels (FAO, 2011).
The interconnections between energy and food are best shown through the prices.
The boom in food prices reached its peak during July 2008, when the average price of
crude oil went up 94% from a year earlier reaching US$ 133/barrel. Within only five
months of 2008, rice prices increased from US$ 375/ton in January to $757/ton in June
(Baffes & Haniotis, 2010). The IMF’s index for internationally traded food commodities
prices increased 56% during the period from January 2007 to June 2008 (Mitchell, 2008).

26
Figure 2 shows how commodity prices tend to be linked with energy prices. During the
period from 2000 to 2010, wheat and crude oil prices have nearly tripled, and rice and
corn prices have almost doubled. Increases in oil prices since 2003 have resulted in more
demand for biofuels. The process of converting vegetable oil to biodiesel is cost-effective
if vegetable oil is much cheaper than diesel. It is also possible for farmers to switch to
vegetable oil crops from food crops in case it is more profitable for them. Therefore,
cereals prices are connected to vegetable oil prices, and hence to crude oil prices (Kim,
2010).
Figure 2 - Comparative trends of crop commodity and oil price indices from 1990 to 2009 (with 2004
as baseline) (Kim, 2010)
3.2.3 Desalination: Energy for Water
Desalination is an energy intensive process. Given the advancement of
desalination technologies, desalinated water can now be produced at a cost lower than
US$ 0.50/m3. It is also expected that the advancement of new state-of-the-art desalination
technologies like adsorption desalination will bring the required amounts of energy and
the associated cost down in the future (Ghaffour et al., 2012). The growth rate of the
desalination capacity worldwide is currently at an astonishing annual rate of 55% (Global
Water Intelligence, 2014).
There are two main types of desalination technologies: thermal desalination using
thermal energy and/or electricity and membrane desalination using only electricity.
Thermal desalination depends on processes which change the physical state of water or

27
distillate via evaporation. On the other hand, membrane desalination utilizes processes
which use a membrane employing the concept of filtration (Al-Karaghouli et al., 2009).
Currently the most dominant desalination technologies are the Reverse Osmosis (RO), a
membrane technology, constituting 60% of the global capacity and the Multi Stage Flash
(MSF), a thermal technology, constituting 27% of the global capacity. The distribution of
the desalination technology market is shown in Figure 3. The suitability of each
technology depends on a lot of factors like energy availability and pricing, water quality
and technical resources available in the region (IRENA, 2012). The main sources of
water for desalination are sea water and brackish groundwater which amount to 58% and
23% of feed water for desalination globally respectively (Al-Karaghouli at al., 2009). The
types of desalination technologies are shown in Figure 4.
Figure 3 - Desalination Technology Market (Koschikowski, 2011)

28
Figure 4 – Seawater Desalination Processes (Al-Karaghouli et al., 2009)
3.2.4 Biofuels: Food for Energy
The term biofuel refers to solid, liquid or gaseous fuels that are produced from
bio-renewable or combustible renewable feedstock (Demirbas, 2007). The two main
biofuels used as transportation fuels are bioethanol and biodiesel. Those two can
potentially replace gasoline and diesel fuel respectively. The feedstock used for
producing bioethanol is almost only food crops. Demand for biodiesel has increased in
some markets due to its low carbon emissions. The main idea behind biofuels is that they
are carbon neutral because their carbon emissions are re-absorbed by the plants in the
photosynthesis process as the plants are renewable (Demirbas, 2006). Biofuels are
classified according to their production technologies as shown in Table 3.
Table 3 - Classification of renewable biofuels based on their production technologies (Demirbas,
2009)
Generation Feedstock Example
First generation biofuels Sugar, starch, vegetable
oils, or animal fats
Bioalcohols, vegetable oil,
Biodiesel, biosyngas, biogas
Second generation biofuels Non-food crops, wheat
straw, corn, wood, solid
Bioalcohols, bio-oil, bio-
DMF, Biohydrogen, bio-

29
waste, energy crops Fischer–Tropsch diesel,
wood diesel
Third generation biofuels Algae Vegetable oil, biodiesel
Fourth generation biofuels Vegetable oil, biodiesel Biogasoline
The most commonly used biofuel is ethanol, which is an alcohol fermented from
sugar, starch or cellulosic biomass. Its production on the commercial level comes mainly
from sugar cane and beet root because starch and cellulosic biomass need costly
preparation. In addition to its use as a biofuel, it is used in the manufacturing cosmetics,
pharmaceuticals and alcoholic beverages.
3.3 Danger of Ignoring the Water-Energy-Food Nexus
The mismanagement of the Water-Energy-Food Nexus globally was one of the
main reasons of the 2008 global food crisis. In 2008, the World Bank warned that 33
countries were vulnerable to social unrest due to the rapid increase in food prices, as 105
million people were pushed into poverty. Finance ministers gathered in April 2008 to
discuss the global food shortages. It was reported that in informal discussions they
blamed the U.S. policies on biofuels. The U.S. methanol made from corn could have been
exported to feed the hungry (Davis & Belkin, 2008). Demand for biofuels was one of the
main reasons for the sharp increase in food prices during the period from 2006 to 2008.
The high global energy prices pushed developing countries’ governments to support the
production of biofuels though a set of policy instruments. The global biofuels production
tripled during the period from 2000 to 2007 (Dupont & Thirlwell, 2011). According to
Baffes and Haniotis (2010), prices of agricultural commodities were affected by both
unfavorable weather conditions and the shift of food commodities to biofuels production,
especially maize in the U.S. and edible oils in Europe. The danger biofuels pose on food
security is best illustrated by the fact filling a car tank with biofuel uses as much as the
annual cereals consumption of a poor person (Kim, 2010).
The growing demand for food has in many cases affected both water quality and
quantity. Poor irrigation management has previously caused water depletion, water
quality deterioration, waterlogging and salinization. In addition, extraction of

30
groundwater at unsustainable rates for agriculture has caused lowering of water tables
and saltwater intrusion at coastal areas. For example, in North China groundwater levels
are falling by around 1 meter per year. Water withdrawals for agriculture have caused
severe water quality problems through changes in stream flows. On the other hand,
contaminated water supplies have affected food quality leading to health hazards, as
untreated waste water and contaminated surface water were often used in agriculture in
developing countries (Rosegrant et al., 2002). It has been reported that untreated waste
water was used for irrigating more than 500,000 hectares in Latin America only
(Cavallini, 1996). The average irrigation efficiency is very low in developing countries,
well below what can be achieved (Rosegrant et al., 2002).
3.4 Examples of the Inevitable Water-Energy-Food Interconnections
from the World
Saudi Arabia is an example of an arid developing country rich in energy
resources. It is estimated that 9% of the electricity consumption of the country is used for
obtaining water either through groundwater pumping or desalination (Siddiqi & Anadon,
2011). Abderrahman (2010) demonstrates how in Saudi Arabia, the scarcity of water
resources was solved by the abundance of energy resources. In order to meet the growing
demand for water for domestic, industrial and agricultural purposes, 35 dual purpose
desalination plants, multi-stage ash distillation (MSF) and Reverse Osmosis (RO), were
constructed on both the Red Sea and the Gulf coasts for water production. In addition, the
MSF plants contribute about 20% of Saudi Arabia’s national electricity. Moreover,
energy is used to pump water from 85,000 wells that were drilled to meet the demand for
irrigation water.
Jordan is one of the most water stressed countries in the World with annual
renewable water supplies of just 161m3 per capita. Jordan shares most of its surface water
with neighboring countries, whose practices have deprived Jordan of its fair water share.
The problem was even intensified by high population growth rates and the large number
of refugees Jordan hosts (Michel et al., 2012). Although water desalination seems like the
logical approach to be adopted, Hadadin et al. (2010) highlight that water desalination is

31
currently confined to a small number of industrial facilities which desalinate water for
their own use. The main source of water used for desalination is brackish water available
throughout the country and seawater at the Gulf of Aqaba. They argue that desalination
should be one of the major measures Jordan has to implement, given that the technology
is available and proven. Its cost has decreased from US$1.50 to around US$0.63 per m3
under ideal conditions. Østergaard et al. (2014) study energy sytem’s impacts of different
desalination technologies in Jordan. They use the Energy PLAN model to model the
entire energy system including electricity, cooling. heating, cooling, and industrial energy
demands. They conclude that reverse osmosis (RO) driven by electricity and Multi Stage
Flash (MSF) desalination driven by Cogeneration of Heat and Power (CHP) are similar in
fuel use. As a heavily water stressed country, Jordan should pay more attention to the
WEF nexus which can help it mitigate its water scarcity problem.
China is listed by the United Nations as one of 13 countries suffering from severe
water scarcity. Although China has 21% of the World population, it only has 6% of
freshwater supply. However, due to the cheap water prices, desalination still remains as
an economically infeasible solution (Wong, 2013). Kahrl & Roland-Holst (2008)
examine the relationships between energy and water in China, with a special focus on
energy requirements for water use. They conclude that energy used for providing water
not used for agriculture is only a minor portion of the Chinese energy consumption, but it
is expected to increase together with the increase in water treatment capacity. They also
found energy-water price interactions of minor relevance to policy makers because of low
water prices, but this is likely to change by time due to the high energy intensity of water
treatment facilities. Finally, they concluded that shifting of water from agricultural to
non-agricultural uses will have significant energy implications. Regarding water use for
energy purposes, the National Development Reform Commission has officially cancelled
plans for the construction of coal-to-liquids (CTL) plants in response to concerns about
drought problems. This is due to the fact that CTL processes are highly water intensive,
so they are likely to affect both water availability and quality (Xinhua News, 2006).
Sovacool & Sovacool (2009) highlight the locations in the United States most
likely to face severe water shortages resulting from additions of thermoelectric capacity.

32
They argue that many electric utilities have paid little attention to water scarcity issues
and have continued to include in their plans new water intensive nuclear and fossil fuel
based power plants. They focus on Houston, Texas; Atlanta, Georgia; Las Vegas,
Nevada; and New York, to have a deep understanding of the likely water and electricity
challenges they might soon face. Their policy recommendations include improving the
cooling cycles of conventional power plants, discontinuing the construction of power
plants which have once-through cooling cycles, modifying provisions of the National
Environmental Policy Act concerning the licensing of new power plants, seeking quick
demand side energy efficiency improvements and implementing renewable energy
projects to replace thermal power plants.
Stillwell et al. (2011) examine the energy-water nexus in Texas, specifically the
relation between electricity generation and water resources. They study water
requiremenets for electricity generation and energy requirements for water supply and
waste water treatment. They included the following policy recommendations:
1. Applications for new power plants should include an assessment of the
implications of the different alternatives for cooling options in terms of both water
and energy efficiency.
2. New fossil fuel based or CSP power plants should clearly demonstrate water
availability at the selected site. The demonstartion should take into consideration
average rainfall and the availability of water during extreme drought.
3. The State should provide incentives for power plants implementing water efficient
cooling technologies like air-cooling or hybrid wet-dry cooling.
4. The State should provide guidance to water suppliers and waste water treatment
providers for the quantification of energy use and water conservation benefits.
3.5 Egypt’s Water Challenges
3.5.1 Water Shortage
Egypt’s location is in a dry climate area; its rainfall is rare and most of its land is
desert. Egypt has a fixed water quota from the Nile and a deep non-renewable

33
groundwater aquifer, which will be depleted if used in a non-sustainable manner. Water
shortage is an important constraint facing Egypt’s economic development (Allam &
Allam, 2007). In addition, Egypt faces rapid population growth and massive levels of
water pollution. Water scarcity issues are expected to have severe impacts on national
economy, social stability, human health and livelihoods of citizens (Luzi, 2010). Egypt is
currently meeting its water demand which exceeds its available resources by more than
25% through re-using agricultural wastewater as shown in Table 4. The vast majority of
the Nile water (around 88%) is used in agricultural fields, while municipal and industrial
uses account for about 7% and 5% respectively. Water not used up by crops seeps
through the soil to the drainage system. Figure 5 shows how drainage water is recycled
both officially and unofficially (Barnes, 2012). Along the Nile, drainage canals discharge
water into the river. Moreover, pumps are used to lift water from the drainage canals to
the irrigation system for re-use at multiple points. This represents the official re-use of
the drainage water. Illegal uses are represented by farmers using the drainage water
directly for irrigation.
Table 4 – Egypt’s Water Uses and Available Resources in Year 2000 (Allam & Allam, 2007)
Water Uses (BCM/year) Water Resources (BCM/year)
Sector Amount Resource Amount
Municipalities 5.25 Nile river 55.50
Industry 3.50 Groundwater (Delta and Valley) 5.50
River Transport 0.25 Deep Groundwater 0.80
Agriculture 63.00 Drainage Water Reuse
- Canals in the Delta Region 4.50
- Nile river and Bahr Youssef 5.00
- Illegal Uses 3.00
Wastewater Reuse 0.20
Rain fall and Flash Floods 0.50
Evaporation Losses -3.00
Total 72.00 Total 72.00

34
Figure 5 – The Nile’s water cycle (Barnes, 2012)
3.5.2 Water Pollution
Although drainage water is in important resource in facing water scarcity, its re-use in
the irrigation system causes significant change in the water quality. Pollutants existing in
the drainage system can cause harm to the environment and public health. In addition,
this jeopardizes the possibility of exporting Egyptian products to markets having
stringent quality standards. This also causes troubles to water treatment plants which
produce drinking water to the population. Although the different pollutants are of concern
for specific crops, water salinity is one of the main concerns for all farmers. The average
salinity of water in the main drains is 565 ppm, but can reach up to 6000 ppm. For most
crops, irrigation with saline water leads to lower yields. For example, irrigating with a
water of salinity 1000 ppm causes the yield to be around 70% of that with fresh water
(Barnes, 2012).
In addition to the water pollution due to re-using drainage water, the continuous
increase in the population associated with the expansion in industry and urbanized areas
has caused deterioration in water quality in Egypt. The southern part of Lake Nasser has
the best water quality as it is clear of any pollution sources except for few agricultural
activities on its banks. In the Nile valley area from Aswan to Cairo, the Nile is exposed to
numerous pollution sources which include untreated and semi-treated industrial
wastewater, sewage water, agricultural drainage water, and solid liquid waste from Nile
cruise activities (Allam & Allam, 2007). In addition, levels of bacteria are higher than the
acceptable limits for municipal use and irrigation. In the Rosetta branch, bacterial

35
pollution is present with a high level of ammonia. Damietta branch also has high salinity
and ammonia levels (Drainage Research Institute, 1996).
3.6 Egypt’s Energy Challenges
Egypt is a major producer of oil in Africa, as it is the largest non OPEC
(Organization of the Petroleum Exporting Countries) oil producer in Africa. It is also the
second largest producer of Natural gas in Africa after Algeria (U.S. EIA, 2014).
However, Egypt’s large population and economic growth have significantly increased the
demand for energy in all sectors including the residential, transportation and industrial
sectors. Energy consumption has thus increased considerably during the previous few
decades. Energy production in Egypt has been dominated by fossil fuels: oil and natural
gas. However, Egypt has never been a major oil producer when compared to the Gulf
states (Bahgat, 2013).
In 2013, Egypt’s total primary energy consumption was around 1.7 million bbl/d
of oil equivalent (BP, 2014). Natural gas and oil are the main fuels used to meet the
energy demand and constitute around 94% of the total consumption. While oil is the
dominant fuel in the transportation sector, natural gas is used in power generation sector,
industry sector and transportation sector in the form of compressed natural gas (CNG)
(U.S. EIA, 2014). The primary energy consumption by fuel for Egypt in 2013 is shown in
Figure 6.

36
Figure 6 - Primary energy consumption in Egypt, by fuel, 2013 (U.S. EIA, 2014)
3.6.1 Oil
Egypt’s annual oil consumption has increased by almost 3% during the last
decade. It averaged around 770,000 bbl/d in 2013. Egypt was able to meet its oil demands
domestically till the year 2010 when consumption surpassed the production, as shown in
Figure 7. On the other hand, Egypt’s oil production averaged just below 700,000 bbl/d in
2013. Egypt’s oil production has been declining for over 10 years now from a peak of
over 900,000 bbl/d in mid 1990s. Although the year 2008 witnessed an increase of
production, mainly from the Western Desert and some offshore areas, the total production
returned to the declining pattern afterwards (U.S. EIA, 2014).

37
Figure 7 - Oil production and consumption in Egypt (U.S. EIA, 2014)
3.6.2 Natural Gas
Egypt’s production of natural gas has declined annually by an average of 3% from
2009 to 2013 (U.S. EIA, 2014). In 2013, Egypt produced around 2.0 Tcf of natural gas of
which 1.9 Tcf was consumed locally and while 0.1 Tcf was exported. Although
significant gas discoveries have been made in the off shore Mediterranean and other
areas, those fields have not been developed due to the low price the government is willing
to pay to foreign operators. Another barrier to increasing gas production is the huge debt
that Egypt owes foreign operators, amounting US$ 7.5 billion as of June 2014 (U.S. EIA,
2014). In order to meet the rising domestic demand, the government has been diverting
natural gas supply from exports to the domestic market especially the power generation
sector. As a result, Egyptian gas exports have declined at an annual rate of 30% between
2010 and 2013. In January 2014, BG Group declared Force Majeure notices regarding its
LNG agreements in Egypt as a result of diversions of gas volume to the domestic market
beyond the contracted arrangements (BG, 2014). Figure 8 shows the natural gas
production and consumption in Egypt through the last decade.

38
Natural gas shortages were the main reason for the energy crisis in Egypt in the
previous years. The power sector is dependent on natural gas by as much as 70%, and the
energy intensive industries which are the cement, iron & steel and fertilizers industries
are almost exclusively dependent on natural gas. For that reason, the natural gas
shortages caused huge problems in both sectors during the last four years.
`
Figure 8 - Natural gas production and consumption in Egypt (U.S. EIA, 2014)
3.6.3 Coal
In 2013, Egypt consumed around 2.2 million tons of coal (BP, 2014). However,
coal is not used as an energy source but rather as a raw material for the coke and
aluminum industries. However, due to the energy crisis, consecutive governments started
from 2012 considering importing coal for utilization in the cement and power generation
sectors. The main motivation was the low prices of coal when compared to importing
natural gas or heavy fuel oil. By 2013, most of the cement plants in Egypt had already
started taking serious steps towards fuel switching to coal after they had been having
several natural gas cuts which sometimes lasted for many weeks. In April 2014,
responding to huge pressure from the troubled cement industry, the cabinet officially
approved using coal for the cement industry (Reuters, 2014). In December 2014, the
Ministry of Electricity and Energy announced the intention of the Egyptian Electricity
Holding Company (EEHC) to sign seven agreements with Chinese coal-power generation

39
companies (Mada Masr, 2014). It is evident that importing coal is one of the main pillars
the government is considering for solving the energy crisis in Egypt.
The main challenge to coal utilization in Egypt is the absence of the
infrastructure. That includes ports, storage facilities and transportation. A number of ports
are currently preparing to receive coal. Cement plants are also constructing storage
facilities for the coal. This is of course in addition to the environmental impacts
associated with its handling, transportation and combustion. Utilization of coal has
sparked considerable public debate regarding the expected environmental impacts. A
number of social movements were mobilized like “Egyptians against coal” in opposition
of coal and supporting. The Ministry of Environment has already approved a number of
cement plants switching to coal, in addition to a number of new coal operated power
plants.
3.6.4 Electricity
Since 2010, Egypt has been facing electricity blackouts due to rising demand,
declining natural gas production, poorly maintained infrastructure, and inadequate
generation capacity. Egypt’s power generation capacity was 27 GW by the end of 2013,
which is higher than the peak demand of 24 GW. In 2012, Egypt generated about 152
billion kWh of electricity of which 70% came from natural gas, 20% from oil and 10%
from renewables, mainly hydropower. Political and social unrest since the 2011
revolution has slowed the governmental plans to expand power generation capacity by 30
GW by 2020. Accordingly, the demand is rising at a rate much higher than capacity
expansions (U.S. EIA, 2014).
3.7 Egypt’s Food Challenges
Although Egypt’s area is about 1 million km2, agricultural land is about 8 million
feddans (Abdelhakam, 2005). Egypt is considered as an agricultural country where
agriculture is a main component of the national economy. The agricultural sector
employs around 31% of the labor force in Egypt (Kruseman & Vullings, 2007) and
generates about 14% of the GDP (Morgan, 2010). Despite the positive impact the

40
agricultural sector has on food security and the economy, it faces serious challenges.
Those challenges include land and water problems; outdated cultivation methods; lack of
marketing knowledge by the farmers; poverty; degradation of natural resources; water
and soil contamination; climate change; and inadequacy of policies for agricultural
development (Shalaby et al., 2011).
Egypt is a net food importer, importing more than half its wheat needs. Egypt’s
foreign currency reserves reached US$ 15.43 billion by the end of January 2015 (CBE,
2015), which covers three months of imports. This causes a supply risk. Inflation also
causes considerable pressure on consumers as the Consumer Price Index (CPI) has
increased by an average of 9.23% within 2014 (CBE, 2015). This has been coupled with
static income and an unemployment rate of 13.1% in the third quarter of 2014
(CAPMAS, 2015).
3.7.1 Food Availability
Food production in Egypt has had generally an upward trend over the last decade
as shown in Figure 9. For example, wheat production has annually increased between
2002 and 2011. However, in the longer term, Egypt is facing lots of challenges regarding
food production. Those include an increasing population, limited agricultural land, small
holder farming, degradation of land, construction on agricultural land, desertification and
climate change (WFP, 2013). Between 2001 and 2010, cultivated land increased by 0.7%
annually which is equal to 8% over the 10 years. However, after the revolution, the trend
was reversed and cultivated land decreased by 1% between 2010 and 2011 (CAPMAS,
2012). This was mainly due to illegal construction on agricultural land in Greater Cairo
and the Nile Delta (Attia & Raslan, 2011). In addition to that, rural areas in Upper Egypt
have suffered in the previous years from unpredictable weather leading to crop failure.
This caused farmers to utilize the already stressed natural resources in an unsustainable
manner (WFP, 2013).

41
Figure 9 – Production of Selected Crops in Egypt (million tons) (WFP, 2013)
While consecutive governments have promoted and worked for self-sufficiency,
Egypt is far from being self-sufficient in terms of food production, particularly key
serials. Table 5 shows Egypt’s Self Sufficiency of selected crops and the corresponding
per capita consumption. Egypt is a net importer of food, which makes it vulnerable to
both global food prices and exchange rates fluctuations (WFP, 2013).
Table 5 - Self Sufficiency of selected crops and per capita consumption (WFP, 2013)
Crops
Self Sufficiency, % Per Capita Consumption (kg/year)
2009 2010 2011 2009 2010 2011
Cereals 69.06 63.90 53.96 266.8 253.0 244.6
Vegetable 104.70 106.46 106.11 164.3 122.5 135.9
Wheat 53.15 47.86 42.60 135.4 133.9 135.0
Fruit 111.14 111.11 116.70 93.1 89.7 83.8
Maize 62.24 60.70 51.04 66.3 71.7 67.3
Rice 112.49 116.21 98.25 65.2 39.6 35.4
Meat 88.78 84.76 85.96 10.9 9.8 30.0
Vegetable Oils 42.64 43.18 36.67 9.4 8.5 15.7
Pulses 41.72 36.00 43.24 9.8 9.1 7.2

42
Crops
Self Sufficiency, % Per Capita Consumption (kg/year)
2009 2010 2011 2009 2010 2011
Sugar 100.03 100.01 100.01 9.1 7.7 7.2
Wheat is the key strategic crop in Egypt, as it is a major constituent of the
Egyptian diet. Egypt’s average annual wheat consumption was around 18 million tons
over the last five years. Out of that, Egypt imported 9-10 million tons annually. Although
the wheat availability was not an issue in Egypt during the previous decades, there is
considerable risk in its supply given the fall in the value of the Egyptian Pound against
foreign currencies (WFP, 2013). The U.S. Dollar rose against the Egyptian Pound from
6.15 EGP/USD in December 2012 to 8.88 EGP/USD in April 2016 (almost 45%
increase) (XE, 2016). Egypt’s foreign currency reserves reached US$ 15.43 billion by the
end of January 2015 (CBE, 2015). Wheat is mainly used for the production of the heavily
subsidized baladi bread. The whole supply chain is full of losses, starting from poor
storage of wheat to the leakage of subsidized flour through the black market (WFP,
2013).
3.7.2 Rising Food Insecurity
A number of events started from 2006 caused a decline in food security and
resulted in the deterioration in the nutrition status impacting the most vulnerable
households. The first event was the response to the avian influenza epidemic in 2006
which involved a mass culling of poultry. This affected the livelihood and dietary
diversity of the most vulnerable households. The second event was the food and fuel
prices of 2007-2008 which increased the food crisis pushing more Egyptians into
poverty. Even after the crisis the prices did not return back to normal. The third event was
the rising of food prices in 2010 which was coupled with constant incomes as a result of
the 2011 revolution (WFP, 2013). The revolution caused a decline in the economic
performance of the country, causing the economic growth to slow down from an average
of 6.2% in the period 2005-2010 to just 2.2% in 2011/2012 (Ministry of Finance , 2013).

43
Data from the Household Income, Expenditure, and Consumption Survey
(HIECS) shows that the most considerable shock noted by 74.7% of the households was
the rise in food prices, as shown in Figure 10. The expenditure on food constitutes 40.6%
of the average household income in Egypt, with the figure rising up to 51% for the most
vulnerable households. This is an indication that households are significantly vulnerable
to rising food prices (WFP, 2013). Prices of food and non-alcoholic beverage increased at
a rate higher than the overall Consumer Price Index (CPI) during the period 2010-2012
(CAPMAS, 2013).
Figure 10 – Percentage of households citing shocks affecting their financial status after the revolution
by region (WFP, 2013)

44
Chapter Four: Analysis of Virtual Water Trade in the Nile
Basin and the Ethiopian Situation
4.1 The Concept of Virtual Water
Virtual water refers to the water consumed in the production of any commodity
(Allan T. , 1997). When this commodity is traded, the embedded water in the product can
be considered to be also traded. In that sense, international food trade may be considered
as a massive pipeline. It is important though to differentiate between rain-fed agriculture
(green water) and irrigated agriculture (blue water). Crops grown using irrigation are
considered as a load on water resources in a given country, as this blue water could have
been used for other activities. On the other hand, it is not possible to utilize the green
water used in rain-fed agriculture for other purposes (Zeitoun et al., 2010).
4.2 The Nile Basin
River Nile runs through 11 countries in East Africa. The White Nile which
originates from Burundi and the Blue Nile which originates from Ethiopia are the two
main tributaries forming the Nile. The total area covered by the basin is 3,257,434 km2
with the largest shares in Sudan (64%), Ethiopia (11%), Egypt (9%) and Uganda (7%);
and smaller shares in Tanzania, Kenya, Congo, Rwanda, Burundi, Eritrea and South
Sudan. Around 437 million people live in the Nile Basin countries, 57% of them in rural
areas (Nile Basin Initiative, 2015). The total cultivated area in the basin is more than 26
million ha, 84% of them rain-fed. Crops grown include sorghum, millet, maize,
groundnut, and wheat. An important income generating activity is also livestock.
The Nile basin countries face a number of challenges, the most serious of which
are poverty, lack of food and water security, water pollution and land degradation.
Further challenges include increased deforestation, soil erosion, lakes and reservoirs
sedimentation, and loss of biodiversity (Sulser, et al., 2010). The hydrological and
political borders of the Nile Basin are shown in Figure 11.

45
Figure 11 – The Nile Basin Hydrological and Political Borders (LWRG, 2007)
The Blue Nile River originates from Lake Tana in Northwest Ethiopia. It is then
joined by a number of tributaries before it reaches Sudan. Rain is concentrated in the
summer season as almost three quarters falls between the months of June and September
(Conway, 2000). The Blue Nile continues flowing afterwards in Sudan towards the North
West where it is joined by the Dinder-Rahad River through the Gezira and then it
converges with the White Nile at Khartoum. The main Nile flows afterwards towards the

46
North where it is joined by Atbara River from the East. The Nile then enters Lake Nasser
at the Sudanese Egyptian border which is created by the High Dam and flows afterwards
towards the North till the Mediterranean Sea (Zhang et al., 2015). The Blue Nile together
with River Atbara (which also originates in Ethiopia) contribute 84% of the water
flowing to Lake Nasser in Egypt (Block & Strzepek, 2010).
Water security has been previously defined in narrow terms based on water
resources. When looking at the Nile Basin, the water present in the soil profiles in the
basin is actually more than the water in the channels. In addition, the groundwater lying
below the water channels has rarely been quantified. The volumes of water embedded in
the international trade of crops and livestock is so large that it cannot be overlooked
(Zeitoun et al., 2010). In terms of political economy, virtual water trade and water
security have important implications on the Nile Basin states beyond the basin itself
(Chapagain, 2006). For example, when a water scarce country imports crops and
livestock, it depends on the international market to achieve food security and free it from
its local scarcity conditions (Hoekstra & Hung, 2005). On the other hand, a country with
a surplus of water resources may utilize virtual water trade to improve its relation with
other countries thus improving its national security (Allan J. , 2003).
Green water, or soil water, is of particular importance when examining the Nile
Basin. In general, most of the food produced globally is based on green water
(Falkenmark & Rockstrom, 2006; Schiermeier, 2008). The Nile Basin countries
collectively import around 39 bcm/year of crops, mostly soya bean and wheat from North
and South America, in addition to 2 bcm of livestock, mostly cattle from Brazil, Australia
and Ireland. The above-mentioned imports are based on green water from other basins.
The major virtual water movements within the Nile Basin are also based on green water
used to raise tea and coffee in Kenya and Uganda (Zeitoun et al., 2010). The estimated
total amount of green water used in the Nile basin for the production of crops is about
229 bcm/year, excluding the green water consumed by natural vegetation (FAO, 2006).
On the other hand, the blue water used through irrigated agriculture is particularly
significant for Egypt and Sudan. Around 90% of the freshwater use in the Nile river
system is through irrigated farming (Appelgren et al., 2000). Significant amounts (around

47
0.25 bcm/year) are used though for growing citrus and vegetable exported to European
markets (Zeitoun et al., 2010). The freshwater resources of the Nile are shown in Table 6.
Due to the arid climate of the downstream riparians Egypt and Sudan, both countries are
largely dependent on blue water from the Nile. Upstream riparians, on the other hand,
receive lots of green water from rain and hence are less dependent on blue water from the
Nile.
Table 6 - Freshwater resources of the Nile (Zeitoun et al., 2010)
Average
annual
precipitation
(mm)
Nile River freshwater flows Soil water
consumption (for
agriculture)
(BCM /y)
Groundwater
Production
(BCM /y)
Inflow
(BCM/y)
Outflow
(BCM/y)
DR Congo 1,245 0 1.5 31.9 421
Burundi 1,110 0 1.5 6.1 2.1
Rwanda 1,105 1.5 7 11 3.6
Tanzania 1,015 7 10.7 31.6 30
Kenya 1,260 0 8.4 20.4 3
Uganda 1,140 28.7 37 45.8 29
Eritrea 520 0 2.2 0.8 -
Ethiopia 1,125 0 80.1 31.1 40
Sudan 500 117.1 55.5 50.3 7
Egypt 15 55.5 10 (to sea) 0 13
Total in
system
approx. 100 approx. 229
4.2.1 Virtual Water Trade in the Nile Basin
Virtual water trade within the Nile Basin countries is small when compared to
virtual water trade arising from imports from outside the basin. As shown in Table 7,
approximately 0.9 bcm/year of virtual water is traded annually with the Nile Basin, three
quarters of which is based on green water. Egypt alone imports about 0.4 bcm/year out of
the virtual water traded within the basin. On the other hand, the Nile Basin countries
import around 39 bcm/year of virtual water in the form of crops, out of which Egypt

48
alone imports approximately 30 bcm/year, as shown in Table 8. The virtual water traded
internally in the Nile Basin is only about 2.3% of the virtual water the basin imports from
outside its borders. The basin exports around 11 bcm/year of virtual water to countries
outside the basin, 90% of which is based on green water. Unless the Nile Basin countries
take measures for better utilization of green water in the basin, the basin cannot achieve
water and food self-sufficiency even if intra-basin trade is improved. There is currently a
strong net virtual water trade deficit between the Nile Basin and the rest of the world
amounting to about 28 bcm/year (Zeitoun et al., 2010).
Table 7 - Imports’ within the Nile Basin, main trade items only, average values 1998–2004 (Zeitoun
et al., 2010)
Imports by Total VW
trade (M m3)
From Volume and
major crop (M
m3)
Est. rain-fed
Portion (M
m3)
Est. irrigated
Portion (M
m3)
Egypt 372 Kenya 255 tea 240 15
Sudan 55 cotton 10 45
28.6 wheat 0 28.6
6.2 groundnut 4.5 1.7
Kenya 197 Uganda 21 soya 21 0
12 maize 12 0
7.8 tobacco 7.8 0
Tanzania 21 maize 20 1
12 cotton 12 0
6.4 groundnut 6.4 0
Egypt 26 sugar 0 26
13 rice 0 13
Sudan 29 sugar 0 29
Sudan 184 Kenya 87 tea 82 5
11 coffee 11 0
Uganda 78 coffee 78 0
Total 505 165
Table 8 - Imports from the rest of the world, main trade items only, average values 1998–2004
(Zeitoun et al., 2010)

49
Imports by Total VW
trade (M m3)
Specific VW
‘trade’ (M
m3)
Crop Volume and
origin (M
m3)
Est. rain-
fed
Portion (M
m3)
Est.
irrigated
Portion
(M m3)
Egypt 30,195 19,700 Soybean 8,512
Argentina
6,384 2,128
5,100 US 3,825 1,275
1,050 Brazil 788 1,012
5,213 Wheat 2,885 US 2855 0
755 Australia 755 0
592 France 592 0
357 Russia 357 0
3,400 Maize 2,653 US 1,990 663
439 Argentina 330 109
133 Brazil 100 33
Sudan 3,565 2,523 Wheat 953 Australia 953 0
522 Canada 522 0
172 US 172 0
Tanzania 1,818 Wheat, rice,
maize
1,454 364
Kenya 1,817 Wheat, rubber,
maize, rice
1,454 363
Total 22,531 5,974
There are strong discrepancies among the Nile Basin countries in terms of
whether they are net importers or exporters of virtual water, as shown in Figure 12. Egypt
and Sudan are clearly net importers of virtual water, while the Southern countries in
addition to Ethiopia and Eritrea are net exporters. The virtual water traded annually
within the basin cannot remedy the freshwater deficits the northern arid riparian countries
suffer from. Most of the intra-basin trade is actually in the form of tea and coffee from
Kenya and Tanzania to Sudan and Egypt (Zeitoun et al., 2010). The greater potential
actually lies in the improvement of the productivity of rain-fed agriculture.

50
Figure 12 – Average annual total virtual water crop and livestock ‘trade’ between Nile Basin states
and the rest of the world, imports and exports, 1998–2004 (Mm3/y) (Zeitoun et al., 2010)

51
4.3 Analysis of the Ethiopian Situation
Ethiopia is one of the World’s Least Developing Countries (LDCs), though it has
numerous resources including huge human resources. With a population of 96 million
people in 2014 (CIA, 2015), Ethiopia produced a GDP of only 54.80 billion US dollars
(Trading Economics, 2015). Egypt, on the other hand, with a population of 87 million
people in 2014 (CIA, 2015) produced a GDP of 286.54 billion US dollars (Trading
Economics, 2015). Ethiopians have the right to hope for a better future through rapid
economic development. This economic development can only be attained through
boosting electricity generation capacity and thus using more energy in much needed
economic activities.
In the past, Egypt had power over the other Nile riparian countries through the
1929 water treaty signed between Britain and Egypt. Britain, having control over many of
the riparian countries, negotiated with Egypt on behalf of its colonies and gave Egypt the
upper hand in the access and usage of the Nile water (Flintan & Tamarat, 2002). Several
factors have later loosened the Egyptian grip on the Nile water. Those include
independence of the riparian countries, high population growth, political developments,
droughts and other natural disasters. These factors have recently forced Egypt to re-
negotiate water treaties in a direction that will likely decrease its control over the Nile
(Ashton, 2002).On the other hand, water resources’ shortages in Ethiopia have pushed it
to reconsider the Egyptian access to the Nile. Ethiopia’s growing population has caused
its water demand to double in just a decade (Berman & Paul, 1999). The total reliance on
the Nile water resources over centuries has resulted in the depletion of the Nile basin,
which lead to unemployment, the spread of diseases and hunger. The resource depletion
in the basin is the result of climate change, land use and land management (Goulden &
Declan, 2009).
Ethiopians, already living in poverty, are now also suffering from climate
variability and extreme weather events (Oxfam, 2010). Development along the Nile has
caused water pollution in riparian countries. For example, the Ethiopian Eritrean war in
the late 1990s polluted the Nile basin with military and missile remnants (Kim &
Kaluarachchi, 2009). This pollution was coupled with excessive population growth in the

52
Nile basin which is also increased by migrations to the basin (World Water Council,
2006). Farming, one of the major sources of income in the basin, has been impacted by
drought, famine and land degradation. Land degradation and deforestation have caused
agriculture to be a very difficult task in many parts of the basin (EPA, 2010).
Egypt, as a result of the 1929 mandate, has historically had absolute control over
the Nile water resources. There was little conflict over the Nile water before the 1950s.
However, due to declining water resources and population growth, riparian countries
have grouped themselves up to access the Nile Water. These efforts were mainly lead by
Kenya and Ethiopia (Rahman, 2012). For example, in 2010 Ethiopia announced a major
hydro-electric project to supply the country’s electricity needs, which is currently under
construction. The project was met by resentment by Egypt which attempted to veto any
such project (Cascão, 2011).
4.3.1 Energy Security
Ethiopia is categorized by the United Nations as one of the Least Developed
Countries in the World (UN, 2015). Having an average annual income of US$ 120 per
capita, 40% of Ethiopians live below the poverty line (UNDP, 2015). The population
growth has been exceptional, with the population rising from 66 to 96 million between
the years 2000 and 2014. By 2020, it is expected to reach 110 million (UN, 2013).
Biomass is the main source of energy for the Ethiopian population with a share of 93.2%
of total energy consumption (IEA, 2012). Only 26% of the Ethiopian population has
access to electricity, while the average electricity consumption per capita is 52 kWh per
capita (compared to 100.0% and 1,743 kWh per capita for Egypt). The electricity
installed capacity in Ethiopia was 2060 MW in 2010, which covers only 10% of the
national demand (WB, 2015).
4.3.2 Food Security
Food security is a big challenge in Ethiopia. Land degradation and seasonality of
rainfall are serious factors influencing achieving food security in Ethiopian highlands
(FAO, 2011). Inappropriate land use practices coupled with rainfall seasonality have

53
caused land degradation. About 82% of the annual rainfall occurs in just 3-4 months
causing erosive runoff (Conway, 2000). Practicing farming on steep slopes together with
the seasonal rainfall has increased soil erosion (Haileet al., 2001). Consequently, decades
of consecutive soil degradation have worsened the seasonality of the water availability
necessary for food production and reduced soil fertility necessary for the agricultural
activities needed for the livelihood of a big and rapidly growing population (Zeleke &
Hurni, 2001). Rain variability has been affecting agricultural yield for several decades in
Ethiopia (Bewket, 2009).
Based on a 2014 WFP report, more than 30% of Ethiopia’s population is below the
food poverty line. This portion of the population is unable to secure the minimum
calorific intake required for having a healthy diet. Chronic malnutrition is a serious
challenge in Ethiopia, as 44% of children below five are stunted and 10% affected by
acute malnutrition. Regarding diet quality, half of the population sourced most of their
calorific intake (more than 75%) from starchy staples, i.e. their diet is highly unvaried.
30% of households used three or fewer of the seven food groups over a continuous week.
In terms of diet adequacy, one out of four households consumed unacceptable diets based
on the food consumption score. Out of these 10% had poor food consumption and 17%
had borderline food consumption (WFP, 2014).
Several other indicators show the severity of the food insecurity problem in Ethiopia.
Almost half of the household expenditures were on food. 35% of the households reported
to have gone through at least one shock in the past year, including food price increases
and food shortages. Rainfall is the single most important determinant for food production
in Ethiopia. Most of the households in Ethiopia reported lack of rainfall as the major
cause of their vulnerability. In general rainfall has declined between the months of March
and September from 1980 to present (WFP, 2014).
4.3.3 Water Security
Ethiopia is characterized by having huge discrepancy between its abundant water
resources and the widespread water scarcity and drought among its population. The
country has suffered from decades of extensive water pollution and rapid population

54
increase. Although Ethiopia enjoys large quantities of renewable water resources, it has a
very low capacity of water storage. In general, water withdrawals come from water
storage. Therefore, poor storage is associated with low withdrawals. The seasonality and
variability of rainfall has increased the incidence of floods and droughts. Due to the poor
storage, Ethiopia’s abundant water resources are available only during few months of the
year (Kloos & Legesse, 2010).
In the Ethiopian rural areas, women and children might have to walk up to six hours
to bring water. Most of the water is collected from shallow ponds shared with animals.
People may also get water from shallow wells. Those are sources are heavily subjected to
contamination as rainwater runoff collects contaminants from surrounding areas pouring
them into the source. In Ethiopia, 49 million people lack access to safe water, while 76
million lack sanitation services (water.org, 2015).
4.3.4 Ethiopia’s Grand Renaissance Dam
Ethiopia has significant water resources, providing it with an estimated hydro
power potential of 45,000 MW (Salman, 2013). Such hydropower capacity can drive the
Ethiopian economic growth in the coming years as it presents a reliable and cheap
electricity source (Verhoeven, 2011). The Grand Ethiopian Renaissance Dam (GERD) is
a mega hydro-electric project currently being constructed on the Blue Nile. Its location is
close to the Sudanese border as shown in Figure 13. It is planned to have a 74 BCM
capacity reservoir and a power generation capacity of 6,000MW. Construction started in
2011 and it is expected to be inaugurated in 2017 (Ethiopian Electric Power Corporation,
2013).

55
Figure 13 - Nile basin showing the expected GERD (Zhang at el., 2015)
The main concern of Egypt regarding the GERD is the access to the Nile water
which is its primary water source (Swain A. , 2011). In order to assess the dam impacts
on downstream countries, an international 10-person committee was formed and it
submitted its conclusions in May 2013. The studies are not public but it has been reported
that the Egyptian President has commented on the current studies that they are not
adequate (Reuters, 2013). On the other hand, Sudan has shown support to the project in

56
order to get access to affordable power and reduce silt and sediment downstream. This
would lead to a significant reduction in the cost of removing mud in the Jazeeera Scheme
due to the dam blocking of silt and sediments (MoFA, 2012).
The GERD will undoubtedly become an important resource for energy
production, food production and economic development in Ethiopia. It has also become a
political statement by the Ethiopian government that they are no longer bound to the
previous colonial water agreements. The GERD has become a symbol Ethiopian
nationalism and their foreseen “renaissance”. This can be seen evident from the way the
dam is being financed: 30% from China (The Economist, 2011) and the rest from the
Ethiopian government through local and international bonds and donations (Water
Technology.net, 2014).
In order to understand the impact of filling the GERD reservoir on the flow of
water to Egypt, a hydrology-hydropower modeling study was conducted by Zhang et al
(2015). Although there is no publicly announced filling policy for the reservoir, the study
revealed that the reservoir filling will cause a reduction in the stream flow at the Jazeeera
Scheme and Lake Nasser. The reduction extent varies significantly according to the
filling policy, climate variability and climate change during the filling period. The study
concluded that whether the reservoir is filled through a policy agreed with downstream
riparian countries or through a one-sided policy dictated by Ethiopia will largely affect
the impact on the water reaching Lake Nasser.
Another study was conducted to assess the GERD filling and operation effect on
Aswan High Dam. Its conclusions were as follows (Mulat & Moges, 2014):
The 6 years filling period of the GERD will not cause impact to the Aswan High Dam
water availability.
Power generation from Aswan High Dam will decrease by 12% during filling and 7%
during the dam operation.
Evaporative water losses from Aswan High Dam and GERD reservoirs will decrease
by 16% due to the Aswan High Dam operating at reduced water level.

57
Aswan High Dam will operate at 96% reliability level in terms of performance
efficiency.
El Bastawesy et al. (2015) studied the effect of the GERD using different
hydrological scenarios with the purpose of estimating the dam impact on the downstream
discharge. Their analysis stressed on the fact that the effect of the GERD on the
downstream discharge might be signifant if the GERD reservoir gets filled in low-flood
seasons over a short duration. They strongly recommended to reach an agreement
regarding storage capacities of all the dams on the Nile to satisfy the populations’ water
requirements.
Ramadan et al. (2013) used a hydrological model (MODSIM) developing different
operational scenarios in order to study the impacts of GERD construction on the Egyptian
water resources. Their results showed that the negative impacts are more likely to occur.
They concludde that the GERD impounding at the normal flow scenario through 2, 3 and
6 years would reduce the water reaching Lake Nasser by around 37, 25 and 13 BCM per
year respectively. This would cause a significant negative impact on Egypt’s water
resources.
In addition to the GERD, Ethiopia has plans to build on its huge hydropower
capacity. The Ministry of Water and Energy listed the hydropower projects to be
implemented.
Table 9 – Potential hydropower projects in Ethiopia (Derbew, 2013)
Name of the project Installed capacity (MW)
Status
1 Tekeze II 450 Under feasibility study
2 Derbu I & II 250 + 325 Feasibility study completed
3 Geba I & II 366 Feasibility study completed
4 Gojeb 153 Feasibility study completed
5 Genale V 100 Reconnaissance
6 Beko Abo 1,700 Under feasibility study
7 Baro I & II and Genji 900 Feasibility study completed
8 Mendeya (Blue Nile) 2,000 Under feasibility study
9 Tams 1,060 Reconnaissance
10 Dabus 425 Reconnaissance

58
11 Birbir R 467 Reconnaissance
12 Gibe V 660 Under feasibility study
13 Gibe IV 1,400 Under feasibility study
14 Lower Didessa 613 Reconnaissance
15 Wabishebele 18 87 Feasibility study completed
Total 10,956

59
Chapter Five: Proposed Policy Framework for the WEF Nexus
in Egypt and the Nile Basin Countries
Since ancient history, the Nile River has been a key resource for socioeconomic
activities for the communities that live along it. However, the water flowing in the River
is a finite resource. The 1929 water agreement between Britain and Egypt was more like
an order imposed by a colonial power in favor of its own interests. The 1959 water
agreement was similar, as it was an agreement between Egypt and Sudan which deprived
the other countries from utilization the Nile water (Kindleberger, 1986). The first
disturbance of the Nile regime was in 1988 after the second Ethiopian famine. At that
time, Ethiopia committed itself to providing more hydroelectricity and water for its
people. Ethiopia announced launching Tana-Beles Project which would take water from
Lake Tana (the main source of Blue Nile) to the Beles River which would transport it to
200,000 farmers in new settlements. In 1990, Egypt succeeded to block the financing
from the African Development Bank to the project (Lemma, 2001).
Egypt has recently been attempting to work on the growing consensus towards
forming a new Nile Basin regime. The water in the Nile River does not have equal
importance to all the riparian countries, as some of them receive adequate rainfall for
agriculture. However, due to the foreseen change in economic conditions in upstream
countries, Egypt has recognized that reaching a current deal might be better than reaching
a deal in the future. As a result, Egypt is changing its water policy and pushing towards
basin-wide cooperation (Tesfaye, 2014). While decreasing its claims on historic rights in
the Nile water, Egypt however continued changing the actual situation on the ground;
constructing massive new water projects unilaterally within its borders, with continued
dependence on the Nile Water (Swain A. , 2002).
Historically, Egypt succeeded in building viable relations with some of the key
upstream countries. Egypt has worked with Uganda in several projects for many years.
Those include the Owens Dam and clearing Lakes Victoria. Egypt also enjoyed good
relations with Kenya through the cooperation in developing ways to increase Kenya’s
dependence on ground water. In addition, Egypt helped Tanzania plan and develop a

60
water research center (Tesfaye, 2014). However, Egypt’s relation with Ethiopia, from
which 86% of the Nile water originates, was not as good. Egypt has managed to block a
number of multilateral institutions’ funds to develop Ethiopia’s water resources. This is
because multilateral institutions require the consent of downstream riparian countries to
finance project on trans-boundary rivers (Lemma, 2001). In fact, there has been a
historical nationalistic rivalry between Egypt and Ethiopia over the Nile. However, there
are also historical and cultural elements to build on like for example the relationship
between the Coptic Church and the Orthodox Ethiopian Church (Rubenson, 2009).
Although all Nile Basin countries are important forces in reaching a new Nile Basin
agreement, satisfying both Egypt and Ethiopia remains the most challenging task
(Tesfaye, 2014).
Throughout the negotiations in the previous decades, Egypt has so far negotiated
based on historical rights in the Nile water. The GERD has been under construction since
2011 and is expected to be operational in 2017. Although Ethiopia repeatedly announced
that the aim of the GERD is only to generate electricity and that it will not be used to
withhold the Nile water, there are serious doubts regarding this announcement. With a
population of 96 million people in 2014 (CIA, 2015), Ethiopia has to achieve water, food
and energy security. Ethiopia is one of the poorest countries in the World. The GERD is
their national mega project which is supposed to boost their economy and turn the
country around as suggested by its name. The Egyptian Ethiopian relations have suffered
since Ethiopia announced the construction of the GERD in 2010.
The reason why the negotiations so far not been successful is that they were
mostly win-lose negotiations: whatever water Ethiopia wins Egypt has to lose. Integrated
Water Resources Management (IWRM) has been thought to be the solution to the crisis
during the previous decade. However, this idea has been refuted repeatedly for trans-
boundary rivers (Biswas, 2010). The main disadvantage of IWRM is the fact that it
tackles water policy as if it is a commodity while ignoring the crucial human and social
issues. Water disputes are more complicated than disputes over commodities; they are
closely tied to the pursuit of justice and fairness (Anand, 2007).

61
Although the Nile Basin countries are net importers of virtual water, there is a
huge potential to improve the overall situation if a policy framework is created for the
WEF nexus and the basin is thought of as one unit. Cooperation within the basin can help
upstream countries improve the yield they get from green water through using the
Egyptian expertise in agriculture. If we also add electricity generation and distribution to
the equation, synergy is even improved. Having populations with very low electricity
access percentages in the upstream countries opens for the possibility of harnessing more
hydropower and utilizing the Egyptian expertise in electricity transmission and
distribution. In return, through the integration of electricity grids, Egypt can get cheap
and clean hydropower. In fact, the GERD itself can be viewed as an opportunity if the
right formula is introduced between the countries. The project will produce a
considerable amount of clean electricity and at the same time store water at climatic
conditions causing much less evaporation than that occurring at the High Dam.
In this section, a policy framework will be developed for the WEF nexus. The
policy framework will not only tackle the Nile Basin, but will also attempt to develop the
WEF nexus for Egypt. It will be demonstrated how mega projects in Egypt like the 1.5
million feddans reclamation program and the expansion of the power generation sector
have the potential of benefitting from the WEF synergy.
5.1 Policies Framework within the Egyptian Context
In Egypt, the policies related to the water, energy and food sectors are incoherent and
uncoordinated. As shown in Table 10, the three sectors are planned independently. Even
the years determined for the implementation of the policies are different.
Table 10 – Policies of the water, energy and food sectors in Egypt (Trinex, 2015)
National Water Resources
Strategy (2009-2017)
National Energy Strategy
(2008-2020)
National Agricultural
Development Strategy
(2001-2017)

62
Development of national
water resources
Protection of national
water resources
Efficient utilization of
national water resources
Securing the supply of
electrical energy
Minimizing electricity
prices
Expanding utilization of
renewable energy sources
Environment protection
and climate change
limiting
Restructuring electricity
sector and developing
operations and manpower
Sustainable use of
agricultural natural
resources
Improving agricultural
productivity
Increasing competitiveness
of the agricultural products
in local and foreign
markets
Achieving higher rates of
food security in strategic
goods
Improving opportunities
for agricultural investment
Such uncoordinated policies prevent Egypt from harnessing the synergies among the
three sectors. There is a need to develop one integrated strategic plan for the WEF nexus,
according to which the three sector policies will be aligned. The WEF nexus strategic
plan will come up with integrated and sectoral projects prioritized in coordination with
national development priorities. Examples will be presented later in this chapter to
demonstrate how Egypt can benefit from having coordinated WEF nexus policies.
5.2 Institutional Framework and Methodology for WEF Nexus in Egypt
and the Nile Basin Countries
Egypt has a Supreme Energy Council which is headed by the Prime Minister and
includes the Ministers of Electricity, Petroleum, Finance, Defense, Tourism, Transport,
Industry and Trade, Investment, Planning, International Cooperation, Environment and
Housing (Alfajr, 2014). It is recommended that the Supreme Council for Energy be
expanded to be the Supreme Council for Water, Energy and Food, through the
introduction of the Ministry of Water Resources and Irrigation and the Ministry of
Agriculture. The mandate of the Supreme Council of WEF should include coordination

63
between all the governmental agencies for Water, Energy and Food, including alignment
of policies and plans, exchange of information, review of projects and programs in each
sector, and the monitoring of implementation and operation of these projects and
programs.
A Similar institutional framework should be developed for the Nile Basin Countries.
This can take the form of a Nile Basin WEF Council, which can be formed of the Prime
Ministers and the Ministers of water resources, agriculture and energy in the Nile Basin
Countries. The Council should take strategic decisions and approve projects and plans,
and should have a number of technical committees for each sector and for policies,
planning and project monitoring and evaluation. In addition, the decisions taken by the
proposed Nile Basin Council should be legally binding to all the Nile Basin countries.
The purpose of having its decisions legally binding is to avoid the situation of the Nile
Basin Initiative which has been operational since 1999 but has had minimum
achievements since then.
The aim of the institutional framework developed is to coordinate sectoral and
integrated policies, develop strategic plans and prioritize, monitor and evaluate projects
that take into consideration the WEF nexus. The idea is to get decision makers to think
about projects in a holistic manner instead of thinking about them in a single dimensional
manner. The framework is designed to be developed in a highly participative manner so
that the different decision makers take ownership of the developed policies, strategic
plans and selected projects. The operational methodology of how the framework works is
shown in Figure 14.

64
Figure 14 – Operational Methodology for WEF Nexus at Egypt and/or Nile Basin Level
Develop the institutional setup
Develop the policy and strategic
planning framework through
stakeholders’ consultation
Review & assess existing and
planned projects and programs
Selection of WEF projects and
programs
Monitoring & evaluation of
implemented projects and
programs
Develop criteria for selection of
new projects/programmes based
on digital logic weighting
National and regional
stakeholders’ consultation at the
projects and programs final
approval stage
No
Seeking financing for projects
and programs
Identify
policy gaps
Policy draft by
stakeholders
Policy draft
approval
Assigning scores for
projects/programmes based on
scoring matrix
Yes
Score passed
Score failed
Abandon
project/programme

65
The development of the policy framework shall follow a participatory approach
involving the different stakeholders during the stage of developing the policy and
strategic planning framework. Although the process will be led by governmental entities,
it is very important to realize that the success of the policy framework also depends on
some key players. Those include other governmental entities, private sector, NGOs,
academic institutions and the public. It is of utmost importance to involve all the relevant
players early on in the planning process. Events targeting specific stakeholders and public
hearing sessions shall be organized. Consultation with relevant international
organizations is very important as well. It helps to develop global support for the
proposed policies, projects and programs, which is expected to be reflected in the
willingness of international and regional financial institutions to support these projects.
The purpose of the stakeholders’ consultation at the policy and strategic planning
framework stage is to gather as much input as possible from the different stakeholders at
a very early stage to feed into the process of projects and programs prioritization. In order
to ensure a sound stakeholders’ consultation process, participatory workshops will be
held to ensure gathering input from grass root population into the strategic planning
process. In order to do that, one national workshop and eight regional workshops will be
conducted. In addition to receiving input from the stakeholders, the purpose of the
workshops is also to raise awareness of the public about the cooperation mechanism and
the topic of the WEF nexus in general. During the process, policy gaps will be identified
and policy draft will be developed by stakeholders. The policy drafts will have to be
approved by the government, otherwise they should be returned back for more
stakeholders’ consultation.
In order to make sure the policy planning framework does not result in duplication of
effort, all relevant existing and planned projects and initiatives relevant to the WEF nexus
will be assessed and evaluated. It is very important to align the selection process of
projects and programs with the local national priorities of each country in order to
guarantee the maximum level of support from the government.
The methodology selected for the selection of projects and programs under the
cooperation mechanism is the digital logic method. In order to adequately allocate a

66
weight for every criterion, proper assessment of all criteria concerning their significance
with respect to objectives must be done. The allocation must also take into consideration
the importance of each objective with respect to the other. In case weight allocation is
done arbitrarily, it would lead to inaccuracies of decision due to having a large number of
criteria.
The digital logic method is adapted for the process of selection in order to allocate
calculated weights for each criterion. The digital logic method has the advantage of
simplifying a complex decision by breaking it apart into smaller and simple logic
decisions of yes or no outcomes. The process bases its technique on comparing every
criterion with the other and deciding which is more important with a yes or no. In this
case the number of criteria is 8, and when comparing each with the other, the number of
logical decisions that need to be made is 𝑛(𝑛−1)
2 which computes to 28. The yes or no
decision is numerically translated to 1 and 0. For each criterion, a row of 1 or 0 decisions
is formed where each row must have 7 values as per number of comparisons made with
respect to the other criteria. The values of 1 and 0 are summed up for each criterion and
divided by the total number of decisions (28) to allocate the weight. The process is
demonstrated in Table 11.
In order to identify the best projects/programmes for implementation, they should be
evaluated under pre-defined criteria. The criteria are based have the most significant
impact on water, energy and food security, in addition to other important factors like
alignment with national policies, relevance to climate change, environmental impacts and
sustainability of the projects. Sub-criteria have also been developed for each criterion.
The sub-criteria under each criterion are given equal weight. The criteria and sub-criteria
and that are used are discussed below.
1. Relevance to water security
a. Sustainability of the water resource
b. Quantity of water needed/produced
2. Relevance to energy security
a. Energy resources availability

67
b. Electricity access to populations
c. Availability of affordable energy to populations
3. Relevance to food security
a. Impact on food availability
b. Ability of most vulnerable households to withstand food prices shocks
4. Relevance to climate change
a. Relevance to climate change mitigation
b. Relevance to climate change adaptation
5. Sustainability of the project
a. Whether a feasibility study has been completed
b. Availability of management capacity
c. Availability of maintenance capacity
6. Alignment with other national policies & development priorities including poverty
reduction and other social objectives
a. Relevance to national policy framework/strategies/plans
b. Alignment with poverty reduction policies
c. Alignment with social justice and social inclusion
7. Cost effectiveness & economic viability
a. Availability of budget for implementing the project
b. Economic indicators for the project
8. Environmental Impacts
a. Whether the project has an approved environmental impact assessment /
strategic environmental assessment study
b. Impacts on air quality
c. Impacts on water quality
d. Impacts on soil
The evaluation criteria presented will have the following benefits:
Facilitate the selection of projects that will meet each country’s most urgent and
immediate needs
Prioritize projects which have a high ranking on the WEF nexus

68
Blend with national plans and policies
Take into consideration all pillars of sustainable development

Table 11 – Digital Logic Weighting
Cri
teri
a/
Dec
isio
n
1
2
3
4
5
6
7
8
9
10
11
12
13
14
15
16
17
18
19
20
21
22
23
24
25
26
27
28
# o
f po
siti
ve
dec
isio
ns
Wei
gh
t
All
oca
tio
n
Relevance to
water security
1 0 1 0 1 1 1 5 17.9%
Relevance to
energy security
0 0 1 0 0 1 1 3 10.7%
Relevance to
food security
1 1 1 0 1 1 1 6 21.4%
Relevance to
climate change
0 0 0 1 0 0 0 1 3.6%
Sustainability
of the project
1 1 1 0 1 1 0 5 17.9%
Alignment with
national
policies
0 1 0 1 0 0 1 3 10.7%
Economic
Viability
0 0 0 1 0 1 1 3 10.7%
Environmental
Impacts
0 0 0 1 1 0 0 2 7.1%
Total 100%

The weights obtained from the digital logic weighting will be further divided into equal
weight sub-criteria to have the matrix ready for projects/programmes evaluation. The full
matrix is presented in Table 12.
Table 12 –Matrix for Projects/Programmes Evaluation including sub-criteria
Criteria Criteria Weight Sub-Criteria Sub-Criteria Weight
Relevance to water
security
17.9% Sustainability of the water
resource
8.95%
Quantity of water
needed/produced
8.95%
Relevance to energy
security
10.7% Energy resources availability 3.57%
Electricity access to
populations
3.57%
Availability of affordable
energy to populations
3.57%
Relevance to food
security
21.4% Impact on food availability 10.71%
Ability of most vulnerable
households to withstand food
prices shocks
10.71%
Relevance to climate
change
3.6% Relevance to climate change
mitigation
1.79%
Relevance to climate change
adaptation
1.79%
Sustainability of the
project
17.9% Whether a feasibility study
has been completed
5.95%
Availability of management
capacity
5.95%
Availability of maintenance
capacity
5.95%
Alignment with
national policies
10.7% Relevance to national policy
framework/strategies/plans
3.57%
Alignment with poverty
reduction policies
3.57%
Alignment with social justice
and social inclusion
3.57%
Economic Viability 10.7% Availability of budget for
implementing the project
5.36%
Economic indicators for the
project
5.36%
Environmental
Impacts
7.1% Whether the project has an
approved environmental
impact assessment / strategic
environmental assessment
study
1.79%
Impacts on air quality 1.79%
Impacts on water quality 1.79%
Impacts on soil 1.79%

71
Criteria Criteria Weight Sub-Criteria Sub-Criteria Weight
Total 100.00%
At this stage, the projects and programs prioritization process has reached some
results which should be presented to the different stakeholders and the public. Similar to
the public consultation process conducted at the strategic planning stage, one national
workshop and eight regional workshops will be conducted at the final approval stage. The
results reached will be presented and input will be received again from the stakeholders
regarding the results. All comments and concerns will be recorded and used as an input to
the projects and programs prioritization process.
Once the stakeholders’ consultation process is completed and input received, the
prioritized list of projects and programs is ready to be finalized. The final list will be
completed by the project team in anticipation of securing the necessary funds.
The ultimate goal of the policy framework is to implement projects and programs
that prioritize the WEF nexus and at the same time contribute to the national priorities of
each of the Nile Basin countries. In order to do so, it is necessary to secure the necessary
funds. It is proposed to create a fund or development bank for the Nile Basin countries.
The fund will be financed by the Nile Basin countries with returns going back also to the
funding countries.
5.3 Examples of projects and programs that could benefit from WEF
synergy in Egypt
5.3.1 The Reclamation of 1.5 Million Feddans Project
In November 2014, President Abdel-Fattah Al-Sissy announced the launch of a
project for the reclamation of 1 million feddans at 11 areas at the Western Desert. The
project was scheduled to be completed in 10 months as per the Ministry of Agriculture
which was responsible for the file at that time (Youm7, 2014). This is exactly the type of
project which needs the WEF nexus to ensure its success. There is no possible way the
Ministry of Agriculture can handle this project without very close coordination with the
Ministry of Water Resources and Irrigation and the Ministry of Electricity and

72
Renewable Energy. For that reason, the project was delayed significantly. In May 2015, it
seems that the project ownership was shifted to the General Organization for Physical
Planning at the Ministry of Housing, Utilities and Urban Development. This was
concluded from the media reporting that a Memorandum of Understanding had been
signed between the Ministry of Housing and a Chinese company to fund the
infrastructure required for the land reclamation and the development of the new urban
communities within the 1 million feddans project (Daily News Egypt, 2015). In October
2015, a source at the Ministry of Water Resources and Irrigation announced that the
project was assigned to it and that the Ministry of Agriculture will only play a
consultative role only. The decision was attributed to the Prime Minister (Reda, 2015). It
was later announced that the project has been expanded to cover 1.5 million feddans.
The key success factors in a project like the reclamation of 1.5 million feddans are
availing both the water resources and energy needed for the project. In December 2015,
the Ministry of Water Resources and Irrigation announced that the project will depend
88.5% on ground water through 5114 wells and 11.5% on Nile water. It also announced
that the technical studies have confirmed that the sustainability of the ground water for
the first and second phases of the project has been confirmed for 100 years and that the
studies are in progress for the third phase (Al-Wafd, 2015).
Although it is considered a positive step that the management of the project has been
transferred to the Ministry of Water Resources and Irrigation, the project still needs the
WEF nexus approach. Had it been implemented from the beginning of the project, it
would have saved lots of time and effort. The project has now passed the planning stage
for availing the water resources, but still has several missing links. No details were
announced to the public regarding the plan to desalinate the ground water given the fact
that the ground water in Egypt is brackish with salinities ranging from 1,000 to 10,000
mg/l (Nasr & Sewilam, 2015). Apart from the normal regular energy requirements for
primary production; drying, cooling and storage; and crops transportation, desalination is
an energy intensive process and hence requires the intervention of the Ministry of
Electricity and Renewable Energy. For that reason, it is expected that a nexus approach,

73
if implemented, would guarantee the adequate intervention from all the required
stakeholders.
5.3.2 Expanding the Power Generation Sector
During the past year, Egypt has been working on expanding its power generation
sector. During the 2015 Egypt’s Investment Conference, Egypt’s Electricity Minister
signed MOUs worth USD 22 billion for power generation projects. Those included coal,
natural gas, solar and wind projects (Atlantic Council, 2015). In addition, Egypt has plans
to build a nuclear power plant at El Dabaa. In 2015, Egypt and Russia signed a deal to
build the nuclear power plant with 4 reactors each producing 1,200 MW (EIA, 2015).
While expanding the power generation sector, it is clear that the government did not
have the water scarcity problem into consideration. Combined power generation and
desalination plants can highly improve the overall efficiency of the process. A study
made on Al-Zour gas turbine power plant in Kuwait showed that the introduction of a
desalination unit improved the overall thermal efficiency of the process by 25% (Alsairafi
et al., 2013). In the Arabian Gulf countries, combined power generation and desalination
is very common. This is made institutionally possible by the fact that one Ministry in
responsible for the production of both power and water. This is another example of lost
opportunities due to the absence of the WEF nexus approach in Egypt.
5.4 Examples of projects and programs that can benefit from WEF
synergy on the Nile Basin Level
5.4.1 Expanding Green Water Utilization in the Basin
Groundwater is widely used for domestic use in the Nile Basin. It is the main source
for drinking water for rural communities in the basin. Around 70% of the population in
Ethiopian Highlands and the Nile Equatorial Plateau depend on groundwater. Thus
percentage reaches 80% in Sudan, almost 100% in South Sudan, but only 13% in Egypt.
Groundwater is also widely used for agricultural purposes in the Northern parts of the
basin (Sudan and Egypt) (Nile Basin Initiative, 2012). Its use is limited in the Southern
parts due to the abundance of rainfall as well as the availability of surface water bodies.

74
In general, groundwater is underutilized in the basin as shown in Table 13. Although the
groundwater quality in the Nile Basin is highly variable, the groundwater across the
region in general is fresh and suitable for human consumption in terms of physical and
chemical parameters. The main exception is the Nile Delta area in northern Egypt where
the groundwater is highly saline due to the intrusion of salt water from the sea (Nile
Basin Initiative, 2012).
Table 13 – Groundwater Potential of Nile Basin Countries (Hassan et al., 2004)
Country Groundwater
(BCM/year)
Renewable
groundwater
(BCM/year)
Non-renewable
groundwater
(BCM/year)
Groundwater
annual
extraction
(BCM /year)
Burundi 0.40 0.18 0.22 0.03
D R Congo 51.9 46.75 5.15 0.21
Egypt 4.00 0.09 3.91 0.90
Ethiopia 7.23 5.50 1.73 0.40
Kenya 2.34 1.01 1.33 0.42
Rwanda 0.40 0.32 0.09 0.04
Sudan 6.40 1.75 4.65 0.50
Tanzania 5.23 4.00 1.23 0.38
Uganda 2.12 1.95 0.17 0.18
Nile Basin countries have the potential for increasing the rain fed areas. Figure 15
shows the expected increase in harvested areas rain fed in the Nile Basin countries in
2030 and 2050.

75
Figure 15 – Harvested rain fed areas in the Nile Basin countries including projections – developed
from (FAO, 2011)
5.4.1.1 Using water footprint comparative advantage to grow crops using the least
possible water
As a smart choice, it is recommended to grow crops at the areas which have the
lowest water footprint for that specific crop. Based on that, the following opportunities
exist:
The Nile Basin countries are collectively net importers of cereals. Increasing the
production of cereals is an important target for these countries to improve their
food security situation. In that sense there are huge opportunities to improve the
yield of rain-fed cereals including maize in Ethiopia and Uganda as well as wheat
in Tanzania and DR Congo. This can be done without using any additional blue
water.
All Nile Basin countries are net importers of rice (Nile Basin Initiative, 2012).
The water footprint of rice in Egypt is much lower than upstream countries due to
the much higher yield in Egypt. If Egypt gets more cereals intake from upstream
Nile Basin countries, there is an opportunity.
-
5,000,000
10,000,000
15,000,000
20,000,000
25,000,000
Harvested areasrainfed 2005 (ha)
Harvested areasrainfed 2030 (ha)
Harvested areasrainfed 2050 (ha)

76
Although Uganda, Tanzania, Burundi and Rwanda are the biggest producers of
bananas in the basin, they have the lowest yields (Nile Basin Initiative, 2012).
This presents an opportunity for improving the yield in upstream countries and
helping them export to Egypt.
Egypt has the lowest yield among the Nile Basin countries in the production of
mangoes, even though it is the largest producer. On the other hand, huge amounts
are wasted in South Sudan and Uganda due to inadequate infrastructure required
for transportation and storage (Nile Basin Initiative, 2012). Egypt can help these 2
countries with improving infrastructure and thus can import from them and
decrease its production.
Except for Kenya, Rwanda and Sudan, all the other Nile Basin countries have a
relatively low water footprint for production of sugar cane (Nile Basin Initiative,
2012). This highlights the opportunity for expanding production and exporting.
5.4.1.2 Using Egyptian expertise to improve the yield of upstream countries
The productivity of rain fed agriculture is poor in the Nile Basin. The productivity
is limited by poor soil, water and bad crop management. There is room for improvement
of agriculture based in green water in the Nile Basin. Farmers are unable to use the
optimal quantities and quantity of fertilizers. They also do not use improved seeds. A
study conducted on maize in the Ethiopian part of the Blue Nile showed that the grain
yield of maize increased by an average of 51% with near optimal and non-limiting soil
fertility conditions. The study concluded that enhancing soil fertility coupled with the
usage of high yield crop varieties have the potential of improving overall productivity
through the reduction of evaporation and the increase of transpiration (Erkossa et al.,
2011). Compared to Egypt, the Nile Basin countries has very low crop yields. Figure 16
shows comparative yields for selected food crops in Egypt compared to the rest of the
Nile Basin countries. The yield in upstream countries is between 15 to 50% of the yield
in Egypt. The figure shows the huge potential for improving yield at the Nile Basin
countries if only the Egyptian expertise is utilized (Nile Basin Initiative, 2012).

77
Figure 16 – Comparative yields for selected food crops 2005-2009 (Nile Basin Initiative, 2012)
One of the main reasons behind the low yield in upstream Nile Basin countries is
the lack of fertilizers. Figure 17 shows the 2005 fertilizers consumption in the Nile Basin
countries. It shows that the Egyptian rate of fertilizers usage is more than twenty fold the
rate of the second best country which is Kenya. Egypt has a number of fertilizers
factories and is well-experienced in the production and usage of fertilizers. In order to
improve the yield in those countries it is recommended that Egypt either exports
fertilizers to Nile Basin countries or even build fertilizers factories at these countries.
This is a clear win-win situation which can benefit all countries.

78
Figure 17 – Use of fertilizers in the Nile Basin – 2005 data – developed from (Nile Basin Initiative,
2012)
In addition to improving the use of fertilizers, there is a number of measures that
can be taken in order to improve the yield at upstream countries, including improved
seeds, adjusting crop intensity and improving water conveyance. Egypt can also through
its Ministry of Water Resources and Irrigation perform research and technology transfer
through the cooperation between research institutions. Farmers at upstream countries
need extensive capacity building particularly in the area of soil management. Rain-fed
areas can make use of improving soil cover and setting up water harvesting structures.
This would minimize soil erosion and hence improve the soil conditions (Nile Basin
Initiative, 2012).
5.4.2 Integration of electricity grids
Nile Basin countries are endowed with a number of renewable and clean energy
resources. Nevertheless, most of these countries, especially upstream countries have very
low levels of electricity access. Excluding Egypt, the rates of electrification range
between 2 and 30%, with an average consumption of just 77 kWh per capita per year
(Economic Consulting Associates , 2009), which represents one of the lowest
consumption rates in the World. The power generation capacities of all Nile Basin
countries including Egypt is expected to grow significantly over the next few decades.
0
100
200
300
400
500
600
700
800
Uganda Eritrea Sudan Burundi Tanzania Ethiopia Kenya Egypt
1.1 2.3 2.6 3.4 10 12 38
732
Fertilizers Consumption (Kg/ha)

79
Figure 18 shows the forecasted demand for electricity for the Nile Basin countries up to
2045. The rise in demand is expected due to improving economic conditions as well as
population growth. This represents a huge opportunity for cooperation among all the
basin countries.
Figure 18 – Forecast demand for power for Nile Basin countries 2010-45 (Nile Basin Initiative, 2012)
The cheapest and most abundant power source in the Nile Basin is hydropower,
with a potential of more than 20 GW, with only 26% of the potential utilized (Nile Basin
Initiative, 2012). The building of hydropower facilities should be accompanied with other
huge investments in transmission and distribution. Through the integration of electricity
grids in the Nile Basin countries, Egypt can invest in the infrastructure needed for
transmission and distribution in return for electricity later on delivered to Egypt. This can
actually be a very successful cooperation model with Ethiopia in the Renaissance Dam
project.

80
5.5 Applying the policy framework to national projects in Egypt and
international projects in the Nile Basin
5.5.1 Applying the policy framework to the reclamation of 1.5 million feddans
project
To start assessing this project, it should be first discussed at the Supreme Council for
Water, Energy and Food. During this stage, the roles of each of the concerned Ministries
should be clear. It is anticipated that the following roles should be agreed by the different
ministries:
Ministry of Agriculture:
o Plan for the crops that will be cultivated in each of the selected regions
for the project. In doing so, it should select crops needing minimum water
requirements.
o Estimate quantities of water and fertilizers needed based on the selected
crops.
o Estimate the quantities of energy needed for water pumping, crop
harvesting, transportation and processing.
o Estimate the budget needed for the reclamation of land.
Ministry of Water Resources and Irrigation:
o For each region of the project, determine the source of water.
o In case brackish groundwater will be used, determine the quantities of
fuel needed for desalination.
o Determine the budget needed for availing the water resources for the
project.
New and Renewable Energy Authority, under the Ministry of Electricity and
Renewable Energy:
o Determine the budget needed for pumping of groundwater using solar
energy.
o Study the possibility of groundwater desalination using solar energy and
determine the needed budget.

81
Ministry of Petroleum and Mineral Resources:
o Determine the sources of fossil fuel needed for the implementation of the
project and the corresponding budget.
Ministry of Industry and Trade:
o Determine which fertilizers plants that will supply the needed fertilizers
for the project, and in case the existing capacity is not enough determine
the budget needed for the construction of new plants.
Ministry of Planning, Monitoring and Administrative Reform:
o Coordinate the overall planning of the project.
Ministry of Environment:
o Determine the environmental impacts of the project.
o Propose suitable mitigation measures for the expected impacts in
coordination with the other Ministries.
Ministry of Finance:
o Calculate the total budget needed for the project based on input from the
different Ministries.
o Determine the overall economic feasibility of the project.
Upon completing the proper Ministerial coordination, the scoring matrix should be
used to give a ranking to the project as shown in Table 14.

Table 14 – Ranking the 1.5 million feddans project based on pre-defined scoring matrix
Criteria Criteria
Weight Sub-Criteria
Sub-
Criteria
Weight
Sub-
Criteria
Score (out
of 10)
Sub-Criteria
Score Justification
Criteria
Score
Relevance to
water security 17.9%
Sustainability of the water
resource 8.95% 4 3.58%
The project mainly relies on
groundwater whose sustainability is
questionable. 5.4%
Quantity of water
needed/produced 8.95% 2 1.79%
The project is expected to put more
stress on the national water resources.
Relevance to
energy
security
10.7%
Energy resources
availability 3.57% 4 1.43%
The projects will require significant
energy resources for primary
production, transportation and
processing.
4.3% Electricity access to
populations 3.57% 4 1.43%
The project will put more stress on
Egypt's energy resources
Availability of affordable
energy to populations 3.57% 4 1.43%
The project will put more stress on
Egypt's energy resources
Relevance to
food security 21.4%
Impact on food
availability 10.71% 10 10.71%
The project will improve food
availability in Egypt. 21.4%

83
Criteria Criteria
Weight Sub-Criteria
Sub-
Criteria
Weight
Sub-
Criteria
Score (out
of 10)
Sub-Criteria
Score Justification
Criteria
Score
Ability of most vulnerable
households to withstand
food prices shocks
10.71% 10 10.71%
Availability of food produced locally
will make the most vulnerable
households in a better situation since
food prices will not be subject to
international price fluctuations.
Relevance to
climate
change
3.6%
Relevance to climate
change mitigation 1.79% 4 0.72%
Agricultural activities cause
considerable greenhouse gas
emissions from the use of energy and
fertilizers. 2.5%
Relevance to climate
change adaptation 1.79% 10 1.79%
Since the project is expected to
implement new agricultural
technologies, it will help with climate
change adaptation.
Sustainability
of the project 17.9%
Whether a feasibility study
has been completed 5.95% 0 0.00% No feasibility study was announced.
11.9% Availability of
management capacity 5.95% 10 5.95%
Egypt is a well experienced country
in managing agricultural projects.
Availability of
maintenance capacity 5.95% 10 5.95%
Egypt has enough human capacity
and expertise to aintain the project.
Alignment
with national
policies
10.7%
Relevance to national
policy
framework/strategies/plans
3.57% 10 3.57% The project is in line with the policies
of the Ministry of Agriculture.
10.7%
Alignment with poverty
reduction policies 3.57% 10 3.57%
The project is expected to have
positive social impact due to creatin
of jobs.

84
Criteria Criteria
Weight Sub-Criteria
Sub-
Criteria
Weight
Sub-
Criteria
Score (out
of 10)
Sub-Criteria
Score Justification
Criteria
Score
Alignment with social
justice and social inclusion 3.57% 10 3.57%
Some areas of the project are
marginalized areas which will help
with their social inclusion.
Economic
Viability 10.7%
Availability of budget for
implementing the project 5.36% 8 4.29%
The Egyptian government has
allocated budget for the project.
5.4% Economic indicators for
the project 5.36% 2 1.07%
Due to the arid nature of Egypt and
the high cost of obtaining fresh
water, the project is not expected to
be economically attractive.
Environmental
Impacts 7.2%
Whether the project has an
approved environmental
impact assessment /
strategic environmental
assessment study
1.79% 0 0.00% No EIA/SEA was developed for the
project.
2.9% Impacts on air quality 1.79% 8 1.43%
Impacts on air quality are restricted
to nenergy use which does not make
it a significant impact.
Impacts on water quality 1.79% 4 0.72%
If the project leads to unsustainable
groundwater withdrawals, this will
have severe impact on groundwater
quality.
Impacts on soil 1.79% 4 0.72%
Agriculture leads to the deterioration
of soil quality due to the use of
fertilizers and pesticides.
Total 100.00% 64.4%

After that, the project is ready to move to the second round of stakeholders’
consultation. Now there is enough information and studies to be presented to the
stakeholders. This round of stakeholders’ consultation should be done in all governorates
where the project is planned. The purpose is to present the results of the previous stages
and receive input from the local populations on their concerns and requirements from the
project. This will ensure their engagement and give them a sense of ownership of the
project. After that the project should move to the financing stage where the Ministry of
Finance should allocate the necessary budget for the project. Then the project should
move into implementation and monitoring.
5.5.2 Applying the policy framework to the GERD
The project should first be discussed at the Nile Basin WEF Council, which is
formed of the Prime Ministers and the Ministers of water resources, agriculture and
energy in the Nile Basin Countries. Each country should mention its concerns over the
project and they should be discussed accordingly. On that basis, technical committees
should be formed to study the impact of the project on Ethiopia and downstream
countries. The technical studies should be the basis on which the ranking should take
place. The scoring matrix should be used to give a ranking to the project as shown in

Table 15. It should be noted that the scoring in the Table is done from a regional
perspective of all the countries affected. It was not done from the Egyptian perspective
only.

Table 15 – Ranking the GERD project based on pre-defined scoring matrix
Criteria Criteria
Weight Sub-Criteria
Sub-
Criteria
Weight
Sub-
Criteria
Score (out
of 10)
Sub-Criteria
Score Justification
Criteria
Score
Relevance to
water security 17.9%
Sustainability of the water
resource 8.95% 5 4.48%
The project will improve the water
security situation of Ethiopia but will
threaten that of Egypt.
11.6%
Quantity of water
needed/produced 8.95% 8 7.16%
The GERD's reservoir will store
water at better climatic conditions
than that at Aswan High Dam, with
much less evaporation.
Relevance to
energy
security
10.7%
Energy resources
availability 3.57% 8 2.86%
The project will have an installed
capacity of 6000 MW, but might
affect the production of electricity at
Aswan High Dam.
10.0% Electricity access to
populations 3.57% 10 3.57%
The project will improve electricity
access to populations at Ethiopia and
its neighboring countries.
Availability of affordable
energy to populations 3.57% 10 3.57%
Large hydro projects produce cheap
electricity which makes it affordable
to populations.
Relevance to
food security 21.4%
Impact on food
availability 10.71% 5 5.36%
The project will improve the food
security situation of Ethiopia but will
threaten that of Egypt. 13.9%
Ability of most vulnerable
households to withstand
food prices shocks
10.71% 8 8.57% The project will help Ethiopia
overcome the recurring famines.
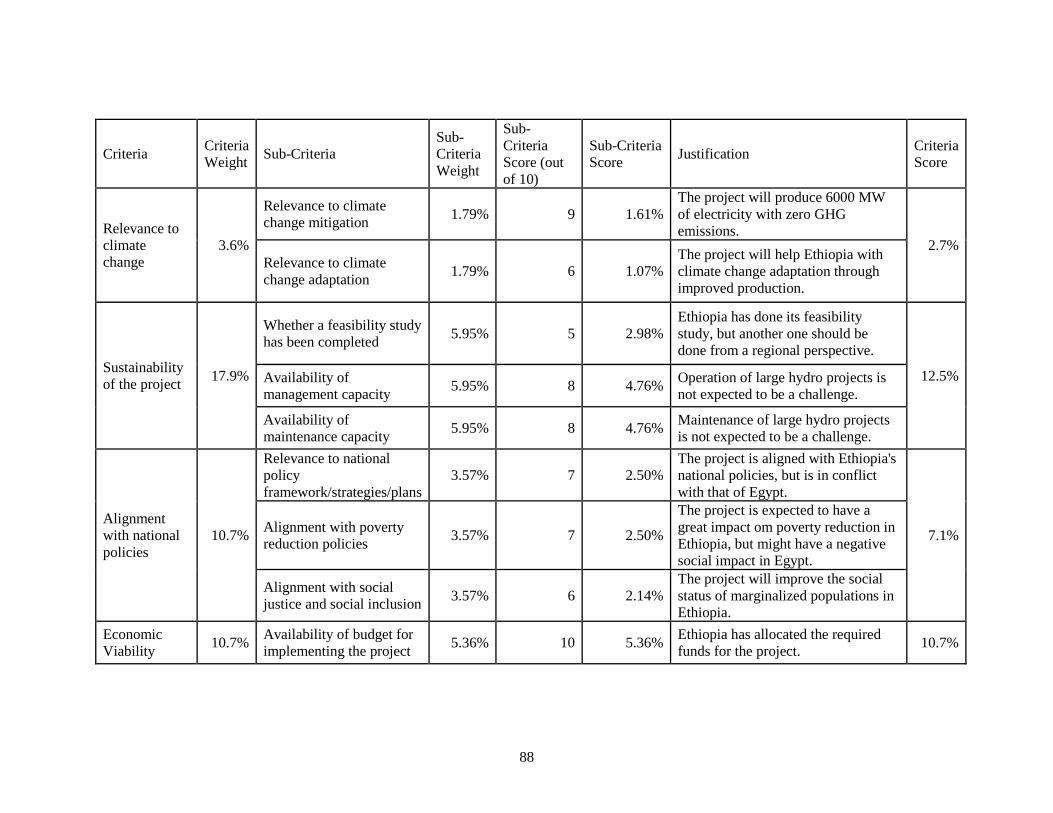
88
Criteria Criteria
Weight Sub-Criteria
Sub-
Criteria
Weight
Sub-
Criteria
Score (out
of 10)
Sub-Criteria
Score Justification
Criteria
Score
Relevance to
climate
change
3.6%
Relevance to climate
change mitigation 1.79% 9 1.61%
The project will produce 6000 MW
of electricity with zero GHG
emissions. 2.7%
Relevance to climate
change adaptation 1.79% 6 1.07%
The project will help Ethiopia with
climate change adaptation through
improved production.
Sustainability
of the project 17.9%
Whether a feasibility study
has been completed 5.95% 5 2.98%
Ethiopia has done its feasibility
study, but another one should be
done from a regional perspective.
12.5% Availability of
management capacity 5.95% 8 4.76%
Operation of large hydro projects is
not expected to be a challenge.
Availability of
maintenance capacity 5.95% 8 4.76%
Maintenance of large hydro projects
is not expected to be a challenge.
Alignment
with national
policies
10.7%
Relevance to national
policy
framework/strategies/plans
3.57% 7 2.50%
The project is aligned with Ethiopia's
national policies, but is in conflict
with that of Egypt.
7.1% Alignment with poverty
reduction policies 3.57% 7 2.50%
The project is expected to have a
great impact om poverty reduction in
Ethiopia, but might have a negative
social impact in Egypt.
Alignment with social
justice and social inclusion 3.57% 6 2.14%
The project will improve the social
status of marginalized populations in
Ethiopia.
Economic
Viability 10.7%
Availability of budget for
implementing the project 5.36% 10 5.36%
Ethiopia has allocated the required
funds for the project. 10.7%

89
Criteria Criteria
Weight Sub-Criteria
Sub-
Criteria
Weight
Sub-
Criteria
Score (out
of 10)
Sub-Criteria
Score Justification
Criteria
Score
Economic indicators for
the project 5.36% 10 5.36%
Large hydro projects produce cheap
electricity which makes it
economically viable.
Environmental
Impacts 7.2%
Whether the project has an
approved environmental
impact assessment /
strategic environmental
assessment study
1.79% 5 0.90%
Ethiopia has completed the project's
EIA, but another one should be done
from a regional perspective.
5.5% Impacts on air quality 1.79% 10 1.79% The project is not expected to have
any significant impact on air quality.
Impacts on water quality 1.79% 8 1.43%
The project will have positive impact
on water quality at Jazeera scheme at
Sudan due to the removal of silt.
Impacts on soil 1.79% 8 1.43% The project is not expected to have
any significant impact on soil quality.
Total 100.00% 74.1%

The project should now move to a regional stakeholders’ consultation process,
since the project will be implemented on a transboundary river. In addition to the
governmental entities that were involved at the at the initial stage through the Nile Basin
WEF Council, the stakeholders’ consultation should be attended by the civil society,
representatives of the public (possible parliament members) and the public at large.
Ethiopia, the implementing country should try to present evidence that the project will
not harm Egypt in terms of its water security. In case this is not achieved, Ethiopia can
present incentives in terms of food and/or energy. The project should be funded by the
Nile Basin fund only in case a unanimous decision is reached by the member countries.

91
Chapter Six: Conclusion and Recommendations
Water, energy and food security are far from being achieved globally. A large
number of people globally lack basic services, with 0.9 billion people lacking access to
clean drinking water, 2.6 billion people having no safe sanitation, 1.3 billion people
without access to electricity, 1.5 billion lacking access to modern forms of energy for
cooking and 1 billion suffering from hunger regularly. In the future those challenges are
expected to be even more severe. FAO expects that two thirds of the world’s population
will suffer from water stress by 2030. It is forecasted by the EIA that the world will need
40% more energy by 2030 compared to the current levels. The global demand for meat is
expected by UNEP to increase by 50% by 2025, leading also to a 42% increase in the
demand for grain. Climate change is expected to increase nexus challenges. Temperatures
are expected to increase, soil is expected to dry out, storms are expected to intensify and
glaciers are expected to reduce in size.
Egypt is a country struggling to achieve water, energy and food security. In terms
of water, Egypt is mainly relying on the Nile River, from which it currently receives 55.5
BCM per year as per the 1959 Nile Waters agreement. In the energy sector, Egypt is
currently experiencing its worst energy crisis in decades. Looking at food security, Egypt
is a net importing country; it currently imports 45-55% of its wheat consumption, which
makes it highly vulnerable to international price fluctuations. Egypt is facing another
major challenge regarding its main water resource Nile River. Ethiopia is currently
undergoing the construction of a major dam on the Blue Nile: The Grand Ethiopian
Renaissance Dam (GERD).
Egypt has so far negotiated repeatedly using the argument of its historical rights
in the Nile water. However, it should be acknowledged that the demography has also
changed a lot. The Ethiopian population is now already more than the Egyptian
population. Nevertheless, Ethiopia produces only a fraction of the energy produced by
Egypt and also a fraction of the GDP produced by Egypt.
It was demonstrated that the Egyptian policies in the three sectors are incoherent
and uncoordinated. Accordingly, it is recommended to develop one integrated strategic

92
plan for the WEF nexus, according to which the three sector policies will be aligned. It is
recommended to initiate a Supreme Council for Water, Energy and Food. The mandate of
the Supreme Council of WEF will include coordination between all the governmental
agencies for Water, Energy and Food, including alignment of policies and plans,
exchange of information, review of projects and programs in each sector, and the
monitoring of implementation and operation of these projects and programs. Similarly, a
Nile Basin WEF Council is recommended for the Nile Basin countries, in order to take
strategic decisions and approve projects and plans. The Nile Basin WEF Council
decisions should be legally binding to all Nile Basin countries.
A policy framework was developed to prioritize projects that are beneficial to the
WEF nexus. The development of the policy framework shall follow a participatory
approach involving the different stakeholders during the stage of developing the policy
and strategic planning framework. In order to assess and prioritize the different projects,
a digital logic method is used, where the criteria included relevance to water security,
relevance to energy security, relevance to food security, relevance to climate change,
sustainability of the project, alignment with national policies, economic viability, and
environmental impacts. Afterwards the final projects approval process involves another
stakeholders’ consultation process, followed by seeking funding for the selected projects.
In order to show the importance of the WEF policy framework both on the local
level in Egypt and the Nile Basin level, several examples were shown that could benefit
from having the WEF nexus approach. On the local level, it was demonstrated that the
lack of coordination caused huge delays to the reclamation of 1.5 million feddans project.
When applying the policy framework to the project, it was demonstrated that the project
could have taken a much faster track had the necessary coordination among governmental
entities been done at an early stage. Another example given was the expansion of the
power generations sector in Egypt, whose efficiency could have been improved by 25% if
combined power generation and desalination plants were introduced.
On the Nile Basin level, it was demonstrated that the water footprint comparative
advantage can be used to grow crops using the least possible water. In addition, the
Egyptian expertise in agriculture could be used to improve the very low agricultural yield
93
in upstream countries. Integrating electricity grids in the Nile Basin is also a very
interesting project. The Egyptian expertise can be utilized in the field of electricity
generation and transmission from hydropower in return for part of the generated
electricity going to Egypt. The policy framework suggested was implemented to the
GERD project. It was demonstrated how Ethiopia can provide incentives to Egypt
through power and food to compensate Egypt for water shortages due to the dam
construction. Although the project received a satisfactory score from a regional
perspective, it is strongly recommended that Egypt makes good use of the project by
adopting the virtual water concept (e.g. by planting crops and raising cattle in Ethiopia),
in addition to the integration of electricity grids with Sudan and Ethiopia.

94
Bibliography
Abdelhakam, A. (2005). Agricultural Extension in Egypt. FAO Regional Workshop on
Options of Reform for Agricultural Extension in the Near East (pp. 22-26).
Jordan: FAO.
Abderrahman, W. (2010). Energy and Water in Arid Developing Countries: Saudi
Arabia, a Case-study. International Journal of Water Resources Development,
247–255.
Adel, M. (2014, May 6). Government forced to import coal to fend off 2018 gas
production crisis: Ministry of Petroleum. Retrieved October 29, 2014, from
http://www.dailynewsegypt.com/2014/05/06/government-forced-import-coal-
fend-2018-gas-production-crisis-ministry-petroleum/
AGECC. (2010). Energy for a Sustainable Future. New York: The Secretary-General’s
Advisory Group on Energy and Climate Change.
Alfajr. (2014, March 10). Alfajr. Retrieved January 21, 2016, from Mehleb Changes the
Structure of the Supreme Council for Energy:
http://www.masress.com/elfagr/1548452
Al-Karaghouli, A., Renne, D., & Kazmerski, L. L. (2009). Solar and wind opportunities
for water desalination in the Arab regions. Renewable and Sustainable Energy
Reviews 13, 2397–2407.
Allam, M. N., & Allam, G. I. (2007). Water Resources in Egypt: Future Challenges and
Opportunities. Water International, 205-218.
Allan, J. (2003). Virtual water eliminates water wars? International Expert Meeting on
Virtual Water Trade, Delft.
Allan, T. (1997). Virtual Water: A Long Term Solution for Water Short Middle Eastern
Economies? SOAS Water Issues Study Group, School of Oriental and African
Studies/King’s College-London.
Alsairafi, A. A., Al-Shehaima, I. H., & Darwish, D. (2013). Efficiency improvement and
exergy destruction reduction by combining a power and a multi-effect boiling
desalination plant. Journal of Engineering Research, 289-315.
Al-Wafd. (2015, December 30). The Details of Al-Sissi's Inaguration of the 1.5 Million
Feddans Project. Retrieved January 30, 2016, from Al-Wafd:
http://alwafd.org/%D8%A3%D8%AE%D8%A8%D8%A7%D8%B1-
%D9%88%D8%AA%D9%82%D8%A7%D8%B1%D9%8A%D8%B1/1003097-

95
%D8%AA%D9%81%D8%A7%D8%B5%D9%8A%D9%84-
%D8%A5%D8%B7%D9%84%D8%A7%D9%82-
%D8%A7%D9%84%D8%B3%D9%8A%D8%B3%D9%8A-
%D9%84%D8%A5%D8%B4%D8%A7%D8%B1%D8%A9-
%D8%A7%D9%84%
Anand, P. (2007). Capability, sustainability, and collective action: An examination of a
river water dispute. Journal of Human Development, 109-132.
Appelgren, B., Klohn, W., & Alam, U. (2000). Water and Agriculture in the Nile Basin.
Rome: Food and Agriculture Organisation of the United Nations.
Ashton, P. (2002). Avoiding conflicts over Africa’s resources. Royal Swedish Academy of
Science, 31(3): 236–242.
Atlantic Council. (2015, March 15). What Was Pledged at Egypt's Investment
Conference? Retrieved February 4, 2016, from Atlantic Council:
http://www.atlanticcouncil.org/blogs/egyptsource/what-was-pledged-at-egypt-s-
investment-conference
Attia, K., & Raslan, Y. (2011). Cause and Combat of Agriculture Land Desertification in
Egypt Related to River Processes. International Journal of Water Resources and
Arid Environments, 342-352.
Baffes, J., & Haniotis, T. (2010). Placing the 2006/08 Commodity Price Boom into
Perspective. Washington D.C.: The World Bank, Development Prospects Group.
Bahgat, G. (2013). Egypt’s Energy Outlook: Opportunities and Challenges.
Mediterranean Quarterly, Volume 24, Number 1, 12-37.
Barnes, J. (2012). Mixing waters: The reuse of agricultural drainage water in Egypt.
Geoforum, 181–191.
Berman, I., & Paul, P. (1999). The New Water Politics of the Middle East. Division for
research in strategy research and analysis.
Bewket, W. (2009). Rainfall variability and crop production in Ethiopia: case study in the
Amhara Region., (p. 16th International Conference of Ethiopian Studies).
Trondheim.
BG. (2014, January 27). BG Group – Declares Force Majeure in Egypt; gives 2013
results expectations and 2014 outlook. Retrieved February 06, 2014, from
http://www.bg-group.com/~/tiles/?tiletype=pressrelease&id=599

96
Biswas, A. (2010). Cooperation or conflict in transboundary water management: Case
study of South Asia. Hydrological Sciences Journal, 662-670.
Block, P., & Strzepek, K. (2010). Economic analysis of large-scale upstream river basin
development on the Blue Nile in Ethiopia considering transient conditions,
climate variability, and climate change. Journal of Water Resources Planning and
Management, 156–166.
BMU and BMZ. (2011). Messages from the Bonn2011 Conference: The Water, Energy
and Food Security Nexus – Solutions for a Green Economy. Bonn: German
Federal Ministry for the Environment, Nature Conservation and Nuclear Safety
(BMU) and the German Federal Ministry for Economic Cooperation and
Development (BMZ).
BP. (2014). BP Statistical Review of World Energy. British Petroleum.
Buurman, J., Dahm, R., & Goedbloed, A. (2014). Monitoring and Early Warning Systems
for Droughts: Lessons from Floods. Singapore: Institute of Water Policy .
CAPMAS. (2012). Statistical Yearbook. Cairo: Central Agency for Public Mobilization
and Statistics.
CAPMAS. (2013). Egypt in Figures. Retrieved February 14, 2015, from
http://website.informer.com/visit?domain=capmas.gov.eg
CAPMAS. (2015). Central Agency for Public Mobilization and Statistics. Retrieved
February 10, 2015, from http://capmas.gov.eg/Pepo/719.pdf
Cascão, A. (2011). Ethiopia – Challenges to Egyptian hegemony in the Nile Basin. Water
Policy, 10(S2):13–28.
Cavallini, J. M. (1996). Aquaculture using treated effluents from the San Juan
stabilization ponds, Lima, Peru. Lima: Pan American Center for Sanitary
Engineering and Environmental Sciences (CEPIS).
CBE. (2015). Central Bank of Egypt. Retrieved February 10, 2015, from
http://www.cbe.org.eg/English/
CBE. (2015). Central Bank of Egypt. Retrieved February 10, 2015, from
http://www.cbe.org.eg/English/Monetary+Policy/Inflation/
CEHI. (2006). The Evaluation of the Use of Desalination Plants in the Caribbean.
Caribbean Environmental Health Institute. United Nations Educational, Scientific
and Cultural Organization (UNESCO).
97
Chapagain, A. (2006). Globalisation of Water: Opportunities and Threats of Virtual
Water Trade. Delft, Netherlands: UNESCO-IHE Institute for Water Education.
PhD Thesis. Delft University of Technology.
CIA. (2015). Retrieved August 12, 2015, from CIA, The World Factbook:
https://www.cia.gov/library/publications/the-world-factbook/geos/et.html
Conway, D. (2000). The climate and hydrology of the upper blue Nile, Ethiopia.
Geography Journal, 49-62.
Daily News Egypt. (2015, July 12). Egypt strikes deal with Chinese company to fund 1m
Acres Project infrastructure: Ministry of Housing. Retrieved from Daily News
Egypt: http://www.dailynewsegypt.com/2015/07/12/egypt-strikes-deal-with-
chinese-company-to-fund-1m-acres-project-infrastructure-ministry-of-housing/
Davis, B., & Belkin, D. (2008, April 14). Food Inflation, Riots Spark Worries for World
Leaders. Retrieved November 7, 2014, from The Wall Street Journal:
http://online.wsj.com/articles/SB120813134819111573
Demirbas, A. (2006). Global biofuel strategies. Energy Edu Sci Technol, 17:27–63.
Demirbas, A. (2007). Progress and recent trends in biofuels. Prog Energy Combus Sci,
33:1–18.
Demirbas, A. (2009). Biofuels - Securing the Planet’s Future Energy Needs. London:
Springer.
Derbew, D. (2013). Ethiopia's Renewable Energy Power Potential and Development
Opportunities. Abu Dhabi: Ethiopian Ministry of Water and Energy.
Drainage Research Institute. (1996). The Year Book of Drainage Water Quality . Cairo.
Dupont, A., & Thirlwell, M. (2011). A New Era of Food Insecurity? Survival: Global
Politics and Strategy, 71-98.
Economic Consulting Associates . (2009). The Potential of Regional Power Sector
Integration - Transmission & Trading Case Study. London: Nile Basin Initiative
(NBI) | .
EIA. (2015, June 2). Egypt International energy data and analysis. Retrieved January 4,
2016, from EIA: https://www.eia.gov/beta/international/analysis.cfm?iso=EGY
El Bastawesy, M., Gabr, S., & Mohamed , I. (2015). Assessment of hydrological changes
in the Nile River due to the construction of Renaissance Dam in Ethiopia. The
Egyptian Journal of Remote Sensing and Space Science, 65–75.

98
EPA. (2010). Africa Review Report On Drought And Desertification. Environmental
Protection Council.
Erkossa, T., Awulachew, S. B., & Aster, D. (2011). Soil fertility effect on water
productivity of maize in the upper blue nile basin, Ethiopia. Agricultural Sciences,
238-247.
Ethiopian Electric Power Corporation. (2013). Grand Ethiopian Renaissance Dam. Addis
Ababa.
EU. (2008). ADIRA Handbook, A guide to desalination system concepts. European
Union. Euro-Mediterranean Regional Programme for Water Management
(MEDA).
Falkenmark, F., & Rockstrom, J. (2006). The new blue and green water paradigm:
breaking new ground for water resources planning and management. Journal of
Water Resources Planning and Management 132 (3), 129–132.
FAO. (2006). FAO Nile Basin Dataset (virtwatnile.xls). Database prepared by FAO
Land and Water Unit for the report at hand. Rome.
FAO. (2007). Coping with Water Scarcity. Food and Agriculture Organization of the
United Nations.
FAO. (2011). Climate Change, Water and Food Security. Rome: Food and Agriculture
Organization of the United Nations.
FAO. (2011). Energy-smart food for people and climate. Issue Paper. Rome: Food and
Agriculture Organization of the United Nations.
FAO. (2011). Information Products for Nile Basin Water Resources Management. Rome:
Food and Agriculture Organization of the United Nations.
FAO. (2014, September). AQUASTAT. Retrieved from FAO:
http://www.fao.org/nr/water/aquastat/tables/WorldData-Withdrawal_eng.pdf
Fichtner. (2011). MENA Regional Water Outlook Part II Desalination Using Renewable
Energy. Germany: Fichtner.
Finley, J. W., & Seiber, J. N. (2014). The Nexus of Food, Energy, and Water. Journal for
Agricultural and Food Chemistry, 6255-6262.
Flintan, F., & Tamarat, I. (2002). Spilling blood over water? The case of Ethiopia.
Scarcity and Surfeit, The Ecology of Africa’s Conflict, 242–319.

99
Ghaffour, N., Missimer, T. M., & Amy, G. L. (2012). Technical review and evaluation of
the economics of water desalination: Current and future challenges for better
water supply sustainability. Desalination, 197–207.
Global Water Intelligence. (2014). Retrieved November 3, 2014, from
http://www.desaldata.com/
Goebel, O. (2003). Co-Generation of Power and Water- Selection of Desalination
Process. Germany: Lahmeyer International GmbH.
Goulden, M., & Declan, C. (2009). Adaptation to climate change in international river
basins: A case study of the River Nile. The School of Development Studies.
Hadadin, N., Qaqish, M., Akawwi, E., & Bdour, A. (2010). Water shortage in Jordan —
Sustainable solutions. Desalination, 197–202.
Haile, A. T., Rientjes, T. H., Habib, E., Jetten, V., & Gebremichael, M. (2001). Rain
event properties at the source of the Blue Nile River. Hydrology and Earth System
Sciences, 1023-1034.
Hassan, T. M., Attia, F. A., & El-Attfy, H. A. (2004). Groundwater Potentiality Map of
the Nile Basin Countries – A Step towards Integrated Water Management. Cairo:
Ministry of Water and Irrigation.
Hoekstra, A. Y., & Hung, P. Q. (2005). Globalisation of water resources: international
virtual water flows in relation to crop trade. Global Environmental Change, 45–
56.
Hoff, H. (2011). Understanding the Nexus. Background Paper for the Bonn 2011
Conference: The Water, Energy and Food Security Nexus. Stockholm: Stockholm
Environment Institute.
IEA. (2009). World Energy Outlook. Paris: International Energy Agency.
IEA. (2012). Ethiopia: Balances for 2012. Retrieved July 17, 2015, from International
Energy Agency:
http://www.iea.org/statistics/statisticssearch/report/?country=Ethiopia&product=b
alances&year=2012
IFPRI. (2013). Tackling Egypt’s Rising Food Insecurity in a Time of Transition.
Washington: International Food Policy Research Institute.
IPCC. (2007). Climate Change 2007 Synthesis Report. Geneva: Intergovernmental Panel
on Climate Change.

100
IRENA. (2012). Water Desalination Using Renewable Energy: Technology Brief.
International Renewable Energy Agency.
Kahrl, F., & Roland-Holst, D. (2008). China’s water–energy nexus. Water Policy, 51–65.
Kim, G. R. (2010). Analysis of Global Food Market and Food-Energy Price Links -
Based on System Dynamics Approach -. Hankuk Academy of Foreign Studies,
South Korea.
Kim, U., & Kaluarachchi, J. (2009). Climate change impacts on water resources in the
upper Blue Nile river basin, Ethiopia. Journal of the American Water Resources
Association, 45(6): 1361–1378.
Kindleberger, C. P. (1986). Hierarchy Versus Inertial Cooperation. International
Organization 40, 841–47.
Kloos, H., & Legesse, W. (2010). Water Resources Management in Ethiopia:
Implications for the Nile Basin. The United States of America: Cambria Press.
Koschikowski, J. (2011). Water Desalination: When and Where Will it Make Sense?
Presentation at the 2011 Annual meeting of the American Association for the
Advancement of Science, Fraunhofer Institute for Solar Energy Systems (ISE).
Kruseman, G., & Vullings, W. (2007). Rural Development Policy in Egypt towards 2025.
Targeted Conditional Income Support: A Suitable Option. Alterra-Rapport, 11-
78.
Lemma, S. (2001). Cooperating on the Nile: Not a Zero-Sum Game. United Nations
Chronicle 38, 1–7.
Luzi, S. (2010). Driving Forces and Patterns of Water Policy Making in Egypt. Water
Policy, 92-113.
LWRG. (2007). Virtual Water ‘Flows’ of the Nile Basin: Evaluating Current and Future
Crop and Livestock Trade Between Nile Riparians and Globally – A First
Approximation. London: Report commissioned by the Food and Agriculture
Organisation from the LSE/KCL London Water Research Group.
Mada Masr. (2014, December 2014). Egypt to sign 7 coal-power deals with Chinese
companies. Retrieved February 07, 2015, from
http://www.madamasr.com/news/environment/egypt-sign-7-coal-power-deals-
chinese-companies
Martin-Nagle, R., Howard, E., Wiltse, A., & Duncan, D. (2011). Conference Synopsis for
Bonn 2011 Conference: The Water, Energy and Food Security Nexus, Solutions

101
for the Green Economy. Bonn: Federal Ministry for the Environment, Nature
Conservation and Nuclear Safety (BMU), Federal Ministry for Economic
Cooperation and Development (BMZ) and OOSKAnews, Inc.
McKinsey & Company. (2009). Charting Our Water Future.
Michel, D., Pandya, A., Hasnain, S. I., Sticklor, R., & Panuganti, S. (2012). Water
Challenges and Cooperative Response in the Middle East and North Africa.
Washington, D.C.: The Brookings Institution.
Ministry of Finance . (2013, January). Financial Monthly. Retrieved Februart 14, 2015,
from Ministry of Finance:
http://www.mof.gov.eg/MOFGallerySource/English/Reports/monthly/2013/Jan20
13/a-b.pdf
Mitchell, D. (2008). A Note on Rising Food Prices. Washington D.C.: The World Bank,
Development Prospects Group.
MoFA. (2012). Nile: Sudan’s support for the grand Ethiopian Renaissance dam project.
Addis Ababa: Ministry of Foreign Affairs.
Morgan, D. (2010). Egypt: growth and opportunity in agriculture. Retrieved February 27,
2015, from
http://www.english.globalarabnetwork.com/201003155185/Economics/growth-
and-opportunity-in-egyptianagriculture.htm
Mulat, A. G., & Moges, S. A. (2014). Assessment of the Impact of the Grand Ethiopian
Renaissance Dam on the Performance of the High Aswan Dam. Journal of Water
Resource and Protection, 583-598.
Nasr, P., & Sewilam, H. (2015). The potential of groundwater desalination using forward
osmosis for irrigation in Egypt. Clean Technology Environmental Policy,
17:1883–1895.
Nile Basin Initiative. (2012). State of the Nile River Basin 2012. Uganda: Nile Basin
Initiative.
Nile Basin Initiative. (2015). Understanding the Nile Basin. Retrieved January 2, 2016,
from Nile Basin Initiative: http://www.nilebasin.org/index.php/about-us/the-river-
nile
Østergaard, P. A., Lund, H., & Mathiesen, B. V. (2014). Energy system impacts of
desalination in Jordan. International Journal of Sustainable Energy Planning and
Management.

102
Oxfam. (2010). The Rain Doesn’t Come on Time Anymore: Poverty, Vulnerability and
Climate Variability in Ethiopia.
Project Catalyst. (2009). Project Catalyst Brief.
Rahman, M. A. (2012). Water Security: Ethiopia–Egypt Transboundary Challenges over
the Nile River Basin. Journal of Asian and African Studies, 48(1) 35-46.
Ramadan, S. M., Negm, A. M., Smanny, M., & Helmy, A. (2013). Environmental
Impacts Of Great Ethiopian Renaissance Dam On The Egyptian Water Resources
Management And Security. The 23rd International Conference On:
Environmental Protection is a Must 11–13 May.
Reda, M. (2015, October 5). A Source at the Ministry of Irrigation: We Withdrew the 1
Million Feddans Project from the Ministry of Agriculture. Retrieved January 29,
2016, from Masr Al-Arabiya:
http://www.masralarabia.com/%D8%A7%D8%AE%D8%A8%D8%A7%D8%B1
-%D9%85%D8%B5%D8%B1/752489-
%D9%85%D8%B5%D8%A7%D8%AF%D8%B1-
%D8%B3%D8%AD%D8%A8-
%D9%85%D8%B4%D8%B1%D9%88%D8%B9-%D8%A7%D9%84%D9%80-
%D9%85%D9%84%D9%8A%D9%88%D9%86-
%D9%81%D8%AF%D8%A7%D9%86-%D9%85%D9%86-%
Reuters. (2013, June 10). Ethiopia studies on Nile dam fall short, Egypt says. Retrieved
August 5, 2015, from Reuters: http://www.trust.org/item/20130602181555-8s9fq/
Reuters. (2014, November 2014). Egypt's cement firms overcome gas shortages by
importing coal. Retrieved February 07, 2015, from
http://www.reuters.com/article/2014/11/05/egypt-cement-coal-
idUSL6N0SU2YB20141105
Rosegrant, M. W., Cai, X., & Cline, S. A. (2002). World water and food to 2025 :
Dealing with Scarcity. Washington, D.C.: International Food Policy Research
Institute.
Rubenson, S. (2009). The European impact on Christian-Muslim relations in the Middle
East during the nineteenth century. The Ethiopian example. In The Fuzzy Logic of
Encounter: New Perspectives on Cultural Contact (pp. 118-127).
Salman, S. M. (2013). The Nile basin cooperative framework agreement: A peacefully
unfolding African spring. Water International, 17–29.
Schiermeier, Q. (2008). A long dry summer. Nature 452 (7185), 270–273.

103
Shalaby, M. Y., Al-Zahrani, K. H., Baig, M. B., Straquadine, G. S., & Aldosari, F.
(2011). Threats and Challenges to Sustainable Agriculture and Rural
Development in Egypt: Implications forAgricultural Extension. The Journal of
Animal & Plant Sciences, 581-588.
Siddiqi, A., & Anadon, L. D. (2011). The water–energy nexus in Middle East and North
Africa. Energy Policy, 4529–4540.
Sovacool, B., & Sovacool, K. (2009). Identifying future electricity–water trade offs in the
United States. Energy Policy, 2763–2773.
Stillwell, A., King, C., Webber, M., Duncan, I., & Hardberger, A. (2011). The Energy-
Water Nexus in Texas. Ecology and Society, 16(1): 2.
Sulser, T. B., Ringler, C., Zhu, T., Msangi, S., Bryan, E., & Rosegrant, M. W. (2010).
Green and blue water accounting in the Ganges and Nile basins: Implications for
food and agricultural policy. Journal of Hydrology, 276-291.
Swain, A. (2002). The Nile River Basin Initiative: Too Many Cooks, Too Little Broth.
SAIS Review 22, no. 2.
Swain, A. (2011). Challenges for water sharing in the Nile basin: Changing geo-politics
and changing climate. Hydrology Science, 687-702.
Tesfaye, A. (2014). Conflict and Cooperation and the Evolution of the Nascent Nile
Basin Regime. Northeast African Studies, Volume 14, Number 1, 123-144.
The Brookings Institution. (2012). Water Challenges and Cooperative Response in the
Middle East and North Africa. Washigton.
The Economist. (2011). The River Nile, A dam nuisance Egypt and Ethiopia quarrel over
water. Retrieved September 12, 2015, from
http://www.economist.com/node/18587195
Trading Economics. (2015). Retrieved September 18, 2015, from Trading Economics:
http://www.tradingeconomics.com/
Trinex. (2015). Draft Strategy. Retrieved from Trinex: https://www.trinex.eu/
U.S. EIA. (2014). Country Analysis Brief: Egypt. U.S. Energy Information
Administration.
UN. (2013). World population prospects: The 2012 revision, key findings and advance
tables. New York: United Nations Dept. of Economic and Social Affairs,
Population Division.

104
UN. (2014, August 20). Water Scarcity. Retrieved October 20, 2014, from
http://www.un.org/waterforlifedecade/scarcity.shtml
UN. (2015). List of Least Developed Countries. Retrieved July 19, 2015, from
http://www.un.org/en/development/desa/policy/cdp/ldc/ldc_list.pdf
UN ESCAP. (2013). Water, Food and Energy Nexus in Asia and the Pacific. Bangkok:
United Nations.
UNDP. (2007). Climate Change National Adaptation Programme of Action (NAPA) of
Ethiopia. Addis Ababa: Global Environment Fund.
UNDP. (2007). Human Development Report, 2007/2008: Fighting Climate Change.
United Nations Development Programme.
UNDP. (2015). Human Development Reports. Retrieved July 19, 2015, from United
Nations Development Program: http://hdr.undp.org/en/data
UNEP. (2009). The Environmental Food Crisis. United Nations Environment
Programme.
UNESCO. (n.d.). Agricultural water withdrawals as share of total water withdrawals .
Retrieved November 3, 2014, from
http://webworld.unesco.org/water/wwap/wwdr/indicators/pdf/G5_Agriculture_wa
ter_withdrawals.pdf
UNFCCC. (2007). Climate Change: Impacts, Vulnerabilities and Adaptation in
Developing Countries. Bonn: United Nations Framework Convention on Climate
Change.
UNFCCC. (2014). Compendium on methods and tools to evaluate impacts of, and
vulnerability and adaptation to, climate change. Retrieved from UNFCCC:
http://unfccc.int/adaptation/nairobi_work_programme/knowledge_resources_and_
publications/items/5440.php
Verhoeven, H. (2011). Black gold for blue gold? Sudan’s oil, Ethiopia’s water and
regional integration. London.
Water Technology.net. (2014). Grand Ethiopian Renaissance Dam Project, Benishangul-
Gumuz, Ethiopia. Retrieved September 12, 2015, from http://www.water-
technology.net/projects/grand-ethiopian-renaissance-damafrica/
water.org. (2015). Ethiopia. Retrieved September 19, 2015, from water.org:
http://water.org/country/ethiopia/

105
WB. (2015). Indicators. Retrieved July 19, 2015, from The World Bank:
http://data.worldbank.org/indicator
WFP. (2013). The Status of Poverty and Food Security in Egypt: Analysis and Policy
Recommendations. World Food Program.
WFP. (2014). Ethiopia Comprehensive Food Security and Vulnerability Analysis
(CFSVA). Addis Ababa: World Food Programme.
WMO. (2012). Climate ExChange. World Meteorological Organization.
Wong, G. (2013). China’s War on Water Scarcity. PwC.
World Economic Forum. (2011). The Water-Food-Energy-Climate Nexus. Washington,
DC: Island Press.
World Water Council. (2006). Politics Get into Water. World Water Council.
XE. (2016). XE Currency Charts (USD/EGP). Retrieved February 14, 2015, from
http://www.xe.com/currencycharts/?from=USD&to=EGP&view=5Y
Xinhua News. (2006, July 29). China reins in fast growth of coal-to-liquid fuel projects.
Retrieved October 25, 2014, from
http://english.people.com.cn/200607/29/eng20060729_287975.html
Youm7. (2014, November 4). Sissi Launches the One Millions Feddans Project Soon.
Retrieved January 29, 2016, from Youm7:
http://www.youm7.com/story/2014/11/4/%D8%A7%D9%84%D8%B3%D9%8A
%D8%B3%D9%89-%D9%8A%D8%B7%D9%84%D9%82-
%D9%85%D8%B4%D8%B1%D9%88%D8%B9-
%D8%A7%D9%84%D9%85%D9%84%D9%8A%D9%88%D9%86-
%D9%81%D8%AF%D8%A7%D9%86-
%D9%84%D8%A7%D8%B3%D8%AA%D8%B5%D9%84%D8%A7%D8%AD
-%D8%A7%D
Zeitoun, M., Allan, T., & Mohieldeen, Y. (2010). Virtual water ‘flows’ of the Nile Basin,
1998–2004: A first approximation and implications for water security. Global
Environmental Change, 229–242.
Zeleke, G., & Hurni, H. (2001). Implication of land use and land cover dynamics for
mountain resource degradation in the northwestern Ethiopia highlands. Mountain
Research and Development, 184-191.

106
Zhang, Y., Block, P., Hammond, M., & King, A. (2015). Ethiopia’s Grand Renaissance
Dam: Implications for Downstream Riparian Countries. Journal of Water
Resources Planning and Management.