using the six sigma policy deployment cycle to mitigate
TRANSCRIPT
University of Central Florida University of Central Florida
STARS STARS
Electronic Theses and Dissertations, 2004-2019
2004
Using The Six Sigma Policy Deployment Cycle To Mitigate Project Using The Six Sigma Policy Deployment Cycle To Mitigate Project
Failur Failur
Archana Magadi University of Central Florida
Part of the Engineering Commons
Find similar works at: https://stars.library.ucf.edu/etd
University of Central Florida Libraries http://library.ucf.edu
This Masters Thesis (Open Access) is brought to you for free and open access by STARS. It has been accepted for
inclusion in Electronic Theses and Dissertations, 2004-2019 by an authorized administrator of STARS. For more
information, please contact [email protected].
STARS Citation STARS Citation Magadi, Archana, "Using The Six Sigma Policy Deployment Cycle To Mitigate Project Failur" (2004). Electronic Theses and Dissertations, 2004-2019. 210. https://stars.library.ucf.edu/etd/210

USING THE SIX SIGMA POLICY DEPLOYMENT CYCLE TO MITIGATE PROJECT FAILURES
by
ARCHANA MAGADI B.E., Visvesvaraya Technological University (VTU), Karnataka, India, 2002
A thesis submitted in partial fulfillment of the requirements for the degree of Master of Science
in the Department of Industrial Engineering and Management Systems in the College of Engineering and Computer Sciences
at the University of Central Florida Orlando, Florida
Fall Term 2004
Major Professors: Dr. Ahmad K. Elshennawy Dr. Sandra L. Furterer
ABSTRACT
Many organizations are struggling to improve customer-focused quality in today’s
highly competitive domestic and global markets. At the same time, these organizations
have failed to implement the Six Sigma methodology into their daily control and strategic
planning processes.
Six Sigma deployment failures have been categorized as coming from many
sources, both management related and person related. Some of the key management
related Six Sigma project failures have been identified and discussed in this research
work. For continuous improvement to truly take root, organizations must realize that just
successfully applying quality tools on any process will not necessarily provide dramatic
results, unless the concepts of policy management and deployment are institutionalized.
A model called “Six Sigma Policy Deployment” was developed and has been
proposed which may help mitigate Six Sigma project failures that are presently attributed
to management and organizational issues. By integrating Policy Deployment, the Six
Sigma DMAIC (Define-Measure-Analyze-Improve-Control) problem solving approach,
and the classic PDCA (Plan-Do-Check-Act) Cycle, the potential for breakthrough
improvements in any organization can be enhanced. The model was contrasted against a
list of 30 sources of failure in typical Six Sigma projects in order to validate its
applicability to mitigate these failures. Furthermore these failures were matched with the
work of recent quality theorists in order to validate their occurrence and relevance. A
case study section is presented to illustrate FPL’s Quality Improvement Program and the
ii

Six Sigma Lifecycle, which are bases for the new model. This section also highlights how
the use of the proposed Six Sigma Policy Deployment model could help to mitigate
potential Six Sigma project failures.
iii

To my parents & my husband who have taught me the value of hard work and discipline
iv
ACKNOWLEDGEMENTS
I would like to thank Dr. Elshennawy, the chair and Dr. Furterer, the co-chair of
my thesis committee for their valued time through the course of this research.
I would like to thank Dr.Thompson for agreeing to serve on my committee and
for providing me with the valuable feedback, support and guidance.
I would like to express the deepest appreciation to my committee member, Dr.
Frank Voehl, who has the attitude and the substance of a genius: he continually and
convincingly conveyed a spirit of adventure in regard to research and an excitement in
regard to mentoring. Without his guidance and persistent help this thesis would not have
been possible. I would like to deeply thank him for his time, support and guidance.
In addition, a thank you to Dr. Lesia Crumpton-Young, the Department Chair and
Dr. José A. Sepúlveda, the Department Graduate Coordinator of Industrial Engineering
and Management Systems for their encouragement and support.
I thank 1509 ASQ Orlando section and the Harrington Group for sponsoring the
community good works Six Sigma projects and allowing me to take part in their
community good works project.
I want to thank my parents, my husband Santhosh and friends Meera, Isa, Roberto
and Ana whose blessings, love, and affection helped me stay calm and focused during my
research work.
v

TABLE OF CONTENTS LIST OF FIGURES ......................................................................................................... viii LIST OF TABLES............................................................................................................. ix LIST OF ACRONYMS ...................................................................................................... x CHAPTER ONE: INTRODUCTION................................................................................. 1
1.1 INTRODUCTION ........................................................................................................ 1
1.2 RATIONALE FOR THESIS ............................................................................................ 2 CHAPTER TWO: LITERATURE REVIEW..................................................................... 6
2.1 INTRODUCTION TO SIX SIGMA................................................................................... 6
2.2 POLICY DEPLOYMENT (HOSHIN KANRI).................................................................... 7
2.3 POLICY DEPLOYMENT APPLICATION....................................................................... 12
2.4 SIX SIGMA DMAIC................................................................................................. 14
2.5 DEMING’S PDCA CYCLE ........................................................................................ 17
2.6 SIX SIGMA SUCCESSES AND FAILURES .................................................................... 19
2.7 SUMMARY ............................................................................................................... 24 CHAPTER THREE: RESEARCH METHODOLOGY ................................................... 26
3.1 INTRODUCTION ...................................................................................................... 26
3.2 ACHIEVING BREAKTHROUGH................................................................................. 27
3.3 POLICY DEPLOYMENT AND PDCA......................................................................... 28
3.4 POLICY DEPLOYMENT AND SIX SIGMA .................................................................. 29
3.5 INTEGRATION OF THE POLICY DEPLOYMENT, SIX SIGMA DMAIC AND PDCA ..... 30
3.6 EXPLANATION OF INTEGRATED SIX SIGMA POLICY DEPLOYMENT MODEL ............ 32
3.7 APPLICATION OF THE MODEL TO MITIGATE SIX SIGMA PROJECT FAILURES............. 38
3.8 SIX SIGMA POLICY DEPLOYMENT MEASUREMENTS ............................................... 43
3.9 SUMMARY .............................................................................................................. 46 CHAPTER FOUR: CASE STUDY.................................................................................. 48
4.1 INTRODUCTION ...................................................................................................... 48
4.2 FPL POLICY DEPLOYMENT CASE STUDY ................................................................ 50
4.2.1 DESCRIPTION OF POLICY DEPLOYMENT AT FPL ................................................... 52
4.2.2 PLAYING CATCHBALL THROUGH GOAL SETTING AT FPL ..................................... 53
4.2.3 FPL POLICY ALIGNMENT...................................................................................... 54
4.3 APPLICATION OF THE FPL QIP TO FEEDS AND SENIORS FIRST PROJECT................ 57
vi

4.4 INTEGRATED SIX SIGMA POLICY DEPLOYMENT-FEEDS AND SENIORS FIRST PROJECT ............................................................................................................................... 57
4.5 FEEDS AND SENIORS FIRST PROJECT OVERVIEW................................................... 58
4.6 DESCRIPTION OF THE HEAVY IMPACT AREAS ........................................................... 63
4.7 SUMMARY ............................................................................................................... 68 CHAPTER FIVE: CONCLUSIONS ................................................................................ 70
5.1 SUMMARY.............................................................................................................. 70
5.2 CONCLUSIONS........................................................................................................ 70
5.3 LIMITATIONS OF THE RESEARCH............................................................................ 71
5.4 RECOMMENDATIONS FOR FUTURE RESEARCH ....................................................... 72 REFERENCES ................................................................................................................. 74
vii
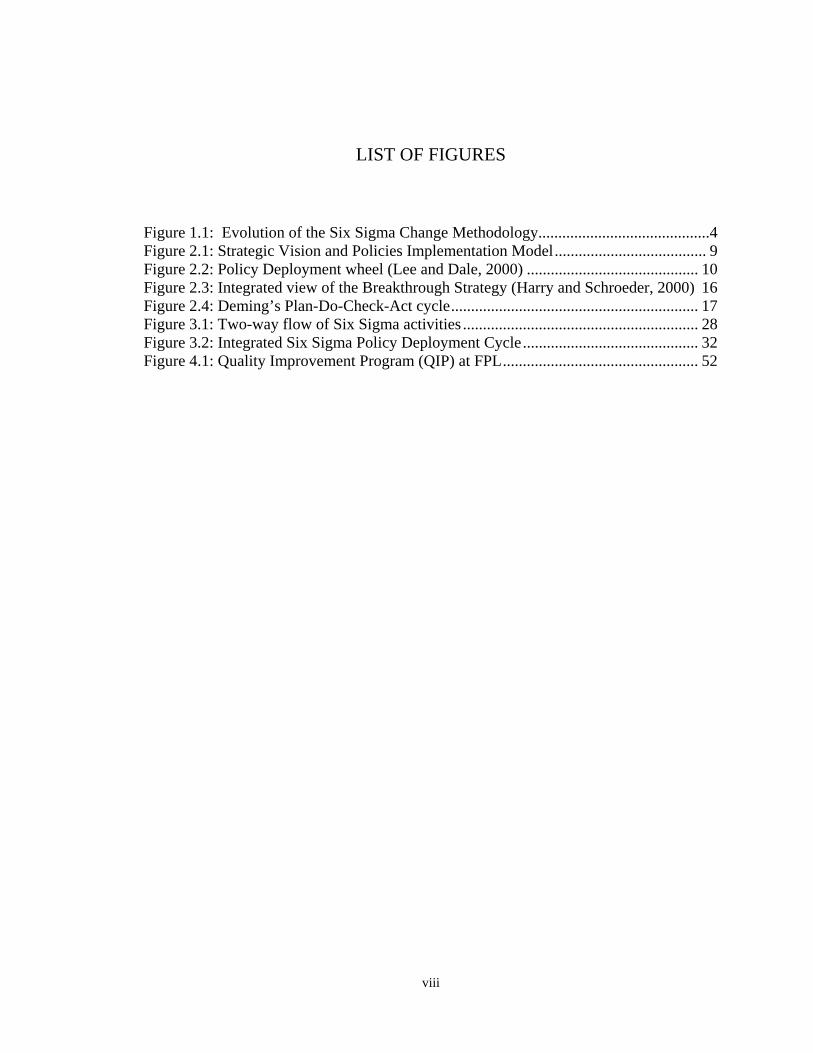
LIST OF FIGURES
Figure 1.1: Evolution of the Six Sigma Change Methodology...........................................4 Figure 2.1: Strategic Vision and Policies Implementation Model...................................... 9 Figure 2.2: Policy Deployment wheel (Lee and Dale, 2000) ........................................... 10 Figure 2.3: Integrated view of the Breakthrough Strategy (Harry and Schroeder, 2000) 16 Figure 2.4: Deming’s Plan-Do-Check-Act cycle.............................................................. 17 Figure 3.1: Two-way flow of Six Sigma activities ........................................................... 28 Figure 3.2: Integrated Six Sigma Policy Deployment Cycle............................................ 32 Figure 4.1: Quality Improvement Program (QIP) at FPL................................................. 52
viii

LIST OF TABLES
Table 2.1 List of thirty documented Six Sigma failures attributed to management ......... 24 Table 3.1: Integrated Six Sigma Policy Deployment Steps.............................................. 33 Table 3.2: Documented Failures according to the quality theorists.................................. 40 Table 3.3: Impact of Six Sigma Policy Deployment Model on Project Failures.............. 41 Table 3.4: Breakdown of Six Sigma Policy Deployment steps- relation to project failures........................................................................................................................................... 42 Table 3.5: Six Sigma Policy Deployment model against seven performance measurement categories .......................................................................................................................... 45 Table 4.1 Summary of FPL Policy Deployment steps...................................................... 56 Table 4.2: Summary of FEEDS Six Sigma Project .......................................................... 61 Table 4.3: Summary of Seniors First Six Sigma Project .................................................. 62
ix

LIST OF ACRONYMS
ASQ-American Society for Quality BB-Black Belt CTQ-Critical To Quality CTR-Cycle Time Reduction DFSS-Design for Six Sigma DMAIC-Define Measure Analyze Improve Control DMADV- Define Measure Analyze Design Validate FEEDS- Florida Engineering Education Delivery System FMEA-Failure Mode and Effect Analysis FPL-Florida Power and Light GB-Green Belt HR-Human Resources JUSE-Union of Japanese Scientists and Engineers MBB-Master Black Belt OFI- Opportunities For Improvement OSU-Oregon State University PDCA-Plan Do Check Act QIP-Quality Improvement Program TQC-Total Quality Control TQM-Total Quality Management UCF-University of Central Florida
x

CHAPTER ONE: INTRODUCTION
Today many organizations are struggling to improve customer-focused quality in
highly competitive domestic and global markets. At the same time, these organizations
have failed to implement the Six Sigma methodology into their daily control and strategic
planning processes. It has been mentioned by Harry and Schroeder (2000) that Six Sigma
initiative should be interwoven up and down the organization to gain velocity and
strength. They identify the key to institutionalizing Six Sigma in any organization as
having the right people in place at the business, operations and process levels of an
organization in order to implement and deploy the breakthrough strategy. For continuous
improvement to truly take root, organizations must realize that just successfully applying
quality tools on any process will not necessarily provide dramatic results, unless the
concepts of policy management and deployment are institutionalized.
1.1 Introduction
Many organizations have reported significant benefits as a result of implementing
Six Sigma. For example, General Electric is known as one of the most successful
companies in implementing Six Sigma projects. However, not all companies can claim
success or have had the similar benefits from Six Sigma implementation. According to
recent studies, less than 10 percent of companies are adopting a Six Sigma program to the
point where it is going to make any sort of significant difference in any meaningful
period of time (Coronado and Antony, 2002).
1

There are several reasons why a Six Sigma initiative can fail and may be categorized
as complete or partial failures of Six Sigma projects. Six Sigma deployment failures have
been categorized as coming from many sources, both management related and people
related. This work focuses on the management related issues and discusses some of the
key management related failures that have been identified in the literature.
Of the Six Sigma failures documented in the literature review attributed to
management, thirty (30) failures can be mitigated by using the newly developed model
called “Six Sigma Policy Deployment”. This new model aims at mitigating Six Sigma
project failures attributable to management issues. This model is an important
breakthrough in the field since these failures, while prevalent, should not be considered
inevitable. It is believed that while the approach and rationale of this research work is
simple, its result is powerful. By integrating Policy Deployment, the Six Sigma DMAIC
(Define-Measure-Analyze-Improve-Control) problem solving approach, and the classic
PDCA (Plan-Do-Check-Act) Cycle, the potential for breakthrough improvements in any
organization can be achieved. This thesis offers a model that may help reduce
management related Six Sigma failures.
1.2 Rationale for Thesis
Many of the Six Sigma projects ignore the need for Policy Deployment to achieve
breakthrough improvements. Many organizations have also failed to implement the Six
Sigma methodology into their daily control and strategic planning processes. The reason
for failure may be management related or person related or both. It has been observed
2

that less than 10 percent of companies are adopting a Six Sigma program to the point
where it is going to make any sort of significant difference in any meaningful period of
time (Coronado and Antony, 2002).
Thirty (30) Six Sigma failures documented in the literature related to management
have been identified and mapped to the teachings of quality theorists whose philosophies
are widely known and accepted.
The Six Sigma concept of defect elimination and variation reduction should be
incorporated into the daily processes as an organization philosophy. For continuous
improvement to truly take root, organizations must understand and realize the benefits of
applying Six Sigma tools and techniques on their processes along with two other
planning and problem solving methodologies: Policy Deployment and Deming’s PDCA
(Plan-Do-Check-Act) cycle.
The adoption of Policy Deployment entails the involvement of all employees who
will have an influence on the achievement of targets in the planning process. Policy
Deployment also known as Hoshin Kanri, are interchangeably used in the various
sections of this research work. Plan-Do-Check-Act assists in developing hypotheses and
implementing changes to continually improve the processes. Deming’s PDCA cycle has
been widely used to improve the quality standards of organizations. Hence integration of
Six Sigma DMAIC with Policy Deployment and Deming’s PDCA cycle would facilitate
breakthrough improvement within the organization. Dr. Joseph Juran, who first
introduced the idea of breakthrough improvement, explains it as the process of quality
3

improvement that leads to unprecedented levels of performance (Evans and Lindsay,
2002).
The proposed Six Sigma Policy Deployment model integrates the three problem
solving methodologies and is discussed in chapter 3. A case study is presented in chapter
4 which discusses how the use of the Six Sigma Policy Deployment model could help
mitigate the potential for Six Sigma project failures. The model proposed in this work
presents the highest stage of the evolution of the Six Sigma change methodology shown
in figure 1.1. This figure represents when each of the change methodologies were most
popularly used in the US. This will be thoroughly described in chapter 3.
1970 1980 20001990 2004
EVOLUTION
2010
Met
hodo
logi
es
Time
Deming’s PDCA Cycle
Hoshin Kanri (Policy Deployment)
Six Sigma DMAIC
New Model:Integration of Hoshin
Kanri, PDCA and Six Sigma DMAIC
Figure1.1: Evolution of the Six Sigma Change methodology
4
The model, which represents the highest level of evolution shown in figure 1.1, is
an 18-step process represented by a progressive circulatory system of improvement and
breakthrough. In the series of concentric circles in the model, the outermost circle as
shown in the figure 3.2 represents the Policy Deployment cycle. The Six Sigma DMAIC
problem solving approach with the PDCA cycle represents the daily control cycle, and is
represented by the middle two circles. The innermost PDCA cycle exists as the core
problem solving component and thus leads to continuous improvement. The proposed
model sets the stage for the catch-ball activity, thus involving various levels of
management. The Catch-ball activity within the organization refers to the back and forth
deploying of new goals and objectives to operation areas and the negotiation (catch-ball)
with current process capabilities that allow for new levels of achievement (Voehl, 2000).
The model and its 18 steps will be discussed in detail in chapter 3.
5
CHAPTER TWO: LITERATURE REVIEW
This chapter describes existing literature in the areas of Six Sigma, Deming’s
PDCA cycle and Policy Deployment (Hoshin Kanri). In the first section, an introduction
to Six Sigma is discussed. The following section discusses the Policy Deployment
planning process, its evolution, deployment model, and its applications in various
organizations. The subsequent sections discuss the key aspects of Six Sigma DMAIC
methodology and the famous Deming’s PDCA cycle. The last section discusses some of
Six Sigma success stories and also management related Six Sigma project failures. The
new model is proposed in the next chapter that could mitigate these management related
project failures.
2.1 Introduction to Six Sigma
In the 1980’s, Motorola coined the name Six Sigma. It has become one of the
most advanced quality initiatives applied in the United States. Sigma is a Greek letter that
denotes standard deviation and is a measure of variation from a specification within a
process. The definition of Six Sigma in statistical terms refers to 3.4 defects per million
opportunities. It is said that most organizations design or produce parts or products, or
provide customer’s services, at the 3 Sigma levels, which translates to 66,000 defects per
million opportunities (Antony and Banuelas, 2001). Six Sigma has become the stretch
goal for improving various products and also some service operations. In business terms,
Six Sigma is defined as: “a business improvement strategy used to improve business
6

profitability, to drive out waste, to reduce costs of poor quality and to improve the
effectiveness and efficiency of all operations so as to meet or even exceed customers'
needs and expectations” (Antony and Banuelas, 2001). Many organizations have reported
significant benefits as a result of Six Sigma project implementation. Among the
successful Six Sigma implementers are GE, Motorola, AlliedSignal, Citibank and Sony.
(Antony and Banuelas, 2001)
2.2 Policy Deployment (Hoshin Kanri)
The concept of Policy Deployment (Hoshin Kanri) first originated in Japan during
the 1960s. In Japanese, Hoshin means “methodology for strategic direction setting”.
Akao, the guru of Hoshin Kanri describes it as “Hoshin Kanri provides a step-by-step
planning, implementation, and review process for managed change. Furthermore, he
describes Hoshin Kanri as ‘The means by which both the overall control system and
TQM are deployed’ (Akao, 1991).
Hoshin Kanri, Policy Deployment, Management by Policy, and Policy Control all
are interchangeably used in today’s business environment to describe Policy Deployment.
Policy Deployment builds on some of the strengths of Management by Objectives (MBO)
a western performance management strategy, but shifts the emphasis from individual to
team oriented targets. The main thrust of the philosophy of Policy Deployment is that the
process for the achievement of objectives is discussed and agreed upon before plans are
implemented.
7
Policy Deployment involves a complete methodology with a way to develop and
deploy strategy. Planning and development are critical elements of Hoshin Kanri, which
imply that the process of developing targets, the development of means to achieve the
targets and the deployment of both are crucial to the successful adoption of Hoshin Kanri
(Costin, 1999).
Yoshio Kondo described the essential steps of Hoshin Kanri, or policy
management, in Japanese companies. Some of the essential points of Policy Deployment
are annual policy, the establishment of quality policy, converting methodological policy
into objective policy (which is composed of aims, targets and priority strategies) and the
top-down and bottom-up deployment. This leads to the Catch-ball effect, which is widely
used during the deployment stage. Catch-ball within the organization involves the back
and forth deploying of new goals and objectives to operating areas and negotiating
(catchball) with current process capabilities to allow for new levels of achievement.
(Voehl, 2000). Quality improvements affected by creative methods results in lower cost
and higher productivity. (Kondo, 1998)
Policy Deployment is labeled as Hoshin planning at Hewlett-Packard and Procter
& Gamble, managing for results at Xerox Corporation and at Unilever it’s “management
into action” (Witcher, 2003). Alignment is necessary to bring plans (and other associated
activities, notably budgets) into line, so that corporate strategy and unit objectives are
consistent and agreed upon. Strategic objectives must be integrated into daily operations
in a way that ensures that the teams and individuals are able to manage their work.
(Witcher, 2003)
8

Tennant and Roberts have explained that planning and deployment, which are
often cited as a reason for failure, are critical elements of Hoshi Kanri. According to
them, planning and development would imply that the process of developing targets, the
assessment of the means to achieve the targets, and the deployment of both are
fundamental to successful implementation. Once the strategic vision and main policies
have been identified, a model for implementation must be determined. This model can be
deployed as a technique for managing the business as shown in figure 2.1 below.
P la n A u d it
E x e c u te
5 y e a r V is io n
D e p lo y T o D e p a rtm e n ts
P re s id e n t's A n n u a lD ia g n o s is
1 y e a r P la n
D e ta ile d Im p le m e ta tio n
M o n th ly D ia g n o s is
Figure 2.1: Strategic Vision and Policies Implementation Model
Tennant and Roberts have not mentioned linking Policy Deployment with the Six Sigma
problem solving methodology in their work.
Policy Deployment applies the Plan-Do Check-Act (PDCA) cycle to strategic
planning and business operations and requires effective management leadership,
communication, control and checking skills. Akao’s (1991) Hoshin model shows the
9
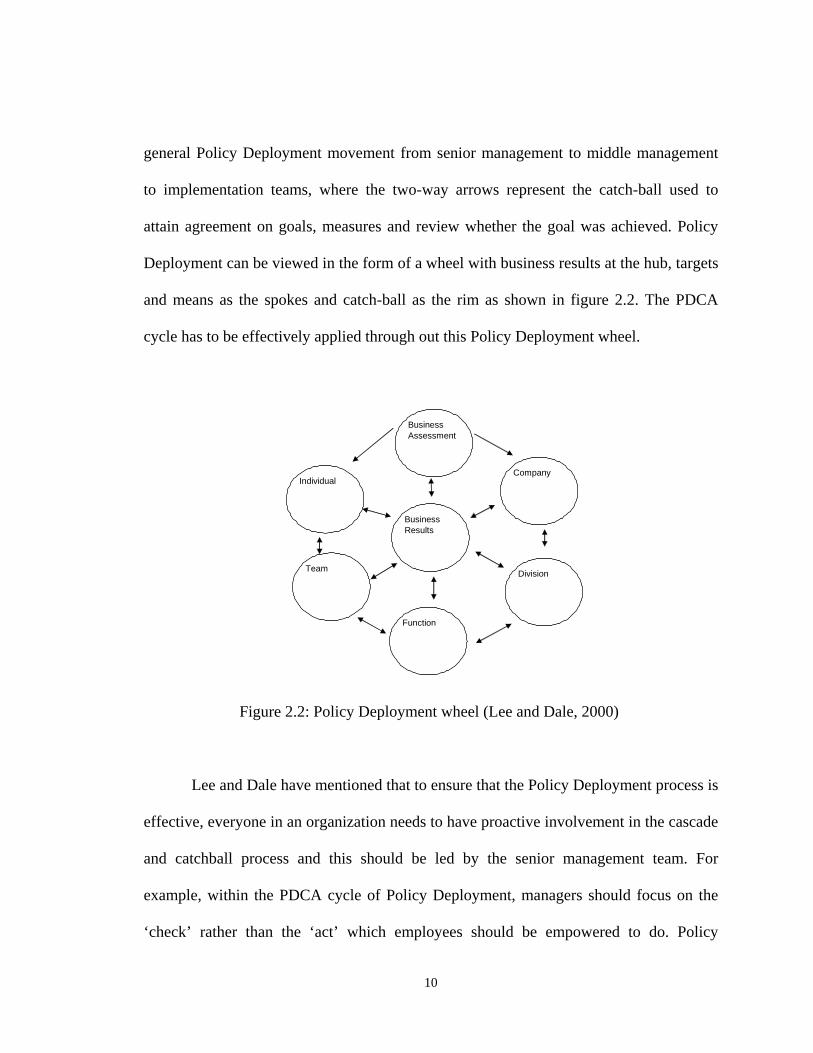
general Policy Deployment movement from senior management to middle management
to implementation teams, where the two-way arrows represent the catch-ball used to
attain agreement on goals, measures and review whether the goal was achieved. Policy
Deployment can be viewed in the form of a wheel with business results at the hub, targets
and means as the spokes and catch-ball as the rim as shown in figure 2.2. The PDCA
cycle has to be effectively applied through out this Policy Deployment wheel.
Business Results
Team Division
Company
Business Assessment
Individual
Function
Figure 2.2: Policy Deployment wheel (Lee and Dale, 2000)
Lee and Dale have mentioned that to ensure that the Policy Deployment process is
effective, everyone in an organization needs to have proactive involvement in the cascade
and catchball process and this should be led by the senior management team. For
example, within the PDCA cycle of Policy Deployment, managers should focus on the
‘check’ rather than the ‘act’ which employees should be empowered to do. Policy
10

Deployment is simply PDCA applied to the planning and execution of a few critical
strategic organizational objectives. (Lee and Dale, 2000)
The missing part in Lee and Dale’s work is the linking of Six Sigma DMAIC to
Policy Deployment at the strategic level and PDCA at the daily control of activities. This
became the basis of this research work and the development of the Six Sigma Policy
Deployment model.
DeFeo and Janssen talked about Six Sigma and Strategic deployment. Lack of a
structured approach for integrating programs into one plan is the major cause of strategic
planning process deficiencies. Six Sigma has been used to remain competitive not only in
the design and production of products, but also in the functions and customer services
that will become more efficient and productive while improving quality and profitability.
Including initiatives such as Six Sigma in the strategic plan guarantees the proper
management support and resources necessary to achieve its financial results. The
following important points are part of strategic deployment (DeFeo and Janssen, 2001):
•
•
•
•
Strategic deployment focuses resources on activities that are essential to achieving the
organization’s business plans resulting in an increase of customer satisfaction
Creates a planning and implementation system that is responsive, flexible and
disciplined.
Eliminates the existence of potentially conflicting plans in finance, marketing,
technology and operations
It focuses the resources required for financial plans to be achieved
11

Even though DeFeo and Janssen talked about bringing strategic deployment and Six
Sigma together, their work did not provide a specific framework or model on the subject.
2.3 Policy Deployment Application
Among the successful implementers of Policy Deployment are FPL and OSU.
During the 1970s, Florida Power and Light (FPL) were forced to increase utility rates
repeatedly because of increasing costs, slower sales growth, and stricter federal and state
regulations. Marshall McDonald, then chairman of the board, realized that the company
had been concentrating on keeping defects under control rather than on improving quality
as seen through the eyes of the customer. In 1983, while in Japan, McDonald met the
president of Kansai Electric Power Company, a Deming prizewinner, and learned about
their Total Quality efforts. FPL began its quality improvement program (QIP) in 1983
and in 1987, Policy Deployment and PDCA became the driving force behind the QIP.
Due to the influence of the QIP, the average length of service interruptions dropped, the
numbers of customer complaints were drastically reduced, safety had improved, and also
the price of electricity stabilized. In 1989, FPL won the Deming Prize. (Evans and
Lindsay, 2002). The case study section discusses the Quality Improvement Program
(QIP) of FPL in detail.
Oregon State University (OSU) was the first educational institution to start
implementation activities on core functions of process management during the 1990s.
Implementation of Total Quality Management at OSU was based on an extensive review
12

of approaches like Policy Deployment and PDCA. Some of the steps followed in
implementing process management included:
• Identification of the core processes, which includes goal identification,
process analysis, and problem analysis.
• Searching for solutions, implementation and evaluation.
Their model was associated with the Policy Deployment model used by Hewlett-Packard,
Ford Motor Company, and others. Using this model their processes improved, employees
learned team building and problem solving skills. Job satisfaction and employee morale
increased. Customers were often delighted by the improvements. Among many American
higher educational institutions, OSU has become a benchmark for Policy Deployment
planning of goal setting. Later other educational institutions like Delaware County
Community College also applied the Policy Deployment methodology in their institution
for the planning process. (Lewis and Smith, 1994)
So far it has been seen that the aim of Policy Deployment is to have the
employees of the organization focus on achieving the company’s goals. Some of the
literature discussed linking Policy Deployment and PDCA. The approach of this research
work is to extend the usefulness of Policy Deployment by deploying policies and plans to
achieve organizational goals and then bonding them together with Six Sigma projects
using DMAIC problem solving approach along with PDCA in daily work activities.
13

2.4 Six Sigma DMAIC
The most commonly used Six Sigma approach for accomplishing the goal of
increased customer satisfaction through improving the processes is DMAIC. DMAIC
stands for Define –Measure - Analyze –Improve – Control.
The Six Sigma DMAIC process is defined as (Hammer and Goding, 2001):
• Define: Defining the problem (in terms of customer critical demands).
Organizations first need to identify the various states of their business before they can
be measured.
• Measure: Quantifying the problems by gaining information.
For example: The three important things to know during this phase is to know what to
measure, how to measure and gaining executive commitment to go after the right
measure. (Harry and Schroeder, 2000)
• Analyze: Performing root cause analysis using statistical tools.
After gathering information in the measure phase, it is the time to analyze the
capability of the processes and performance gaps using statistical tools.
• Improve: Identifying the actions and implementing the selected actions.
After the gap analysis, actions for improvement are taken and are implemented.
Results are checked to verify and validate the improvements.
• Control: Controlling the process to ensure the improvements are maintained.
Standards are established and consistently met. “Bringing about improvement is
one thing; sustaining it is often more difficult and requires greater diligence”.
(Harry and Schroeder, 2000)
14

Six Sigma methodology has been extensively applied in manufacturing industries. It
has also been adopted by service industries to improve customer satisfaction and achieve
breakthrough improvements. Six Sigma focuses on the needs of the market, assists in
achieving higher levels of performance, develops measures of achievement, helps
organizations become competitive, assists in developing team approaches and improves
critical thinking abilities/skills.
Harry and Schroeder have discussed that Six Sigma projects should focus on
resolving operational issues, since these issues directly impact the profitability. They
have explained the operations perspective of the breakthrough strategy in 8 steps which
includes the DMAIC steps as follows (Harry and Schroeder, 2000):
• Recognize operational issues that link to key business systems
• Define Six Sigma projects to resolve operational issues
• Measure performance of the Six Sigma projects
• Analyze project performance in relation to operational goals
• Improve Six Sigma project management system
• Control inputs to project management system
• Standardize best-in-class management system practices
• Integrate standardized Six Sigma practices into policies and procedures
15

THE SIX SIGMA ROAD MAP
STAGE BREAKTHROUGH STRATEGY PHASE
OBJECTIVEBREAKTHROUGH
STRATEGY
Identification
Characterization
Optimization
Institutionalization
RecognizeDefine
MeasureAnalyze ImproveControl
StandardizeIntegrate
Understand current performance levels
Achieve breakthrough improvement
Transfer day-to-day business conducted
Identify key business issues
Figure 2.3: Integrated view of the Breakthrough Strategy (Harry and Schroeder, 2000)
Harry and Schroeder discuss the integrated view of the breakthrough strategy as
shown in the figure 2.3. The figure represents the eight primary components of the
breakthrough strategy, which fall into four major categories. The “Recognize and Define”
phases fall under the category of identification, where companies begin to understand the
fundamental concept of Six Sigma problem solving methodology. In the “Define” phase
specific projects are identified based on process and product benchmarking. The
“Measure and Analyze” phase falls under the category of characterization, where critical
to quality (CTQ) characteristics in the process are measured and described. The “Improve
and Control” phase falls under optimization, which maximizes and maintains the
enhanced process capability. Finally, the “Standardize and Integrate” phase is part of
institutionalization. The purpose of institutionalization is to make sure that the
breakthrough strategies are woven into the organization’s culture. (Harry and Schroeder,
2000)
16

Though the concept of breakthrough strategy was explained in 8 steps, the authors
failed to provide a detailed model to achieve these strategies. The model proposed in this
thesis gives a breakdown of each step involved in breakthrough strategy in a simple way
and is easy to understand. Also, in their work, there was no mention of using Policy
Deployment (Hoshin Kanri) at the executive level, and the famous Deming’s PDCA
cycle at the daily work control level
2.5 Deming’s PDCA Cycle
P D
CA
Deming’s Cycle
Figure 2.4: Deming’s Plan-Do-Check-Act cycle
No one ever gets far into any introduction to quality management without learning
about Plan-Do-Check-Act, the never ending cycle of experimentation that provides the
underlying structures for all quality improvement efforts. Deming called it the Shewhart
cycle (Plan-Do-Study-Act) when he introduced it to the Japanese in 1950, in honor of his
mentor Walter Shewhart of Bell Labs. Eventually, it became known as the Deming
17

wheel, which is composed of four stages: Plan, do, check, and act (PDCA) as shown in
figure 2.4. The focus of the Deming wheel is on implementation and learning. The plan
stage consists of studying the current situation and describing the process. In the do stage,
the plan is implemented on a trial basis. The check stage determines whether the trial plan
is working correctly by evaluating the results, recording the learning and determining
whether any further issues or opportunities need to be addressed. In the last stage act, the
improvements become standardized and the final plan is implemented. The Deming
wheel is based on the premise that improvement comes from the application of
knowledge (knowledge of engineering, management, or how a process operates, which
can make a job easier, more accurate, faster, less costly, safer or better able to meet
customer needs)(Deming, 1986,1994).
Later in the 1990s, Akao used the PDCA cycle as the most important point of
control in Policy Deployment. So when companies like Florida Power and Light (FPL)
and universities like Oregon State University (OSU) started adopting Policy Deployment
as their strategy planning methodology, the PDCA cycle was also used as part of daily
control. It will be discussed in more detail in the coming chapter.
Even though there was some evidence of using Policy Deployment and PDCA
together, there was no literature found which discussed integrating the three problem
solving methodologies: Six Sigma DMAIC, PDCA and Policy Deployment. Hence the
focus of this work is to bring these three methodologies together in a model.
18
2.6 Six Sigma Successes and Failures
During the 1980s, GE had sought improvement in business-performance and
profitability through various programs. These programs resulted in a reduction in GE's
total work force from 400,000 to 300,000 and an increase in net profit from US $3 billion
to US $4 billion annually. And, at this time, GE had an operating margin of just under 10
percent. However, in 1995, Welch decided that those programs were not enough and
directed the company to undertake Six Sigma as a corporate initiative. GE invested
US$380 million in Six Sigma, mostly for training. The GE concept of Six Sigma deals
with measuring and improving how close the company came in delivering on what it
planned to do. It has been noted that when Six Sigma was first launched at GE Aircraft
Engines, a four-step methodology (MAIC) was followed. Later the Define phase was
added to recognize the importance of having a well-scoped project. Chairman Welch’s
goal was for the corporation to be operating at Six Sigma levels by the year 2000.
However, there was payback in the same year and GE received about US $700 million in
documented benefits from increased productivity. (Henderson and Evans, 2000)
Ford Motor Co.’s initial Six Sigma projects revisited lessons the company learned
in the 1980's, notably the importance of working closely with suppliers on design and
manufacturing and the need to avoid even slight variations in a design or production
process. Ford's hope was that Six Sigma would create a uniform approach to solving
quality problems that could be replicated. In 1981, Ford recruited Deming to help jump-
start their movement towards quality. Deming believed if a company worked
systematically at improving processes, profits would follow. He also preached the need to
19

anticipate what customers wanted. The vast majority of Ford projects concentrated on
''how to reduce things gone wrong”. (Gabor, 2001). Advocates of Six Sigma at Ford had
argued that the disciplined nature of Six Sigma would ensure its long-term success
(Gabor, 2001).
Contrary to popular belief, Six Sigma implementation is not restricted purely to
manufacturing organizations. In the case of Citibank, a service providing company, the
Six Sigma methodology was applied to identify and eliminate the defects in operations
and to reduce cycle times. Citibank hired Motorola University Consulting and Training
Services in 1997 to teach Six Sigma defect reduction and Cycle Time Reduction (CTR)
to its employees. Citibank was aiming to reduce defects and cycle time to one tenth of the
previous cycle time by the end of 1997. Every two years after that, it wanted defects and
cycle time reduced by the same amount. Citibank established its Cross-Functional
Performance Challenge by using Six Sigma methodology. One problem identified using
Six Sigma occurred within Citibank's Private Bank. A complicated system of manual
funds transfers resulted in many customer complaints, especially regarding the time it
took to complete the process. Once again the obstacles to customer satisfaction were
identified, the staff was able to correct them with the Six Sigma program. The cycle times
of all steps were improved, from order placing to product delivery, including opening
new accounts. Citibank is absolutely convinced of the success of the initiatives
introduced using techniques learned from Motorola (Rucker, 2000).
In another organization, Six Sigma was deployed in a Human Resources (HR)
central function that provides service to 1400 employees in four business divisions. HR is
20
an integral element of the main corporate business improvement strategy. The HR team
deployed Six Sigma to drive the improvement of HR processes. Their goal was to
achieve the strategic objective of “Right people in the right place at the right time at the
right cost” (Wyper and Harrison, 2000). The primary team objectives were to develop
and implement HR processes and measures of performance with embedded continuous
improvement. These processes were owned by HR process participants that would deliver
defined strategy, with the focus on complete internal customer satisfaction. The
secondary objectives were to increase job security and survival of HR central within the
company, increase employability of HR staff, promote Six Sigma and promote the
success of empowered, high-performance teams. They adopted the DMAIC model with
fact-based decision-making as the process improvement methodology. Some of the
benefits that were achieved by having applied Six Sigma were reduced costs of the HR
function per employee by 34% in 18 months, with the same or better service provided,
and an overhead cost reduction of $250,000 was achieved. Overall outcomes of
improvement activities were better, faster and more cost-effective HR services to the
business. (Wyper and Harrison, 2000)
All of the above discussed Six Sigma projects were successful. Even though these
projects were successful they had their share of failures too. Based on the literature
review, there is no evidence that they used Policy Deployment or PDCA along with Six
Sigma DMAIC.
Instead of targeting the Six Sigma projects for process and product improvements
that have a direct impact on both financial and operations goals, organizations only use
21

DMAIC on a project basis. Even if the first efforts focus on fairly narrow problems, their
impact on the whole business should be clear. It needs to be explicit how projects and
other activities link to customers, core processes and competitiveness. After
implementation of Six Sigma projects, the results must be published. However, these
results should not be restricted to success stories but also share lessons learned and
communicate setbacks. Thus, it will help other projects to avoid the same mistakes and
learn from failures. (Coronado and Antony, 2002)
Carnell’s research work listed some of the Six Sigma project failures. He
categorizes these failures as:
•
•
Management and Company Failures
Master Black Belt (MBB), Black Belt (BB) Failures
He has listed thirty-three Six Sigma failures related to “Management and Company”
which includes a few duplicates and redundancies. Many of these failures have also been
addressed by the quality theorists in one form or the other. Some of these common
failures were short listed and can be summarized as: no vision related to customer
expectations, lack of alignment (horizontal or vertical), no visible leadership at the
executive level, business executives not showing up for report-outs (conveys a lack of
priority), deploying Six Sigma without a goal (reason for deployment), deploying Six
Sigma with a goal but no plan on how to reach the goal. These Six Sigma failures are
addressed using the Six Sigma Policy Deployment model in the next chapter (Carnell,
2004).
22
DeFeo states that before implementing a Six Sigma process, management must
have a basic strategy in place that establishes three things:
• A vision of where the company is going, clearly stated and communicated to
every employee at all levels in language they will understand
• Clear definitions of a small number of key objectives that must be achieved if
the company is to realize its vision, and
• Communication of these objectives throughout the entire organization so that
each person knows how his or her performance helps achieve those objectives;
this alignment is critical.
Some critical success factors of Six Sigma are that it must start at the top, Six
Sigma's targets must be defined and knowing how to deploy versus delegating quality
management activities are important. (DeFeo, 1999)
Some of the management failures are caused due to the lack of concept of
customer expectations, no follow up on the annual operating plan, lack of alignment of
the improvement projects with the business objectives, no visible leadership at the
executive level to deploy the goals and no plan to achieve the goals to list a few. See
table 2.1, for a listing of thirty common failure factors attributed to management. These
failures have been addressed by using the Six Sigma Policy Deployment model in the
next chapter.
23

Table 2.1 List of thirty documented Six Sigma failures attributed to management
3 0 D o c u m e n t e d S i x S i g m a f a i l u r e s r e l a t e d t o m a n a g e m e n t a n d c o m p a n y
1N o c o n c e p t o f c u s t o m e r e x p e c t a t io n s
2N o v is io n r e la t e d t o c u s t o m e r e x p e c t a t io n s
3 N o f o l lo w - u p o n t h e a n n u a l o p e r a t in g p la n4 L a c k o f a l ig n m e n t ( h o r iz o n t a l o r v e r t ic a l )5 N o v is ib le le a d e r s h ip a t t h e e x e c u t iv e le v e l6 B u s in e s s e x e c u t iv e s d o n o t s h o w u p f o r r e p o r t - o u t s ( c o n v e y s a la c k o f
p r io r i t y )7 D e p lo y in g S ix S ig m a w i t h o u t a g o a l ( r e a s o n f o r d e p lo y m e n t )8 D e p lo y in g S ix S ig m a w i t h a g o a l b u t n o p la n o n h o w t o g e t t h e r e9 A b d ic a t in g t h e d e p lo y m e n t p la n t o a c o n s u l t in g c o m p a n y
1 0T r y in g t o c h a n g e t h e o r g a n iz a t io n w i t h o u t a d e t a i le d c h a n g e p r o c e s s
1 1N o t h a v in g m e t r ic s in p la c e f o r m a n a g e m e n t p a r t ic ip a t io n
1 2 A b s e n c e o f a f o r m a l c h a n g e p r o c e s s1 3 C h a m p io n s d o n o t s h o w u p f o r r e p o r t - o u t s1 4 H a v in g m e t r ic s in p la c e b u t n o f e e d b a c k ( o r l im i t e d f e e d b a c k
a n n u a l ly , s e m i- a n n u a l ly , q u a t e r ly )1 5 N o t h a v in g m u l t ip le p r o je c t s q u e u e d u p f o r e a c h M B B , B B o r G B ( s o w h e n
t h e y c o m p le t e a p r o je c t t h e n e x t o n e h a s a l r e a d y b e e n s e le c t e d )1 6
N o t c o m m u n ic a t in g d e p lo y m e n t p la n s e f f e c t iv e ly t h r o u g h t h e o r g a n iz a t io n1 7
N o r e w a r d s o r r e c o g n i t io n p r o g r a m1 8
L a c k o f a d e t a i le d c u l t u r a l c h a n g e m a n a g e m e n t p r o g r a m1 9 N o r e t e n t io n p r o g r a m f o r t r a in e d p e r s o n n e l2 0 T r y in g t o u s e c o n t r a c t t y p e a g r e e m e n t s t o r e t a in M B B s a n d B B s2 1 P r o je c t s e le c t io n p r o c e s s d o e s n o t id e n t i f y p r o je c t s r e la t e d t o b u s in e s s
o b je c t iv e s2 2 M id d le m a n a g e m e n t o p e r a t e s o n t h e i r o w n a g e n d a ( f e e l s u p p o r t is
o p t io n a l )2 3 N o a c c o u n t a b i l i t y2 4 C h a m p io n s d o n o t b r e a k r o a d b lo c k s2 5 N o b u y - in a t t h e p r o c e s s O w n e r le v e l2 6 L a c k o f in t e r a c t io n w i t h o r g a n iz a t io n a l s y s t e m s a n d t e c h n o lo g y2 7 S u p p ly b a s e s u p p ly in g p o o r q u a l i t y m a t e r ia l2 8 N o c o n s e q u e n c e f o r s u p p l ie r s s e n d in g b a d m a t e r ia l ( t y p ic a l ly b e c a u s e o f
p r ic e )2 9 N o p la n t o d e p lo y in t o t h e D e s ig n a n d M a r k e t in g f u n c t io n s a f t e r
O p e r a t io n s h a s la u n c e d3 0
B e l ie v in g a s in g le in i t ia t iv e c a n / w i l l s o lv e a l l y o u r p r o b le m s
2.7 Summary
The literature review shows that the existing work does not provide a framework
for implementing Six Sigma DMAIC along with Policy Deployment and the PDCA cycle
24

even though all three methodologies focus on gaining dramatic improvements in the
quality of products and services. The integration of the Six Sigma DMAIC methodology
with Policy Deployment would facilitate breakthrough improvement in organizations.
The adoption of Policy Deployment entails the involvement of all those people who
would have an influence on the achievement of targets in the planning process.
The approach of this thesis is to provide an integrated framework which includes
Policy Deployment for deploying policies and plans to achieve organizational goals with
Six Sigma DMAIC projects and quality in daily work activities through the PDCA cycle.
This model is represented in the form of an 18-step circulatory system explained in the
following chapter.
25

CHAPTER THREE: RESEARCH METHODOLOGY
The objective of this work is to develop a model that can be successfully used to
help mitigate Six Sigma project failures in any organization. The purpose is to achieve
breakthrough improvement by combining Policy Deployment, the Six Sigma DMAIC
methodology, and the PDCA cycle. This chapter discusses the model that integrates
Policy Deployment, the Six Sigma DMAIC problem solving approach, and the PDCA
cycle to help create breakthrough improvement that can be implemented in
manufacturing and service industries. Also, a summary is presented at the end of this
chapter where the thirty most common Six Sigma management failures are validated
against the teachings of quality experts whose teachings are widely known and accepted.
3.1 Introduction
During the 1960s, the Japanese first came up with the concept of Hoshin Kanri
(Policy Deployment). In Japanese, Hoshin means “methodology for strategic direction
setting”. Akao, the guru of Hoshin Kanri described it as “The means by which both the
overall control system and TQM are deployed” (Akao, 1991). The adoption of Policy
Deployment entails the involvement of all those people who will have an influence on the
achievement of targets in the planning process.
Deming’s cycle, also referred to as the Shewhart cycle (Plan-Do-Study-Act) was
introduced in Japan during 1950. Later in the 1980s, the PDCA cycle became the most
important point of control in Policy Deployment. So when companies like FPL and OSU
26

started adopting Policy Deployment as the strategy planning methodology, the PDCA
cycle was also used as part of daily control.
In the 1980s, Motorola coined the name Six Sigma. Since then it has become one
of the most advanced quality initiatives applied in the United States.
The model presents the highest stage of the evolution of the Six Sigma change
methodology (as shown in figure 1.1). This model is designed to bring Policy
Deployment, PDCA and Six Sigma DMAIC together in a new and powerful way that
helps mitigate Six Sigma project failure. For continuous improvement to truly take root,
organizations must understand and realize that applying Six Sigma tools and techniques
on any process will not necessarily result in dramatic results, unless the concepts of
Policy Deployment are institutionalized. Integration of Six Sigma, PDCA, and Policy
Deployment would facilitate the breakthrough improvement that companies try to
achieve.
3.2 Achieving Breakthrough
Policy Deployment typically operates on two levels: management of continuous
improvement-breakthrough and daily management control. It is argued that to be
successful, the third level of application is in the Six Sigma DMAIC problem solving
strategy (as shown in the Figure 3.1). Both Policy Deployment and Six Sigma focus on
dramatic improvements or opportunities in the quality of products and services. The
missing ingredient in many situations is the ability to correctly understand the customers’
27

needs and wants and to listen to the voice of the customer, which is one of the major
strengths of Six Sigma.
Policy Deployment focuses on the targets while Six Sigma should focus on both
the processes and the targets (as shown in Figure 3.1). Policy Deployment provides a
structure for linking the core objectives into the current competitive situation, which
results in breakthrough improvement (DeFeo and Janssen, 2001). The Six Sigma DMAIC
methodology maximizes individual and departmental performance every day by focusing
on daily control using PDCA, and on the key breakthrough areas that enable superior
performance.
-Target-Vision-Objectives
-Processes-Target
Figure 3.1: Two-way flow of Six Sigma activities
3.3 Policy Deployment and PDCA
Many organizations have been using Deming’s Plan-Do-Check-Act (PDCA) to
improve the quality standards. PDCA assists in developing hypotheses, implementing
28

changes, and helps to continually improve the processes. A plan is made which is based
on the policy of the organization (Plan). Accordingly, actions are taken by focusing on
the processes, which are being done (Do). Results are checked (Check), and the plan is
implemented, standardized and acted upon (ACT).
In Policy Deployment, the PDCA cycle helps in the deployment of policies and it
is a most important item of control. Using the PDCA cycle in Policy Deployment, helps
the organization in strategic planning and business process management, and leads to
effective management leadership, communication, and control/checking skills (Greenall,
1997).
Policy Deployment draws information from the on-going data collection and
analysis activities of the process to identify broad system problems in which
breakthrough is needed. PDCA then becomes part of the system of the Policy
Deployment planning cycle (as shown in Figure 3.1).
3.4 Policy Deployment and Six Sigma
Six Sigma is a data-driven approach that provides a proactive approach to
eliminate and prevent problems. Yet, it cannot be treated as a stand-alone tool. This is the
most important point that organizations must be careful about: They must link Six Sigma
DMAIC projects with the policies and management systems. Policy Deployment requires
five basic tasks as far as Six Sigma is concerned (Voehl, 2000):
• Understanding the Customer: involves the logistical focus of strategic planning,
analyzing customer needs, competitor’s position, and environmental forces.
29

• Goal setting: reviewing past performances on objectives, critical success factors
and targets, while changing work processes to close the gaps between targets and
desired performance.
• Catch-ball within the organization: involves the back and forth deploying of new
goals and objectives to operating areas and negotiating (catchball) with current
process capabilities to allow for new levels of achievement.
• Monthly and daily management activities: in order to measure and track how
much of the year’s objectives are being accomplished.
• Checking, inspecting and problem-solving: the analysis and solutions involved in
both daily and monthly management.
3.5 Integration of the Policy Deployment, Six Sigma DMAIC and PDCA
Six Sigma DMAIC can be effectively used along with Policy Deployment to
operationalize the concept of breakthrough. To create a breakthrough and mitigate the Six
Sigma project failures, this work proposes a unique model which integrates Policy
Deployment (based on Akao’s mutual movement of daily control and improvement
activity) with the Six Sigma DMAIC problem-solving approach, along with the PDCA
cycle.
In the model shown in Figure 3.2, the innermost PDCA cycle exists as the core
problem solving steps. The Six Sigma DMAIC problem solving approach along with the
PDCA cycle become the daily control cycle, represented by the middle two circles in the
figure. The outer circle represents the Policy Deployment cycle. The top level
30

management policies and strategies are shown in the outer circle of Policy Deployment,
these include steps one through eleven, to be performed by the Master Black Belts
(MBBs), the Black Belts (BBs), Champions and other members of the top management
team. Once this team finishes with step nine, the Six Sigma project team, mostly the
Green Belts (GBs), would embark on the Six Sigma DMAIC, steps twelve through
eighteen. After step seventeen is complete, the project team would then start the Check-
Act-Plan-Do (CAP-Do, the PDCA cycle started at check phase) cycle to implement the
changes and continually improve the process. The innermost cycle, which is the CAP-Do
cycle, is repeated within each of the DMAIC phases. PDCA (CAP-Do cycle) is often
referred as “Wheel within a Wheel”, as these steps are continuously repeated, thus
leading to the daily control.
31

Figure 3.2: Integrated Six Sigma Policy Deployment Cycle
3.6 Explanation of Integrated Six Sigma Policy Deployment Model
This proposed model is an 18-step process of a progressive circulatory system of
improvement and breakthrough based upon an integrated Six Sigma Policy Deployment
cycle, as shown in figure 3.2.
Table 3.1 presents a summary of the integrated Six Sigma Policy Deployment
steps that can be taken for improving many processes. The Integrated Six Sigma Policy
32
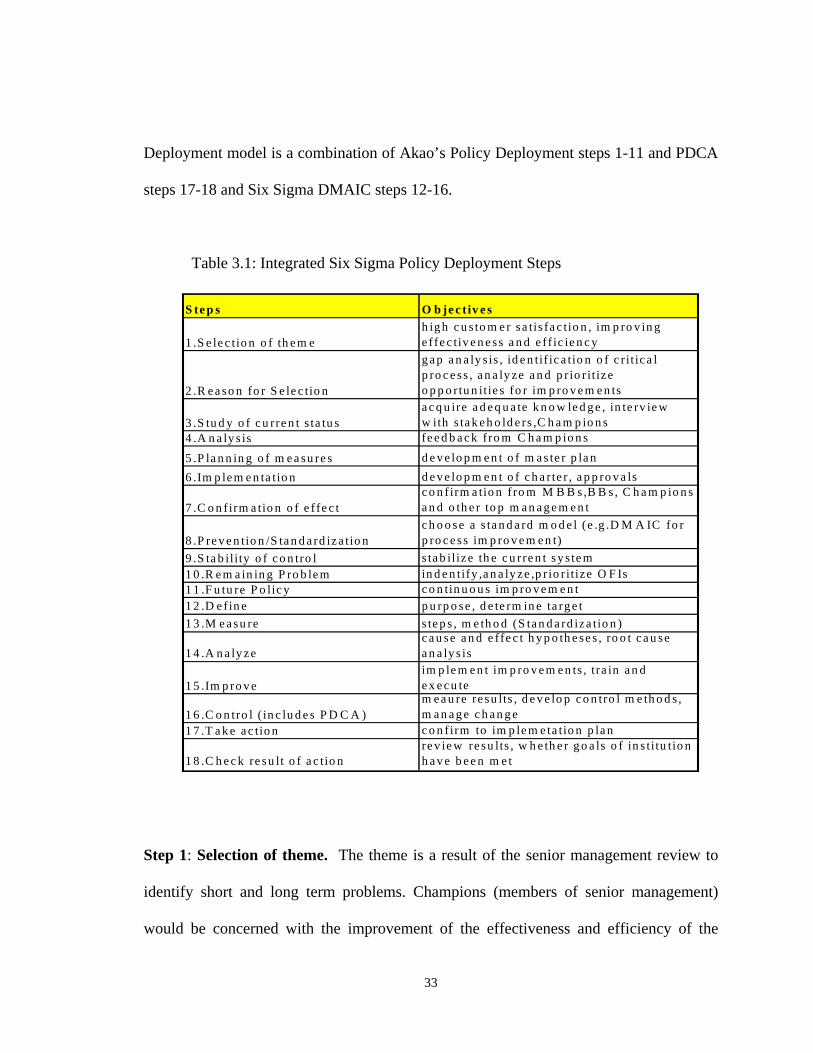
Deployment model is a combination of Akao’s Policy Deployment steps 1-11 and PDCA
steps 17-18 and Six Sigma DMAIC steps 12-16.
Table 3.1: Integrated Six Sigma Policy Deployment Steps
S te p s O b je c t iv e s
1 .S e le c t io n o f th e m eh ig h c u s to m e r sa tis fa c tio n , im p ro v in g e f fe c tiv e n e ss a n d e f f ic ie n c y
2 .R e a so n fo r S e le c tio n
g a p a n a ly s is , id e n tif ic a tio n o f c r it ic a l p ro c e s s , a n a ly ze a n d p r io r it iz e o p p o r tu n itie s fo r im p ro v e m e n ts
3 .S tu d y o f c u rre n t s ta tu sa c q u ire a d e q u a te k n o w le d g e , in te rv ie w w ith s ta k e h o ld e rs ,C h a m p io n s
4 .A n a ly s is fe e d b a c k f ro m C h a m p io n s
5 .P la n n in g o f m e a su re s d e v e lo p m e n t o f m a s te r p la n 6 .Im p le m e n ta tio n d e v e lo p m e n t o f c h a r te r , a p p ro v a ls
7 .C o n f irm a tio n o f e f fe c tc o n f irm a tio n f ro m M B B s ,B B s , C h a m p io n s a n d o th e r to p m a n a g e m e n t
8 .P re v e n tio n /S ta n d a rd iz a tio nc h o o se a s ta n d a rd m o d e l (e .g .D M A IC fo r p ro c e s s im p ro v e m e n t)
9 .S ta b ili ty o f c o n tro l s ta b ilize th e c u rre n t sy s te m1 0 .R e m a in in g P ro b le m in d e n tify ,a n a ly ze ,p r io r it ize O F Is1 1 .F u tu re P o lic y c o n tin u o u s im p ro v e m e n t1 2 .D e f in e p u rp o se , d e te rm in e ta rg e t1 3 .M e a su re s te p s , m e th o d (S ta n d a rd iza tio n )
1 4 .A n a ly z ec a u se a n d e f fe c t h y p o th e se s , ro o t c a u se a n a ly s is
1 5 .Im p ro v eim p le m e n t im p ro v e m e n ts , tra in a n d e x e c u te
1 6 .C o n tro l ( in c lu d e s P D C A )m e a u re re su lts , d e v e lo p c o n tro l m e th o d s , m a n a g e c h a n g e
1 7 .T a k e a c tio n c o n f irm to im p le m e ta tio n p la n
1 8 .C h e c k re su lt o f a c tio nre v ie w re su lts , w h e th e r g o a ls o f in s ti tu tio n h a v e b e e n m e t
Step 1: Selection of theme. The theme is a result of the senior management review to
identify short and long term problems. Champions (members of senior management)
would be concerned with the improvement of the effectiveness and efficiency of the
33

system and customer satisfaction. They would team up with the Master Black Belts
(MBBs) and the Black Belts (BBs) to prioritize the problems and would concentrate on
the core processes that need improvements.
Step 2: Reason for selection. In the second step this team would provide reasons why
this improvement project is important for the organization. A high-level performance gap
analysis may be performed to determine the gap between the desired and actual delivered
quality of service. The gap analysis would include identification of critical processes that
fulfills the mission and achieves the vision of the organization. Documenting the existing
processes and the infrastructure, identifying critical processes, and analyzing and
prioritizing opportunities for improvement occurs at both departmental and
organizational levels.
At the end of these two steps, the reason for seeking improvements is defined.
Step 3: Study current status. The MBBs and the BBs along with team leaders would
gain a good understanding of the current status of the processes and systems by senior
management reviews. The following objectives are met during this step:
• Study existing processes, infrastructure, and technology used in the system
• Acquire adequate knowledge concerning the critical processes
• Identify and brainstorm with the Champions to understand existing problems
• Interview all stakeholders to understand their expectations
Step 4: Analysis. Once the business systems are measured and capabilities are
determined, a detailed gap analysis is performed by the MBBs and BBs along with team
leaders and Champions. The objective will be to improve the system elements that limit
34

overall system performance. Champions would provide all the information that describes
past performance.
Step 5: Planning of measures. During this step, critical success factors (CSF) are
measured. It is important to know what needs to be measured, how to measure and
gaining executive commitment to right measurements. (Harry and Schroeder, 2000) The
MBBs along with the BBs, team leaders and Champions would put a master project plan
together. The outcome of this step would be a master plan, which addresses the critical
issues.
Step 6: Implementation of the master plan. A charter is developed by making use of
the master plan developed in the previous step. The charter, which is used on a project
team level, is then reviewed by all the stakeholders of the project that leads to the next
step.
Step 7: Confirmation of effect. Critical success factors that were found in the planning
of measures become the basis for the master project plan. While the master plan is used at
the executive level, the teams develop their individual project charters. Team Leaders
would get the charter confirmed from MBBs, BBs, and Champions and then the team
members (GBs) would also approve to be sure that there is “buy-in” at all levels.
Step 8: Prevention /Standardization. By this time, it becomes obvious that the
organization’s next step should be to improve the system elements that limit overall
system performance. Standardization of a system that proves to be best in class is
performed at the executive level. At the team level, a model is chosen as the standard
approach for problem solving. If the need were to improve the existing process within the
35

organization, then the team would choose the DMAIC (Define, Measure, Analyze,
Improve, and Control) model as shown in figure 3.2. If the need were to redesign the key
processes, then the team would choose DMADV (Define, Measure, Analyze, Design, and
Validate) model. Also team briefing/team awareness should be performed to ensure all
the members of the team are comfortable using the standard model.
Step 9: Stability of Control. Stability of control is brought into the current system by
integrating the best-in-class systems into the strategic planning framework.
Brainstorming sessions with the MBBs, BBs and Champions are conducted during this
step.
Step 10: Remaining Problem. During this step, recognizing other operational issues
that link to key business systems is performed. At the team level, remaining problems are
identified, analyzed and prioritized. Opportunities for improvement are also identified on
a continuous basis.
Step 11: Future Policy. The future policy is determined to continually improve the
processes both at the departmental level and the organizational level.
From this point onward Six Sigma Green Belts (GBs) team level discussions are
performed using the five steps of the DMAIC model (steps 12 through 16 below). During
the control phase of the DMAIC model, the PDCA cycle is introduced to implement the
changes and verify the results.
Step 12: Define. In addition to defining the purpose and determining targets, the team
leader also
1. Selects sub teams (Six Sigma Green Belts and assign tasks /accountabilities)
36

2. Sets goals for sub teams
Step 13: Measure. The Six Sigma Green Belt team under the supervision of the team
leader performs the following steps:
• Defining the current process at project team level
• Focusing on high leverage opportunities for improvement and confirmation of
key customer requirements
• Gathering of initial data and determining the current performance
• Stratifying and analyzing the data
• Performing an analysis to identify high-impact areas within the organization
• Developing opportunity/problem statement and project scorecard
Step 14: Analyze. The Six Sigma Green Belts along with the team leader:
• Develops cause and effect hypotheses for the project
• Determines and validates root causes
Step 15: Improve. The Six Sigma Green Belts – team leader:
• Identifies breakthroughs and selects practical approaches
• Designs future state
• Establishes performance targets and project scorecards
• Gains approval from the strategy management team to implement
improvements
• Implement improvements
• Trains and executes
Step 16: Control. The project team:
37

• Measures results, develops control methods and manages change
• Reports scorecard data and creates a process control plan
• To continually improve the process, the PDCA cycle is repeated
Step 17: Take action. This is the final step in the PDCA cycle. In this step, the following
activities are performed by the project team:
• Gain commitment to implementation efforts
• Conform to the implementation plan
• Standardize the methods that produce best-in-class process performance
Step 18: Check results of action. This review process is the last step in the model, where
actions are checked for results. The purpose of the review is to check whether goals and
objectives of the organization have been met. The team members along with other MBBs,
the BBs would make a presentation to the champions. Finally, a report is handed out to
the champions.
3.7 Application of the model to mitigate Six Sigma project failures
The literature review identified some of the Six Sigma failures attributable to
management (see table 2.1). Many quality theorists in one form or another have discussed
these management failures. In order to validate these failures, the works of quality
theorists were studied and a matrix was created (shown in table 3.2) based on their
philosophies. The works of quality theorists and related sources that were referred to
gather information have been listed in the reference section. The quality theorists that
were studied related to management failures are:
38

1. Deming: The impact of Deming's teachings on manufacturing and service
organizations has been profound. Dr. Deming's famous 14 Points serve as management
guidelines. In the study shown in table 3.2, Deming has covered about 19 factors out of
these 30 listed failures related to management (Deming, 1986, 1994).
2. Juran/DeFeo: Juran and DeFeo have made many contributions to the field of quality
management. These two quality theorists have discussed about 21 points out of 30 listed
failures.
3. Crosby: Crosby popularized the idea of the "Cost of poor quality" and “Zero defects”.
Some of his books like "Quality without Tears" and "Quality is Free" were referred in
order to validate the thirty documented failures. Out of these 30 failures, 8 of them were
discussed in his work and are shown in the table 3.2.
4. Feigenbaum: Armand V. Feigenbaum coined the term "Total Quality Control". He
laid out the precepts of total quality control. His focus was on customer satisfaction.
Of the 30 failure factors he has covered 14 of them in his work related to TQC.
Table 3.2 shows the views of the quality theorists with respect to the thirty-
documented project failures related to management. Among these 30 failures, failure
points 12, 18, 26 were identified and verified by the author’s research and experience.
The remaining 27 were confirmed by Carnell’s work and verified according to the
writings of the quality theorists by research. (Carnell, 2004). Table 3.3 describes the
impact of the Six Sigma Policy Deployment model on the thirty documented failures.
Table 3.4 gives a breakdown of the model showing which steps in the model can prevent
these failures or mistakes.
39

Table 3.2: Documented Failures according to the quality theorists
30 Documented Six Sigma failures (related to management and company)
Edward Deming
Juran & DeFeo
Philip Crosby
Armand Feigenbaum
1 No concept of customer expectations * * *2 No vision related to customer expectations * * *3 No follow-up on the annual operating plan * *4 Lack of alignment(horizontal or vertical) * *5 No visible leadership at the executive level * *6 Business executives do not show up for report-
outs(conveys a lack of priority) * *7 Deploying Six Sigma without a goal(reason for
deployment) *8 Deploying Six Sigma with a goal but no plan on
how to get there * * *9 Abdicating the deployment plan to a consulting
company * *10 Trying to change the organization without a
detailed change process * * *11 Not having metrics in place for management
participation * *12 Absence of a formal change process * *13 Champions do not show up for report-outs *14
Having metrics in place but no feedback(or limited feedback annually,semi-annuall
*
y,quarterly)*
15Not having multiple projects queued up for each MBB,BB or GB(so when they complete a project the next one has already been selected)
*16 Not communicating deployment plans effectively
through the organization * * *17 No rewards or recognition program * * *18 Lack of a detailed cultural change management
program * * *19 No retention program for trained personnel * *20 Trying to use contract type agreements to retain
MBBs and BBs *21 Project selection process does not identify
projects related to business objectives * * *22 Middle management operates on their own
agenda (feel support is optional) *23 No accountability * * *24 Champions do not break roadblocks *25 No buy-in at the process owner level * *26 Lack of interaction with organizational systems
and technology * *27 Supply base supplying poor quality material * * *28 No consequence for suppliers sending bad
material(typically because of price) * * *
29 No plan to deploy into the Design and Marketing functions after operations has launched *
30 Believing a single initiative can/will solve all your problems *
40

Table 3.3: Impact of Six Sigma Policy Deployment Model on Project Failures
30 D ocum ented S ix S igm a fa ilu res related to m anagem ent and com pany
H EAVY IM PAC T
M ED IU M IM PAC T
LIG H T IM PAC T
N O IM PAC T
1 N o concep t o f custom er expectations ∗2 N o vision related to custom er expectations ∗3 N o fo llow-up on the annual operating p lan ∗4 Lack o f alignm ent(horizontal or vertical) ∗5 N o visib le leadership at the executive level ∗6 B usiness executives do not show up for report-
outs(conveys a lack o f prio rity) ∗7 D eploying S ix S igm a without a goal(reason for
deploym ent) ∗8 D eploying S ix S igm a with a goal but no p lan on
how to get there ∗9 A bdicating the deploym ent p lan to a consulting
com pany ∗10 T rying to change the organization without a
detailed change process ∗11 N ot having m etrics in p lace fo r m anagem ent
partic ipation ∗12 A bsence of a fo rm al change process ∗13 C ham pions do no t show up fo r report-outs ∗14 H aving m etrics in p lace but no feedback(or
lim ited feedback annually,sem i-annually,quarterly)
∗15 N ot having m ultip le pro jects queued up fo r each
M B B ,B B or G B (so when they com plete a p ro ject the next one has already been selected)
∗16 N ot com m unicating deploym ent p lans effectively
through the organization ∗17 N o rewards or recognition p rogram ∗18 Lack o f a detailed cultural change m anagem ent
program ∗19 N o retention program for tra ined personnel ∗20 T rying to use contract type agreem ents to retain
M B B s and B B s ∗21 Pro ject selection process does not identify
pro jects related to business ob jectives ∗22 M iddle m anagem ent operates on their own agenda
(feel support is optional) ∗23 N o accountab ility ∗24 C ham pions do no t break roadblocks ∗25 N o buy-in at the process owner level ∗26 Lack o f interaction with organizational system s
and technology ∗27 Supply base supp lying poor quality m aterial ∗28 N o consequence for suppliers sending bad
m aterial(typically because of price) ∗29 N o p lan to dep loy into the D esign and M arketing
functions after operations has launched ∗30 B elieving a single initia tive can/will so lve all your
problem s ∗
Six S igm a Po licy D eploym ent
41

Table 3.4: Breakdown of Six Sigma Policy Deployment steps- relation to project failures
30 Documented Six Sigma failuresrelated to management and company
1 2 3 4 5 6 7 8 9 10 11 12 13 14 15 16 17 181 No concept of customer expectations * *2 No vision related to customer expectations * * *3 No follow-up on the annual operating plan * * *
4 Lack of alignment(horizontal or vertical) * *
5 No visible leadership at the executive level * * *
6 Business executives do not show up for report-outs(conveys a lack of priority)
* * *
7 Deploying Six Sigma without a goal(reason fordeployment)
* *
8 Deploying Six Sigma with a goal but no plan onhow to get there
* * * * * *
9 Abdicating the deployment plan to a consultingcompany
* * * * * *
10 Trying to change the organization without adetailed change process
* * *
11 Not having metrics in place for managementparticipation
* * *
12 Absence of a formal change process * * * * *13 Champions do not show up for report-outs *
14Having metrics in place but no feedback(orlimited feedback annually,semi-annually,quarterly)
* * * * *
15Not having multiple projects queued up for eachMBB,BB or GB(so when they complete a projectthe next one has already been selected)
* *
16 Not communicating deployment plans effectivelythrough the organization
* * * *
17 No rewards or recognition program *
18 Lack of a detailed cultural change managementprogram
* * * * *
19 No retention program for trained personnel * *
20 Trying to use contract type agreements to retainMBBs and BBs
21 Project selection process does not identifyprojects related to business objectives
* * * *
22 Middle management operates on their ownagenda (feel support is optional)
* * *
23 No accountability * * * *24 Champions do not break roadblocks * * *25 No buy-in at the process owner level * *
26 Lack of interaction with organizational systemsand technology
* * * * * * *
27 Supply base supplying poor quality material * * * *
28 No consequence for suppliers sending badmaterial(typically because of price)
* * * *
29 No plan to deploy into the Design and Marketingfunctions after operations has launched
* * * * *
30 Believing a single initiative can/will solve allyour problems
* * * * * *
Six Sigma Policy deployment steps
42

3.8 Six Sigma Policy Deployment Measurements
This section discusses the measurements for the Six Sigma Policy Deployment
Model. The performance measurement categories used here are based on ISO and
Baldrige criteria (Mears and Voehl, 1995). Table 3.5 discusses the Six Sigma Policy
Deployment model against the seven performance measurement categories. This table
also discusses some of the objectives of measurements.
The seven different performance measurement categories that were used to measure
Six Sigma Policy Deployment model are listed below (Mears and Voehl, 1995):
1. Leadership:- Some of the key aspects of leadership are: Getting involved in
developing a quality culture, following up with the annual operating plan, practicing
quality concepts, clearly communicating quality responsibilities to all employees,
coordinating between departments and providing adequate resources for quality
improvement.
2. Strategic Planning:- Some of the key aspects that are involved in strategic planning of
any organization are: concept of customer expectations, using competitive data from
other firms when developing Six Sigma goals, having an operational plan that
describes the goals, involving employees in quality planning, having specific methods
for monitoring progress toward improving quality, project plans in effect for all
departments and having quality plans for suppliers.
3. Information and Analysis:- Information and Analysis criteria concentrates on
gathering the data on all important dimensions of customers and services provided to
43

them, knowing the competitors, analyzing the suppliers’ view of quality, data
gathering to analyze the performance and identifying causes of poor quality.
4. Human Resource Development and Management:- Some of the key aspects of human
resource management are: involving employees in Six Sigma improvement projects,
using quality criteria for employee performance evaluation, communicating Six
Sigma goals to all employees, training all employees on the Six Sigma Policy
Deployment concepts and rewarding employees for their quality improvement efforts.
5. Process Management:- Some of the key aspects covered under process management
are: defining customer quality expectations, transferring customer requirements into
the planning process for improvement, evaluating processes for improvement, making
sure that departments have defined Six Sigma goals, using competitive data for
making process improvements and working with suppliers to improve quality.
6. Customer Focus and Satisfaction:- Some of the key aspects that are covered under
this category of performance measurement are: gathering customer satisfaction data
from customer groups, having vision related to customer expectations, proving higher
levels of customer satisfaction than the competitors and using innovative approaches
in assessing customer satisfaction.
7. Business Results:- Some of the key business results discuss the improvement of
customer satisfaction, leaders getting involved in the report-outs and having the right
metrics in place.
44

Table 3.5: Six Sigma Policy Deployment model against seven performance measurement categories
S i x S i g m a f a i l u r e s r e l a t e d t o m a n a g e m e n t a n d c o m p a n y H
EA
VY
IMPA
CT
ME
DIU
M
IMPA
CT
O b j e c t i v e s Lea
ders
hip
Stra
tegi
c
Plan
ning
Info
rmat
ion
and
Ana
lysi
s
HR
Man
agem
ent
Proc
ess
Man
agem
ent
Cus
tom
er
Focu
s
Bus
ines
s
Res
ults
1 N o c o n c e p t o f c u s t o m e r e x p e c t a t i o n s ∗ C o n c e p t o f c u s t o m e r e x p e c t a t i o n s ∗ ∗ ∗2 N o v i s i o n r e l a t e d t o c u s t o m e r e x p e c t a t i o n s ∗ V i s i o n r e l a t e d t o c u s t o m e r e x p e c t a t i o n s ∗ ∗ ∗3 N o f o l l o w - u p o n t h e a n n u a l o p e r a t i n g p l a n ∗ F o l l o w - u p o n t h e a n n u a l o p e r a t i n g p l a n ∗ ∗ ∗ ∗4 L a c k o f a l i g n m e n t ( h o r i z o n t a l o r v e r t i c a l ) ∗ A l i g n m e n t o f t h e p r o j e c t s w i t h b u s i n e s s
o b j e c t i v e s ∗ ∗5 N o v i s i b l e l e a d e r s h i p a t t h e e x e c u t i v e l e v e l ∗ L e a d e r s h i p a t t h e e x e c u t i v e l e v e l ∗6 B u s i n e s s e x e c u t i v e s d o n o t s h o w u p f o r
r e p o r t - o u t s ( c o n v e y s a l a c k o f p r i o r i t y ) ∗ B u s i n e s s e x e c u t i v e s s h o w u p f o r r e p o r t -o u t s ∗ ∗ ∗ ∗
7 D e p l o y i n g S i x S i g m a w i t h o u t a g o a l ( r e a s o n f o r d e p l o y m e n t ) ∗ D e p l o y i n g S i x S i g m a w i t h a g o a l ∗ ∗ ∗
8 D e p l o y i n g S i x S i g m a w i t h a g o a l b u t n o p l a n o n h o w t o g e t t h e r e ∗ D e p l o y i n g S i x S i g m a w i t h a g o a l a n d
p l a n o n h o w t o g e t t h e r e ∗ ∗ ∗ ∗9 A b d i c a t i n g t h e d e p l o y m e n t p l a n t o a
c o n s u l t i n g c o m p a n y ∗ D e v e l o p i n g d e p l o y m e n t p l a n w i t h i n t h e c o m p a n y ∗ ∗
1 0 N o t h a v i n g m e t r i c s i n p l a c e f o r m a n a g e m e n t p a r t i c i p a t i o n ∗ H a v i n g m e t r i c s i n p l a c e f o r m a n a g e m e n t
p a r t i c i p a t i o n ∗ ∗ ∗1 1 A b s e n c e o f a f o r m a l c h a n g e p r o c e s s ∗ H a v i n g a f o r m a l c h a n g e p r o c e s s ∗ ∗1 2 C h a m p i o n s d o n o t s h o w u p f o r r e p o r t - o u t s ∗ C h a m p i o n s s h o w u p f o r r e p o r t - o u t s ∗1 3 N o t h a v i n g m u l t i p l e p r o j e c t s q u e u e d u p f o r
e a c h M B B , B B o r G B ( s o w h e n t h e y c o m p l e t e a p r o j e c t t h e n e x t o n e h a s a l r e a d y b e e n s e l e c t e d )
∗ H a v i n g m u l t i p l e p r o j e c t s q u e u e d u p f o r e a c h M B B , B B & G B ∗
1 4 N o t c o m m u n i c a t i n g d e p l o y m e n t p l a n s e f f e c t i v e l y t h r o u g h t h e o r g a n i z a t i o n ∗ C o m m u n i c a t i n g d e p l o y m e n t p l a n s
e f f e c t i v e l y t h r o u g h t h e o r g a n i z a t i o n ∗ ∗ ∗1 5 L a c k o f a d e t a i l e d c u l t u r a l c h a n g e
m a n a g e m e n t p r o g r a m ∗ H a v i n g a d e t a i l e d c u l t u r a l c h a n g e m a n a g e m e n t p r o g r a m ∗
1 6 N o r e t e n t i o n p r o g r a m f o r t r a i n e d p e r s o n n e l ∗ R e t e n t i o n p r o g r a m f o r t r a i n e d p e r s o n n e l ∗ ∗1 7 P r o j e c t s e l e c t i o n p r o c e s s d o e s n o t i d e n t i f y
p r o j e c t s r e l a t e d t o b u s i n e s s o b j e c t i v e s ∗ P r o j e c t s e l e c t i o n p r o c e s s i d e n t i f i e s p r o j e c t s r e l a t e d t o b u s i n e s s o b j e c t i v e s ∗ ∗ ∗
1 8 M i d d l e m a n a g e m e n t o p e r a t e s o n t h e i r o w n a g e n d a ( f e e l s u p p o r t i s o p t i o n a l ) ∗ M i d d l e m a n a g e m e n t s u p p o r t s o t h e r
o p e r a t i o n s w i t h i n t h e c o m p a n y ∗ ∗1 9 N o a c c o u n t a b i l i t y ∗ H a v i n g a c c o u n t a b i l i t y ∗ ∗2 0 N o b u y - i n a t t h e p r o c e s s o w n e r l e v e l ∗ B u y - i n a t t h e p r o c e s s o w n e r l e v e l ∗ ∗2 1 L a c k o f i n t e r a c t i o n w i t h o r g a n i z a t i o n a l
s y s t e m s a n d t e c h n o l o g y ∗ H a v i n g i n t e r a c t i o n w i t h o r g a n i z a t i o n a l s y s t e m s a n d t e c h n o l o g y ∗ ∗
2 2 N o p l a n t o d e p l o y i n t o t h e D e s i g n a n d M a r k e t i n g f u n c t i o n s a f t e r o p e r a t i o n s h a s l a u n c h e d
∗P l a n t o d e p l o y i n t o t h e D e s i g n a n d M a r k e t i n g f u n c t i o n s a f t e r o p e r a t i o n s h a s l a u n c h e d
∗ ∗2 3 B e l i e v i n g a s i n g l e i n i t i a t i v e c a n / w i l l s o l v e a l l
y o u r p r o b l e m s ∗ N o t b e l i e v i n g a s i n g l e i n i t i a t i v e c a n / w i l l s o l v e a l l t h e p r o b l e m s ∗ ∗ ∗
M o d e lB u s i n e s s E x c e l l e n c e - P e r f o r m a n c e M e a s u r e m e n t
C a t e g o r y
45

3.9 Summary
Based on the literature review, there is no existing framework or model which
integrates the Six Sigma DMAIC problem solving with the PDCA and Policy
Deployment (Hoshin Kanri) planning process that can be used by organizations to
achieve breakthrough improvements.
The model represents the highest stage of the evolution of the Six Sigma change
methodology (shown in figure 3.1) which integrates Policy Deployment, the Six Sigma
DMAIC problem solving approach, and the PDCA cycle to achieve breakthrough results.
The table 3.1 listed the 18 steps of Six Sigma Policy Deployment cycle. The model was
designed to bring Policy Deployment, PDCA and Six Sigma DMAIC together in a new
and powerful way that helps mitigate Six Sigma project failures.
During the literature review, thirty documented Six Sigma failures related to
management were identified. These thirty failures were validated against the teachings of
quality theorists (as shown in table 3.2) whose philosophies are widely known and
accepted. The impact of the integrated Six Sigma Policy Deployment model against these
documented failures was studied and shown in table 3.3. In this table, heavy impacts are
the points that can be directly and strongly related to the steps in the model, medium
impacts are the points that can be directly and moderately related to the steps in the
model, light impacts are the points that are not addressed directly but can be derived or
implied from the steps of the model and no impact are the points which have not been
addressed by any of the steps in the model. It can be seen that the model has twelve
instances of heavy impact on the failure points, ten of medium impact, seven of light
46

impact and one instance of no impact out of these thirty documented failures. This
indicates that the Six Sigma Policy Deployment model has:
1. Addressed 97% of the documented failures and
2. Addressed 74% with significant impact (Heavy and Medium)
Further, the thirty failures across all 18 steps of the Six Sigma Policy Deployment
model are listed as shown in table 3.4. The 18-step Six Sigma Policy Deployment model
covers all 30 failure points, with some steps covering as many as nine failures and others
covering one or more. Thus, the model, as shown in table 3.4 covered a total of 102
failure mode interaction points. Later in table 3.5, the Six Sigma Policy Deployment
model was measured against the seven performance measurement categories. The
objectives of measures were also discussed in table 3.5.
A case study has been presented in the following chapter that discusses the FPL
quality improvement program and then discusses the projects that followed the Six Sigma
lifecycle steps.
47

CHAPTER FOUR: CASE STUDY
4.1 Introduction
This section aims at presenting the limitations of previous approaches in quality
management and how the new Six Sigma Policy Deployment Model would address those
limitations. For this purpose an industry case study is presented as a benchmark for the
development of the integrated model. The benchmark chosen was Florida Power and
Light (FPL), a key organization in the development of continuous improvement programs
and an early leader in the application of policy deployment. The FPL benchmark was
chosen for the following reasons:
1. FPL had learned much from the JUSE (Union of Japanese Scientists and Engineers)
Counselors, including Dr.Akao, who popularized the policy deployment model.
2. The Shortcoming of the model at the time was that it did not include the Six Sigma
DMAIC problem solving process. Instead, FPL used the QC story, which was a
robust approach containing some but not all the DMAIC components.
3. The Six Sigma Lifecycle used by the master instructor was derived from the FPL
model.
By using the Six Sigma Lifecycle as a benchmark foundation, the new integrated Six
Sigma Policy Deployment model had a strong platform to expand upon and helped
clarify many of the policy deployment steps.
This case study is used to outline the limitations of that early approach by cross-
referencing its components to a present case of a Six Sigma project at the University of
48

Central Florida (UCF). Later a contrasting view is presented in which the components of
the new Six Sigma Policy Deployment Model are used to highlight the areas of possible
enhancements in the UCF Project.
The Executive Board of the ASQ Orlando Section 1509 decided to provide
educational opportunities to their membership, and provide benefits to local community
organizations. The ASQ Board involved the ASQ Student Chapter at UCF to provide an
applied learning opportunity to students. ASQ along with cooperation from the
Harrington Software Group headquartered in Orlando, Florida, launched three ASQ
Community Good Works projects in June, 2003.
The three projects successfully created value through cycle-time reduction,
process documentation and improvement, volunteer involvement, and innovative
solutions. These three projects were proposed by Frank Voehl, Chief Operating Officer of
The Harrington Software Group of Orlando, and Cathi Balboa, Vice Chair of section
1509 (Voehl, 2004)
Two of the three Six Sigma Community improvement projects have been
summarized in the section 4.4:
Project #1- Florida Engineering Education Delivery System (FEEDS) deals with UCFs
distance education system.
Project #2-Seniors First deals with providing meals to senior citizens population
Frank Voehl has served as General Manager of Florida Power and Light (FPL)
Qualtec Quality Services. He led teams as the Six Sigma Master Black Belt (MBB)
49
instructor. Under his guidance these projects were benchmarked against the FPL quality
improvement program which is discussed in the following section in detail.
4.2 FPL Policy Deployment Case Study
The FPL case study is based on the 1988 JUSE (Union of Japanese Scientists and
Engineers) Counselor Comments Report as well as the FPL description of Quality
Improvement Program (reference #000942, 1989).
During the 1970s, FPL was forced to increase utility rates repeatedly because of
increasing costs, slower sales growth, and stricter federal and state regulations. Marshall
McDonald, then chairman of the board, realized that the company had been concentrating
on keeping defects under control rather than on improving quality, as seen through the
eyes of the customer. In 1983, while in Japan, McDonald met the president of Kansai
Electric Power Company, a Deming prizewinner, and learned about their total quality
efforts.
FPL began its Quality Improvement Program (QIP) in 1981 and in 1987, Policy
Deployment became the driving force behind the QIP. Due to the influence of the QIP,
the average length of service interruptions dropped, the numbers of customer complaints
were drastically reduced, safety had improved, and also the price of electricity stabilized.
In 1989, FPL won the Deming Prize, the most prestigious quality award in the world.
(Evans and Lindsay, 2002)
FPL’s QIP consisted of three major components (shown in figure 4.1):
1. Policy Deployment at the executive level
50

2. Quality Improvement teams (QC Story) at the project level
3. Quality in Daily (repetitive) Work (QIDW)
Policy Deployment: Policy Deployment integration at FPL was a top-down,
bottom-up method to ensure that plans and strategies were successfully implemented
within the organization and throughout the value chain. The JUSE counselors taught FPL
executives to deploy their strategy through a process called “Hoshin Kanri” which is also
known as “Hoshin Planning”. The word “Hoshin” refers to policies of management and
“kanri” to the aspects of planning. FPL’s Hoshin Kanri (Policy Deployment in Western
quality literature) became the company-wide planning and implemention method that tied
improvement activities, usually requiring breakthrough results, to the long-term strategies
of the organization.
Quality Improvement teams (QC Story): Rather than having a continuous
improvement methodology for process and product improvements that have a direct
impact on both financial and operations goals and the organization, FPL treated each
occurrence on a project-by-project basis. Even though the first efforts focused on fairly
narrow problems, their impact on the whole business was soon made clear. Quality
Improvement teams were developed to provide a structure for the employees to improve
the quality of products and services, skills and abilities, communication and teamwork
and enhance the quality of work life. This gave equal opportunity to be heard by
management and to express their individual creativity.
Quality in Daily (repetitive) Work (QIDW): Quality in daily work (QIDW)
provided a decentralized method for controlling and improving daily work processes. The
51

basic aim was to ensure that routine activities were performed correctly. It provided for
maintenance of the gains achieved through improvement activities.
Figure 4.1 Quality Improvement Program (QIP) at FPL
--------------------------------------------
Qua
lity
Impr
ovem
ent T
eam
s
Pol ic
y D
eplo
y
Proposed Short term plan
Chronic Problems
Normal improvement Activities
Long term and midterm plans
Improvement Activities
Daily Work Processes
Job Accountabilities
Department Basic Function
Standardization
Corporate Vision
CDP
A
CDP
A
men
tQ
uali t
y in
D W
aily
ork
4.2.1 Description of Policy Deployment at FPL
During 1985, Yoshio Kondo, one of the JUSE Counselors working with FPL,
described the essential steps of Hoshin Kanri, or Policy Deployment. He recommended
differentiating between those indicators that were useful in setting policy and those that
help achieve control (JUSE Counselor Comments Report, 1988). Some of the essential
points of Hoshin Kanri incorporated by FPL were:
52

• Annual policy
• Establishment of quality policy
• Converting methodological policy into objective policy that is composed of aims,
targets and priority strategies, from top-down and bottom-up deployment.
Starting in 1988, each year’s Policy Deployment projects were based upon the results
of the previous year’s projects, as recommended by the JUSE counselors (JUSE
Counselor Comments Report, 1988). Policy Deployment started with the top
management team, who was responsible for developing and communicating the FPL
vision, mission, and values, as well as building an organization-wide commitment to
achievement. The FPL vision was then deployed through the development and catchball
execution of annual “Hoshins”, or policy statements.
4.2.2 Playing Catchball through Goal Setting at FPL
Through the catch-ball activities, all levels of FPL employees were actively
participating in generating strategies and action plans for the attainment of the vision and
associated objectives (Evans and Lindsay, 2002). Thus, at each level, progressively more
and more detailed action plans were developed to make the strategies and ‘hoshins’ came
alive. Each ‘hoshin’ contained an objective statement, a goal or target, a strategy, a
measure and the person responsible for achievement. As plans cascaded downward, there
was a clear link of the vision and common goals. It was this focus on a few critical goals
that helped FPL achieve the desired breakthrough, by the alignment of critical resources
in a focused and concentrated manner. (JUSE Counselor Comments Report, 1988)
53

4.2.3 FPL Policy Alignment
The main objective of Policy Deployment is to align the organizational forces of
the extended enterprise in the same direction so that everyone within the enterprise
knows and understands the overall direction of the organizations involved and how each
can play its part to best support that direction. (Voehl, 2000). At FPL, this included the
selection of suppliers who shared the vision of the enterprise and were willing to work
together to reduce cycle time and prioritize its improvement efforts to tie to the vision.
The need to improve was governed by the levels of customer satisfaction, state of
statistical process control, process capability, trends and the overall business
environment. Each of the major processes within the FPL supply chain was prioritized in
order to focus on the high leverage critical success factors that existed. The use of
Critical Success Factors (CSFs) greatly assisted FPL with the prioritization and focusing
activities and was viewed by FPL executives as the strategic enabling arm of Policy
Deployment. However, Dr. Kano emphasized that Policy Deployment was a strategic
subject and should not cover all the operations in a utility business; hence, QIDW
(quality in daily work) was introduced (JUSE Counselor Comments Report, 1988).
The missing ingredient at FPL at the time was the ability to correctly understand
the customer needs and wants, and to listen to the voice of the customer. FPL needed to
have had a better system for surfacing and aligning their CSFs. FPL found such a system
called Table of Tables (Quality Function Deployment) which was effectively used to
surface CSFs and develop breakthrough strategy thereby creating policy alignment.
54

At FPL, one of the lessons learned was that if the method of project selection was
not correct, then achievement of the project will not result in the achievement of the total
objective. If the causes of non-achievement are not investigated at the evaluation step, the
tendency is to repeat the same mistakes and lose all chances of improvement. For this
reason, FPL instituted Presidential Reviews in order to ensure that champions showed up
for report-outs. This also helped insure that the metrics were in place for management
participation.
In summary,
• The five fundamental work force tasks of Policy Deployment that were followed
in FPL.
o Understanding the customer
o Goal setting
o Catch-ball within the divisions of the organization
o Monthly and daily management review activities
o Checking, inspecting and problem-solving
• Policy Deployment was not merely a cascade of objectives, but an integrated
approach between strategy, process, projects and logistics both horizontally and
vertically. Therefore, it contributed to the likelihood that alignment occurred
around key operating principles.
• At the beginning, Policy Deployment was added to older systems of support,
thereby adding complexity and slowing things down while focusing and aligning.
55

They soon became replacements for older systems of MBO management, and
they radically simplified the documentation and performance of work.
The table 4.1 summarizes the Policy Deployment steps that were followed by FPL.
Table 4.1 Summary of FPL Policy Deployment steps
Steps FPL objective
1 Selection of theme To initiate Quality Improvement Program (QIP) in 1980s
2 Reason for Selection
FPL identified significant external and internal issues that were impacting the survival of the company.Corporate goals needed to be established and achieved using new management techniques.
3 Study of current status
Study revealed that internal and external environments were changing faster than FPL could adapt. Declining customer confidence and satisfaction, uncertainty of the future of nuclear power supply, price of electricity increasing faster than the consumer price index (CPI)
4 Analysis Further analysis was conducted based on the previously collected data
5 Planning of measures Goals were set to realize the corporate vision.
6 Implementation Established policy deploymnet committtee, Established new vision, phased out Management By Objective (MBO)
7 Confirmation of effect Presidential reviews were conducted,Developed Midterm and short term plans,
8 Prevention/StandardizationAssigned Coordinating executive, integrated policy deployment with budget system, established "Policy Deployment guidelines"
9 Stability of control Formalized cross-functional management of problems, set midterm targets to reflect "Best Managed".
10 Remaining ProblemIntroduced corporate quality/delivery system, introduced department quality systems, confirmed alignment of short-term plans with customer needs
11 Future PolicyAligned corporate and departmental activities through mini-situation conference, linked project targets drectly to short-term plans
56
4.3 Application of the FPL QIP to FEEDS and Seniors First project
The two Six Sigma projects were initiated with the guidance of a Master Black Belt
instructor, who provided a Six Sigma project life cycle (unpublished manuscript, Voehl
2003) that was originally based on the FPL QIP. This methodology was used as a
benchmark by the Six Sigma project teams. The FPL’s lessons learned became the basis
for the Six Sigma project teams to start off the projects with the right method of project
selection process and developing reasons for selection. Each of the steps that were
followed in the projects are discussed in the next section.
4.4 Integrated Six Sigma Policy Deployment-FEEDS and Seniors First project
Tables 4.2 and 4.3 gives a Summary of the FEEDS and Seniors First projects that
followed the Six Sigma Lifecycle methodology, which is a component of the new Six
Sigma Policy Deployment Model, and thus helped to overcome some of the deployment
failures that were discussed in the previous chapters. While the Six Sigma Lifecycle
methodology followed by the two projects was adequate and contained most of the
components of the new Six Sigma Policy Deployment Model, it did not explicitly guide a
user through a sequence of steps or provide an orderly path to pursue. This while
appearing trivial, is the most valuable component in the new Six Sigma Policy
Deployment Model: orderly guidance.
57

4.5 FEEDS and Seniors First Project Overview
The Florida Engineering Education Delivery System (FEEDS) is a program that
provides distance learning and knowledge sharing services. The statewide system
supports 121 company partners and 44 delivery and receive locations. An Assistant Dean
and full-time staff of four technical experts administer FEEDS through the Engineering
College at the University of Central Florida. The FEEDS Six Sigma project had two
goals: documenting the current process and identifying the opportunities for
improvement. The MBB, BBs, and Champions set the goals for the project. Policy
Deployment steps (based on FPL QIP) of the proposed model was followed for initial
project planning. The FEEDS Six Sigma Green Belt team along with the team leader
performed the Six Sigma DMAIC steps. During the measure step, the team surveyed
FEEDS students (who are the customers) to know their expectations. The team listed
many of the opportunities for improvement from the survey. In the latter stages of the
project, the team developed a Failure Mode and Effects Analysis (FMEA). The steps that
were followed in the project fall in line with the 18 steps of the Six Sigma Policy
Deployment Model, which is shown in table 4.2.
The Seniors First project goal was to assess the current capability and, to identify
and prioritize opportunities for improvement of the Seniors First meals-on-wheels
system. The Seniors First Six Sigma Green belt team along with their team leaders
interviewed GA Foods and Seniors First, conducted a benchmark survey, and gathered
staff reports. Later, based on the interviews they compiled data that was then used to plot
control charts and scatter diagrams. The team also conducted a gap analysis to understand
58

the current state of service. The team then created a desired state service system map.
Table 4.3 gives a breakdown of the Seniors First project steps.
Both of the projects were benchmarked against the FPL QIP. The Six Sigma
Policy Deployment model uses the Policy Deployment steps of FPL QIP. By following
this methodology, most of the deployment failures that were discussed in earlier chapters
were prevented during the course of the projects. While both projects did not explicitly
follow the new Six Sigma Policy Deployment model described in this work, the
components of the proposed model are identifiable among the projects’ tasks. A summary
of the FEEDS project and Seniors First project and the corresponding model tasks is
presented in tables 4.2 and table 4.3 respectively.
While the 18 steps of the new Six Sigma Policy Deployment model are
identifiable in the project’s tasks, some aspects of the project could have been enhanced,
had the projects used the model explicitly. A list of potential enhancements to the
projects that could have been achieved is presented next:
•
•
While the PDCA cycle was identified in the project tasks, its value for daily control
capabilities was not used to its fullest. As such the projects dragged at times because
of commitment limitations from volunteer team members.
While some of the recommendations from the project were implemented, the future
policy component could have been enhanced. At the end of the projects, the
continuous improvement effort may have subsided without the implementation of
new policy that enables continuous improvements, such as FEEDS integrating the
59

student survey as an ongoing policy. The clear integration of projects to the business
objectives would have given much better results.
•
•
The last steps of the model (17-Take Action, 18-Check Results of Action) could have
been enhanced in order to enable the leap to a second project that would take the
measurements from the implemented policy or other opportunities for improvement.
While the components of the new model were among the tasks followed by both
projects, they were not organized in a format that allowed the project teams to fully
grasp the path to follow (i.e. the teams were not aware that they were following a
policy deployment model), thus limiting their planning capabilities.
60

Table 4.2: Summary of FEEDS Six Sigma Project
Steps FEEDS Case study1.Selection of theme Problems with the existing system,To achieve high Customer(FEEDS
Students) satisfaction 2.Reason for Selection Document the existing processes UCF FEEDS system,
Identify, Analyze and Prioritize opportunity for improvement of the FEEDS system, both at UCF and statewide,Provide an applications opportunity to team members for learning and reinforcement of the Six Sigma DMAIC process
3.Study of current status Study of existing FEEDS processes, Infrastructure, and technology, Brainstorm with FEEDS Champions
4.Analysis Analysis of feedback from FEEDS Champions, based on past performance
5.Planning of measures Beginning of planning process and Development of master plan from the MBB
6.Implementation FEEDS charter was developed and approved
7.Confirmation of effect Confirmation of master plan from FEEDS Master Black Belt and Champions
8.Prevention/Standardization DMAIC cycle was chosen as the standard approach for the problem solving
9.Stability of control Brainstormed with FEEDS Champions and Stability brought in the system
10.Remaining Problem Identify, Analyze and Prioritize opportunity for improvement of the FEEDS system at statewide
11.Future Policy To continuously improve the FEEDS system in the state of Florida and throughout the world
12.Define Goal setting of sub teams,Identifying stakeholders,Select team and assign tasks /accountabilities,started Define phase by listening to the voice of the customer, student survey was designed.
13.Measure Survey measured perceptions in two categories:satisfaction and usefulness
14.Analyze A Failure Mode and Effects Analysis (FMEA)and the results of the student survey were analyzed using radar diagram, histograms,correlation,root cause analysis
15.Improve Opportunities for improvements, breakthroughs were identified and selected practical approaches, Design Future State, Establish Performance Targets, Train and execute
16.Control(Check) Measured results, developed control methods and managed change, create a process control plan
17.Take action Create a process Control plan, presentations were given out to the champions
18.Check result of action Reviewed results,documented the project and final presentation given out to the entire team
61

Table 4.3: Summary of Seniors First Six Sigma Project
S tep s S en io rs F irst C a se stu d y
1 .S e lec tio n o f them e L ack o f co m p liance o f m ea l d e liv e ry fo r b o th ind iv id ua l an d co ngreg a te , A ch iev e u ltim a te cu sto m er sa tisfac tio n (sen io rs)
2 .R easo n fo r S e lec tio n T o b o o st and enhan ce the cu rren t m ea l d e live ry p ro cess to ad h ere to S ta te req u irem en ts and ensu re fo o d sa fe ty ,A ssess the cu rren t cap ab ility o f the system (m ea ls o n w hee ls),Id en tify , ana lyze an d p rio ritize o p p o rtu n ity o f im p ro vem ent o f the S en io rs-F irs t m ea ls-o n -w h ee ls systemP ro v id e an o p p o rtu n ity to ap p ly six s ig m a to o ls in a rea l life p ro jec t, an d d em o n stra te the p o w er o f the D M A IC p ro cess
3 .S tud y o f cu rren t s ta tus In te rv iew s w ith s takeho ld e rs and s ite v is its to b o th G A F o o d s an d S en io rs F irst fac ilitie s
4 .A n a lysis A na lysis o f va rio us s takeho ld e rs inp u t, an d se tting up fo r p e rfo rm ance m easures
5 .P lann ing o f m easures B eg inn in g o f the p ro jec t p lann in g p ro cessS e ttin g p ro jec t ta rge ts
6 .Im p lem en ta tio n S en io rs F irst cha rte r w as d eve lo p ed and ap p ro ved
7 .C o n firm a tio n o f e ffec t C o nfirm a tio n o f p lan w ith m aste r b lack b e lt an d cham p io n s
8 .P reven tio n /S tand ard iza tio n D M A IC w as cho sen a s the m e tho d o f cho ice to ad d ress th e issues w ith th e m ea ls-o n -w h ee ls d e live ry p ro cess
9 .S tab ility o f co n tro l B ra insto rm ed w ith S en io rs F irst cham p io ns an d assessing stab ility o f cu rren t p ro cess
1 0 .R em ain in g P ro b lem S tand ard iza tio n and p ro v is io n ing p ro cesses , and stream lin ing the fo o d d e liv ery o p e ra tio n
1 1 .F u tu re P o licy T o co n tinuo usly p ro v id e th e rig h t m ea ls , a t th e r ig h t tim e , to th e r ig h t p e rso n , a t the righ t tem p era tu re
1 2 .D efine In te rv iew ed G A F o o d s and S en io rs F irst E xecu tives an d O p era tio ns S ta ffT o ured P lan t F ac ilityV isited C o ng rega te M ea l S ite sIn te rv iew ed S ite M anagersO b ta ined P ro cess F lo w F ro m G A F o o d s
1 3 .M easu re C o m p iled O b se rva tio n D a taP lo ts o n C o n tro l C harts ,P lo ts o n S ca tte r D iagram s,C o n d uc ted G ap A na lysis o n C urren t S ta te S e rv ice S ystem M ap and R o o t C ause A na lysis
1 4 .A na lyze C o nd uc ted B en ch m ark S urvey , R id in g E xerc ises,G a th e red S ta ff R ep o rts and S R A R ep o rts
1 5 .Im p ro ve C rea ted “D esired S ta te” S e rv ice S ystem M apR ev iew ed R eco m m end a tio ns W ith S ta ff to D ete rm in e F easib ility ,A greed o n Im p lem en ta tio n o f Im p ro vem ents w ith S en io rs F irst S ta ff,N eed C o ncurrence F ro m G A F o o d s and S R A
1 6 .C o n tro l(C heck) G A F o o d s an d S R A ag reed w ith reco m m end a tio n s and a lso im p lem en t them
1 7 .T ake ac tio n S en io rs F irst w ill im p lem en t th e reco m m end atio ns
1 8 .C h eck re su lt o f ac tio n S ix S ig m a T eam w ill fo llo w up in 6 m o n ths to rev iew im p lem en ta tio n re su lts M o n th ly rev iew s w ill track and co n tro l co m p liance
62
4.6 Description of the heavy impact areas
1. No concept of customer expectations:
By following the Six Sigma Lifecycle, the FEEDS Six Sigma project team
performed customer needs analysis and FEEDS students (customers) were surveyed to
know their expectations. Survey measured perception in two categories: satisfaction and
usefulness. Project team interviewed and brainstormed with the Feeds Champions and
stakeholders.
On the other hand, the Six Sigma Seniors First team went on a site visit to GA
Foods and toured Seniors First facilities in order to directly observe the customer
interactions. The team observed congregate meal sites and reviewed the existing
documentation. They interviewed GA Foods and Seniors First executives and operations
staff concerning customer needs and wants. They also obtained process flow from GA
Foods and drafted “Current State” flow With Seniors First. While successfully
mitigating this failure factor, the projects could have been further strengthened by
explicitly following the step 1 and step 2 of the Integrated Six Sigma Policy Deployment
model.
2. No follow-up on the annual operating plan
Each of the Six Sigma project teams developed project charters (FEEDS charter
and Seniors First charter respectively), which were approved by all project stakeholders.
Project objectives were then aligned to the organizations annual business objectives. Six
Sigma MBB, BBs, Champions, team leaders and GBs met frequently to discuss the
progress of the projects. Discussions were based on the Charter that was developed at the
63

beginning of the projects. Team results could have been further strengthened by using the
clear linkages to the operating plans provided through the Integrated Six Sigma Policy
Deployment model. For example, at the end of each quarter, the Senior Leadership
teams of the client organizations would perform a management review of the impacts of
each project against the budget and business objectives.
3. Lack of alignment (Horizontal or vertical)
In addition to the alignment mentioned in item # 2 above, both projects used a
focused process to align stakeholder and Champions objectives with project objectives.
The use of the Integrated Six Sigma Policy Deployment model, had it been available at
the projects inception, would have provided a direct line of sight from the project
objectives throughout the entire organization, and would have provided a clearer vertical
integration with the organizational visions and missions.
4. No visible leadership at the executive level
Champions were involved through out the course of the projects. Although their
involvement was less at the start of the projects, the Champions co-operated in providing
the right data and resources supporting the projects after the initial Champions training
provided by the MBB. Each of the Six Sigma project teams were led by the team leaders
who had a thorough understanding of the Six Sigma tools and techniques. Tollgate
revisions were held periodically with the client management. The Integrated Six Sigma
Policy Deployment model would have called in for heavy Champions involvement from
the project beginning till the end by using Catchball technique.
64

5. Deploying Six Sigma without a goal (reason for deployment)
Apart from providing an opportunity to apply six sigma tools in a real life project,
and demonstrate the power of the DMAIC process, specific project goals were set. The
Integrated Six Sigma Policy Deployment model, had it been available, would have
provided a much clearer goal-alignment to the clients policies and the catch-ball
technique would have added substantial value beyond what was already achieved.
The two goals that were set for the FEEDS Six Sigma project was:
1. Document the existing process of the UCF FEEDS system.
2. Identify, analyze and prioritize opportunities for improvement within the
system.
Goals of the Seniors First Six Sigma project were:
1. To boost and enhance the current meal delivery process to adhere to State
requirements and ensure food safety, assess the current capability of the system (meals on
wheels).
2. Identify, analyze and prioritize opportunity of improvement of the Seniors-First
meals-on-wheels system.
6. Deploying Six Sigma with a goal but no plan on how to get there
Each project had a detailed master plan that accompanied the project charter. Six
Sigma MBB, BBs and team leaders decided to follow the DMAIC cycle, which was
chosen as the standard approach for problem solving. Six Sigma project teams were
trained on using the Six Sigma tools based on the DMAIC cycle, and the plans that were
developed were more than adequate to ensure a successful project. At the end of the
65
projects, the continuous improvement effort may have subsided without the
implementation of new policy. The Six Sigma Policy Deployment model ensures
continuous improvement by using the PDCA cycle.
7. Absence of a formal change process
The Six Sigma Lifecycle model provided a well-designed and structured change
management process. Team members were trained on this approach. The Integrated Six
Sigma Policy Deployment model would have provided a clearer structure for the culture
changes required in order to standardize the recommended changes and the PDCA
aspects of daily work control that were left up to the client to consider and implement
without any formal training in this area.
8. Not having multiple projects queued up for each MBB, BB or GB the step (so
when they complete a project the next one has already been selected)
During the course of the projects, a number of mini projects and improvement
ideas were developed, which were based on the concept of continuous improvement as
follows:
FEEDS project: To continuously improve the FEEDS system in the state of
Florida and throughout the world. A total of 7 points were listed as the opportunities for
improvement.
Seniors First: To continuously provide the right meals, at the right time, to the
right person, at the right temperature. A total of 4 points were listed as the opportunities
for improvement. This step made the MBB, BBs, team leaders and GBs to get involved in
projects all the time.
66

The Integrated Policy Deployment model would have assisted the client
organizations with integrating and implementing these improvements.
9. Not communicating deployment plans effectively through the organization
Each project’s deployment was first communicated via a project charter. The
deployment plans continued via the use of tollgates at key points in the project. The
communication planning aspects of the Integrated Six Sigma Policy Deployment model
would have helped ensure the success of the communication plans in a more robust
manner by closely mapping into step # 1 of the Six Sigma Policy Deployment Model:
Selection of theme, than was done by the Six Sigma Lifecycle.
10. Lack of a detailed cultural change management program
As mentioned in item #7 above, the Integrated Policy Deployment model would
have provided a clearer structure for the culture changes required in order to standardize
the recommended changes as the PDCA aspects of daily work control were left up to the
client to consider and implement without any formal training in this area. All team
members were trained on the basics of cultural change management through simulation
and hands on experience during the course of the project.
11. Project selection process does not identify projects related to business objectives
As mentioned in items #2 and #3 above, the business objectives were aligned
during the project. The MBB, BBs and Champions met for project selection. During the
process of project selection, reasons for selection were listed for both of the projects,
which were based on the business objectives. The use of the Integrated Policy
Deployment model, had it been available at the projects inception, would have provided a
67

direct line of sight from each project to the business objectives and would have provided
a clearer integration with the organizational vision.
12. No accountability
The Six Sigma Policy Deployment model would have called for heavy Champion
involvement from the project beginning until the end on both projects. Although during
the projects, all team members and Champions were closely aligned with project tasks
using a roles and responsibilities matrix. Finally, steps 3, 5, 6, 7, 12, 15 and 17 of the Six
Sigma Policy Deployment model would have provided for direct accountability of key
team members and organizational Champions.
4.7 Summary
The preceding section discussed two of the three Six Sigma projects that were
conducted by ASQ Orlando section 1509 in cooperation with the Harrington Software
Group, Orlando. Table 4.2 discussed the steps performed in the FEEDS Six Sigma
project and table 4.3 discussed the steps performed in the Seniors First Six Sigma project.
The projects were benchmarked against the FPL QIP. The project teams were trained
with using the Six Sigma DMAIC lifecycle, tools and techniques during the projects. The
Six Sigma DMAIC lifecycle was based on FPL QIP provided the framework, which
subsequently resulted in the formulation of the integrated Six Sigma Policy Deployment
model, which was used as a final project completion checklist to ensure that all essential
items for project success had been covered using the Six Sigma Lifecycle.
68
Even though the elements in the model previously existed under different
components of Six Sigma problem solving, they had never been incorporated into one
integrated and united framework. Most of the failures discussed during the course of this
work were preemptively covered by following the 18 steps of the model, thus avoiding
project failures. The various areas where the Integrated Policy Deployment model would
have created added value are described in Section 4.6, items #1 through 12. Some of the
instances where the Six Sigma Policy Deployment model had a heavy and medium
impact on the 30 documented failures like customer expectations, vision related to
customer expectations, follow-up on the operating plan, and project alignment with the
business needs and accountability were discussed in the same section. These factors were
given the most importance during the course of the projects. Even though these two
projects created value through cycle-time reduction, process documentation and
improvement, volunteer involvement, and innovative solutions, they would have even
been more successful had the Integrated Policy Deployment model been available for use
at the project inception phase, instead of at the project conclusion phase. The volunteer
aspect of FEEDS and Seniors First projects makes the need to follow a rigid step by step
procedure which is the most important component of the new Six Sigma Policy
Deployment model.
69

CHAPTER FIVE: CONCLUSIONS
5.1 Summary
Most of the Six Sigma projects ignore the need for a Policy Deployment in order
to achieve breakthrough improvements. Many organizations have also failed to
implement the Six Sigma methodology into their daily control and strategic planning
processes. These failures may involve a complete failure or partial failure of the Six
Sigma projects. Six Sigma deployment failures have been categorized as coming from
many sources, both management and person related. Some of the key management
related failures were identified and validated against the teachings of quality experts
whose teachings are widely known and accepted. A model that reduces the potential for
Six Sigma project failures was developed and described in chapter 3. This model presents
the fourth stage of the evolution of the Six Sigma change methodology. The proposed Six
Sigma Policy Deployment model integrates the three problem solving methodologies by
setting the stage for the catch-ball activity, thus involving various levels of management.
The model is an 18 step process of a progressive circulatory system of improvement and
breakthrough by integrating Policy Deployment, the Six Sigma DMAIC problem solving
approach, and the PDCA cycle.
5.2 Conclusions
It is encouraged that all organizations consider the incorporation of the Six Sigma
Policy Deployment Model, along with concepts of defect elimination and variation
70

reduction into their processes as an organizational philosophy to help mitigate project
failures.
For continuous improvement to truly take root, organizations must understand and
realize that applying Six Sigma tools and techniques on any process will not necessarily
result in dramatic results, unless the concepts of Policy Deployment and PDCA cycle are
also institutionalized. From the literature review, it was clear that there is no such
operational framework or model that ties the three problem solving methodologies
together and proposes one single model that organizations can adopt to achieve
breakthrough improvement and prevent project failures.
The proposed model is an eighteen-step process applying a progressive
circulatory system of improvement and breakthrough based upon an integrated Six Sigma
Policy Deployment cycle that can be adopted to mitigate project failures in an
organization and achieve breakthrough improvements. Involvement of all levels of
management is very important for a Six Sigma project to be successful. This integrated
Six Sigma Policy Deployment model sets the stage for the catch-ball activity, thus
involving various levels of management.
5.3 Limitations of the Research
•
•
There are several reasons why a Six Sigma initiative can fail. Six Sigma deployment
failures related to people while important in its own right, were not discussed in this
research work. The focus in this research work was on management related failures.
Many but not all failures related to management were addressed in this work.
71
•
•
•
•
Since the need in both of the projects (FEEDS and Senior’s First) discussed as case
studies was to improve the existing process, the DMAIC cycle was followed.
Design for Six Sigma (DFSS) might be considered as an alternative model, if the
system needs to be redesigned. In that case, the middle circle in the integrated Six
Sigma Policy Deployment cycle could be replaced by the steps involved in DFSS.
The integrated Six Sigma Policy Deployment cycle will have limitations at the
department level within an organization. This is because this level of the organization
is mostly concerned with tactics rather than long-term formal strategies.
Knowledge of Policy Deployment is still very limited among organizations that seek
improvement strategies.
5.4 Recommendations for Future Research
•
•
•
The Integrated Six Sigma Policy Deployment model should be applied to additional
projects to understand the impact of the model to achieving breakthrough
improvement in organizations.
Six Sigma should not be treated as a stand-alone project instead future research
should be conducted on the benefits of an integrated Six Sigma Policy Deployment
model to enhance the critical thinking.
Involving of all levels of management is a key assumption for a Six Sigma project to
be successful, and needs further validation. This model integrates Six Sigma and
Policy Deployment ensuring that the catch-ball effect successfully involves all levels
of management.
72

• Six Sigma Policy Deployment needs a wider implementation platform among service
organizations and not for profit organizations.
73
REFERENCES
Akao, Y., “Hoshin Kanri Policy Deployment for successful TQM”, Productivity Press,
Oregon, 1991
Antony, J. and Banuelas, R., "A strategy for survival", Manufacturing Engineer, Vol. 80 No. 3, pp. 119-21, 2001 Benneyan, J. C., “SPC, Process Improvement, and the Deming PDCA circle in Freight
Administration”, Production & Inventory Management Journal; 1993, Vol. 34 Issue
Bisognano, M., "Can the guru's concepts cure health care?", Quality Progress, Sept 2004
Carnell, M., "Understanding Six Sigma Deployment Failures", The iSixSigma, 2004.
August 22, 2004, <http://www.isixsigma.com/library/content/c020916a.asp>.
Cheney, A. B., “Teams and TQM”, Business Horizons; Sep/Oct94, Vol. 37 Issue 5, p16,
10p, 1
Coronado, R .B., Antony, J., ”Critical success factors for the successful implementation
of six sigma projects in organizations”, The TQM Magazine, Bedford, 2002
Crosby, P, B., "Quality is free: the art of making quality certain", McGraw-Hill, New
York, 1979
Crosby, P, B., "Quality without tears: the art of hassle-free management", McGraw-Hill,
New York, 1984.
Costin, H., “Strategies for Quality Improvement”, The Dryden Press, Orlando, FL, 1999
DeFeo, J., and Janssen, A., “Why Strategic Deployment? ”, Measuring Business
Excellence 5,3 2001
74

DeFeo, J., “Six Sigma: a new approach to quality management”, Directorship; Dec99,
Vol. 25 Issue 11, p8, 4p
Deming, W. E.," Out of the Crisis", MIT press, Cambridge, Massachusetts, 1986
Deming, W. E.," The New Economics for Industry, Government, Education", 2nd
edition, MIT press, Massachusetts, 1994
Evans, J., and Lindsay, W., “The Management and Control of Quality”, 5th edition,
Thomson Learning, Ohio, 2002
Feigenbaum, A.V., "Total quality control", 3rd Edition, McGraw-Hill, New York, 1991
Feigenbaum, A.V., "Total quality control: Engineering and Management", McGraw-
Hill, New York, 1961
FPL-Description of Quality Improvement Program, An Internal document, Reference
#000942, 1989
Gabor, A., “Quality Revival, Part 2: Ford Embraces Six Sigma”, New York Times New
York, Jun 13, 2001
Greenall, R., “Policy Deployment –The missing link”, Manufacturing Engineer, Oct
1997
Hammer, M., and Goding, J., “Putting six sigma in perspective”, Quality Troy, Oct
2001. Vol. 40, Iss. 10, p. 58-62 (5 pp.)
Harry, M., and Schroeder, R., “Six Sigma: The Breakthrough Management Strategy
Revolutionizing the World’s Top Corporations”, 1st edition, Doubleday, New York, 2000
75
Henderson, K. M., and Evans, J. R., “Successful implementation of Six Sigma:
benchmarking General Electric Company “, Benchmarking, Bradford, 2000, Vol. 7, Iss.
4, p. 260-281
Hyde, A. C., “Six Sigma black belt: Bruce Lee as a quality management consultant?”,
Public Manager Potomac, 1999/2000, Vol. 28, Iss. 4, p. 57-59
Juran, J. M., and Godfrey, A. B., "Juran's Quality Handbook", 5th edition, McGraw-
Hill, New York, 1999
Juran, J. M., and Godfrey, A. B., "The quality control process ", McGraw-Hill, New
York, 1999
JUSE Counselor Summary Report, FPL, August 1998
Kondo, Y., “Hoshin Kanri-a participative way of quality management in Japan”, the
TQM Magazine, Bedford: 1998, Vol.10, Iss. 6, pg 425
Lee, R. G., and Dale, B. G., “Policy Deployment: modeling the CRISP process,
IMechE, Vol 214 Part B, 2000
Lewis, R., and Smith, D., “Total Quality in Higher Education”, St.Lucie Press, Delray
Beach, FL, 1994
Lucas, J. M., “The essential Six Sigma”, Quality Progress Milwaukee: Jan 2002. Vol.
35, Iss. 1, p. 27-31
Madu, C. N., “Strategic total quality management--transformation process overview”,
Total Quality Management; Sep94, Vol. 5 Issue 5, p255
Marsden, N., “The use of hoshin planning and deployment systems in the service sector:
An exploration”, Total Quality Management, 1998, Vol 9
76

Mears, P., and Voehl, F., “The executive guide to implementing quality systems”, St.
Lucie Press, Delray Beach, FL, 1995
Robinson, R., “Goal deployment: Getting everyone aiming at the same target”, Tapping
the network journal, 1995, Vol. 5, Iss. 3, pg. 8
Rucker, R., “Citibank's cycle ride to satisfaction”, Human Resource Management
International, Bradford, May/Jun 2000. Vol. 8
Tennant, C., and Roberts, P., “ Hoshin Kanri: A tool for Strategic Policy Deployment”,
Knowledge and Process Management, Vol. 8, number 4, 2001
Voehl, F., “Playing Catchball with Policy Deployment And QFD”, Research paper
no.103, 2000
Voehl, F., “Six Sigma Community Improvement Projects”, 58th Annual Quality
Congress, 2004, Vol. 58, p. 351-363
Voehl, F., "Deming: The Way We Knew Him", St. Lucie Press, Delray Beach, FL, 1994
Voehl, F., and Harrington, R., "Crosby: The Way We Knew Him", Paton Press, Chico,
CA, 2005
Voehl, F., "The Quality Theorists: In Pursuit of Total Quality", Strategy Publications
Center, Strategy Associates, Coral Springs Fl, 1998
Voehl, F., "The Six Sigma Lifecycle”, Unpublished Manuscript, The Harrington Group,
March 2003.
Walton, M., "The Deming Management Method", The Berkley Publishing group, New
York, 1986
Walton, M., " Deming Management at work", G. P. Putnam's, New York, 1990
77

Wheat, B., Mills, C., and Carnell, M., "Leaning into Six Sigma: a parable of the
journey to Six Sigma and a lean enterprise", McGraw-Hill, New York, 2003
Witcher, B., “Policy Management of Strategy (Hoshin Kanri)”, Wiley interscience, Jan
2003
Witcher, B., “ Hoshin Kanri: A study of practice in the UK”, Managerial Auditing
Journal, Bradford, 2002, Vol. 17, Iss. 7, pg. 390
Wyper, B., and Harrison, A., “Deployment of Six Sigma methodology in Human
Resource function: A case study”, Total Quality Management, Jul 2000. Vol. 11
Zahn, D., Watson, G., Voelkel, J., and Patterson, A., “What influence is the Six Sigma
movement having in Universities? What influence should it be having?”, ASQ Six Sigma
Forum Magazine, Nov 2003
78