using the psat/nmsqt and course grades in predicting
TRANSCRIPT

Using the PSAT/NMSQT
and Course Grades in
Predicting Success in the
Advanced Placement
Program®
WAYNE J. CAMARA and ROGER MILLSAP
College Board Report No. 98-4
Wayne J. Camara is executive director, Research andDevelopment, and senior research scientist, The CollegeBoard.
Roger Millsap is associate professor, Department ofPsychology, Arizona State University.
Researchers are encouraged to freely express their pro-fessional judgment. Therefore, points of view or opin-ions stated in College Board Reports do not necessarilyrepresent official College Board position or policy.
Founded in 1900, the College Board is a not-for-profiteducational association that supports academicpreparation and transition to higher education forstudents around the world through the ongoing collab-oration of its member schools, colleges, universities,educational systems and organizations.
In all of its activities, the Board promotes equitythrough universal access to high standards of teachingand learning and sufficient financial resources so thatevery student has the opportunity to succeed in collegeand work.
The College Board champions—by means of superiorresearch; curricular development; assessment; guidance,placement, and admission information; professionaldevelopment; forums; policy analysis; and publico u t r e a ch—educational excellence for all students.
Additional copies of this report may be obtained from College Board Publications, Box 886, New York, NewYork 10101-0886, (800) 323-7155. The price is $15.Please include $4 for postage and handling.
Copyright © 1998 by College Entrance ExaminationBoard. All rights reserved. College Board, AdvancedPlacement Program, AP, SAT, and the acorn logo areregistered trademarks of the College EntranceExamination Board.
Printed in the United States of America.
AcknowledgmentsWe would like to thank several College Board staffwho assisted in reviewing and shaping the research proposal and final report. These staff were extremelyhelpful in determining the types of information thathigh school counselors and faculty need in makingplacement decisions, and how data could best be formatted for this purpose. Arthur Doyle and HowardEverson, as well as numerous additional staff from theCollege Board Regional Offices helped in shaping allaspects of this work. We would also like to thankWade Curry, Rick Morgan, Brian O’Reilly, and Maureen Welsh for their comprehensive reviews andsuggestions on how to make this report more accessibleto educators. Finally, we thank Avis Hudson, whotyped many of the tables in this report, and GinnyPerrin provided invaluable assistance in preparing thefinal report.
ContentsIntroduction ........................................................1
Purpose of the Study ...............................................1
Method................................................................2
Analyses and Results ...........................................3Strength of the Relationship Between AP® Examination Grades and PSAT/NMSQT Scores .........................................3
Strength of the Relationship Between AP Examinations and High School Courses and Grades .........................................................5
Effects of Time Interval Between Testings ........10
Multiple Regressions.........................................15
Gender Differences ...........................................15
Ethnic Differences.............................................16
Using Expectancy Tables...................................16Determining Whether AP Courses Can Be Offered in a School ..............................18
Conclusion and Summary ..................................18
References..........................................................19
Appendix...........................................................20
Tables1. Cohort of Students Completing
AP Examinations in 1994 and 1995...................3
2. Correlations of PSAT/NMSQT Scores with AP Examination Grades .............................3
3. Correlations of AP Examinations with PSAT/NMSQT............................................6
4. Means and Correlations of AP ExaminationGrades with High School Courses and Grades...7
5. AP Examinations Using PSAT/NMSQT Verbal Scores....................................................11
6. AP Examinations Using PSAT/NMSQT Math Scores......................................................13
7. AP Examinations Using PSAT/NMSQT Verbal and Math Scores ...................................14
8. PSAT/NMSQT Correlations with AP Examination Grades by Time Interval Between Testings ..............................................15
9. PSAT/NMSQT Correlations by Ethnic/RacialGroups Within Gender.....................................16

This page is intentionally blank. Please continue on to the next page.
1
IntroductionThe PSAT/NMSQT, which measures developed verbaland quantitative reasoning, as well as writing skills gen-erally associated with academic achievement in college, isadministered each October to over two million students,the vast majority of whom are high school juniors andsophomores. The PSAT/NMSQT is taken by studentsplanning to attend college and serves as a useful prepara-tion for college admission tests such as the SAT®.
A revised PSAT/NMSQT was introduced in October1993; among its changes were extended reading pas-sages in the verbal section and student-produced re-sponse items and use of calculators in the math section.Scores on the PSAT/NMSQT were recentered in 1994(Camara, in preparation). The verbal and mathematicssubtests are quite similar to the SAT I: Reasoning Testsin terms of test content, format, and difficulty. Totaltesting time has been two hours (two 30-minute sectionsfor verbal and mathematics reasoning), while the SATrequires three hours of testing (two 30-minute sectionsand one 15-minute section for verbal and mathematicsreasoning each, as well as a 30-minute section used forpretesting of items and equating). In 1997, a writingskills measure was added to the PSAT/NMSQT in-creasing total testing time to 2 hours and 10 minutesand producing three separate scores, each of which isreported on a 20 to 80 scale: (1) verbal reasoning, (2) mathematical reasoning, and (3) writing skills.
Information from this test is used by high schoolcounselors and educators to assist in advising studentsin college planning and high school course selection.The PSAT/NMSQT is also used in identifying semifinal-ists for the National Merit Scholarship Corporation.Information from the test can also be very useful forhigh schools in identifying additional students who maybe successful in Advanced Placement (AP) Program®
courses, and assisting schools in determining whether tooffer additional AP courses.
AP courses provide an opportunity for students tocomplete college-level studies while still in secondaryschool and to receive advanced placement, credit, orboth, in college. About 50 percent of the nation’s21,265 high schools offer AP courses. The number ofcourses varies from school to school with an average ofmore than five courses per school (College Entrance Ex-amination Board, 1996). High schools that offer APcourses are confronted with the need to identify stu-dents who may be successful in these courses. As col-lege-level courses, AP courses are intended for studentswho have already completed relevant secondary schoolwork in the subject and have the skills and motivationto complete college-level course work during their high
school studies. Teacher recommendations, self-nomina-tion, previous courses completed, grades in relevant pre-vious high school courses, discussions with students,and scores on achievement tests are successfully used tovarying degrees by schools to identify students forplacement in AP courses. However, such proceduresmay not identify all students who can potentially benefitfrom AP courses and be successful in those courses.
Haag (1983) examined the relationship ofPSAT/NMSQT test scores to performance on several APExaminations. That study showed that there was a largespread of PSAT/NMSQT scores within each AP graderange, suggesting that students with differing levels ofscholastic aptitude have successfully completed APcourses and examinations. However, that study wasconducted for only 10 AP Examinations and with rela-tively small samples of students (less than 500) for themajority of the examinations.
Purpose of the Study This study attempts to both replicate the earlier study,using all of the AP Examinations,1 and expand on thatstudy by examining the relationship of other educa-tional indicators in predicting performance on AP Ex-aminations. Several issues not considered in the earlierstudy were examined in this effort. First, while a strongrelationship between PSAT/NMSQT scores and AP Ex-amination grades was found by Haag (1983), additionaleducational measures may be equally or more effectivein predicting success on AP Examinations. For example,a student’s previous course work, cumulative GPA, orgrades in relevant courses may be related to success inAP Examinations. The basic question is “what combi-nation of variables best predicts performance on AP Ex-aminations?” The relationship of such educational mea-sures to success in AP Examinations were explored fora subset of AP courses, as was the incremental validitycontributed by such educational measures and scoresfrom the PSAT/NMSQT.
Second, the time interval between PSAT/NMSQTand AP Examinations, as well as the student’s gradelevel (i.e., sophomore, junior, senior) may also affect therelationship between these measures and the predictionequation. The PSAT/NMSQT is administered nation-ally in mid-October of each year, primarily to juniors,but also to an increasing proportion of sophomores.2
1 There were 29 AP Examinations in 1995. Additional AP coursesand Examinations have been created since then in InternationalEnglish (1997), Statistics (1997), and Environmental Science(1998); these examinations were not included in this study.2 In 1994, 535,000 sophomores and 1,145,000 juniors took theP S A T / N M S Q T .

2
AP Examinations are administered in May of each year.PSAT/NMSQT scores should have a stronger relation-ship with AP Examinations when completed only sevenmonths earlier (in the same academic year) than whencompleted 19 months earlier (in the preceding academicyear). However, if PSAT/NMSQT scores are to beuseful for secondary school placement decisions (suchas AP placement) it is the latter relationship that will beof most interest since course scheduling is generally con-ducted at the end of the school year. However, Octoberscores could be used for AP courses conducted in thespring for schools on a semesterized block schedule.This study examines whether the strength of the rela-tionship between measures varies substantially whenthe PSAT/NMSQT is administered in the same year orthe year preceding AP courses, when placement deci-sions can be aided.
A third issue is differences based on gender. Does therelationship between PSAT/NMSQT and AP Examina-tion grades differ for males and females? This study further expands upon existing data by usingPSAT/NMSQT scores based on changes introduced in1993 and the recentered scale implemented in 1994.
MethodThis study examined the first two cohorts of studentscompleting the new PSAT/NMSQT in October 1993and October 1994. Sophomores and juniors completingthe PSAT/NMSQT in either 1993 or 1994 werematched against the AP data files for 1993-94 and1994-95 to determine if they completed one or more APExaminations. Of the more than 3.5 million sopho-mores and juniors completing the PSAT/NMSQT in1993 or 1994, 704,919 (approximately 20 percent) alsocompleted one or more AP Examinations in 1993-94 or1994-95. Next, records from these students werematched against the SAT I data base to obtain addi-tional background and the high school reported gradesand courses completed of these students. Students regis-tering for the SAT I are asked to complete an extensiveStudent Descriptive Questionnaire (SDQ), which re-quests detailed information on their background,courses, grades, college and financial plans, and otherrelated issues. This information would be important tosupplement the limited student-level data collectedthrough the PSAT/NMSQT and AP registrations. Of the704,919 students completing both the PSAT/NMSQTand AP Examinations during the specified time periods,501,469 (71 percent) also completed the SDQ prior toSeptember 1995.
Therefore, two overlapping populations were used forall subsequent analyses. First, the 704,919 students whocompleted both the PSAT/NMSQT and one or more APExaminations were used to examine the relationship be-tween these measures. Several scores from thePSAT/NMSQT were correlated with AP Examinationgrades for each course: (1) Verbal Reasoning, (2) Math-ematics Reasoning, (3) Sum of Verbal + Mathematicsand (4) 2 Verbal + Mathematics (2V+M, the selectionindex used for determining eligibility for scholarships bythe National Merit Scholarship Corporation).3 The bestpredictor from the PSAT/NMSQT was then selected foreach AP Examination to compute expectancy tables thatillustrate the proportion of students within specifie dscore ranges on the PSAT/NMSQT who achieved agrade of >3 or >4 on the AP Examination. AP grades of3 and 4 were selected for these analyses because nearlyall colleges and universities require an AP Examinationgrade of 3 or 4 for awarding credit and/or advancedplacement in college courses.
Seventy-one percent of these students (n = 501,469)also completed a SDQ when registering for the SAT bySeptember 1995. In addition to test scores, informationon these students’ cumulative high school grades, averagegrades for courses in a subject area (e.g., English, NaturalScience), and number of years of high school coursescompleted or planned to complete in a specific subject(e.g., Spanish, Calculus) or subject area (e.g., mathe-matics, foreign language) were also considered in corre-lational analyses and multiple regressions. Finally, severalpotential groups of students were identified based ontheir grade level and time between testing. Table 1 illus-trates the differences in the cohorts of students com-pleting the PSAT/NMSQT in 1993 and 1994 and the APExaminations in 1994 and 1995. All PSAT/NMSQTscores are reported on the recentered scale that was in-troduced in 1994.
The relationship between performance on thePSAT/NMSQT and AP Examinations could be moder-ated by the time interval (7 or 19 months), the student’sgrade level (i.e., sophomore, junior, or senior), or an in-teraction of these two factors. Preliminary analyseswere planned to examine the effects of each of these fac-tors using data on a sample of AP Examinations.
3 Beginning in 1997, the selection index used by the NationalMerit Scholarship Corporation for determining semifinalists isverbal score + mathematics score + writing skills score( V + M + W ) .

3
Analyses and Results
Strength of the Relationship Between AP Examination Gradesand PSAT/NMSQT ScoresProduct-moment correlations were computed betweenthe four possible scores from the PSAT/NMSQT andeach AP Examination. Table 2 reports results fromthese correlational analyses conducted on the entirepopulation of students completing both measures.There is a strong and consistent relationship betweenPSAT/NMSQT scores and AP Examination grades fornearly all courses.
The highest correlations between the PSAT/NMSQTscores and AP grades vary by AP Examination. Table 2illustrates that 2V+M and PSAT/NMSQT math eachcorrelate most strongly with grades from eight AP Ex-aminations. PSAT/NMSQT verbal has the strongest re-lationship with four AP Examinations and V+M has thestrongest relationship with five examinations. Table 3provides an overview of correlations across AP Exami-nations. The PSAT/NMSQT 2V+M scale is not includedin Table 3 because it was determined that fewer scorescales should be employed in developing expectancy ta-bles in order to reduce the probability of error and con-fusion among test users.
Table 3 shows that the relationships between four ofthe 29 AP Examinations and PSAT/NMSQT test scoresare too low to be useful. Two of these four AP Examina-tions are language tests. It is very probable that correla-tions based on the total sample of students completingAP Examinations in language are low because a substan-tial proportion of these students may be native speakers.4
If correlations were computed on only those students re-porting English as their primary language it is likely resultswould be similar to those found across other AP Exami-nations. Of the remaining 25 AP Examinations, 17 exam-inations have a correlation of greater than .50 with onePSAT/NMSQT scale, with median and mean correlationsacross all examinations of .52 or higher. Sample sizesranged from 1,588 (French literature) to 190,512 (U.S.History) and averaged 33,078 across all examinations.
TABLE 1
Cohort of Students Completing AP Examinations in 1994 and 1995
Cohort PSAT/NMSQT Date/Grade Level AP Date/Grade Level Graduating Class Time Interval Between PSAT/NMSQT and AP
1a Oct. 1993/ Jr. May 1994/Jr. 1995 7 months
1b Oct. 1993/Jr. May 1995/Sr. 1995 19 months
2a Oct. 1993/Soph. May 1994/Soph. 1996 7 months
2b Oct. 1993/ Soph. May 1995/Jr. 1996 19 months
2c Oct. 1994/Jr. May 1995/Jr. 1996 7 months
3 Oct. 1994/Soph. May 1995/Soph. 1997 7 months
4 For German language and Spanish language exams, we do notprovide expectancy tables. For French language, the correlationis lower than other AP subject areas. This effect might also re-duce the correlations for Spanish and French literature.
TABLE 2
Correlations of PSAT/NMSQT Scores with AP Examination GradesAP Art History
PSAT/NMSQT Score Mean (sd) Total Male Female
Verbal Score 52.501 (10.468) .484 .446 .509
Math Score 55.880 (10.588) .360 .352 .392
V + M 108.381 (18.630) .476 .452 .506
2V + M 160.882 (28.306) .493 .462 .520
n — 6,039 2,236 3,803
AP Biology
PSAT/NMSQT Score Mean (sd) Total Male Female
Verbal Score 52.062 (10.215) .540 .510 .568
Math Score 57.680 (10.196) .568 .527 .577
V + M 109.741 (18.096) .625 .586 .641
2V + M 161.803 (27.562) .610 .573 .630
n — 72,241 32,733 39,508
AP Calculus AB
PSAT/NMSQT Score Mean (sd) Total Male Female
Verbal Score 51.301 (10.018) .369 .368 .382
Math Score 61.093 (8.349) .558 .539 .561
V + M 112.394 (16.082) .520 .505 .524
2V + M 163.695 (25.462) .473 .463 .481
n — 94,114 48,987 45,127
AP Calculus BC
PSAT/NMSQT Score Mean (sd) Total Male Female
Verbal Score 56.485 (10.954) .325 .328 .336
Math Score 68.234 (7.046) .509 .490 .498
V + M 124.720 (15.734) .454 .445 .453
2V + M 181.205 (26.182) .409 .404 .413
n — 20,204 12,752 7,452

4
AP Chemistry
PSAT/NMSQT Score Mean (sd) Total Male Female
Verbal Score 53.184 (10.500) .443 .436 .460
Math Score 62.015 (9.417) .586 .559 .587
V + M 115.199 (17.542) .580 .559 .586
2V + M 168.383 (27.334) .542 .525 .553
n — 44,581 25,995 18,586
AP Comparative Government and Politics
PSAT/NMSQT Score Mean (sd) Total Male Female
Verbal Score 54.008 (9.871) .476 .457 .497
Math Score 58.413 (10.421) .370 .325 .392
V + M 112.421 (17.949) .477 .443 .497
2V + M 166.429 (27.029) .490 .461 .510
n — 6,157 3,296 2,861
AP Computer Science A
PSAT/NMSQT Score Mean (sd) Total Male Female
Verbal Score 51.494 (10.832) .409 .412 .428
Math Score 61.113 (9.454) .551 .540 .555
V + M 112.607 (17.813) .541 .540 .543
2V + M 164.101 (27.927) .504 .504 .511
n — 8,308 6,429 1,879
AP Computer Science AB
PSAT/NMSQT Score Mean (sd) Total Male Female
Verbal Score 56.393 (10.727) .422 .428 .437
Math Score 66.917 (8.276) .508 .502 .567
V + M 123.310 (16.564) .525 .525 .562
2V + M 179.703 (26.765) .496 .499 .523
n — 5,809 5,098 711
AP English Language
PSAT/NMSQT Score Mean (sd) Total Male Female
Verbal Score 52.192 (9.864) .654 .661 .641
Math Score 55.799 (10.550) .490 .514 .469
V + M 107.991 (18.076) .643 .659 .630
2V + M 160.183 (27.144) .666 .678 .652
n — 63,408 38,686 24,722
AP English Literature
PSAT/NMSQT Score Mean (sd) Total Male Female
Verbal Score 52.851 (9.48) .668 .654 .682
Math Score 56.856 (10.315) .464 .458 .501
V + M 109.707 (17.616) .631 .626 .659
2V + M 162.559 (26.343) .662 .654 .685
n — 126,072 45,950 80,122
AP European History
PSAT/NMSQT Score Mean (sd) Total Male Female
Verbal Score 54.646 (9.849) .512 .497 .530
Math Score 57.531 (10.059) .416 .383 .425
V + M 112.178 (17.463) .528 .500 .542
2V + M 166.824 (26.509) .538 .514 .552
n — 58,491 28,411 30,080
AP French Language
PSAT/NMSQT Score Mean (sd) Total Male Female
Verbal Score 55.266 (10.610) .349 .294 .376
Math Score 59.383 (10.429) .247 .181 .283
V + M 114.648 (18.877) .333 .266 .367
2V + M 169.914 (28.794) .347 .283 .379
n — 13,834 4,217 9,617
AP French Literature
PSAT/NMSQT Score Mean (sd) Total Male Female
Verbal Score 58.084 (10.669) .442 .427 .456
Math Score 61.426 (9.839) .313 .263 .362
V + M 119.510 (18.346) .425 .392 .458
2V + M 177.595 (28.345) .441 .413 .468
n — 1,588 462 1,126
AP Latin Literature
PSAT/NMSQT Score Mean (sd) Total Male Female
Verbal Score 57.138 (9.995) .463 .441 .488
Math Score 61.700 (9.440) .410 .396 .460
V + M 118.838 (17.108) .497 .476 .538
2V + M 175.976 (26.383) .498 .475 .533
n — 2,041 1,021 1,020
AP Latin Vergil
PSAT/NMSQT Score Mean (sd) Total Male Female
Verbal Score 56.585 (10.039) .478 .471 .487
Math Score 61.058 (9.623) .417 .416 .450
V + M 117.643 (17.349) .508 .503 .529
2V + M 174.227 (26.663) .510 .504 .527
n — 3,878 2,042 1,836
AP Macroeconomics
PSAT/NMSQT Score Mean (sd) Total Male Female
Verbal Score 52.901 (10.223) .472 .457 .501
Math Score 60.109 (10.121) .521 .487 .531
V + M 113.061 (17.990) .561 .534 .578
2V + M 165.923 (27.453) .544 .520 .564
n — 12,424 7,288 5,136
AP Microeconomics
PSAT/NMSQT Score Mean (sd) Total Male Female
Verbal Score 52.993 (10.123) .459 .458 .466
Math Score 60.421 (9.918) .523 .501 .530
V + M 113.414 (17.655) .557 .543 .561
2V + M 166.406 (27.018) .536 .525 .541
n — 9,926 5,831 4,095
AP Music
PSAT/NMSQT Score Mean (sd) Total Male Female
Verbal Score 53.002 (10.994) .336 .340 .329
Math Score 58.340 (11.006) .466 .448 .480
V + M 111.342 (19.740) .447 .436 .452
2V + M 164.343 (29.999) .417 .411 .418
n — 2,487 1,225 1,262
AP Physics B
PSAT/NMSQT Score Mean (sd) Total Male Female
Verbal Score 53.138 (10.491) .374 .377 .398
Math Score 62.726 (8.796) .520 .501 .513
V + M 115.864 (16.812) .505 .496 .512
2V + M 169.003 (26.609) .466 .461 .480
n — 19,846 12,822 7,024

5
AP Physics C: Mechanics
PSAT/NMSQT Score Mean (sd) Total Male Female
Verbal Score 55.074 (10.800) .410 .407 .449
Math Score 66.193 (8.376) .594 .570 .617
V + M 121.266 (16.906) .556 .541 .584
2V + M 176.340 (27.106) .510 .499 .543
n — 9,784 7,183 2,601
AP Physics C: Electricity and Magnetism
PSAT/NMSQT Score Mean (sd) Total Male Female
Verbal Score 56.481 (10.746) .335 .345 .398
Math Score 67.971 (7.760) .476 .448 .532
V + M 124.452 (16.209) .461 .443 .509
2V + M 180.934 (26.386) .426 .412 .475
n — 4,887 3,728 1,159
AP Psychology
PSAT/NMSQT Score Mean (sd) Total Male Female
Verbal Score 51.027 (9.878) .558 .538 .567
Math Score 55.241 (10.681) .499 .487 .516
V + M 106.267 (18.234) .595 .580 .607
2V + M 157.295 (27.313) .599 .582 .609
n — 11,581 4,186 7,395
AP Spanish Literature
PSAT/NMSQT Score Mean (sd) Total Male Female
Verbal Score 47.838 (13.024) .313 .309 .326
Math Score 51.773 (13.399) .229 .224 .262
V + M 99.611 (24.864) .287 .284 .311
2V + M 147.449 (37.365) .301 .297 .320
n — 4,041 1,333 2,708
AP U.S. Government and Politics
PSAT/NMSQT Score Mean (sd) Total Male Female
Verbal Score 52.315 (9.822) .558 .536 .583
Math Score 57.080 (10.425) .467 .418 .485
V + M 109.395 (17.928) .577 .539 .598
2V + M 161.710 (26.928) .587 .554 .601
n — 34,679 17,158 17,521
AP U.S. History
PSAT/NMSQT Score Mean (sd) Total Male Female
Verbal Score 53.900 (9.354) .551 .528 .575
Math Score 58.972 (9.839) .414 .366 .431
V + M 112.872 (16.853) .548 .510 .567
2V + M 166.771 (25.422) .566 .532 .586
n — 190,512 87,524 102,988
When the 2V+M scale is eliminated, the strongestcorrelations are between the V+M scale and gradesfrom ten AP Examinations, and the verbal and mathe-matics scales and seven and eight AP Examinations re-spectively. In addition, students completing AP Exami-nations have higher scores on the PSAT/NMSQTmathematics scale than they do on the verbal scale. Thisfinding is consistent across all AP Examinations, in-cluding English, humanities, and language examina-tions, which have substantially stronger relationshipswith the verbal scale than the mathematics scale. An-other distinct pattern that emerges is that correlationsbetween PSAT/NMSQT math scores and AP math andscience examinations appear stronger than correlationsfor AP Examinations where the PSAT/NMSQT verbalscale is the strongest predictor.
Strength of the Relationship Between AP Examinations andHigh School Courses and Grades The SDQ data were examined to determine their rela-tionship to performance on specific AP Examinations.Table 4 provides the correlation of high school grades,grades in the subject, and number of courses completedin a subject with AP Examinations. High school gradesare negatively coded so correlations with AP are n e g a t i v e .5 Course grades reflect students’ average self-reported grades in a subject area with A = 4, B = 3, C =2, D = 1, and E/F = 0. Grades are reported separately forsix broad subject areas: (1) Arts and Music, (2) English,(3) Foreign and Classical Languages, (4) Mathematics,(5) Natural Sciences (e.g., biology, chemistry, physics),and (6) Social Sciences and History (e.g., psychology, Eu-ropean history, government, economics). The number ofcourses in each of those six broad areas as well as specificsubjects (e.g., algebra, Spanish, computer science) arealso reported. For each AP Examination, only correla-tions with relevant courses and subject areas are re-ported. For example, on AP Art History, correlationswith number of courses and grades in Arts and Music arereported, along with total grades, while correlations withMathematics and Natural Sciences are not reported.
Overall, correlations of AP Examination grades withthe strongest PSAT/NMSQT scores were consistentlyhigher than correlations with high school grades andcourses completed. The best predictor from thePSAT/NMSQT had an average correlation of .518 withthe respective AP Examinations, while the next best pre-
5 A+ = 1, A = 2, A- = 3, B+ = 4, B = 5, B- = 6, C+ = 8, C = 9, C- = 10, D = 11, and E/F = 12.

6
dictor was total high school grades with a mean corre-lation of only .267 for the same 25 AP Examinations.
The correlation of total grades was strongest for APPsychology (.392), AP Biology (.345), AP Art History(.315), and two AP Economics Examinations (.303 and.299); however this was still well below the correlationwith PSAT/NMSQT scores. The correlation of highschool grades had moderate, but typically lower corre-lations with performance on a number of AP Examina-tions; correlations over .25 or more were found for 10of the 29 areas.6 The number of high school courses inrelated subjects had the lowest overall correlations with
AP Examinations. Most correlations were below .10with no practical significance, and only Spanish coursesand Art and Music courses related to AP Examinationgrades in those two subjects at .20 or above.
TABLE 3
Correlations of AP Examinations with PSAT/NMSQT Scores
sampleAPExamination size PSAT/NMSQT V PSAT/NMSQT M PSAT/NMSQT V + M
Art History 6,039 .4838 .3599 .4764
Biology 72,241 .5398 .5678 .6246
Calculus AB 94,114 .3689 .5584 .5197
Calculus BC 20,204 .3247 .5087 .4539
Chemistry 44,581 .4431 .5858 .5797
Comparative Government & Politics 6,157 .4758 .3704 .4767
Computer Science A 8,308 .4089 .5508 .5410
Computer Science AB 5,809 .4224 .5083 .5247
English Language 63,408 .6537 .4897 .6425
English Literature 126,072 .6678 .4641 .6311
European History 58,491 .5120 .4157 .5282
French Language 13,834 .3494 .2465 .3326
French Literature 1,588 .4423 .3128 .4249
German Language* 3,064 .1196 .0365 .0878
Latin Literature 2,041 .4631 .4100 .4968
Latin Vergil 3,878 .4776 .4167 .5075
Macroeconomics 12,424 .4718 .5212 .5614
Microeconomics 9,926 .4585 .5232 .5569
Music 2,487 .3361 .4660 .4471
Physics B 19,846 .3735 .5199 .5051
Physics C: Mechanics 9,784 .4099 .5940 .5561
Physics C: Electricity and Magnetism 4,887 .3516 .4761 .4610
Psychology 11,581 .5583 .4991 .5948
Spanish Language* 34,904 -.0063 -.0919 -.0545
Spanish Literature 4,041 .3134 .2287 .2874
Studio Art: Design* 4,026 .0899 .1359 .1269
Studio Art: Drawing* 1,892 .1182 .1792 .1667
U.S. Government and Politics 34,679 .5581 .4668 .5772
U.S. History 190,512 .5513 .4137 .5475
* Correlations too low to be useful.Bold number indicates highest correlation among PSAT/NMSQT scores.Boxed number indicates one preferred model for estimating expected grades on AP Examinations from PSAT/NMSQT V, M, or V+M.
6 The 10 areas included: AP Psychology, Government and Poli-tics, U.S. History and European History (correlating with SocialScience grades); AP Biology, Chemistry, and Physics C: Me-chanics (correlating with Natural Science grades); AP ComputerScience (correlating with Math grades); AP English Languageand English Literature (correlating with English grades).

7
TABLE 4
Means and Correlations of AP Examination Grades with High School Courses and Grades
Art History Mean sd n Correlation with AP Score
AP Score 3.34 1.15 3,461 1.000
High School Grades* 3.22 1.53 3,366 -0.315
Art Courses 2.49 1.29 3,256 0.101
Art Grades** 3.86 0.37 3,123 0.145
Biology Mean sd n Correlation with AP Score
AP Score 3.27 1.27 38,315 1.000
High School Grades* 2.69 1.36 37,749 -0.345
Biology Courses 1.76 0.56 36,479 0.083
Natural Science Courses 4.31 1.37 37,859 0.139
Natural Science Grade** 3.70 0.49 37,594 0.330
Calculus AB Mean sd n Correlation with AP Score
AP Score 2.87 1.31 73,113 1.000
High School Grades* 2.48 1.27 72,185 -0.247
Math Grades** 3.73 0.47 72,042 0.247
Calculus Courses 1.01 0.40 66,370 0.130
Algebra Courses 1.46 0.65 69,332 -0.012
Total Math Courses 5.01 1.63 72,274 0.057
Calculus BC Mean sd n Correlation with AP Score
AP Score 3.51 1.35 15,229 1.000
High School Grades* 2.16 1.09 14,977 -0.208
Math Grades** 3.86 0.36 14,980 0.227
Calculus Courses 1.22 0.55 14,155 0.044
Algebra Courses 1.39 0.70 14,184 -0.003
Total Math Courses 5.37 2.06 14,986 0.045
Chemistry Mean sd n Correlation with AP Score
AP Score 3.00 1.29 23,187 1.000
High School Grades* 2.35 1.24 22,867 -0.287
Natural Science Courses 4.54 1.45 22,908 0.143
Natural Science Grades** 3.81 0.42 22,796 0.272
Chemistry Courses 1.78 0.54 22,120 0.108
Comparative Government and Politics Mean sd n Correlation with AP Score
AP Score 3.03 1.18 4,546 1.000
High School Grades* 2.83 1.46 4,496 -0.254
U.S. Government Courses 0.87 0.42 4,015 0.059
Total Social Science Courses 4.02 1.54 4,491 0.069
Social Science Grades** 3.75 0.46 4,467 0.243
Computer Science A Mean sd n Correlation with AP Score
AP Score 2.53 1.38 4,215 1.000
High School Grades* 2.91 1.62 4,140 -0.254
Computer Math Courses 0.92 0.95 3,188 0.045
Math Grades** 3.63 0.57 4,132 0.276
Total Math Courses 5.56 2.12 4,173 0.099
Computer Science AB Mean sd n Correlation with AP Score
AP Score 3.36 1.38 3,053 1.000
High School Grades* 2.70 1.52 3,005 -0.225
Computer Math Courses 1.11 1.03 2,383 -0.018
Math Grades** 3.74 0.50 2,992 0.218
Total Math Courses 5.96 2.22 3,011 0.062
* Grades are negatively coded (A + = 1, A = 2, A – = 3…D = 11, E/F = 12). ** A = 4, B = 3, C = 2, D = 1, E/F = 0.

8
English Language Mean sd n Correlation with AP Score
AP Score 3.06 1.07 27,637 1.000
High School Grades* 2.59 1.36 27,276 -0.279
English Language Courses 3.91 0.31 26,302 0.053
English Language Grades** 3.71 0.48 27,229 0.284
English Literature Mean sd n Correlation with AP Score
AP Score 3.21 1.09 101,838 1.000
High School Grades* 2.67 1.37 100,457 -0.279
English Literature Courses 3.91 0.33 96,141 0.057
English Literature Grades** 3.72 0.47 100,411 0.259
European History Mean sd n Correlation with AP Score
AP Score 3.25 1.09 21,198 1.000
High School Grades* 2.75 1.41 20,801 -0.262
European History Courses 1.00 0.41 19,009 0.071
Social Science Grades** 3.75 0.46 20,749 0.276
Total Social Science Courses 4.24 1.57 20,913 0.019
French Language Mean sd n Correlation with AP Score
AP Score 2.92 1.21 8,673 1.000
High School Grades* 2.66 1.29 8,456 -0.147
French Courses 3.84 0.47 8,122 -0.031
Language Grades 3.79 0.43 8,472 0.176
French Literature Mean sd n Correlation with AP Score
AP Score 3.26 1.30 1,045 1.000
High School Grades* 2.80 1.28 999 -0.224
French Courses 3.85 0.49 953 -0.020
Language Grades** 3.79 0.42 1,004 0.152
Latin Vergil Mean sd n Correlation with AP Score
AP Score 2.97 1.28 1,795 1.000
High School Grades* 2.56 1.30 1,747 -0.299
Latin Courses 3.73 0.53 1,692 0.103
Language Grades** 3.79 0.43 1,753 0.219
Latin Literature Mean sd n Correlation with AP Score
AP Score 2.89 1.33 1,073 1.000
High School Grades* 2.62 1.28 1,038 -0.226
Latin Courses 3.77 0.50 999 0.088
Language Grades** 3.79 0.44 1,043 0.178
Macroeconomics Mean sd n Correlation with AP Score
AP Score 3.09 1.26 9,128 1.000
High School Grades* 2.70 1.43 8,991 -0.299
Economics Courses 0.71 0.40 7,958 0.069
Total Social Science Courses** 3.71 0.48 8,941 0.250
Total Math Courses 4.80 1.77 8,994 0.110
Microeconomics Mean sd n Correlation with AP Score
AP Score 3.05 1.26 7,176 1.000
High School Grades* 2.70 1.44 7,064 -0.303
Economics Courses 0.75 0.42 6,262 0.048
Total Social Science Courses** 3.72 0.48 7,020 0.211
Total Math Courses 4.83 1.80 7,069 0.082
Music Theory Mean sd n Correlation with AP Score
AP Score 3.29 1.16 1,343 1.000
High School Grades* 3.10 1.66 1,309 -0.269
Art Courses 3.54 0.93 1,268 0.085
Art Grades** 3.97 0.17 1,287 0.064
Total Art Courses 4.62 1.74 1,328 0.132* Grades are negatively coded (A + = 1, A = 2, A – = 3…D = 11, E/F = 12). ** A = 4, B = 3, C = 2, D = 1, E/F = 0.

Physics B Mean sd n Correlation with AP Score
AP Score 2.83 1.29 12,420 1.000
High School Grades* 2.49 1.30 12,256 -0.221
Total Math 5.07 1.98 12,255 0.098
Physics Courses 1.27 0.56 11,587 0.114
Total Natural Science Courses 4.26 1.36 12,267 0.117
Natural Sciences Grade 3.77 0.45 12,211 0.233
Physics C: Mechanics Mean sd n Correlation with AP Score
AP Score 3.31 1.34 7,916 1.000
High School Grades* 2.39 1.27 7,795 -0.266
Total Math Courses 5.28 2.00 7,799 0.096
Physics Courses 1.53 0.62 7,459 0.168
Total Natural Science Courses 4.49 1.50 7,805 0.150
Natural Science Grades** 3.82 0.41 7,771 0.260
Physics C: Electricity & Magnetism Mean sd n Correlation with AP Score
AP Score 3.25 1.47 4,020 1.000
High School Grades* 2.37 1.26 3,945 -0.235
Total Math Courses 5.41 2.13 3,960 0.049
Physics Courses 1.65 0.63 3,820 0.119
Total Natural Science Courses 4.67 1.63 3,966 0.102
Natural Science Grades** 3.83 0.39 3,936 0.250
Psychology Mean sd n Correlation with AP Score
AP Score 3.42 1.22 6,991 1.000
High School Grades* 3.10 1.54 6,867 -0.392
Psychology Courses 0.90 0.47 6,066 -0.008
Total Social Science Courses 4.41 1.58 6,918 0.003
Social Science Grades** 3.64 0.52 6,848 0.284
Spanish Language Mean sd n Correlation with AP Score
AP Score 3.34 1.23 19,824 1.000
High School Grades* 2.88 1.52 19,494 0.012
Spanish Courses 3.66 0.74 18,445 -0.240
Language Grades** 3.78 0.44 19,441 0.107
Spanish Literature Mean sd n Correlation with AP Score
AP Score 3.41 1.08 2,512 1.000
High School Grades* 3.15 1.60 2,440 -0.240
Spanish Courses 3.60 0.77 2,283 -0.063
Language Grades** 3.77 0.44 2,426 0.203
Studio Art: Design Mean sd n Correlation with AP Score
AP Score 3.26 1.09 2,791 1.000
High School Grades* 3.82 1.76 2,711 -0.148
Art Courses 3.46 0.83 2,568 0.106
Art Grades** 3.94 0.25 2,729 0.066
Studio Art: Drawing Mean sd n Correlation with AP Score
AP Score 3.29 1.16 1,232 1.000
High School Grades* 3.80 1.76 1,204 -0.147
Art Courses 3.41 0.89 1,127 0.204
Art Grades** 3.93 0.26 1,206 0.058
U.S. Government and Politics Mean sd n Correlation with AP Score
AP Score 3.07 1.09 27,120 1.000
High School Grades* 2.72 1.43 26,804 -0.297
U.S. Government Courses 0.77 0.38 24,336 0.036
Total Social Science Courses 3.88 1.42 26,832 0.057
Social Science Grades** 3.74 0.46 26,631 0.281* Grades are negatively coded (A + = 1, A = 2, A – = 3…D = 11, E/F = 12).
** A = 4, B = 3, C = 2, D = 1, E/F = 0.9

10
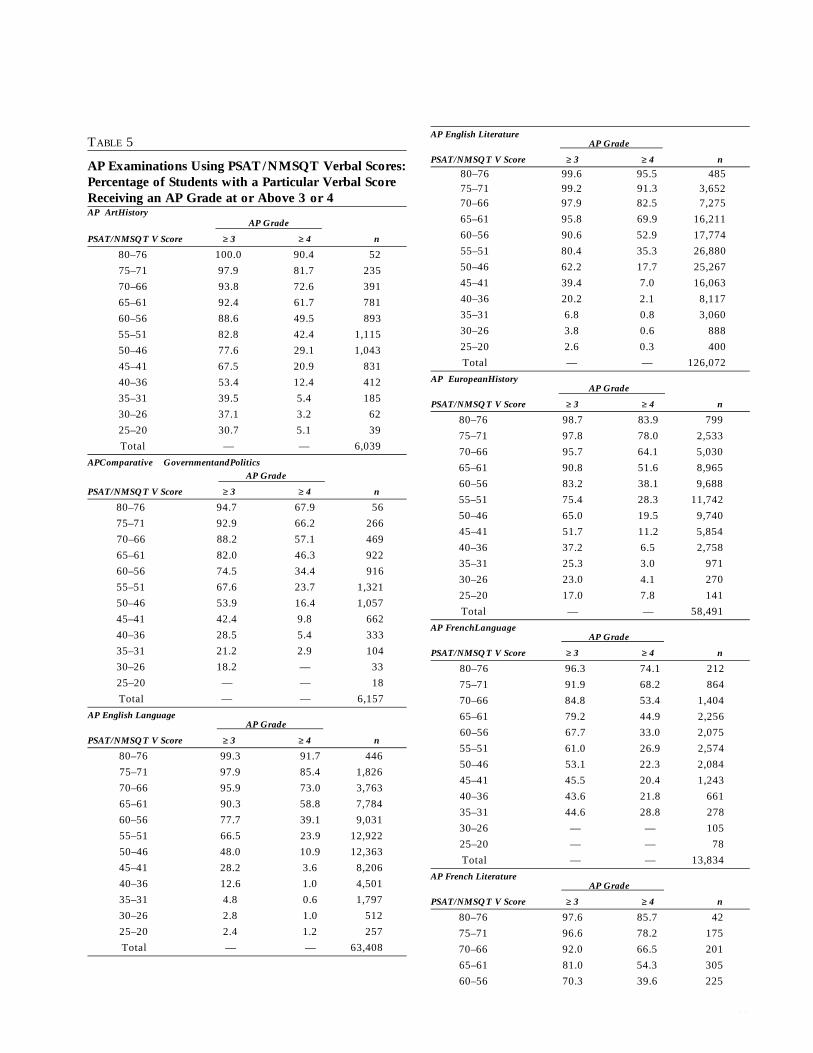
Tables 5 through 7 illustrate the relationship be-tween PSAT/NMSQT scores and AP Examinationgrades of greater than or equal to 3 and greater than orequal to 4. As noted earlier, AP grades are reported ona 1 to 5 scale with values of 3 or 4 most often used bycolleges and universities for awarding credit or advanced placement. For most AP courses, studentswith moderate scores on the PSAT/NMSQT have a highprobability of success on the examinations. For ex-ample, a majority of students with PSAT/NMSQTverbal scores of 46–50 received grades of 3 or above onnearly all of the 25 AP Examinations studied, whileover one-third of students with scores of 41–45achieved grades of 3 or above on five AP Examinations.
An additional constraint in correlating high schoolgrades and AP Examination grade is the restriction inrange found in estimated high school grade-point average(i.e., total grades), and grades in specific high school sub-ject areas (e.g., mathematics, science) for students in thissample, but also for college-bound students generally.Over 37 percent of college-bound students reported anaverage high school GPA of A in 1997, compared to only28 percent in 1987 (College Entrance ExaminationBoard, 1997). Students completing AP Examinations areamong the most highly motivated and highest ability stu-dents nationally. Table 4 illustrates that the mean highschool grades were between A and A- for AP studentscompleting 23 of the 29 AP Examinations.
There are substantial variations across AP subjectsthat must be considered. For example, a smaller pro-portion of students with PSAT/NMSQT mathematicsscores below 56 attained scores of 3 or above on APPhysics and Chemistry Examinations than for mostother AP Exams, while a larger proportion of studentswith PSAT/NMSQT verbal scores of 41 and abovereached grades of 3 or higher on AP Art History, Psy-chology, and English Literature Examinations.
Effects of Time Interval Between TestingsThe next set of analyses examined the effects of the timeinterval between completion of the PSAT/NSMQT and
AP Examination (7 or 19 months). That is, are therestatistical, and more important, practical differences be-tween correlations of assessments completed in thesame school year (seven-month interval) versus the pre-ceding school years (19-month interval)? AP Examina-tions in U.S. History, English Literature, and CalculusAB were selected because the largest number of studentscomplete these examinations each year, providing ade-quate samples for subgroup analyses. In addition, theseexaminations represent slightly different curriculumareas in high schools.
Table 8 illustrates the correlations betweenPSAT/NMSQT scores and AP Examination grades inthese three subjects. The 19-month interval includes co-horts 1b, 2b, and 3 from Table 1, while the 7-month in-terval includes cohorts 1a, 2a, and 2c. Correlations formales, females, and total test takers in each group weretested for significance. For total test takers, there was as i g n i ficant effect for AP U.S. History but in the oppositedirection than expected. Correlations between PSAT/NMSQT and AP U.S. History grades were actuallyhigher when there was a greater interval between testing,r = .490 (19-month interval) versus r = .446 (7-month in-terval) (significant at p >.001). This effect was found sep-arately for both males and females. However, there wasno significant difference for time interval between assess-ments for AP English Literature or AP Calculus AB.There was a significant effect for females on the math ex-amination (p >.05), but when examining the magnitudeof correlations for practical significance it is evident thatthere is no practical difference attributed to time interval.
The primary reason for conducting these analyseswas to determine whether separate analyses would berequired for students completing the PSAT/NMSQT ayear prior to the AP Examination. If correlations wereconsistently stronger for students completing both as-sessments in the same year, then results based on thetotal test takers would overestimate the strength of therelationship for students completing the PSAT/NMSQTone year prior to the AP Examination. Because we aremost interested in determining the utility of usingPSAT/NMSQT test scores in assisting with placementdecisions in AP courses, the cohort with a 19-monthtime interval is of most interest.
U.S. History Mean sd n Correlation with AP Score
AP Score 3.09 1.12 68,804 1.000
High School Grades* 2.57 1.32 67,882 -0.275
U.S. History 1.14 0.42 65,066 0.045
Total Social Science Courses 3.90 1.47 68,089 0.050
Social Science Grades 3.75 0.46 67,600 0.298
* Grades are negatively coded (A + = 1, A = 2, A – = 3…D = 11, E/F = 12). ** A = 4, B = 3, C = 2, D =1, E/F = 0.
11
TABLE 5
AP Examinations Using PSAT/NMSQT Verbal Scores:Percentage of Students with a Particular Verbal ScoreReceiving an AP Grade at or Above 3 or 4AP ArtHistory
AP Grade
PSAT/NMSQT V Score ≥ 3 ≥ 4 n
80–76 100.0 90.4 52
75–71 97.9 81.7 235
70–66 93.8 72.6 391
65–61 92.4 61.7 781
60–56 88.6 49.5 893
55–51 82.8 42.4 1,115
50–46 77.6 29.1 1,043
45–41 67.5 20.9 831
40–36 53.4 12.4 412
35–31 39.5 5.4 185
30–26 37.1 3.2 62
25–20 30.7 5.1 39
Total — — 6,039
APComparative GovernmentandPolitics
AP Grade
PSAT/NMSQT V Score ≥ 3 ≥ 4 n
80–76 94.7 67.9 56
75–71 92.9 66.2 266
70–66 88.2 57.1 469
65–61 82.0 46.3 922
60–56 74.5 34.4 916
55–51 67.6 23.7 1,321
50–46 53.9 16.4 1,057
45–41 42.4 9.8 662
40–36 28.5 5.4 333
35–31 21.2 2.9 104
30–26 18.2 — 33
25–20 — — 18
Total — — 6,157
AP English LanguageAP Grade
PSAT/NMSQT V Score ≥ 3 ≥ 4 n
80–76 99.3 91.7 446
75–71 97.9 85.4 1,826
70–66 95.9 73.0 3,763
65–61 90.3 58.8 7,784
60–56 77.7 39.1 9,031
55–51 66.5 23.9 12,922
50–46 48.0 10.9 12,363
45–41 28.2 3.6 8,206
40–36 12.6 1.0 4,501
35–31 4.8 0.6 1,797
30–26 2.8 1.0 512
25–20 2.4 1.2 257
Total — — 63,408
AP English LiteratureAP Grade
PSAT/NMSQT V Score ≥ 3 ≥ 4 n
80–76 99.6 95.5 485
75–71 99.2 91.3 3,652
70–66 97.9 82.5 7,275
65–61 95.8 69.9 16,211
60–56 90.6 52.9 17,774
55–51 80.4 35.3 26,880
50–46 62.2 17.7 25,267
45–41 39.4 7.0 16,063
40–36 20.2 2.1 8,117
35–31 6.8 0.8 3,060
30–26 3.8 0.6 888
25–20 2.6 0.3 400
Total — — 126,072
AP EuropeanHistoryAP Grade
PSAT/NMSQT V Score ≥ 3 ≥ 4 n
80–76 98.7 83.9 799
75–71 97.8 78.0 2,533
70–66 95.7 64.1 5,030
65–61 90.8 51.6 8,965
60–56 83.2 38.1 9,688
55–51 75.4 28.3 11,742
50–46 65.0 19.5 9,740
45–41 51.7 11.2 5,854
40–36 37.2 6.5 2,758
35–31 25.3 3.0 971
30–26 23.0 4.1 270
25–20 17.0 7.8 141
Total — — 58,491
AP FrenchLanguageAP Grade
PSAT/NMSQT V Score ≥ 3 ≥ 4 n
80–76 96.3 74.1 212
75–71 91.9 68.2 864
70–66 84.8 53.4 1,404
65–61 79.2 44.9 2,256
60–56 67.7 33.0 2,075
55–51 61.0 26.9 2,574
50–46 53.1 22.3 2,084
45–41 45.5 20.4 1,243
40–36 43.6 21.8 661
35–31 44.6 28.8 278
30–26 — — 105
25–20 — — 78
Total — — 13,834
AP French LiteratureAP Grade
PSAT/NMSQT V Score ≥ 3 ≥ 4 n
80–76 97.6 85.7 42
75–71 96.6 78.2 175
70–66 92.0 66.5 201
65–61 81.0 54.3 305
60–56 70.3 39.6 225

12
AP French Literature (cont.)AP Grade
PSAT/NMSQT V Score ≥ 3 ≥ 4 n
55–51 66.4 31.2 271
50–46 53.6 21.2 177
45–41 47.4 13.4 97
40–36 31.6 7.7 60
35–31 — — 19
30–26 — — 9
25–20 — — 7
Total — — 1,588
AP Latin LiteratureAP Grade
PSAT/NMSQT V Score ≥ 3 ≥ 4 n
80–76 90.7 68.8 32
75–71 88.1 60.5 185
70–66 86.5 56.5 230
65–61 75.0 40.1 384
60–56 62.4 26.4 314
55–51 51.3 18.5 355
50–46 50.4 14.5 302
45–41 38.8 8.6 139
40–36 27.7 1.5 65
35–31 18.5 — 27
30–26 — — 5
25–20 — — 3
Total — — 2,041
AP Latin VergilAP Grade
PSAT/NMSQT V Score ≥ 3 ≥ 4 n
80–76 93.8 80.0 65
75–71 89.8 67.6 306
70–66 86.2 57.5 442
65–61 77.7 43.6 660
60–56 68.0 31.8 616
55–51 57.2 23.5 697
50–46 50.6 17.7 554
45–41 36.0 6.7 345
40–36 27.6 8.2 134
35–31 17.1 4.3 47
30–26 — — 5
25–20 — — 7
Total — — 3,878
AP PsychologyAP Grade
PSAT/NMSQT V Score ≥ 3 ≥ 4 n
80–76 98.0 94.1 51
75–71 98.1 92.5 266
70–66 97.6 86.8 554
65–61 95.1 79.0 1,326
60–56 91.0 67.9 1,479
55–51 84.9 55.2 2,306
50–46 73.6 42.3 2,272
45–41 59.3 27.7 1,742
40–36 42.1 16.5 1,009
APPsychology (cont.)AP Grade
PSAT/NMSQT V Score ≥ 3 ≥ 4 n
35–31 28.1 9.2 380
30–26 15.0 4.5 133
25–20 20.7 4.8 63
Total — — 11,581
AP U.S. HistoryAP Grade
PSAT/NMSQT V Score ≥ 3 ≥ 4 n
80–76 95.1 83.0 1,480
75–71 93.6 78.2 5,448
70–66 87.7 66.5 11,863
65–61 80.3 54.3 23,977
60–56 68.1 39.6 28,211
55–51 59.9 31.2 38,472
50–46 47.4 21.2 36,164
45–41 35.0 13.4 24,278
40–36 23.8 7.7 13,165
35–31 14.7 4.8 5,167
30–26 9.6 2.9 1,543
25–20 7.8 2.4 744
Total — — 190,51
APU.S. Governmentand PoliticsAP Grade
PSAT/NMSQT V Score ≥ 3 ≥ 4 n
80–76 98.2 84.6 162
75–71 97.4 81.8 1,083
70–66 94.7 69.0 2,084
65–61 90.1 55.8 4,523
60–56 82.7 43.4 4,699
55–51 74.0 32.7 7,160
50–46 59.9 19.5 6,752
45–41 42.8 11.0 4,540
40–36 27.1 5.3 2,325
35–31 15.8 2.6 912
30–26 12.0 2.6 308
25–20 6.9 2.3 131
Total — — 34,679
AP Spanish LiteratureAP Grade
PSAT/NMSQT V Score ≥ 3 ≥ 4 n
80–76 100.0 82.6 23
75–71 97.0 80.1 136
70–66 95.7 68.1 210
65–61 91.1 61.2 415
60–56 90.7 53.6 407
55–51 84.3 47.8 550
50–46 77.9 43.0 581
45–41 76.1 39.6 523
40–36 77.2 37.1 461
35–31 73.9 31.3 326
30–26 70.4 30.1 216
25–20 55.9 17.6 193
Total — — 4,041

13
TABLE 6
AP Examinations Using PSAT/NMSQT Math Scores:Percentage of Students with a Particular Math ScoreReceiving an AP Grade at or Above 3 or 4
AP Calculus ABAP Grade
PSAT/NMSQT M Score ≥ 3 ≥ 4 n
80–76 97.1 87.0 2,539
75–71 92.1 71.7 9,846
70–66 82.1 52.2 17,984
65–61 68.3 33.8 23,844
60–56 52.9 19.9 17,286
55–51 38.2 11.0 11,011
50–46 24.5 5.3 6,873
45–41 15.6 2.8 3,051
40–36 9.1 2.0 1,175
35–31 6.0 1.3 383
30–26 9.2 4.6 109
25–20 — — 13
Total — — 94,114
APCalculus BCAP Grade
PSAT/NMSQT M Score ≥ 3 ≥ 4 n
80–76 97.1 86.9 3,087
75–71 92.1 70.4 5,716
70–66 82.4 51.1 5,315
65–61 69.6 33.2 3,621
60–56 58.2 23.1 1,460
55–51 42.7 12.3 612
50–46 35.0 12.8 257
45–41 30.0 10.0 90
40–36 17.6 0.0 34
35–31 — — 7
30–26 — — 4
25–20 — — 1
Total — — 20,204
AP ChemistryAP Grade
PSAT/NMSQT M Score ≥ 3 ≥ 4 n
80–76 95.4 81.2 2,812
75–71 89.9 63.9 6,313
70–66 79.8 45.5 8,457
65–61 64.4 27.8 9,502
60–56 49.9 16.8 7,107
55–51 36.6 9.5 4,937
50–46 21.7 4.6 2,952
45–41 13.5 1.7 1,540
40–36 8.9 1.0 619
35–31 5.9 1.6 257
30–26 6.8 2.7 73
25–20 — — 12
Total — — 44,581
AP MusicAP Grade
PSAT/NMSQT M Score ≥ 3 ≥ 4 n
80–76 96.3 82.7 110
75–71 93.1 64.9 259
70–66 90.3 62.7 359
65–61 84.8 53.3 428
60–56 76.5 41.3 395
55–51 71.5 33.5 316
50–46 64.9 28.0 268
45–41 47.4 20.6 194
40–36 28.4 8.4 95
35–31 36.4 15.9 44
30–26 — — 16
25–20 — — 3
Total — — 2,487
APComputer Science AAP Grade
PSAT/NMSQT M Score ≥ 3 ≥ 4 n
80–76 90.4 73.0 403
75–71 81.4 56.4 1,028
70–66 71.3 44.1 1,500
65–61 56.0 28.5 1,836
60–56 38.1 15.6 1,412
55–51 25.9 7.2 951
50–46 16.9 4.2 600
45–41 9.6 2.5 353
40–36 7.5 5.0 161
35–31 — — 50
30–26 — — 10
25–20 — — 4
Total — — 8,308
AP Computer Science ABAP Grade
PSAT/NMSQT M Score ≥ 3 ≥ 4 n
80–76 93.7 79.1 918
75–71 88.2 68.6 1,352
70–66 78.4 49.9 1,341
65–61 73.7 35.0 1,065
60–56 54.0 23.5 584
55–51 35.9 16.6 301
50–46 28.7 11.1 153
45–41 25.4 9.5 63
40–36 — — 21
35–31 — — 7
30–26 — — 2
25–20 — — 2
Total — — 5,809
AP MacroeconomicsAP Grade
PSAT/NMSQT M Score ≥ 3 ≥ 4 n
80–76 93.6 83.7 583
75–71 88.4 73.4 1,476
70–66 79.7 60.9 2,064
65–61 72.8 48.0 2,545

AP Macroeconomics(cont.)AP Grade
PSAT/NMSQT M Score ≥ 3 ≥ 4 n
60–56 60.8 36.5 1,955
55–51 48.0 25.8 1,511
50–46 35.4 15.3 1,122
45–41 19.2 11.7 691
40–36 14.9 7.1 309
35–31 9.0 2.7 112
30–26 2.1 — 48
25–20 — — 8
Total — — 12,424
APMicroeconomicsAP Grade
PSAT/NMSQT M Score ≥ 3 ≥ 4 n
80–76 85.4 78.1 503
75–71 87.8 69.7 1,141
70–66 79.9 54.6 1,733
65–61 74.1 43.7 2,052
60–56 61.5 30.4 1,583
55–51 51.9 21.6 1,200
50–46 37.8 11.5 882
45–41 29.3 8.0 503
40–36 16.9 3.7 219
35–31 10.4 2.6 77
30–26 3.2 — 31
25–20 — — 2
Total — — 9,926
APPhysics BAP Grade
PSAT/NMSQT M Score ≥ 3 ≥ 4 n
80–76 95.4 76.6 1,120
75–71 88.5 58.4 2,929
70–66 77.2 42.0 4,265
65–61 64.1 27.1 4,603
60–56 51.2 16.6 3,043
55–51 40.0 9.8 1,961
50–46 28.8 4.6 1,076
45–41 19.0 3.6 551
40–36 13.7 1.0 204
35–31 1.4 1.4 69
30–26 9.0 4.5 22
25–20 — — 3
Total — — 19,846
AP Physics C: Electricity and Magnetism
AP Grade
PSAT/NMSQT M Score ≥ 3 ≥ 4 n
80–76 88.4 79.8 815
75–71 76.9 64.5 1,360
70–66 65.2 48.9 1,158
65–61 49.0 31.2 844
60–56 33.9 23.0 387
55–51 32.5 18.3 169
50–46 23.1 8.5 82
45–41 11.7 4.7 43
40–36 — — 21
AP Physics C: Electricity and Magnetism (cont.)
AP Grade
35–31 — — 6
PSAT/NMSQT M Score ≥ 3 ≥ 4 n
30–26 — — 2
25–20 — —
Total — — 4,887
AP Physics C: MechanicsAP Grade
PSAT/NMSQT M Score ≥ 3 ≥ 4 n
80–76 95.9 88.3 1,219
75–71 89.9 70.0 2,341
70–66 79.6 50.7 2,244
65–61 63.3 32.3 1,877
60–56 45.8 17.6 1,066
55–51 34.3 12.1 531
50–46 19.7 3.9 284
45–41 13.5 3.4 149
40–36 8.0 4.0 50
35–31 — — 15
30–26 — — 6
25–20 — — 2
Total — — 9,784
TABLE 7
AP Examinations Using PSAT/NMSQT Verbal andMath Scores: Percentage of Students with a ParticularSum of Verbal and Math Scores Receiving an APGrade at or Above 3 or 4
AP BiologyAP Grade
PSAT/NMSQT V + M Score ≥ 3 ≥ 4 n
156–160 100.0 98.9 92
151–155 99.6 98.4 365
146–150 99.4 95.4 783
141–145 98.5 91.9 1,548
136–140 97.8 88.9 2,700
131–135 96.3 82.2 3,567
126–130 93.1 74.6 5,168
121–125 89.8 66.3 6,378
116–120 85.4 57.1 7,427
111–115 77.4 47.9 7,705
106–110 70.5 38.6 7,783
101–105 62.8 29.5 7,168
96–100 51.6 22.1 5,963
91–95 44.6 16.1 4,968
86–90 34.7 11.2 3,709
81–85 26.6 7.5 2,680
76–80 20.4 5.1 1,773
71–75 13.1 3.6 1,086
66–70 10.3 1.8 658
61–65 10.0 3.0 334
56–60 6.6 2.9 244
51–55 6.8 2.3 88
46–50 — — 42
40–45 — — 12
Total — — 72,24114

15
Because the correlations between assessments for 19-month intervals are as strong or stronger than the cor-relations for two of the three tests, and all correlationsare within .05 of each other, using results on total testtakers will not overestimate the effects of usingPSAT/NMSQT in making placement decisions for thenext academic year. Therefore, examining total testtakers without controlling for time between testing wasappropriate for analyses conducted across all AP Exam-inations. Educators can use the results confidently withstudents who have taken the tests in different years orthe same year.
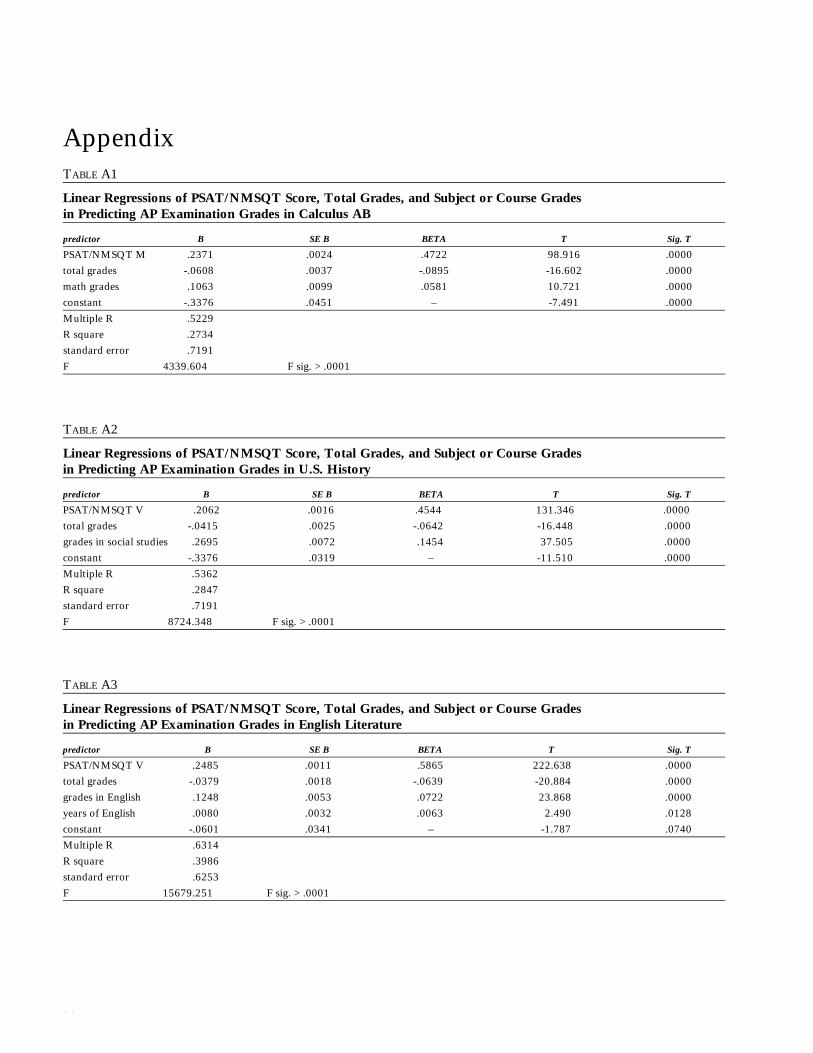
Multiple Regressions PSAT/NMSQT score, estimated high school grade-point average, grades in related subjects (e.g., English,mathematics), and course grades (e.g., algebra, calculus,English literature) provide the best model for predictingAP Examination grades in the three examinations (APU.S. History, AP Calculus AB, AP English Literature)investigated. Total years (number of courses) in the sub-ject or related courses did not account for substantialadditional variation. This was expected from the gener-ally low correlations with AP Examination grades re-ported in Table 4 above.
Total grades, total years and grades in subject areacourses, and specific courses were entered into separatelinear multiple regressions for AP Examination grades inEnglish Literature, U.S. History, and Calculus AB. Pre-dictors were entered into the regressions in order of theamount of variance they accounted for. PSAT/NMSQTscores were entered in the first step of all regressions. Re-sults are presented in Tables A1-A3 in the Appendix.
In AP Calculus AB, in addition to PSAT/NMSQTmath score, eight additional predictors were included inthe regression: total grades; grades in all math courses;number of years of math, geometry, algebra, calculus,precalculus, and trigonometry. These nine predictors
had a Multiple R of .5248 (F = 1,461.202, F sig.>.0001) and accounted for 28 percent of the variance inAP Calculus AB grades. PSAT/NMSQT math score,total grades in high school, and grades in all mathcourses had the largest beta values and when entered asa block in a second linear regression accounted for 27percent of the variance alone (Multiple R = .5229, F =4,339.604), with PSAT/NMSQT math scores ac-counting for 24 percent of the variance. AP Examina-tion grades were generally not correlated with years ofmath courses (correlations ranged from .097 to -.001),but had moderate correlations with math grades.
In AP U.S. History a regression of PSAT/NMSQTverbal score, grades in social studies, and total gradesprovided the best model for predicting AP Examinationgrade (Multiple R = .5362, F = 8724.349, F sig.>.0001), accounting for 29 percent of the variance.PSAT/NMSQT verbal score alone produced a MultipleR of .5053 with grades in social studies and total gradesaccounting for an additional 3.2 percent of the variancein AP Examination grades. Entering years of socialstudies, U.S. history, U.S. government, and English;total grades; and grades in English and social studieshad no practical effect on the prediction and had lowcorrelations (each below .09) with AP grade.
PSAT/NMSQT verbal score, grades in English, andtotal grades also accounted for 40 percent of the vari-ance in predicting AP English Literature grades (Mul-tiple R = .6313, F = 20,902.453, F sig. > .0001), withyears of English courses having little practical signifi-cance. PSAT/NMSQT accounted for 62 percent of thevariance alone.
Gender DifferencesTable 8 illustrates that the correlations between assess-ments are stronger for females than males in these threeAP Examinations, irrespective of time interval. Table 2,while not examining gender by time-interval differ-
TABLE 8
PSAT/NMSQT Correlations with AP Examination Grades by Time Interval Between Testings
AP U.S. History AP Calculus AB AP English Literature
interval males females total males females total males females total
19-month r .475 .502 .490 .473 .483 .473 .601 .604 .603
n 31,511 38,804 70,315 39,113 37,875 76,988 39,503 69,638 109,141
7-month r .425* .465* .446* .481 .520** .496 .589 .597 .594
n 47,193 53,912 101,105 5,395 3,444 8,839 1,700 2,861 4,561
* Significant difference for 19- and 7-month interval, p >.001 ** Significant difference for 19- and 7-month interval, p > .05
16
ences, does illustrate that correlations betweenPSAT/NMSQT and all but one AP Examination areslightly higher for females than males. The outlier is APSpanish Literature, which has a lower correlation withPSAT/NMSQT than other examinations for males andfemales alike. However, a stronger relationship betweenthese assessments does not mean females are more likelyto obtain higher AP grades given the samePSAT/NMSQT score. Gender differences on AP Exam-inations are discussed elsewhere (Willingham and Cole,1997), but generally males’ mean and median grades ex-ceeded those of females on 18 of 25 AP Examinationsin this study. Female performance exceeds male on APArt History, AP English Language and English Litera-ture, and four of the AP foreign language examinations.
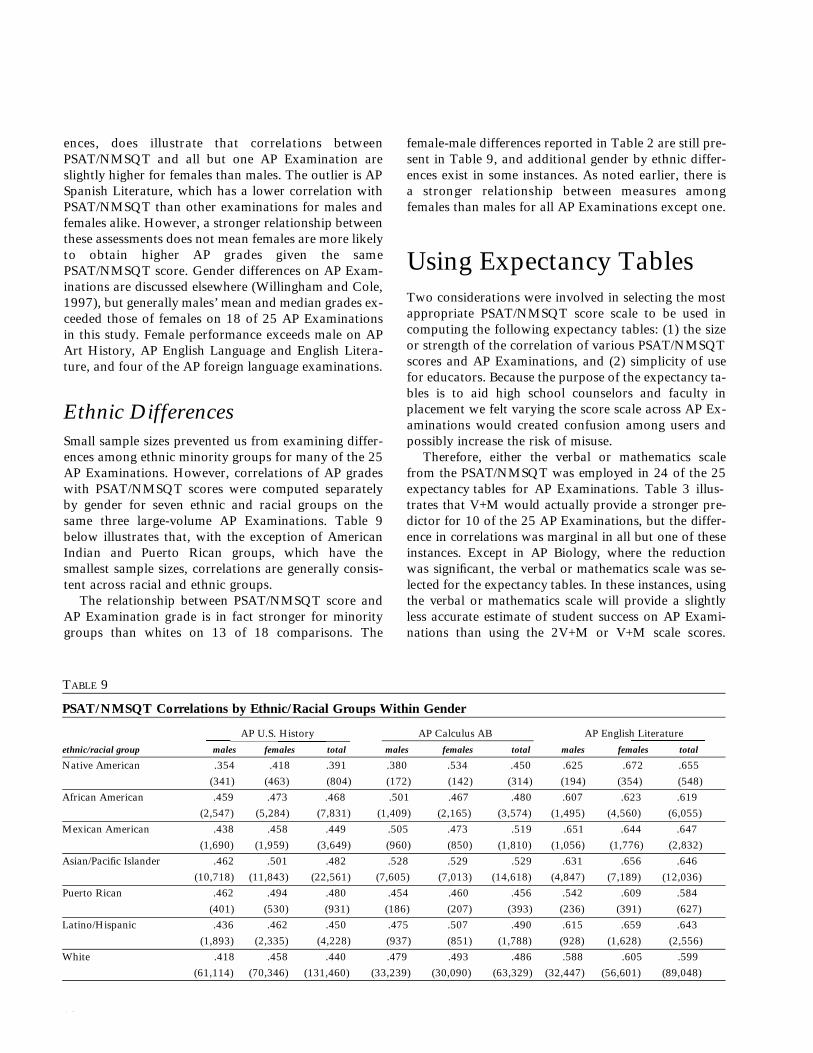
Ethnic DifferencesSmall sample sizes prevented us from examining differ-ences among ethnic minority groups for many of the 25AP Examinations. However, correlations of AP gradeswith PSAT/NMSQT scores were computed separatelyby gender for seven ethnic and racial groups on thesame three large-volume AP Examinations. Table 9below illustrates that, with the exception of AmericanIndian and Puerto Rican groups, which have thesmallest sample sizes, correlations are generally consis-tent across racial and ethnic groups.
The relationship between PSAT/NMSQT score andAP Examination grade is in fact stronger for minoritygroups than whites on 13 of 18 comparisons. The
female-male differences reported in Table 2 are still pre-sent in Table 9, and additional gender by ethnic differ-ences exist in some instances. As noted earlier, there isa stronger relationship between measures among females than males for all AP Examinations except one.
Using Expectancy TablesTwo considerations were involved in selecting the mostappropriate PSAT/NMSQT score scale to be used incomputing the following expectancy tables: (1) the sizeor strength of the correlation of various PSAT/NMSQTscores and AP Examinations, and (2) simplicity of usefor educators. Because the purpose of the expectancy ta-bles is to aid high school counselors and faculty inplacement we felt varying the score scale across AP Ex-aminations would created confusion among users andpossibly increase the risk of misuse.
Therefore, either the verbal or mathematics scalefrom the PSAT/NMSQT was employed in 24 of the 25expectancy tables for AP Examinations. Table 3 illus-trates that V+M would actually provide a stronger pre-dictor for 10 of the 25 AP Examinations, but the differ-ence in correlations was marginal in all but one of theseinstances. Except in AP Biology, where the reductionwas significant, the verbal or mathematics scale was se-lected for the expectancy tables. In these instances, usingthe verbal or mathematics scale will provide a slightlyless accurate estimate of student success on AP Exami-nations than using the 2V+M or V+M scale scores.
TABLE 9
PSAT/NMSQT Correlations by Ethnic/Racial Groups Within Gender
AP U.S. History AP Calculus AB AP English Literature
ethnic/racial group males females total males females total males females total
Native American .354 .418 .391 .380 .534 .450 .625 .672 .655
(341) (463) (804) (172) (142) (314) (194) (354) (548)
African American .459 .473 .468 .501 .467 .480 .607 .623 .619
(2,547) (5,284) (7,831) (1,409) (2,165) (3,574) (1,495) (4,560) (6,055)
Mexican American .438 .458 .449 .505 .473 .519 .651 .644 .647
(1,690) (1,959) (3,649) (960) (850) (1,810) (1,056) (1,776) (2,832)
Asian/Pacific Islander .462 .501 .482 .528 .529 .529 .631 .656 .646
(10,718) (11,843) (22,561) (7,605) (7,013) (14,618) (4,847) (7,189) (12,036)
Puerto Rican .462 .494 .480 .454 .460 .456 .542 .609 .584
(401) (530) (931) (186) (207) (393) (236) (391) (627)
Latino/Hispanic .436 .462 .450 .475 .507 .490 .615 .659 .643
(1,893) (2,335) (4,228) (937) (851) (1,788) (928) (1,628) (2,556)
White .418 .458 .440 .479 .493 .486 .588 .605 .599
(61,114) (70,346) (131,460) (33,239) (30,090) (63,329) (32,447) (56,601) (89,048)

17
However, this is offset by the simplicity gained in main-taining consistency among the PSAT/NMSQT scales em-ployed for similar (e.g., science, humanities, languages)AP Examinations. Simplicity is also the principal reasonthat the 2V+M scale was not employed in any of the ta-bles despite its having the highest correlation with eightof the AP Examinations.
Tables 5 through 7 report the proportion of studentsattaining grades of 3 or more and 4 or more on each APExamination across the range of scores on thePSAT/NMSQT. The data in these analyses: • Include all students who completed the
PSAT/NMSQT in October 1993 or 1994 and subse-quently completed an AP Examination in the springof 1995 or 1996.
• Use recentered PSAT/NMSQT scores.• Include students who completed the PSAT/NMSQT
one year prior to enrolling in an AP course (about 70percent of the sample) as well as students who com-pleted the PSAT/NMSQT during the same year theycompleted the AP Examination. In the former case,there was a 19-month interval between tests and inthe later, the interval was seven months.
• Demonstrate that the relationships (correlation coef-ficients) were similar for students who took both ex-aminations during the same year, and for studentswho completed the PSAT/NMSQT a year prior toenrolling in AP courses.
PSAT/NMSQT scores can supplement existing proce-dures used by schools to identify additional studentswho may be successful in specific AP courses. However,PSAT/NMSQT scores should never be used as the sole,or even the primary, indicator. Schools should not es-tablish minimum “cut scores” on the PSAT/NMSQT orany other assessment for placing students into APcourses—such practices are a clear misuse of assess-ment scores. Faculty and counselors should be cautiousin using these tables. First, many students withPSAT/NMSQT scores that place them at the upperranges of probable success (grades of 3 or higher) for aspecific AP Examination may not have fulfilled the ap-propriate prerequisite courses and would clearly be un-prepared for some AP courses.
Second, student performance (grades, teacher recom-mendations) in previous courses in the content area aswell as motivation and interest will be key determinantsof their success in AP courses and must be considered.Third, the sample of students used in the analysis wasrestricted to students who did complete an AP Exami-nation. That is, while the sample of students was quitelarge, it did not include the even larger number ofPSAT/NMSQT test takers who were not enrolled in APcourses, or who chose not to take the examination if en-
rolled. It is impossible to know how students wouldhave performed on AP Examinations. It is quite likelythat students who complete AP Examinations differ inmeaningful ways from students who do not completeAP Examinations, even when they attain the samePSAT/NMSQT scores and complete the same courseswith equal proficiency. Therefore, these tables have notbeen developed to provide the precise probability for anindividual student’s attaining a specific AP Examinationgrade, but rather to provide the probability of successon AP Examinations for the group of students attainingPSAT/NMSQT scores within a given range.
In general, students with moderate PSAT/NMSQTscores are typically successful when completing manyAP Examinations. Students who have completed theprerequisite secondary school courses and have not con-sidered AP courses can be identified for further consid-eration by faculty and counselors with the use of per-formance data from the PSAT/NMSQT.
Use of these tables requires finding the appropriateAP Examination and determining which PSAT/NMSQTscale to use, identifying students’ respective scores onthe appropriate scale, and finding the proportion whoattained grades of 3 or more (or 4 or more if appro-priate). Table 3 lists AP courses that use thePSAT/NMSQT verbal scale, mathematics scale, or bothscales. There should be no absolute rules for inter-preting or using these tables. For example, with U.S.History, you may use score ranges of 41–45, 46–50, or51–55 to begin to identify potential students, because atthese points sizable numbers of students have receivedgrades of 3 or more in the past. Many students identi-fied through this means may have already been consid-ered for AP U.S. History through other procedures al-ready instituted in the school (e.g., teacherrecommendations). The use of the PSAT/NMSQT scorerange can help identify additional students who may beconsidered for the course. Counselors and teacherswould need to determine if these students have had theappropriate prerequisite courses and would also need toconsider their performance in these courses, as well asstudent interest and motivation for completing a rig-orous college-level AP course. In essence, these tablescannot provide one-stop shopping in curriculum plan-ning, but can serve as useful aids and supplements toother methods used in the school.
In some schools and for certain subjects,PSAT/NMSQT scores may not be available in time tomake decisions about entry into AP courses. This is cer-tainly the case where students complete thePSAT/NMSQT in October of their junior year and afull-year AP course is offered exclusively to juniors. Inaddition, scores obtained in eleventh grade cannot be

18
used if the mathematics or foreign language sequencebegins in the eighth or ninth grades and students havenot taken the required prerequisite courses. Of course,increasing proportions of students are completing thePSAT/NMSQT as sophomores and their scores can behelpful for placement in AP courses that begin after thereceipt of student score reports.
Determining Whether AP CoursesCan Be Offered in a SchoolPSAT/NMSQT scores can also be useful for schoolsconsidering introducing AP courses as well as offeringadditional AP courses. Using PSAT/NMSQT scoreranges, schools can quickly identify the number of stu-dents who may be successful in specific AP courses ifthese were offered or enrollment was expanded. Schoolswould first determine the appropriate proportion of stu-dents with a probability of achieving an AP grade of 3or higher to offer or expand an AP course at theirschool. Some schools may employ a 50 percent successrate, while other schools may prefer a slightly lower orslightly higher proportion. The school would determinethe number of students who attain the correspondingPSAT/NMSQT score and who would likely have com-pleted the prerequisite courses and be interested in APcourses. This information can be extremely useful forschools considering offering additional AP courses, aswell as those interested in offering additional AP sec-tions of the same course.
Conclusion and SummaryThe relationship between AP Examination grades andPSAT/NMSQT scores is substantially stronger for 11 ofthe 12 subjects previously examined by Haag (1983). Inaddition, Haag examined a much smaller sample ofonly a few hundred students in 1982. The current studyhas shown that student performance on thePSAT/NMSQT can be useful in identifying additionalstudents who may be successful in AP courses.PSAT/NMSQT scores can identify students who maynot have been initially considered for an AP coursethrough teacher nomination, self-nomination, or otherlocal procedures.
Performance on the PSAT/NMSQT is not stronglyrelated to AP grades on four examinations: (1) studioart: design, (2) studio art: drawing, (3) German lan-guage, and (4) Spanish language. The two studio artcourses are graded exclusively with student-produced
portfolios and traditional examinations are not used. Inaddition, students completing the studio design coursesreport substantially lower total high school grades thanstudents completing other AP Examinations (nearlyone-half of a letter grade lower). As noted earlier, therelationship of PSAT/NMSQT scores with most lan-guage examinations also appears weaker than it is forother content areas and could be due to using a pro-portion of students fluent in the language. The lack ofany relationship for Spanish language may be attributedto the very large proportion of students enrolled in thisspecific course who may have acquired language skillsoutside of the classroom (native speakers or students forwhom Spanish is spoken at home).
The relationship of the PSAT/NMSQT scores withother AP Examination grades is moderately strong andinvariant across ethnic groups and time of testing. Thatis, the relationship is substantially the same for allethnic and racial groups and is only slightly weakerwhen time between testing spreads across two academicyears. This is an important finding, because faculty andcounselors will usually base placement decisions on in-formation available from the previous academic year.Therefore, PSAT/NMSQT tests completed in the junioryear can be a useful placement tool for decisions con-cerning senior year courses, and results from sopho-more testing can be useful for course placement in ju-nior and senior years.
The relationship between measures is consistentlystronger for females than males on all but one AP Ex-amination (AP Spanish Literature). However, males at-tain higher grades on 18 of 25 AP Examinations. Somegender by ethnic group differences are also based on theresults from three high-volume AP Examinations.
Correlational analyses illustrate that PSAT/NMSQTscores, total high school grades, subject-related grades(e.g., math, social studies), and grades in specific highschool courses (e.g., calculus, U.S. History) are relatedto performance on AP Examinations. Correlations be-tween PSAT/NMSQT and AP grades are greater than.50 for 16 of 25 subjects and greater than .44 for 23 ofthese 25 subjects. The total number of high schoolcourses in the subject or related subjects has no prac-tical relationship with AP performance. Second, corre-lations of the number of related high school courses(e.g., math, science, English) completed and AP Exami-nation grades are near zero for most subjects, but similar correlations with grades in those subjects aregenerally in the range of .35 to .40. Multiple regressionsconducted on AP Calculus AB, U.S. History, and Eng-lish Literature further illustrate that PSAT/NMSQTcombined with total high school grades and grades inthe subject (i.e., math, social studies, and English,

19
respectively) account for 27 to 40 percent of the vari-ance in AP grades in these subjects. However,PSAT/NMSQT scores accounted for the greatest shareof the variance with grades contributing an additional 1to 2 percent of the variance.
Findings that total number of years studied in sub-jects related to AP Examinations had little or no rela-tionship to AP Examination performance may be par-tially explained by the lack of variation among moststudents in courses completed. For example, studentscompleting AP English Literature completed an averageof 7.81 semesters of literature, composition, grammar,and journalism courses with a standard deviation of.643. In math, AP students completed an average of7.85 semesters with a standard deviation of .569.
In conclusion, many factors should be considered inmaking course placement decisions. As explained above,students’ previous courses (especially prerequisitecourses) and grades (especially in more rigorous courses),student interest and motivation for completing a rigorouscollege-level AP course, and their interest in the specificsubject area are all important factors to consider. Studentperformance on the PSAT/NMSQT can provide a usefulsupplement to these data and also permit the school todetermine the potential for expanding existing AP offer-ings or introducing new courses.
ReferencesCamara, W. In preparation. Technical Supplement to the
SAT I: Reasoning Test. New York: College Entrance Ex-amination Board.
College Entrance Examination Board. 1996. Advanced Place-ment Yearbook 1996. New York: College Entrance Examination Board.
College Entrance Examination Board. 1997. College BoundSeniors: A Profile of SAT Test Takers. New York: CollegeEntrance Examination Board.
Haag, C. 1983. Using the PSAT/NMSQT to Help IdentifyAdvanced Placement Students. Unpublished report. NewYork: College Entrance Examination Board.
Willingham, W. and N. Cole. 1997. Gender and Fair Assess-ment. Mahwah, NJ: Lawrence Erlbaum and Associates.
20
AppendixTABLE A1
Linear Regressions of PSAT/NMSQT Score, Total Grades, and Subject or Course Grades in Predicting AP Examination Grades in Calculus AB
predictor B SE B BETA T Sig. T
PSAT/NMSQT M .2371 .0024 .4722 98.916 .0000
total grades -.0608 .0037 -.0895 -16.602 .0000
math grades .1063 .0099 .0581 10.721 .0000
constant -.3376 .0451 – -7.491 .0000
Multiple R .5229
R square .2734
standard error .7191
F 4339.604 F sig. > .0001
TABLE A2
Linear Regressions of PSAT/NMSQT Score, Total Grades, and Subject or Course Grades in Predicting AP Examination Grades in U.S. History
predictor B SE B BETA T Sig. T
PSAT/NMSQT V .2062 .0016 .4544 131.346 .0000
total grades -.0415 .0025 -.0642 -16.448 .0000
grades in social studies .2695 .0072 .1454 37.505 .0000
constant -.3376 .0319 – -11.510 .0000
Multiple R .5362
R square .2847
standard error .7191
F 8724.348 F sig. > .0001
TABLE A3
Linear Regressions of PSAT/NMSQT Score, Total Grades, and Subject or Course Grades in Predicting AP Examination Grades in English Literature
predictor B SE B BETA T Sig. T
PSAT/NMSQT V .2485 .0011 .5865 222.638 .0000
total grades -.0379 .0018 -.0639 -20.884 .0000
grades in English .1248 .0053 .0722 23.868 .0000
years of English .0080 .0032 .0063 2.490 .0128
constant -.0601 .0341 – -1.787 .0740
Multiple R .6314
R square .3986
standard error .6253
F 15679.251 F sig. > .0001