using tablets and satellite-based internet to deliver ... tablets and satellite-based internet to...
TRANSCRIPT

Using Tablets and Satellite-based Internet to Deliver
Numeracy Education to Marginalized Children in a
Developing Country
Imran A. Zualkernan American University of Sharjah
Sharjah, UAE
Shirin Lutfeali Save the Children
New York, USA
Asad Karim Teletaleem (Pvt) Limited
Islamabad, Pakistan
Abstract—The intervention presented in this paper is
premised on a theory of change that stipulates that learning
outcomes in marginalized communities can be improved by a
holistic just-in-time approach with a tight feedback loop that
addresses children, parents and the community simultaneously.
In this intervention a satellite-enabled traveling van visits a
cluster of schools once every two weeks. During this visit,
teachers in cluster schools are provided numeracy training
through remote tutoring. In addition, each teacher is provided
with an Android tablet containing content and assessments for
children. During the two weeks, the teacher collects assessment
data from the children using the Android tablet. In addition,
Stalling’s videos of teacher’s classroom behavior are recorded
and analyzed by master trainers on a monthly basis. Teachers
and school committees are kept informed about their children’s
progress via SMS messages. The intervention targeted 24 schools
in four clusters for one academic year in Pakistan. EGMA type
tests were used to establish baseline and endline results for Grade
2 students. The results are that medium learning effects were
achieved.
Keywords— numeracy; developing countries; EGMA;
Stallings; learning technology
I. INTRODUCTION
Like literacy, mathematical literacy or numeracy is important for development. PISA test measures mathematical literacy or numeracy of 15 year old children across a wide range of countries. Recent results of PISA show that children in developing countries like Peru, Indonesia, Columbia and Jordon rank last in terms of mathematical literacy [1]. In addition, 60-75% of children in these countries are considered low-achievers. While technology has been used widely to support learning in the developing world, constraints of developing countries significantly change the dynamics of effective use of technology to support learning [2]. For example, Fig 1 shows a classroom in a public school in semi-rural area of Pakistan. As the Figure shows, such classrooms lack even basic amenities like furniture. Even when the physical infrastructure is present, most such schools do not have a reliable supply of electricity. Therefore, in addition affordability, introducing computers to support learning in such environments requires one to provide a more extensive infrastructure which is taken for granted in most developed
countries. For example, generators and un-interrupted power supplies (UPS) or solar or wind generated energy solutions may be required. In addition, dust and weather proofing and measures to prevent theft and misuse need to be instituted. Finally, human capital needs to be developed locally to support such resident technology. This paper explores an alternative view that brings self-contained learning technology and a host of learning resources to these schools on a transactional basis; the schools only need to provide students and teachers.
The rest of the paper is organized as follows. Next section describes a theory of change behind the intervention being presented. This is followed by a description of the technology platform required to support the intervention. Design of the intervention is described next followed by an analysis of the results. Paper ends with a discussion and a conclusion.
Fig. 1. A classroom in a semi-rural public school in Pakistan
II. THEORY OF CHANGE
A theory of change is the empirical basis underlying why a
social intervention would be effective [3]. The theory of
change proposed here is based upon experiences gained from
two specific prior interventions. Each is briefly described
next.
This work was funded in part by UK governments DFID program and the Teletaleem Technical Assistance (TA) of the Asian Development Bank.

Fig. 2. Assumptions of the Numeracy Boost orogram
The first program developed by Save the Children is called the Numeracy Boost Program (NB) [4]. The three components of this program are shown in Fig 2. As Fig 2 shows, NB program is based on a three-pronged holistic approach that involves students’ assessment, teacher training and community involvement in a structured, localized and contextualized manner. The NB program has been successfully deployed in Malawi and Bangladesh with promising results. The primary emphasis of the program is on teaching grade 2 children about counting, number awareness, operations, measurements, and shapes. Based on an initial summative assessment of children using an assessment instrument similar to Early Grade Mathematics Assessment (EGMA) [5], a customized approach incorporating community action, context, the national curriculum and local constraints is developed for each community. Teacher training typically consists of five modules which are delivered monthly. Teacher training is tied to the country’s curriculum and focuses on developing conceptual and process skills. The community action component of NB consists of conducting Math camps for children through community volunteers and Math activities that parents can do at home. Relevant and culturally sensitive material using indigenous materials is used for these activities. The primary purpose of these activities is to show Math as useful, relevant and a big part of children’s everyday lives.
The second program which motivates the theory of change is the School Garee (SG) or the Learning Van program [6]. As Fig 3 shows, SG program is based on effective and sustainable use of technology to deliver learning in developing countries. As shown in Fig 4, the program uses a satellite (VSAT) equipped, self-contained van containing computer servers, Android tablets, a power-generator, UPS, and routers to bring technology capability to any school. A primary reason for using this self-contained van is that most developing countries lack basic infrastructure like electricity, internet connectivity, and Information Technology (IT) skills. Secondly, the cost of creating a computer laboratory for each school or indeed providing computers to each child is beyond the economic capabilities of most developing nations.
Fig. 3. Assumptions of the School Garee program
This van is used to deliver just-in-time teacher training which is synched with what is currently being taught in the classroom. An expert master teacher trainer delivers this training using a virtual classroom environment from a remote location. The van allows an master trainer’s expertise to be shared readily with a large number of remote schools. Students and teachers are assessed on each visit of the van (once every two weeks) and the results are discussed between each teacher and the master teacher trainer who also acts as a mentor. In addition, Stallings-type [7] class observation videos of each teacher are recorded and uploaded to a main system through the satellite link. Teachers’ classroom behavior is rated on a rubric and they are provided with structured feedback on how to improve their classroom teaching and management practices. Finally, the parents, community and educational administrators are sent Short Messaging Service (SMS) messages on the current performance of each child and classroom. This helps improve teacher accountability, transparency and promotes better governance.
Fig. 4. School Garee or the learning van visits a school in Balakot, Pakistan
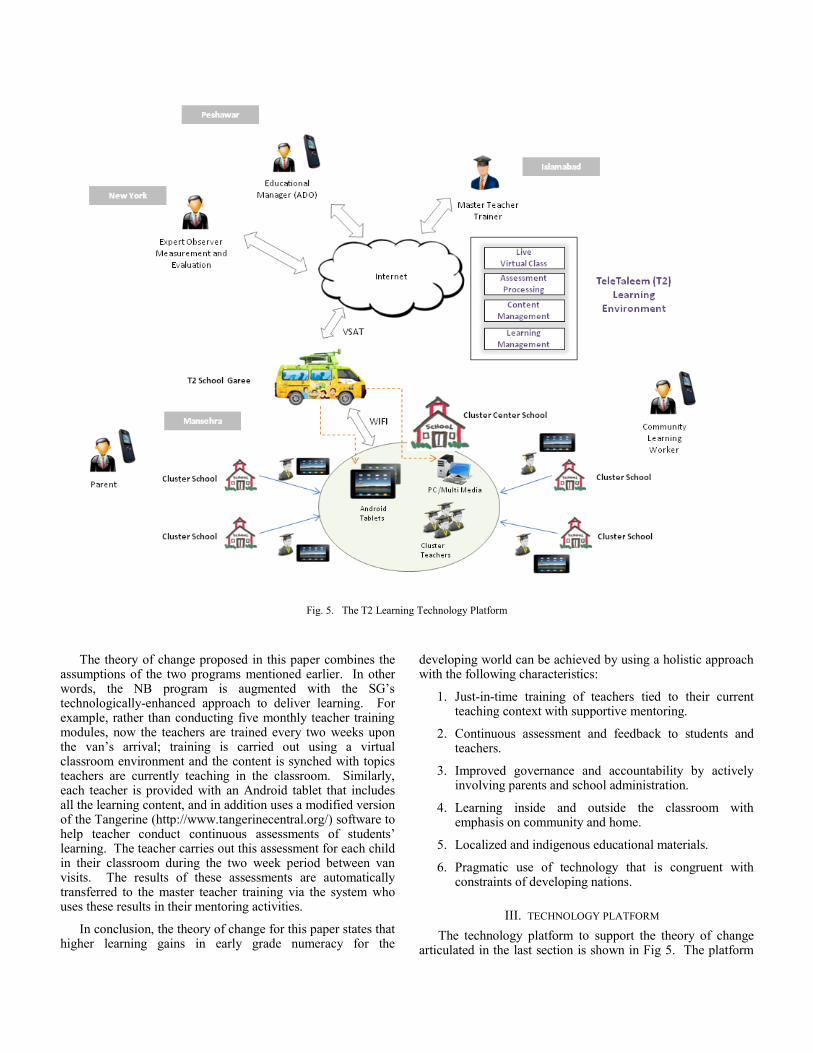
Fig. 5. The T2 Learning Technology Platform
The theory of change proposed in this paper combines the assumptions of the two programs mentioned earlier. In other words, the NB program is augmented with the SG’s technologically-enhanced approach to deliver learning. For example, rather than conducting five monthly teacher training modules, now the teachers are trained every two weeks upon the van’s arrival; training is carried out using a virtual classroom environment and the content is synched with topics teachers are currently teaching in the classroom. Similarly, each teacher is provided with an Android tablet that includes all the learning content, and in addition uses a modified version of the Tangerine (http://www.tangerinecentral.org/) software to help teacher conduct continuous assessments of students’ learning. The teacher carries out this assessment for each child in their classroom during the two week period between van visits. The results of these assessments are automatically transferred to the master teacher training via the system who uses these results in their mentoring activities.
In conclusion, the theory of change for this paper states that higher learning gains in early grade numeracy for the
developing world can be achieved by using a holistic approach with the following characteristics:
1. Just-in-time training of teachers tied to their current teaching context with supportive mentoring.
2. Continuous assessment and feedback to students and teachers.
3. Improved governance and accountability by actively involving parents and school administration.
4. Learning inside and outside the classroom with emphasis on community and home.
5. Localized and indigenous educational materials.
6. Pragmatic use of technology that is congruent with constraints of developing nations.
III. TECHNOLOGY PLATFORM
The technology platform to support the theory of change articulated in the last section is shown in Fig 5. The platform
supports a host of services including a virtual classroom, learning and content management and assessment processing and reporting. The core services are built using well-known and mostly open-source platforms like Moodle (www.moodle.org) learning management system and Drupal content management system (www.drupal.org). Live classroom services are built on top of the Adobe’s Flash media servers (http://www.adobe.com/products/adobe-media-server-family.html) . The technology platform is fully integrated with a field assessment and content delivery system based on Android tablets provided to the teachers. All learning services are available over the Internet. In addition, the system is also integrated with an SMS service to send SMS messages to parents, educational administrators and community learning workers.
Fig 6 shows a Master teacher trainer delivering a lesson using the virtual classroom environment. Teacher can use the tilted camera to show interaction with tangible elements often used in early grade numeracy. Remotely located teachers interact with the master trainer though a laptop and a digital tablet attached to an overhead projector showing the master trainer. Fig 7 shows how this lesson is viewed by teachers in the remote location which is typically a cluster center school where many teachers have gathered for a lesson.
Fig. 6. Master trainer delivering a numeracy lesson using the virtual
classroom
Fig. 7. What remote teachers sees through the virtual classroom
environment.
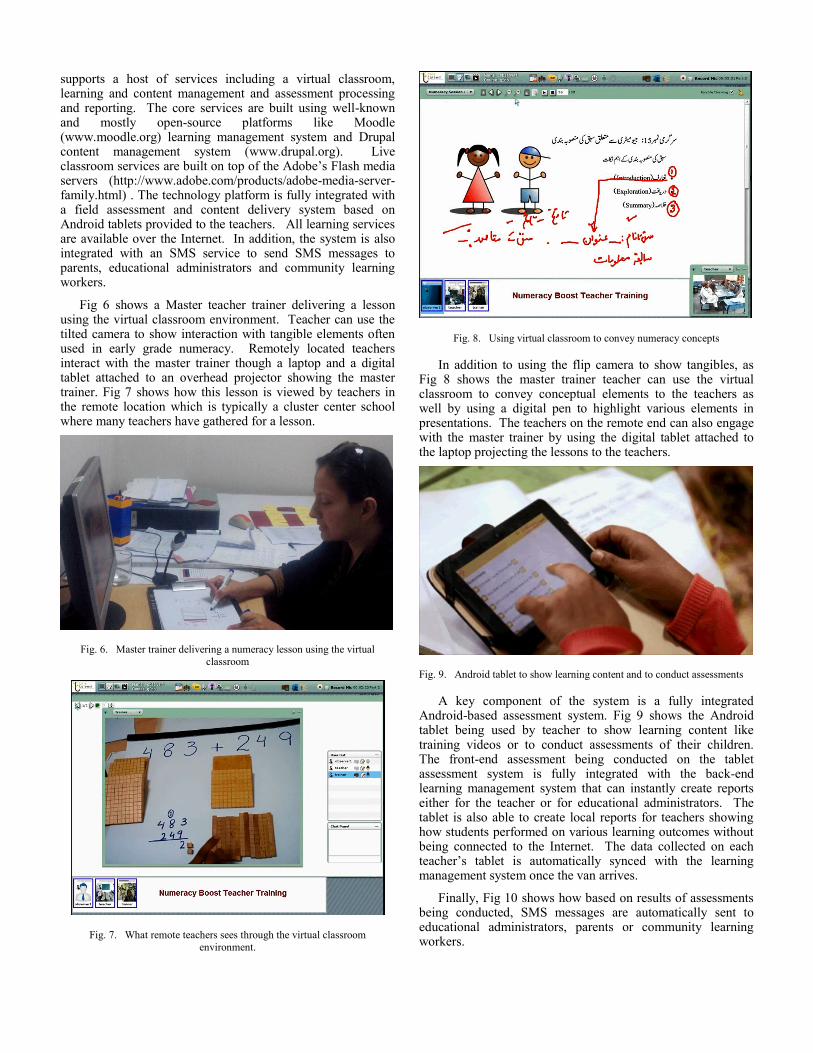
Fig. 8. Using virtual classroom to convey numeracy concepts
In addition to using the flip camera to show tangibles, as Fig 8 shows the master trainer teacher can use the virtual classroom to convey conceptual elements to the teachers as well by using a digital pen to highlight various elements in presentations. The teachers on the remote end can also engage with the master trainer by using the digital tablet attached to the laptop projecting the lessons to the teachers.
Fig. 9. Android tablet to show learning content and to conduct assessments
A key component of the system is a fully integrated Android-based assessment system. Fig 9 shows the Android tablet being used by teacher to show learning content like training videos or to conduct assessments of their children. The front-end assessment being conducted on the tablet assessment system is fully integrated with the back-end learning management system that can instantly create reports either for the teacher or for educational administrators. The tablet is also able to create local reports for teachers showing how students performed on various learning outcomes without being connected to the Internet. The data collected on each teacher’s tablet is automatically synced with the learning management system once the van arrives.
Finally, Fig 10 shows how based on results of assessments being conducted, SMS messages are automatically sent to educational administrators, parents or community learning workers.

Fig. 10. SMS Notifications for the various stakeholders
IV. INTERVENTION DESIGN
The theory of change and the associated technology were evaluated in public schools of the Balakot valley in the KPK province of Pakistan. As Fig 11 shows a total of 140 public schools were initially considered. Out of these 46 schools were purposely shortlisted because these schools were within a few kilometers from the road where the learning van would arrive. Eight clusters of schools were subsequently identified where the cluster center was a school purposely chosen as being close enough to the road to host the learning van. Out of the eight clusters thus selected, four clusters were randomly chosen for the intervention. Each cluster had nine schools. Out of nine schools for each cluster, six were randomly assigned to the treatment group while the rest were used as control. This resulted in a total of 4X6 = 24 treatment schools and 4X3=12 control schools. A total of 17 community learner workers were hired and trained to conduct the community interaction for the 24 treatment schools.
Fig. 11. Selection of participating schools
Table I shows the total number of children in control and treatment groups. As Table I shows control group had a higher proportion of females. However, no statistical difference between the median ages of control and treatment groups were found (Levene statistic=2.47, p=0.18; Kruskal-Wallis H = 0.32, 1 d.f., p=0.574). Similarly, median age was not different for males and females for both treatment (Levene statistic=1.13, p= 0.611; Kruskal-Wallis H=1.37, 1 d.f., p= 0.241) and control groups (Levene statistic=0.01, p=0.935; Kruskal-Wallis H= 0.00, 1 d.f., p= 0.970).
TABLE I. CHILDREN DEMOGRAPHICS
Gro
up
#S
ch
ools
#C
hild
ren
#M
ale
#F
emale
Ma
le –
Mea
n A
ge
(SD
)
Fem
ale
-
Mea
n A
ge
(SD
)
Control 12 54 13 (24%) 41 (76%) 8.06 (1.11) 7.88 (1.05)
Treatment 24 148 75 (50%) 73 (50%) 8.27 (1.55) 8.16 (1.36)
A pre-and post-test design was used where a pre- and post-
test was administered to the treatment and control children by independent enumerators who were trained to conduct such assessments. Assessments were conducted using a modified version of the Tangerine software. For example, Fig 12 shows a timed assessment where the enumerator asks a child to count beads and marks the mistakes the child makes.
Fig. 12. Using android tablet for pre- and post-assessments
TABLE II. PRE- AND POST- ASSESSMENTS
Unit Total
Questions
Example Question Type
Numbers 10 (18%) Identify the place value of a specific digit in a 3-digit number
Number
Operations
29 (52%) Add 2-digit numbers and 2-digit
numbers with carrying
Measurement 5 (9%) Solve real life problems involving measurements
Time 5 (9%) Use solar calendar to find a
particular date.
Geometry 7 (13%) Identify vertices and sides of a triangle, rectangle and square.

A unit-wise breakdown of the number of questions in the test instrument is provided in Table II. The pre-assessments were conducted starting September 15, 2013 and the post-assessments were conducted starting on Feb 28, 2014.
V. RESULTS
A. Quantitative Results
The pre-score for treatment and control were normally distributed (Anderson-Darlington p>0.08) and a one-sided t-test showed that mean pre-score for the control group (M = 0.520, SD=0.19) was significantly less than the pre-score for the treatment group (M = 0.577, SD=0.13), t(200) = -2.15, p= 0.016. However, the 95% confidence interval for the maximum difference was 1.2%. Indeed Cohen’s D for pre-score was 0.34 which can be interpreted as a small effect.
The post-scores for control (M=0.603, SD=0.23) and treatment (M=0.788, SD=0.17) groups were not normally distributed (Anderson-Darlington, p<0.05) and it was not possible to conduct non-parametric comparisons because the variance of the two groups was not the same (Levene statistic=10.45, p=0.001). However, Wilcoxon-Signed Rank Test showed a 95% confidence interval of [0.536, 0.675] for the control and [0.769, 0.834] for the treatment group showing no overlap. This suggests that even though it is not possible to compare the two distributions directly, there is a 95% probability that the post-score for control group is between 53% to 67% as opposed to between 76% to 83% for the treatment group.
It should also be mentioned that in general the pre- scores are relatively high (52% and 57% respectively for the control and treatment groups). While the starting point for these children was relatively high, real effect of learning can be ascertained by looking at the learning gain which is the difference between the pre- and post-score for each child. This analysis is presented next.
Learning gains for treatment and control groups were normally distributed (Anderson-Darlington; p>0.15). A two sample single-sided t-test shows that learning gains for the treatment group (M=0.211, SD=0.22) were significantly higher than those for the control group (M = 0.077, SD=0.24), t(200)=-3.73, p= 0.000. The effect as measured by Cohen’s D was found to be 0.62 which can be interpreted as a medium effect. Cohen’s D also had a fairly tight 95% confidence interval of [0.56, 0.67] indicating that there is a 95% probability that the Cohen’s D is between 0.56 and 0.67.
Since age, r(200)= 0.165, p<0.05 and pre-score, r(200) = -0.461, p<0.05 were correlated with the overall learning gain, an Analysis of Covariance (ANCOVA) using age and pre-score as covariates was carried out. After controlling for the effects of age and pre-score, treatment was found to be significant F(185,1) = 23.9, p<0.000. A Cohen’s f value of 0.29 for the ANCOVA also indicates a moderate effect after adjusting for the covariates where η² was 0.08 [8].
Since the marginal distributions for gains in numeracy domains were not normally distributed (Anderson-Darlington p<0.05), non-parametric tests were used to compare medians of
treatment and control groups. For the Numbers domain, there was a significant difference between the medians (Levene statistic = 1.07, p= 0.303; Kruskal-Wallis H = 7.85, 1 d.f., p= 0.005). For Number Operations, there was also a significant difference (Levene statistic=0.14, p= 0.713; Kruskal-Wallis H = 9.14, 1 d.f., p=0.003). It was not possible to compare the Measurement domain because the variances of the treatment and control groups were not the same (Levene statistic=11.49, p= 0.001). However, Wilcoxon Signed Rank test showed a 95% confidence interval of [0, 0.125] for median of the control group as opposed to an interval of [0.125, 0.250] for the treatment group. The treatment group’s median learning gain for the Time domain was also significantly different than that of the control group (Levene statistic = 0.01, H = 9.14, 1 d.f., p =0.003). Finally, it was also not possible to compare the medians of two groups with respect to Geometry because the variances were not the same (Levene statistic =0.89, p=0.003). However, Wilcoxon Signed Rank test showed a 95% confidence interval of [0, 0.292] for the control group and [0.250, 0.417] for the treatment group.
In order to calculate the effect sizes for gains in the numeracy domain, Mann-Whitney tests were conducted to derive Eta
2 [9] and the Rank-Biserial r. Based on these values,
it is reasonable to conclude that the effect when present was medium for each of the numeracy domains.
Table III shows the summarized results for the various learning domains. As can be seen that while it is not possible determine differences in learning gains for Measurements and Geometry, medium learning effects were observed in three learning domains.
In order to understand the dynamics of why children performed better, a variety of statistical tests and data mining techniques like ordinal regression, J48, SVM etc. [10] were run to determine the effects of gender, literacy environment (e.g., parents and siblings teaching the child), economic background (e.g., number and types of electrical appliances at home or number and types of farm animals owned), but no statistical or other interesting effects were found.
Finally, clustering was used to try to understand the dynamics of learning within the treatment group. As Table IV shows, simple K-means [10] clustered children in the treatment group into three clusters with an overall sum of squared error of 6.73 using Euclidian distance. As the table shows, children in cluster #1 had the lowest learning gain (2.69%) and had a pre-score of 68.1% and an average age of 7.4 years. Children in cluster #2 who performed the best with a gain of 36% did not differ that much in age (7.5 years) but tended to have a lower pre-score 47%. This suggests that when comparing these groups, children with lower initial competency regardless of the age had better learning gains. The third cluster (cluster #2) consists of children whose average age was much higher (9.5 years). These children also benefited (gain of 22.18%) but not as much as the younger children with a similar pre-score.
B. Qualitative Results
In addition to the statistically significant learning gains, the intervention was generally well-received by the teachers as

TABLE III. LEARNING GAINS FOR VARIOUS DOMAINS
Gain Control (N=54) Treatment (N=148) Effect
Mean SD Median Mean SD Median Eta2 Rank-Biserial r Magnitude
Numbers 0.043 0.23 0.031 0.12 0.19 0.132** 0.197 0.258 Medium
Number Operations 0.092 0.26 0.062 0.21 0.27 0.222** 0.212 0.278 Medium
Measurement 0.055 0.29 0.00
0.17 0.38 0.00?
N/A N/A N/A
Time 0.062 0.36 0.00 0.20 0.38 0.25* 0.154 0.20 Medium
Geometry 0.132 0.53 0.08 0.33 0.38 0.25? N/A N/A N/A
a. ** p<0.000 *p<0.05 ?cannot compare
TABLE IV. CLUSTERING TREATMENT STUDENTS USING SIMPLE K-MEANS
Attribute Full Data
Centroid
Cluster Centroids
#0 #1 #2
# Students (%) 148 (100%) 61 (41%) 52 (35%) 35 (24%)
Age 7.97 7.53 7.46 9.51
Pre-score 0.577 0.47 0.68 0.60
Gain 0.211 0.362 0.026 0.221
indicated by a few representative comments made by teachers as shown below.
The first teacher has been a grade 2 teacher for the past 22 years. Here are some direct quotations when asked about the effectiveness of the intervention.
“I used to experience a hard time in keeping my students
interested and engaged while teaching. I think it is easier to
understand, rather than make anyone understand
something…This issue was resolved when our school agreed
to start Numeracy Boost training for the teachers. In this
program teachers are given activity based pedagogy training
in all the key concepts of math. It was like an answer to my
prayers. I started teaching my students through group
activities, games, charts, manipulatives and tablets. I was
pleasantly surprised to notice that the interest and
engagement level of my students had increased. Now instead
of being bored in class every day, they began anxiously
waiting to learn new things.”
This teacher also recounts interaction with one child as
described below.
“One of my students, Bilal is a Pashto speaking mentally
challenged 8 year old child, who used to sit silently in my
class. He seldom participated in the class. After introducing
group work and math games in my class I saw a marked
change in his attitude. I believe this became possible due to
the change in my teaching practices.”
Another teacher recollects a similar story about a child called Hassan who is ten years old with hearing and speech impairment and had not attended school for a long time before joining grade 2. This teacher’s comments about this child are given below.
“After getting Numeracy Boost training we learnt how to
improve and create an environment which is attractive for
such children. The print rich environment proved as the first
remedy to catch Hassan’s attention in class and he became
more regular. Not only was he able to feel and see the
manipulatives, but he could understand their purpose as well.
Gradually in the trainings we got the ideas to engage the
students by activity based teaching and this strategy worked
well. Teachers engaged Hassan in different activities using the
tablet, fake currency and counters to teach. His interest
continually increased in the learning math. He used to play
with these resources and he tried to sort them out in different
and random ways. They also taught him by engaging him in
different activities and he proved himself as one of the
intelligent students of the class. He easily picked what was
taught in the class.”
VI. DISCUSSION AND CONCLUSION
This paper has advocated a holistic and a pragmatic approach to providing technology-enhanced numeracy education in developing countries that incorporates the ground realities of such environments. The results of this pilot study are encouraging for a variety of reasons. First, even in the first year of the intervention, medium learning gains were achieved when compared with a control group. Secondly, it seems that this type of intervention tended to benefit the lowest of the marginalized children more than others. In addition, the teachers and administrators were generally positive about how well the approach worked. Another key aspect of this intervention not mentioned earlier is the relatively low cost of US$14 per child per year even on a smaller scale of tens of schools. In a country like Pakistan where public schools spend around $140 per child per year, this amounts to about 10% of the total yearly budget and is not unreasonable.
Based on this one intervention, however, it is difficult to generalize how well this approach will work at a provincial or a national level and whether the gains would multiply if the approach is repeated for multiple school years. However, because of the leverage provided through use of technology, the approach can scale potentially scale to a large number of

schools and children in geographically dispersed locations. Increasing the scale will bring with it economies that should further reduce the cost per learner.
REFERENCES
[1] “Pisa 2012 results in focus: What 15-year-olds know and what they can do with what they know,” OECD 2013, 2013.
[2] B. P. Woolf, I. Arroyo, and I. A. Zualkernan, “Education technology for the developing world,” in The IEEE Global Humanitarian Technology Conference, October 30 – November 1, 2011, Seattle, Washington, USA., 2011.
[3] P. Brest, “The power of theories of change,” Stanford Social Innovation Review, vol. 8, no. 2, pp. 47–51, 2010.
[4] M. Hossain, “Numeracy boost: Improving early grades math outcomes in primary schools in bangladesh,” in m-Numeracy Workshop Series, May 7, 2014., 2014.
[5] A. Reubens, “Early grade mathematics assessment (egma): A conceptual framework based on mathematics skills development in children,” RTI
International, Research Triangle Park, NC 27709-2194, Tech. Rep., 2009.
[6] I. A. Zualkernan and A. Karim, “Using a traveling van to deliver blended learning in a developing country,” in Proceedings of the13th IEEE International Conference on Advanced Learning Technologies, July 15-18, 2013, Beijing, China., 2013.
[7] J. A. Stallings, “Follow through program classroom observation evaluation 1971-72.” 1973.
[8] J. Cohen, Statistical power analysis for the behavioral sciences (2nd ed.). Hillsdale, NJ: Lawrence Earlbaum Associates., 1988.
[9] H. W. Wend, “Dealing with a common problem in social science: A simplified rank-biserial coefficient of correlation based on the u statistic,” European Journal of Social Psychology, vol. 2, no. 4, pp. 463–465, 1972.
[10] F. Provost and T. Fawcett, Data Science for Business: What you need to know about data mining and data-analytic thinking. O’Reilly Media; 1 edition (July 27, 2013)., 2013.