using student test scores to measure principal performance ... · using student test scores to...
TRANSCRIPT

NBER WORKING PAPER SERIES
USING STUDENT TEST SCORES TO MEASURE PRINCIPAL PERFORMANCE
Jason A. GrissomDemetra Kalogrides
Susanna Loeb
Working Paper 18568http://www.nber.org/papers/w18568
NATIONAL BUREAU OF ECONOMIC RESEARCH1050 Massachusetts Avenue
Cambridge, MA 02138November 2012
This research was supported by a grant from the Institute of Education Sciences (R305A100286). We would like to thank the leadership of the Miami-Dade County Public Schools for the help theyhave given us with both data collection and the interpretation of our findings. We are especially thankfulto Gisela Field, who makes this work possible. We are also grateful to Mari Muraki for excellent datamanagement. All errors are the responsibility of the authors. The views expressed herein are thoseof the authors and do not necessarily reflect the views of the National Bureau of Economic Research.
NBER working papers are circulated for discussion and comment purposes. They have not been peer-reviewed or been subject to the review by the NBER Board of Directors that accompanies officialNBER publications.
© 2012 by Jason A. Grissom, Demetra Kalogrides, and Susanna Loeb. All rights reserved. Short sectionsof text, not to exceed two paragraphs, may be quoted without explicit permission provided that fullcredit, including © notice, is given to the source.
Using Student Test Scores to Measure Principal PerformanceJason A. Grissom, Demetra Kalogrides, and Susanna LoebNBER Working Paper No. 18568November 2012JEL No. I21
ABSTRACT
Expansion of the use of student test score data to measure teacher performance has fueled recent policyinterest in using those data to measure the effects of school administrators as well. However, littleresearch has considered the capacity of student performance data to uncover principal effects. Fillingthis gap, this article identifies multiple conceptual approaches for capturing the contributions of principalsto student test score growth, develops empirical models to reflect these approaches, examines the propertiesof these models, and compares the results of the models empirically using data from a large urbanschool district. The paper then assesses the degree to which the estimates from each model are consistentwith measures of principal performance that come from sources other than student test scores, suchas school district evaluations. The results show that choice of model is substantively important forassessment. While some models identify principal effects as large as 0.15 standard deviations in mathand 0.11 in reading, others find effects as low as 0.02 in both subjects for the same principals. Wealso find that the most conceptually unappealing models, which over-attribute school effects to principals,align more closely with non-test measures than do approaches that more convincingly separate theeffect of the principal from the effects of other school inputs.
Jason A. GrissomPMB #414230 Appleton PlaceNashville, TN [email protected]
Demetra KalogridesStanford University520 Galvez Mall DriveStanford CA, [email protected]
Susanna Loeb524 CERAS, 520 Galvez MallStanford UniversityStanford, CA 94305and [email protected]

1
Using Student Test Scores to Measure Principal Performance
Jason A. Grissom* Demetra Kalogrides†
Susanna Loeb‡
***
Abstract Expansion of the use of student test score data to measure teacher performance has fueled recent policy interest in using those data to measure the effects of school administrators as well. However, little research has considered the capacity of student performance data to uncover principal effects. Filling this gap, this article identifies multiple conceptual approaches for capturing the contributions of principals to student test score growth, develops empirical models to reflect these approaches, examines the properties of these models, and compares the results of the models empirically using data from a large urban school district. The paper then assesses the degree to which the estimates from each model are consistent with measures of principal performance that come from sources other than student test scores, such as school district evaluations. The results show that choice of model is substantively important for assessment. While some models identify principal effects as large as 0.15 standard deviations in math and 0.11 in reading, others find effects as low as 0.02 in both subjects for the same principals. We also find that the most conceptually unappealing models, which over-attribute school effects to principals, align more closely with non-test measures than do approaches that more convincingly separate the effect of the principal from the effects of other school inputs.
***
Recently, policymakers have shown increased interest in evaluating school
administrators based in part on student test score performance in their schools. As an example,
in 2011 Florida enacted Senate Bill 736, also known as the “Student Success Act,” which
stipulates that at least 50 percent of every school administrators’ evaluation must be based on
student learning growth as measured by state assessments (Florida Senate, 2011). The bill also
orders districts to factor these evaluations into compensation decisions for principals. A year
earlier, in Louisiana, Governor Bobby Jindal signed House Bill 1033, which similarly requires
school districts to base a portion of principals’ evaluations on student growth by the 2012-2013
school year (Louisiana State Legislature, 2010). Florida and Louisiana’s enactments follow
Tennessee’s statewide principal evaluation policy, which requires that “[f]ifty percent of the
evaluation criteria shall be comprised of student achievement data, including thirty-five percent * Peabody College, Vanderbilt University. Email: [email protected]. † Center for Education Policy Analysis, Stanford University. Email: [email protected]. ‡ Center for Education Policy Analysis, Stanford University. Email: [email protected].
2
based on student growth data…”; these evaluations are used to “inform human capital decisions,
including… hiring, assignment and promotion, tenure and dismissal, and compensation”
(Tennessee State Board of Education, 2011). Elsewhere, school districts are experimenting with
the use of student test scores to determine administrator pay. For instance, since 2007,
principals in Dallas Independent School District have been eligible for an opt-in performance
pay plan through which they can earn up to $2,000 on the basis of a measure of their
performance from student test score gains (Center for Educator Compensation Reform, n.d.).
A potentially disconcerting facet of the burgeoning movement to utilize student test
score data to measure the performance of school administrators is that it is proceeding with
little guidance into how this measurement might best be accomplished. That is, while
researchers have devoted significant energy to investigating the use of student test scores to
evaluate teacher performance (e.g., Aaronson, Barrow and Sander, 2007; Rivkin, Hanushek and
Kain, 2005; Rockoff, 2004; McCaffrey, Sass and Lockwood, 2009; Koretz, 2002; McCaffrey
et.al. 2004; Sanders and Rivers, 1996), far less work has considered this usage in the context of
principals (Lipscomb et al., 2010; Branch, Hanushek, & Rivkin, 2012; Chiang, Lipscomb, & Gill,
2012; Coelli & Green, 2012; Dhuey & Smith, 2012). This paper is one of the first to examine
measures of principal effectiveness based on student test scores both conceptually and
empirically and the first that we know of to see how these measures compare to alternative
(non-test-based) evaluation metrics, such as district holistic evaluations.
Though research on the measurement of teacher value-added certainly is relevant to the
measurement of principal effects, the latter raises a number of issues that are unique to the
principal context. For example, disentangling the impact of the educator from the long-run
impact of the school presents particular difficulties for principals in comparison to teachers
because there is only one principal at a time in each school. Even in theory, it is difficult to
choose how much of the school’s performance should be attributed to the principal instead of
the factors outside of the principal’s control. Should, for example, principals be responsible for
3
the effectiveness of teachers that they did not hire? From the point of view of the school
administrator whose compensation level or likelihood of remaining in his or her job may depend
on the measurement model chosen, thoughtful attention to these details is of paramount
importance. From the point of view of researchers seeking to identify correlates of principal
effectiveness, the question of how best to isolate principal contributions to the school
environment from panel data is of central importance as well.
In contributing to the nascent literature on the use of student test score data to measure
principal performance, this paper has four goals. First, it identifies a range of possible value-
added-style models for capturing principal effects using student achievement data. Second, it
describes what each of these models measures conceptually, highlighting potential strengths,
weaknesses, and tradeoffs. Third, it uses longitudinal student test score and personnel data from
a large urban district to compare the estimates of principal performance generated by each
model, both to establish how well they correlate with one another and to assess the degree to
which model specification would lead to different conclusions about the relative performance of
principals within each district. Finally, the paper compares the results from the different models
of principal value-added effectiveness to subjective personnel evaluations conducted by the
district central office and survey assessments of principal performance from their assistant
principals and teachers. This approach is in keeping with recent work assessing the relationship
between teachers’ value-added measures of effectiveness and other assessments such as
principal evaluations, structured observational protocols, and student surveys (e.g., Jacob &
Lefgren, 2008; Kane & Staiger, 2012; Grossman et. al., forthcoming).
The study identifies three key issues in using test scores to measure principal
effectiveness: theoretical ambiguity, potential bias, and reliability. By theoretical ambiguity we
mean lack of clarity about what construct is actually being captured. By potential bias we mean
that some methods may misattribute other factors (positively or negatively) to principal
performance. By reliability, or lack thereof, we mean that some approaches create noisy
4
measures of performance, an issue that stands out as particularly salient for district-level
evaluation where the number of schools is relatively small.
The remainder of the paper proceeds as follows. The next section reviews the existing
literature on the measurement of educator effects on students, detailing prior research for
principals and highlighting issues from research on teachers that are relevant to the
measurement of principal performance. The third section describes possible models for
identifying principal performance from student test score data, which is followed by a
description of the data used for the empirical section of the paper. The next section presents
results from estimating and comparing the models. The subsequent section compares these
results to other, non-test measures. The last section discusses the implications of this study,
summarize our conclusions, and offer directions for future research.
Using Student Test Scores to Measure Educator Performance
A large number of studies in educational administration have used student test score
data to examine the impact of school leadership on schools (for reviews, see Hallinger & Heck,
1998; Witziers, Bosker, & Krüger, 2003). Often, however, these studies have relied on cross-
sectional data or school-level average scores, which have prevented researchers from estimating
leadership effects on student growth (rather than levels) or controlling appropriately for student
background and other covariates, though there are exceptions. For example, Eberts and Stone
(1988) draw on national data on elementary school students to estimate positive impacts of
principals’ instructional leadership behaviors on student test scores. Brewer (1993) similarly
used the nationally representative, longitudinal High School and Beyond data to model student
achievement as a function of principal characteristics, finding some evidence that principals’
goal setting and teacher selection were associated with student performance gains. In more
recent work, Clark, Martorell, and Rockoff (2009), using data from New York City, estimate the
relationship between principal characteristics and principal effectiveness as measured by

5
student test score gains. The study finds principals improve with experience, especially during
their first few years on the job. Similarly, Grissom and Loeb (2011) compare principal
characteristics—in this case, principals’ and assistant principals’ assessments of the principals’
strengths—to student achievement growth. They find that principals with stronger organization
management skills (e.g., personnel, budgeting) lead schools with greater student achievement
gains.
Although these past studies have demonstrated linkages between principal
characteristics or behaviors and student performance, only four studies that we know of—all but
one of which are work in progress—use student achievement data to model the value-added of
school principals directly. Coelli and Green (2012), the only published paper in this group,
estimates the effects of principals on high school graduation and 12th grade final exam scores in
British Columbia, Canada. A benefit of this study is that it examines an education system that
rotates principals through schools, allowing them to compare outcomes for the same school with
different principals, though they cannot follow students over time and are limited to high school
outcomes. The authors distinguish a model of principal effects on students that are constant
over the period that the principal is in the school from one that allows for a cumulative effect of
the principal that builds over time. They find little to no effect of principals using the first model
but a substantial effect after multiple years using the second approach (e.g., a 2.6 percentage
point increase in graduation associated with a one standard deviation change in principal
effectiveness).
Branch, Hanushek, and Rivkin (2012) use student-level data from Texas from 1995 to
2001 to create two alternative measures of principal effectiveness. The first measure estimates
principal-by-school effects via a regression that models student achievement as a function of
prior achievement as well as student and school characteristics. Their second approach, similar
to Coelli and Green (2012) but using longitudinal test score data, includes both these controls
and school fixed effects. The paper focuses on the variance of principal effectiveness using these

6
measures and a direct measure of variance gained by comparing year-to-year covariance in years
that schools switched principals and years that they did not. The paper provides evidence of
meaningful variation across principals—by their most conservative estimates, a school with a
principal whose effectiveness is one standard deviation above the mean will have student
learning gains at 0.05 standard deviations greater than average—but does not directly compare
relationships among measures.
Dhuey and Smith (2012) use data on elementary and middle school students, again in
British Columbia, and estimate the effect of the principal on test performance using a school and
principal fixed effect model that compares the learning in a school under one principal to that
under another principal, similar to Branch et. al.'s (2012) school fixed effect approach. They also
include a specification check without school fixed effects. The study finds large variation across
principals using either approach (0.16 standard deviations of student achievement score in math
and 0.10 in reading for the fixed effects model).
Finally, Chiang, Lipscomb, and Gill (2012) use data on elementary and middle school
students in Pennsylvania to answer the question of how much of the “school effect” on student
performance can be attributed to the principal. They estimate principal effects within grades and
schools for schools that undergo leadership transitions over a three year period, then use those
effects to predict school effectiveness in a fourth year in a different grade. They find that, while
principals do impact student outcomes, principals only explain a small portion (approximately
15%) of the overall school effect and conclude that school value-added on its own is not useful
for evaluating the contributions of principals.
Each of these papers quantifies variance in principals' effects and underscores the
importance of separating the school effect from the principal effect. However, none of these
studies focus on the ambiguity of what aspects of schools should be separated from principals,
nor do they discuss how to account for average differences across schools in principal

7
effectiveness. Moreover, none of these studies compare the principal value-added measure to
non-test-based measures.
Is Principal Value-Added Like Teacher Value-Added?
Unlike the sparse literature linking principals to student achievement, the parallel
research on teachers is rich and rapidly developing. Rivkin, Hanushek, and Kain (2005)
demonstrated important variation in value-added across teachers in Texas, building on earlier
work in Tennessee (e.g., Sanders & Rivers, 1996). The signal-to-noise ratio of single-year
measures of teachers’ contributions to student learning is often low, though the persistent
component still appears to be practically meaningful (McCaffrey, Sass & Lockwood, 2009;
McCaffrey, Lockwood, Koretz, & Hamilton, 2004). One of the biggest concerns with teacher
value-added measures comes from the importance of the test used in the measure. Different
tests give different rank orderings for teachers (Lockwood et. al., 2007). Multiple researchers
have raised concern about bias in the estimates of teachers value-added (Rothstein, 2009),
though recent research using experimental data provides evidence of meaningful variation in
effectiveness across teachers that have long-run consequences for students (Chetty et. al., 2011).
These long-run effects persist, even though the direct effect of teachers on student achievement
fades out substantially over the first few years (Jacob, Lefgren, & Sims, 2010).
Measuring principal performance using student test scores no doubt faces many of the
same difficulties as measuring teacher performance using student test scores. The test metric
itself is likely to matter (Measures of Effective Teaching Project, 2010). Measurement error in
the test, compounded by using changes over time, will bring error into the value-added measure
(Boyd, Lankford, Loeb & Wyckoff, 2012). The systematic sorting of students across schools and
classrooms can introduce bias if not properly accounted for.
At first blush, then, we may be tempted to conclude that the measurement issues
surrounding principals are similar to those for teachers, except perhaps that the typically much

8
large number of students available to estimate principal effects will increase precision. Closer
examination, however, suggests that measuring principal effects introduces a set of concerns
teacher estimates may not face to the same extent. As an example, consider the criticism leveled
at teacher effects measurement that teachers often do not have control over the educational
environment in their classrooms and thus should not be held accountable for their students’
learning. For instance, if they are required to follow a scripted curriculum, then they may not be
able to distinguish themselves as effective instructors. This concern is even greater for
principals, who, by virtue of being a step removed from the classroom, have even less direct
control over the learning environment and who often come into a school that already has a
complete (or near complete) teaching workforce that they did not help choose.
Moreover, in comparison to teachers, the number of principals in any school district is
quite small. These low numbers mean that a good comparison between principals working in
similar situations—which we often make via a school fixed effect in teacher value-added
models—may be difficult to identify, and thus, it is more difficult to create fair measures of
effectiveness. A final potentially important conceptual issue arises from the fact that—unlike the
typical teacher—principals who work in the same school over time will have repeated effects on
the same students over multiple academic years as those students move through different grades
in the principal’s school. The following section explores these issues in more detail and their
implications for measuring principals’ value added to student achievement.
Modeling Principal Effects
The question of how to model principal effects on student learning depends crucially on
the structure of the relationship between a principal’s performance and student performance. To
make this discussion explicit, consider the following equation:
𝐴𝑖𝑗𝑠 = 𝑓(𝑋𝑖𝑗𝑠, 𝑆�𝑃𝑗𝑠,𝑂𝑠�)

9
This equation simply describes a student i's achievement as some function f of their own
characteristics X and the effectiveness of the school S. School effectiveness, in turn, is a function
of the performance P of the student’s principal (j) and other aspects O of the school (s) that are
outside of the control of the principal. In other words, both the level of a principal’s performance
and other aspects of the school affect student outcomes. The important question is what we
believe about the properties of function S, which describes how the principal affects the school’s
performance.
Two issues are particularly germane. The first is the time frame over which we expect the
effects to be realized. Are the full effects of principal performance on school effectiveness, and
thus student outcomes, immediate; that is, is the function S such that high performance P by the
principal in a given school year is reflected in higher school effectiveness and higher student
outcomes in that same year? Alternatively, is S cumulative such that only with several
consecutive years of high P will A increase? To illustrate the difference and why it is important,
consider a principal who is hired to lead a low-performing school. Suppose the principal does an
excellent job from the very beginning (i.e., P is high). How quickly would you expect that
excellent performance to be reflected in student outcomes? The answer depends on the nature of
principal effects. If effects come through channels such as assigning teachers to classrooms
where they can be more effective or providing teachers or students incentives or other
encouragement to exert more effort, they might be reflected in student performance
immediately. If, on the other hand, effects come through changes to the school environment that
take longer to show results—such as doing a better job recruiting or hiring good teachers—even
excellent principal performance may take multiple years to be reflected in student outcomes.
The second issue is distinguishing the principal effect from other characteristics of the
school outside of the principal influence; that is, distinguishing P from O. One possibility is that
the O is not very important. It may be that the vast majority of school effects are attributable to
the principal’s performance, with the possible exception of peer effects, which could be captured
10
by observable characteristics of students such as the poverty rate and the average academic
achievement of students before entering the school. In this case, identifying the overall school
effect is sufficient for identifying the principal performance effect. A second possibility is that
these other school characteristics, O, that are outside of the principal's control are important for
school effectiveness. For example, some schools may have a core group of teachers that inspire
other teachers to be particularly effective, or they may have supportive community leaders who
bring resources into the school to support learning. In this case, if the goal is to identify
principal effectiveness it will be important to net out the underlying school effects.
With this simple conceptual model in mind, we describe three alternative approaches to
using data on A to differentiate performance P. The appropriateness of each approach again
depends on the underlying nature of principals’ effects, which are unknown.
Approach 1: School Effectiveness
Consider first the case in which principals have immediate effects on student learning
that does not vary systematically over time. For this first approach, also assume that the
principals have substantial control over the factors that affect students. If these assumptions
hold, an appropriate approach to measuring the contribution of that principal would be to
measure the learning of students in the school while the principal is working there, adjusting for
the background characteristics of students. This common approach is essentially the same as
the one used to measure teacher effects (Lipscomb et. al., 2010); we assume that teachers have
immediate effects on students during the year that they are in the teacher’s classroom, so we
take students’ growth during that year—adjusted for a variety of controls, perhaps including
lagged achievement and student fixed effects—as a measure of the teacher’s effect. For
principals, any growth in student learning that is different than what would be predicted for a
similar student in a similar context is attributed to the principal, just as the same growth within
a teacher’s classroom is attributed to the teacher.

11
For teachers, such an approach has face validity. Teachers have direct and individual
influences on the students in their classrooms, so—assuming the inclusion of the appropriate set
of covariates—it makes sense to take the adjusted average learning gains of a teacher’s students
during a year as a measure of the teacher’s effect. The face validity of this kind of approach,
however, is not as strong for principals. While some of the effectiveness of a school may be due
to the current principal, much of it may be due to factors that were in place prior to the principal
assuming the leadership role and are outside of the control of the principal. As an example,
often many of the teachers who teach under the leadership of a given principal were hired before
the principal took over. Particularly in the short run, it would not make sense to attribute all of
the contributions of those teachers to that principal. Under this conceptual approach, an
excellent new principal who inherits a school filled with low-quality teachers—or, conversely, an
inadequate principal hired into a school with high-quality teachers—might incorrectly be
debited or credited with school results disconnected from his or her own job performance.
Approach 2: Relative Within-School Effectiveness
As described above, there may be school characteristics aside from the student body
composition that affects school effectiveness and are outside the control of the principal. A
community leader providing unusual support to the school or a teacher or set of teachers who
are particularly beneficial to school culture during the tenure of multiple principals are possible
examples. One way to account for the elements of school effectiveness that are outside of
principals’ control is to compare the effectiveness of the school during the principal’s tenure to
the effectiveness of the school at other times. The measure of a principal’s effectiveness would
then be how effective the school is at increasing student learning while the principal is in charge
in comparison to how effective the school is (or was) at other times when another person holds
the principal position. Conceptually, this approach is appealing if we believe the quality of the

12
school that a principal inherits affects the quality of that school during the principal's tenure, as
it most likely does.
There are, however, practical reasons for concern with within-school comparisons,
namely that the comparison sets that can be tiny and, as a result, idiosyncratic. This approach
holds more appeal when data are available over a long enough period of time for the school to
experience many principals. However, if there is little principal turnover or the data stream is
short, this approach may not be feasible or advisable. Schools with only one principal during the
period of observation will have no variation with which to differentiate the principal effect from
the school effect, regardless of how well or poorly the principal performs. Schools with two or
three principals for each school over the duration of the data will allow a principal effect to be
differentiated, but we may worry about the accuracy of the resulting principal effects estimates
as measures of principal performance. Because each principal’s estimate is in relation to the
other principals who have served in that school in the data, how well the others performed at the
principal job can impact a given principal’s estimated effect on the school. Consider the simplest
case where only two principals are observed, and assume principal A is exactly in the middle of
the distribution of actual principal performance. If principal B is a poor performer, under the
relative school effectiveness approach, principal A will look good by comparison. If B is an
excellent performer, A will look poor, even though her actual performance was the same as in
the first case.
The sorting of principals across schools acerbates the potential problem with this
approach. Extant research provides evidence that principals, like teachers, are not sorted
randomly across schools. Schools serving many low-income, non-white, and low-achieving
students have principals who have less experience and less education and who attended less
selective colleges (Loeb, Kalogrides, & Horng, 2010). If principals are distributed systematically
across schools such that more effective principals are consistently in some schools but not in
others, then the comparison of a given principal to other principals who lead the same school is

13
not a fair comparison. This dilemma is similar to the one faced in estimating teacher effects. If
teachers are distributed evenly across schools, then comparing a teacher to other teachers in
their school is a fair comparison and eliminates the potential additional effect of school factors
outside of the classroom. However, if teachers are not distributed evenly across schools, then
this within-school comparison disadvantages teachers in schools with better colleagues.
Similarly, the estimated effect of the second-best principal in the district might be negative
under this approach if she simply had the bad luck of being hired into the spot formerly held by
the first-best principal, even if she would have had (potentially large) positive estimated effects
in nearly every other school.
Approach 3: School Improvement
So far we have considered models built on the assumption that principal performance is
reflected immediately in student outcomes and that this reflection is constant over time.
Perhaps more realistic, however, is an expectation that new principals take time to affect their
schools and their effect builds over time. Much of what a good principal may do is improve the
school through building a productive work environment (e.g., through hiring, professional
development, and building relationships), which may take several years to achieve. If so, we may
wish to employ a principal effects model that accounts for this time dimension.
One such alternative measure of principal effectiveness would capture the improvement
in school effectiveness during the principal’s tenure. That is, the school may have been relatively
ineffective in the year prior to the principal starting, but if the school improves over the duration
of the principal’s tenure, then that improvement would be a measure of his or her effectiveness.
Similarly, if the school’s performance declines as the principal’s tenure in the school extends, the
measure would capture that as well.
The appeal of such an approach is its clear face validity. However, it has disadvantages.
In particular, the data requirements are substantial. There is measurement error in any measure

14
of student learning gains, and differencing these imperfectly measured variables to create a
principal effectiveness measure increases the error (Kane & Staiger, 2002; Boyd, Lankford,
Loeb, & Wyckoff, 2012). There simply may not be enough signal in average student
achievement gains at the school level to get acceptably reliable measures of improvement. That
is, this measure of principal effectiveness may be so imprecise as to provide little evidence of
actual effectiveness. In addition, this approach faces the same challenges of the second
approach in that if the school was already improving because of work done by prior
administrators, we may overestimate the performance of principals who simply maintain this
improvement. Similarly, if the school was doing well but had a bad year just before the
transition to the new principal then by measuring improvement relative to this low starting
point, the approach might not accurately capture the principal's effectiveness.
These three approaches—school effectiveness, relative school effectiveness, and school
improvement—provide conceptually different measures of principal effectiveness. They each
are based on a conceptually different model of principals’ effects and the implementation of each
model will lead to different concerns about bias (validity) and precision (reliability). The goal of
the analyses below is to create measures based on each of these conceptual approaches, compare
them to one another, and compare them to other, non-test-based measures of principal
performance.
Data
The data used in this study come from administrative files on all staff, students, and
schools in the Miami-Dade County Public Schools (M-DCPS) district from the 2003-04 through
the 2010-11 school years. M-DCPS is the largest public school district in Florida and the fourth
largest in the United States, trailing only the school districts in New York City, Los Angeles, and
Chicago. In 2010, M-DCPS enrolled 347,000 students, more than 225,000 of whom were

15
Hispanic. Nearly 90 percent of students in the district are either black or Hispanic, and 60
percent qualify for free or reduced priced lunches.
We use measures of principal effectiveness based on the achievement gains in math and
reading of students at a school. The test score data include math and reading scores from the
Florida Comprehensive Assessment Test (FCAT). The FCAT is given in math and reading to
students in grades 3–10. It is also given in writing and science to a subset of grades, though we
use only math and reading scores for this study. The FCAT includes criterion referenced tests
measuring selected benchmarks from the Sunshine State Standards (SSS). We standardize
students’ test scores to have a mean of zero and a standard deviation of one within each grade
and school-year.
We combine the test score data with demographic information, including student race,
gender, free/reduced price lunch eligibility, and whether students are limited English proficient.
We can link students to their schools and thus to their principals in each year. We obtain M-
DCPS staff information from a database that includes demographic measures, prior experience
in the district, highest degree earned, and current position and school for all staff members.
In addition to creating measures of principals’ value-added and contrasting these
measures, we also compare the value-added measures to non-test-based measures of
performance that we obtained from a variety of sources. First, we compare the measures to the
school accountability grades and to the district evaluations of the principals. Florida grades
each school on a 5-point scale (A, B, C, D, F) that is meant to succinctly capture performance.
Grades are based on a scoring system that assigns points to schools for their percentages of
students achieving the highest levels in reading, math, science, and writing on Florida’s
standardized tests in grades 3 through 10, or who make achievement gains. Grades also factor in
the percentage of eligible students who are tested and the test gains of the lowest-performing
students.

16
M-DCPS leadership also evaluates principals each year, and we obtained these
evaluation outcomes from the district for the 2001 through 2010 school years. In each year,
there are four distinct evaluation ratings, though the labels attached to these ratings vary across
years. The highest rating is either distinguished or substantially exceeds standards; the second
highest rating is exceeds standards or commendable; the third highest rating is competent,
meets standards or acceptable; while the lowest rating is below expectations. Over the ten-year
observation period, about 47 percent of principal by year observations received the highest
ratings, 45 percent received the second-to-highest rating, while fewer than 10 percent received
one of the lower two ratings. We code the ratings on an ordinal scale from 1 to 4 and take their
average for all years that a principal is employed at a given school.
Second, we compare the value-added measures to student, parent and school staff
assessment of the school climate from the district-administered climate survey. These surveys
ask a sample of students, teachers, and parents from each school in the district to agree or
disagree with following three statements: 1) students are safe at this school; 2) students are
getting a good education at this school; and 3) the overall climate at this school is positive and
helps students learn at this school. A fourth item asks respondents to assign a letter grade (A–F)
to their school that captures its overall performance. The district provided these data to us from
the 2004 through the 2009 school years. They had collapsed the data to the school-year level so
that our measures capture the proportion of parents, teachers or students that agree with a
given statement as well as the average of the grades respondents would assign to their school.
We create three scales based on student, teacher and parent responses that combine these four
questions. We take the first principal component of the four measures in each year and then
standardize the resulting factor scores for students, teachers, and parents.1
1 In all cases the weights on the four elements of each factor are approximately equal and the eigenvalues are all 3.4.
17
Third, we compare the measure to principals’ and assistant principals’ assessments of
the principals that we obtained from an online survey we administered in regular M-DCPS
public schools in spring 2008. Nearly 90% of surveyed administrators responded. As described
in Grissom and Loeb (2011), both principals and assistant principals were asked about principal
performance on a list of 42 areas of job tasks common to most principal positions (e.g.,
maintaining a safe school environment, observing classroom instruction). We use factor scores
of these items to create self-ratings and AP ratings of aggregate principal performance over the
full range of tasks, as well as two more targeted measures that capture the principal’s
effectiveness at instruction and at organizational management tasks, such as budgeting and
hiring. We chose these specific task sets because of evidence from prior work that they are
predictive of school effectiveness (Grissom & Loeb, 2011; Horng, Klasik, & Loeb, 2010).
Our final comparisons are between the principal value-added measures and two indirect
measures of school health: the teacher retention rate and the student chronic absence rate. The
retention rate is calculated as the proportion of teachers in the school in year t who returned to
that same school in year t+1. The student chronic absence rate is the is the proportion of
students absent more than 20 days in a school in a given year, which is the definition of chronic
absence used in Florida’s annual school indicators reports. Table 1 describes the variables that
we use in our analyses. Overall we have 523 principals with 719 principal-by-school
observations. Sixty seven percent of the principal-by-school observations are for female
principals, while 23 percent, 35 percent and 41 percent are for white, black and Hispanic
principals respectively. The student body is less white, only 8 percent, and substantially more
Hispanic. The accountability grades for schools range from 0 to 4, with an average of 2.81.
Principal ratings are skewed with an average of 3.54 on a four point scale. Approximately 82
percent of teachers return to their school the following year. On average approximately 10
percent of students are absent for more than 20 days.

18
Model Estimation
In keeping with the discussion above, we estimate three types of value-added measures
based on different conceptions about how principals affect student performance: school
effectiveness during a principal’s tenure, relative within-school effectiveness, and school
improvement. This section describes the operationalization of each approach.
Approach 1: School Effectiveness
We estimate two measures of school effectiveness during a principal’s tenure. Equation
1a describes the simplest of the models where the achievement, A, of student i in school s with
principal p in time t is a function of that student’s prior achievement, student characteristics, X,
school characteristics, S, class characteristics, C, year and grade fixed effects and a principal-by-
school fixed effect, δ, the estimate of which becomes our first value-added measure.
isptspgysptsptispttisispt CSXAA εδγτββββ +++++++= − 4321)1( (1a)
This model attributes to the principal the additional test performance that a student has relative
to what we would predict he or she would have given the prior year test score and the
background characteristics of the student and his or her peers. In other words, this model
defines principal effectiveness to be the average covariate-adjusted test score growth for all
students in that principal’s school over the time the principal works there. This approach is
similar to models typically used to measure teacher value-added, which measure teacher
effectiveness as the average growth of the teachers’ students in the years they pass through his
or her classroom. One drawback of using this approach for principals is that the principal might
have affected both prior years’ performance and the current performance if the principal was in
the same school the year before, a limitation that teacher models are assumed not to face (since
fourth grade teachers cannot directly affect third graders’ learning, for example). However, this
approach does still capture whether the learning gain during the year is greater than would be
predicted given other factors in the model.

19
The second model capturing the school’s effectiveness during a principal’s time is
summarized by Equation 1b. It is similar to the approach above except that, instead of
comparing students to observationally similar students, it compares the learning of a given
student to his or her own learning when in a school headed by a different principal. Here the
change in student achievement from t-1 to t is modeled as a function of the student’s time-
varying characteristics, the school characteristics, class characteristics, a student fixed effect
(πi), and student-level random error. The principal-by-school fixed effect, δ, is again the
effectiveness measure.
isptspgyisptsptispttispispt CSXAA εδγτπβββ +++++++=− − 432)1( (1b)
The second model differs from the first primarily by including a student fixed effect,
which adjusts for unobservable characteristics of students. However, student fixed effects
models have the disadvantage of relying only on students who switch schools or have multiple
principals to identify the effects. Although we employ a data stream long enough to observe
both many students switching across school levels (i.e., structural moves) and many students
switching schools within grade levels, this requirement may reduce both the generalizability of
the results and reliability of the estimates. In fact, experimental research by Kane and Staiger
(2008) suggests that student fixed effects estimates may be more problematic than similar
models using a limited number of student covariates.
The test scores used to generate the value-added estimates in the models described
above are the scaled scores from the FCAT, standardized to have a mean of zero and a standard
deviation of one for each grade in each year. Subscripts for subjects are omitted for simplicity,
but we estimate each equation separately for student achievement in math and reading.
Because we use a lagged test score to construct our dependent variables or as a control variable
on the right hand side in some specifications, the youngest tested grade (grade 3) and the first
year of data we have (2003) are omitted from the analyses, though their information is used to
compute a learning gain in grade 4 and in 2004. The time-varying student characteristics used

20
in our analyses are whether the student qualifies for free or reduced priced lunch, whether they
are currently classified as limited English proficient, whether they are repeating the grade in
which they are currently enrolled, and the number of days they missed school in a given year
due to absence or suspension (lagged). Student race and gender are absorbed by the student
fixed effect in 1b but are included in models that exclude the student fixed effect (1a). The class
and school-level controls used in the models include all of the student-level variables aggregated
to the classroom and school-levels.
The value-added measures described above are principal-by-school fixed effects derived
from Equations 1a and 1b. After estimating the fixed effects models, we save the principal-by-
school fixed effect coefficients and their corresponding standard errors. The estimated
coefficients for these fixed effects include both real differences in achievement gains associated
with teachers or schools and measurement error. We therefore shrink the estimates using the
empirical Bayes method to bring imprecise estimates closer to the mean (see appendix 1),
though shrinking the school fixed effects tends not to change the estimates much given large
samples in each school.
Approach 2: Relative Within-School Effectiveness
As with approach 1, we create two measures of relative principal effectiveness comparing
a principal to other principals in the same school. Equation 2a describes our first value-added
measure for this approach.
isptpsgysptsptispttisispt CSXAA εδφγτββββ ++++++++= − 4321)1( (2a)
Like equation 1a, equation 2a models a student’s test score as a function of last year’s score,
student characteristics (X), (time-varying) school characteristics (S), and classroom
characteristics (C). Model 2a also includes a principal fixed effect (δ) and a school fixed effect
(φ), which nets out the average of students in the school during the full time period. The
21
principal value-added measures in this case are based on the principal fixed effects and shrunk
to adjust for measurement error as described above.
The model described in equation 2a implicitly compares each principal to other
principals serving in the same school. This specification reduces the amount of school
effectiveness that we attribute to the principal. Approach 1 above attributes all of the school’s
growth during a principal’s tenure to that principal, while equation 2a only attributes the
difference between the learning of students during the principal’s tenure and the learning of
students in the same school at other times.
There are drawbacks to this approach. We can only estimate models based on this
approach for principals who work at schools that have more than one principal during the time
span of the data, which limits the analytic sample. In addition, we might be concerned that a
comparison to just one or two other principals who served at the school might not be justified.
Another potential downside of the principal effects from Equation 2a is that estimating a
separate fixed effect for each school and each principal places substantial demands on the data
because it is completely non-parametric. That is, instead of controlling linearly for a measure of
school effectiveness, it estimates a separate value for each school’s effect.
As an alternative, we run a series of models that do not include the school fixed effect but
include controls for the average value-added of the school during the years that the principal
was not leading the school. Equation 2b describes this approach.
isptpgyssptsptispttisispt ECSXAA εδγτβββββ ++++++++= − 54321)1( (2b)
E is the effectiveness of school s in the years prior to the principal’s tenure. E is estimated using
a model similar to equation 1a, substituting a school-by-year fixed effect for a principal-by-year
fixed effect, then averaging the value of the (shrunken) school effect for school s in the years
prior to the start of principal i's tenure.
Note that, by shrinking our estimate of E, we are adjusting for sampling error to reduce
potential measurement error bias in the estimation of Equation 2b. However, to the extent that

22
E includes error beyond this sampling error—for example, a “shock” that affected the whole
school—this estimation will also be prone to measurement error bias. For this reason, equation
2a is preferable in terms of bias, though equation 2b might reduce the error of measurement.2
Approach 3: School Improvement
Our third approach defines principal effectiveness as school improvement during a
principal’s tenure. Equation 3 describes our first value-added measure capturing this
improvement.
isptsptspspgysptsptispttisispt TCSXAA εαδγτββββ ++++++++= − 4321)1( (3)
The model is similar to the one described in Equation 1a except that it includes a measure of the
time that the principal has been the principal of the school (entered as a linear time trend T) and
a principal-specific coefficient on that time trend, as well as a principal-by-school fixed effect, δ.
This approach allows a separate starting point or intercept for each principal and then allows the
school to improve under the principal’s leadership. In this case, our measure of principal value-
added is the time-trend coefficient, α; we shrink this estimate as described above.
Importantly, we restrict these models to principals working in a school at least three
years so that estimating a time trend in performance is meaningful. Because the administrative
files do not contain a measure of school-specific experience, we must further restrict these
models to principals that we observe in their first year at a school, which reduces the sample
substantially. This approach is cleaner than using all principal-school combinations because the
effects of a principal on school improvement may be very different in their first couple of years
than it is after they have been at the school for a longer period of time.
2 We also ran an alternative specification of Equation 2b which includes a student fixed effect and models the gains in achievement but includes the same independent variables as in Equation 1b. The results are similar to those without the student fixed effect, though attenuated. In the interest of brevity, we do not report the results, but they are available from the authors upon request.

23
The Distribution of Principal Effects
In total, we run five main models that capture five distinct measures of principal
effectiveness. Figure 1 plots the distributions of each of the measures for math and reading
value-added. The distributions are approximately normal for all the measures. Shrinking the
estimates narrows each distribution relatively little, as we would expect given the large number
of student observations used to derive each estimate. Still, there are patterns. Shrinkage affects
the estimates of Model 1b, which includes student fixed effects, more than model 1a. This
observation is not surprising given that student fixed effects models use substantially more
degrees of freedom. For Approach 2, the principal effects are narrowed more by shrinkage in
the estimates that include school fixed effects (Equation 2a) than in the model that include
controls for school effectiveness in other years. These differences are again not surprising
considering Model 2a includes school fixed effects while Model 2b does not. Approach 3, which
defines principal effectiveness by school improvement, begins with a narrow distribution and
narrows further by shrinkage. This narrowing is expected given that measuring improvement
(changes) exacerbates measurement error.
Table 2 provides the standard deviations of the estimates of principal effects from our
models as well as the values of our estimates at various percentiles. These standard deviations
are a measure of how much principals vary in their effect on student achievement. We report
the standard deviation of the coefficients from the models from which we get the estimates and
the standard deviation of the shrunken coefficients, which we use as our effectiveness measures.
The shrunken estimates are the best approximation of each principal’s effect, but the variance of
these shrunk estimates is an underestimation of the variance in the true principal effect. This
difference between the best estimates for the individual principals and the best estimate of the
variance of principal effects arises because each principal effect has more error—requiring
greater shrinkage—than do groups of principals, which is the basis of the variance calculations.
Because of this difference, we also report a third variance, which is simply the variance of the

24
fixed effects minus the mean of the squared standard errors. We label this term the “true”
standard deviation.
Looking across these effectiveness estimates, we first observe that they are generally in
the range of estimates obtained in other studies using different data and specifications. Dhuey
and Smith (2012), for example, estimate standard deviations of 0.09 to 0.16 in units of standard
deviations of student performance, while Branch et. al. (2012) estimates these at approximately
0.11, and Chiang et. al. (2012) estimates these at 0.05 to 0.09. Yet we also see that the variance
in the effect differs substantially by estimation approach. The measures based on the school
effectiveness models show the largest effect estimates. Model 1a has a standard deviation of 0.16
for math and 0.12 for reading, compared to 0.19 and 0.14 for the student fixed effects model
using the final standard error estimate. While shrinking narrows these distributions, the change
is relatively small. The standard deviations of the shrunk estimates are 0.15, 0.11, 0.13 and 0.09
respectively.
Our second approach conceptualizes principal effectiveness as value-added relative to
the value-added of the school when other principals are in charge. Here the standard deviations
are, not surprisingly, far smaller because we are removing the variation in value-added across
schools. The two models produce similar estimates of the standard deviation of the empirical-
Bayes shrunk estimates, 0.07 and 0.06 for math and o.03 and 0.04 for reading. The standard
errors of the coefficients are much larger for the approach that includes school fixed effects in
the model. This inclusion increases the noise/error in the estimates, and the resulting standard
deviations are approximately twice as high for the unshrunk coefficients in the model with
school fixed effects as in the model with controls for the schools estimated value-added.
The final approach estimates principal effectiveness as the increase in school
effectiveness during the principal’s tenure and is labeled as Model 3. The standard deviation of
the shrunk estimates are the smaller in these models than in the models based on the other two
approaches, with standard deviations of 0.03 for math and 0.02 for reading. These estimates
25
are lower than the ones reported in other studies, as one might expect given that improvement
in student learning is conceptually different from the level of student learning, which has been
the basis of prior estimates of principal value-added.
These analyses have the value-added measures scaled in the units of student
achievement. We see that the standard deviation of the estimates vary across the different
approaches: the value-added measures that attribute all school effects to the principal have the
greatest variance and the models that estimate gains in school effectiveness have the smallest
variance. For the remainder of the paper, we standardize each of the measures to have a mean
of 0.0 and a standard deviation of 1.0. We make this conversion so that we can compare among
principals using a standard metric, i.e., a standard deviation in the value-added estimate.
In addition to having different distributions (i.e., different variance), the different value-
added measures have different coverage. We can measure value-added under the first approach
for more principals. Models 1a and b have sample sizes of 725 principal by school observations.
Approach 2 includes controls for the school during the time that other principals were in charge
and thus it is limited to schools with at least two principals. Model 2a includes school fixed
effects and thus other principals have to be in the school for at least one year during the sample
period. Model 2b includes a control for student learning from one year to the next and thus
eliminates a few more schools for which there was only one year of data under another principal.
Approach 3 (school improvement) requires the most years of data and thus reduces the sample
substantially to approximately 218 principal by school observations. The sample sizes make
clear that the data requirements differ across models and affect the feasibility of estimating the
different approaches in practice.
Comparing Results across Models
The value-added models are conceptually different, but are they also empirically
different? Table 3 provides the correlations among the shrunk, standardized measures. The first

26
relationship to note is that Model 1a and Model 2b are quite highly correlated. The difference
between the two specifications is that 2b includes a control for the value-added of school during
other principals’ leadership. This inclusion changes the estimates, but they are still correlated
0.45 for math and 0.53 for reading. These correlations are somewhat higher than the within-
approach correlations for Approach 1 of 0.29 (math) and 0.44 (reading) and for Approach 2,
o.32 (math) and 0.48 (reading). The high correlation between Models 1a and 2a could be due to
substantial measurement error in the control for prior principal effectiveness as described
above. The correlations between the third approach and the first two are smaller. Model 3,
which measures improvement, is not nearly as highly correlated with the other models.
In Table 3 we also show the correlation between the main effect from Model 3 and the
principal specific time trends. Not surprisingly, we find a negative correlation between the main
effect and the principal specific time trends, which suggests that principals that take over in
schools that are higher performing also see less rapid improvement in their students’ test score
gains during their tenure at a school. This correlation highlights a potential drawback of using
school improvement as a measure of principal effectiveness.
An alternative to assessing correlations among the models’ predictions is to check the
consistency of the prediction for a given principal when his or her effect estimate is calculated
using one model versus another. For each model, we sort the predictions into quartiles, then, for
any two modeling Approaches A and B, we check how often the highest performers under model
A (i.e., the highest quartile) would be reassigned to the lowest quartile if Approach B was used
instead. Results of this exercise are shown in Table 4. For simplicity, only math comparisons are
shown (reading results are similar). The table illustrates that reclassification rates between the
two extreme quartiles tell a similar story to the correlation table. Model 1a and Model 2b, which
differ by the inclusion of controls for school value-added, have relatively low reclassification.
However, Model 2a, which includes school fixed effects, has a high reclassification rate with all
the other models. These reclassification rates show that choice of model matters substantially
27
for how principal performance would be rated under different estimation systems; for example,
28% to 29% of the highest performers under the simplest model (Approach 1) would be
reclassified as among the lowest performers under the school improvement model (Approach 3).
We can also compare estimates within the models by comparing results for math and
reading and, for a subset of principals, comparing their value-added in one school to their value-
added when serving in a different school. Table 5 gives these results. The correlations between
math and reading value-added are statistically significant, ranging from 0.51 for the school
improvement model (3) to 0.80 for Model 1a. Generally the correlations are highest for
Approach 1 and lowest for Approach 3. Note that Approach 1 is perhaps most subject to inflation
from sorting of principals among schools of similar performance levels, while Approach 3 is
perhaps most subject to measurement error due to its use of differences in student achievement
growth.
The correlations between math and reading show some consistency, but the results
comparing the same principal serving in different schools are more sobering. Using the same
approaches we compare the value-added of each principal when they lead one school to his or
her value-added when they lead another school. We only report these estimates for the first and
third approaches because the second approach does not distinguish when principals are at
different schools. The across-schools correlations are positive and significant for the first
approach, ranging from 0.3 to 0.4, but they are not statistically significant (or even always
positively signed) for the third approach. The higher correlation for Approach 1 could result
from the approach better capturing true principal effectiveness that is portable across sites.
However, it also could come from the sorting of principals where some principals work in
schools that have a baseline of greater effectiveness and the correlation simply captures this
sorting and not the principal effect. There is no evidence that the improvement that Approach 3
measures is at all portable across schools.
28
In summary, the three different approaches produce substantively different estimates of
the principals’ value-added to student achievement. Even within the same conceptual
approaches, the specification matters. The third approach that conceptualizes principal effects
as school improvement during a principal’s tenure is particularly unrelated to the other
measures and also produces estimates that are uncorrelated across jobs for a given principal. It
is possible that these measures are largely noise. Comparing the first two approaches, the
differences within approaches become clearer. The first approach conceptualizes value-added
as school effectiveness during a principal’s tenure while the second approach conceptualizes
value- added as school effectiveness during a principal’s tenure relative to the effectiveness of
the school under other principals. One specification of the second approach simply takes the
first approach and includes an estimate, albeit measured with error and shrunk, of the school
effect when the principal is not in charge. The two estimates—those with and without the school
effect control—give estimates that are more highly correlated than the within-approach
specifications for Approach 1 and Approach 2. This correlation may results from Model 2b not
being a true within-school estimate of principal effects because of potentially substantial
measurement error in the control for school effectiveness in prior years.
Correlations with External Measures
Given the differences across the value-added measures of principal effectiveness, the
next set of analyses compares these measures to non-test-based measures of principal and
school effectiveness. The goal of this analysis is to better understand which type of value-added
these alternative assessments are capturing, if any. We cannot tell from this analysis which
approach is correct, per se; “correctness” is in large part a question of how principals actually
affect schools, as we discuss above. However, we can learn what measures of value-added these
other measures most closely reflect.

29
While the test-based measures adjust for differences across principals in the
characteristics of the schools in which they work, the other measures do not. Because of this
lack of adjustment, we estimate the relationships between the value-added estimates and the
alternative measures using a regression approach in which we adjust for the average school test
scores in the first tested grade, percent white students, percent black students, percent of
students suspended, and percent of students chronically absent. All of these variables are
measured during the first year in which we observe a principal at a school. We also adjust for
principal race and gender.3 For most of the non-test-based measures of principal effectiveness,
we do not know the reliability. As a result, measurement error concerns dictate that we model
the alternative measures as a function of the test-based-measures (which we can adjust for
measurement error due to sampling error) and the controls.
The first comparison is between the value-added measures and both the average state
accountability grade given to the school during the principal’s tenure and the district’s
evaluation of the principal. Table 6a gives these results.4 The first clear result is the lack of
positive relationship between either outcome and the value-added estimates based on the third
approach. If these Approach 3 estimates are, in fact, picking up school improvement (and not
just noise), there is no evidence that either the school accountability grade or the principal
evaluation score is measuring school improvement. All of the other estimates, those for
Approach 1 and Approach 2, are positively correlated with the outcomes. The strongest
relationship is clearly with the simplest model from the first approach. Both the accountability
grade and the district evaluation of the principal are more closely linked with average school
3 This adjustment is more important for measures that clearly do not take these differences into account, such as student assessments and attendance. They are less important for measures such as district assessments which likely adjust for these differences already. 4 For all of these analyses we ran an alternative specification in which that forced the sample sizes to be the same across value-added measures. While for most studies we would present those findings instead, in this case the sample differences are an inherent part of the approach. In practice, restricting the sample changed the results very little and the alternative tables are available from the authors upon request.
30
effectiveness during the principal’s tenure than to the effectiveness of the principal relative to
other principals that have served at the school or, certainly, to school improvement.
Students, staff and parents evaluate the school through yearly school climate surveys.
Table 6b compares the value-added measures to student, parent and staff reports of the school
climate. The story here is very similar to the one for accountability grades and district principal
evaluations. The outcome measures are most strongly related to the school effectiveness
estimates of principal value-added as captured by Approach 1. The two specifications within the
first approach do an about equal job of explaining the variation in the climate measures. The
two measures in Approach 2 have positive point estimates in the regression but are only
significant in a couple of models. Again, there is no evidence at all that Approach 3 is related to
the student, staff or parent assessments of the climate.
Our third set of comparisons is between the value-added measures and assistant
principals’ and principals’ assessment of principals’ task effectiveness. Table 6c presents the
results for assistant principal evaluations and Table 6d presents the results for principals’ self-
evaluations. Note that these models are only estimated for principals in 2008, the year of our
survey. In both cases, the simplest model in Approach 1 is most closely associated with assistant
principal and principal evaluations. In this case the second estimation of Approach 2, which
includes the control for school effectiveness instead of the school fixed effect, is also positive but
only about half as large as the simplest approach. The estimates from Approach 3 are, again,
unrelated to the outcome measures. The estimates from Approach 2 that control for a school
fixed effect similarly explain none of the variation in the evaluations. Again, the evaluation
measures appear to be picking up school effectiveness as measured by how much students learn
in comparison to observationally similar students in other schools.
Finally, we compare the value-added measures to process measures in the school. Table
6e describes the results for teacher retention and student chronic absenteeism. Again, here the
relationships are strongest for the simplest value-added measures. The second model in the first
31
approach is somewhat more highly correlated than the first. Principals who lead schools in
which students learn more than they do when they are in other schools are also in schools with
lower chronic absenteeism and somewhat higher teacher retention. There is only a weak
relationship with value-added relative to other leaders of the same school (Approach 2) and the
relationship between these school outcomes and value-added as school improvement (Approach
3) is actually negative in some of the analyses.
In summary, the comparisons with other ratings indicate that the simplest models, those
measuring school effectiveness during the principal’s tenure, are most strongly related to the
non-test based measures. The within-school comparison approach is sometimes positively
related to other measures but these results are not at all consistent. The final approach, that
measuring improvement, shows no positive relationship with any of the other measures and
some negative relationships, particularly with accountability grade and principals’ assessment of
their own effectiveness.
Discussion and Conclusions
Both the rhetoric and the laws addressing the evaluation of school principals often
advocate for the use of student test scores to judge principal effectiveness. This position has a
clear logic: principals should be assessed in accordance with how they affect the outcomes that
we care about. Yet little research has explored the properties of potential test-based measures of
principals’ effects and how they behave relative to non-test-based measures of effectiveness. The
goal of this paper is to present different theoretical and empirical approaches to measuring
principal effectiveness, to compare them to each other, and then to compare them with non-test
based measures.
We present three different approaches to measuring principals’ influence on student
performance. The first simply measures the effectiveness of the school during a principal’s
tenure. This approach attributes all the school effects to the principal, even though he or she is
32
unlikely to hire all the teachers in the school and, similarly, may not be in control of other
elements of the school. At least in the district from which we drew the data for these analyses,
only 23 percent of teachers and 33 percent of assistant principals come in new to a school with a
new principal, and even here, we do not know how much influence the principal had on even
these new hires, though probably not much, given the timing of principal hires and moves. The
second approach compares the effectiveness of the school under one principal to the
effectiveness of the school under other principals. This approach has the clear advantage of not
attributing all of the school effect to the principal, but it has stringent data requirements, which
are difficult for single districts—even the largest districts—to meet. These first two approaches
are measuring the average school effectiveness. The third approach measures the improvement
in school effectiveness during a principal’s tenure. Again, the data requirements for this
approach are high, given the measurement error inherent in measuring gains. However, it does
have the theoretical appeal of capturing improvement.
If these measures were highly correlated with each other, then the choice of measures
would not be important. However, they are not strongly correlated. This issue is especially
stark for the school improvement approach, which is rarely correlated with the other approaches
at all, but it is apparent for the other approaches as well. Even within the same conceptual
approach, the choice of model matters; comparing a simple school effectiveness model with and
without a student fixed effect (i.e., Approaches 1a and 1b) produces a correlation of only 0.29 for
math and 0.44 for reading. This pattern of low correlations is driven in part by problems
internal to each of the measures. Although the principals who have higher value-added by one
measure in math often have higher value-added on that same measure in reading, the estimate
of a principal’s effectiveness while leading one school is not strongly predictive of how effective
he or she will be in another school even employing the same calculation.
To better understand these measures, we compared them to the school accountability
grade; to the district’s rating of their effectiveness; to students’, parents’ and staff assessment of

33
the school climate; and to principals’ and assistant principals’ assessment of the principal’s
effectiveness at tasks associated with the job of the principals. These comparisons show that the
first approach—measuring the effectiveness of the school during the principal’s tenure—is more
predictive of the non-test-based measures than the other two approaches. In fact, the third
approach that measures improvement is sometimes negatively correlated with these other
measures, such as the principal’s assessment of his leadership skills.
The implications of these results may not be as clear as they first seem. The non-test-
based measures appear to validate the value-added measure of principal effectiveness that is
based on the school effectiveness, a measure that has unappealing conceptual properties (see
also Chiang, Lipscomb, & Gill, 2012). An alternative interpretation, however, is that these
positive relationships represent a shortcoming in the non-test measures. In rating the
performance of the principal, district officials, for example, likely take into account the
effectiveness of the school itself. Asked to assess principals’ leadership skills, assistant principals
and the principals themselves may be partially basing their ratings on how well the school is
performing instead of purely on the principal’s effectiveness itself. In other words,
differentiating the performance of the principal from that of other school factors may be a
difficulty confronted by both test-based and subjective estimates.
The second two approaches—comparing principals to other principals in the same school
and measuring principal effectiveness by school improvement—are more compelling than the
simple school effectiveness approach, at least in theory. The school fixed effect version of the
second approach takes out the part of the school effectiveness that the principal inherited, but
the data demands are intensive when using school and principal fixed effects in the same model.
Models that include linear controls for school measures of effectiveness are closer to those from
Approach 1, perhaps because of the highly parameterized nature of the control and the
measurement error in the school effectiveness variable, even when shrunk to adjust for sampling
error. There are also theoretical reasons to worry about these measures. For example, if highly

34
effective principals systematically sort to certain schools, then the within-school comparison will
lose important variation. The within-school comparison also compares principals with schools
over time and schools are not stagnant in the difficulties and opportunities they present to
principals. The third approach that measures school improvement should capture the principal’s
contribution to improving the school, but the signal-to-noise ratio appears to be low because
estimating changes increases measurement error. The improvement measure also has difficulty
in that it is impossible to use during the principal’s first year in a school.
In sum, there are important tradeoffs among the different modeling approaches. The
simplest approach seemingly over-attributes aspects of the school’s performance to the
principal, but it produces estimates that correlate relatively highly across math and reading,
across different schools in which the principal works, and with other measures of non-test
outcomes we care about. On the other hand, the relative within-school effectiveness and school
improvement approaches come closer to modeling a reasonable relationship between principal
performance and student outcomes conceptually, but, perhaps because the data requirements
are stringent, empirically the results inspire less confidence.
The inconsistencies and drawbacks of the measures lead to consideration of whether
they should be used at all. Theoretically, if student test performance is an outcome school
systems value, then scores should be used in some way for assessing schools and holding
personnel accountable. The warning that comes from these analyses is that it is important to
think carefully about what the measures are revealing about the specific contribution of the
principal and to use the measures for what they are, which is not as a clear indicator of
principals’ specific contributions to student test score growth.

35
References Aaronson, D., Barrow, L., & Sander, W. (2007). Teachers and Student Achievement in the
Chicago Public High Schools. Journal of Labor Economics, 25, 95–135. Boyd, D., Lankford, H., Loeb, S., & Wyckoff, J. (2012). Measuring Test Measurement Error: A
General Approach (NBER Working Paper 18010). Branch, G. F., Hanushek, E. A., & Rivkin S. G. (2012). Estimating the Effect of Leaders on
Public Sector Productivity: The Case of School Principals (NBER Working Paper 17803).
Brewer, D. J. (1993). Principals and student outcomes: Evidence from U.S. high schools.
Economics of Education Review, 12(4), 281-292. Center for Educator Compensation Reform (n.d.). Dallas Principal and Teacher Incentive Pay
Program. Retrieved from http://cecr.ed.gov/pdfs/profiles/Dallas.pdf. Chiang, H., Lipscomb, S., & Gill, B. (2012). Assessing the Feasibility of Using Value-Added
Models for Principal Evaluations (Working Paper). Clark, D., Martorell, P., & Rockoff, J. (2009). School Principals and School Performance
(CALDER Working Paper 38). Chetty, R., Friedman, J., Hilger, N., Saez, E., Schanzenbach, D., & Yagan, D. (2011). How Does
Your Kindergarten Classroom Affect Your Earnings? Evidence from Project STAR. Quarterly Journal of Economics, 126(4), 1593-1660.
Coelli, M., & Green, D. A. (2012). Leadership effects: School principals and student outcomes.
Economics of Education Review, 31(1), 92–109. Dhuey, E., & Smith, J. (2012). How important are school principals in the production of
student achievement? (University of Toronto Working Paper). Eberts, R. W., & Stone, J. A. (1988). Student achievement in public schools: Do principals make
a difference? Economics of Education Review, 7(3), 291-299. Florida Senate. (2011). Text of Senate Bill 736. Recieved from
http://www.flsenate.gov/Session/Bill/2011/0736/BillText/er/PDF. Grissom, J., & Loeb, S. (2011). Triangulating Principal Effectiveness: How Perspectives of
Parents, Teachers, and Assistant Principals Identify the Central Importance of Managerial Skills. American Educational Research Journal, 48(5), 1091-1123.
Grossman, P. L., Loeb, S., Cohen, J., Hammerness, K. M., Wyckoff, J., Boyd, D. J., & Lankford,
H. (forthcoming). Measure for Measure: The relationship between measures of instructional practice in middle school English Language Arts and teachers’ value-added scores. American Journal of Education.
Hallinger, P., & Heck, R. (1998). Exploring the Principal’s Contribution to School Effectiveness:
1980-1995. School Effectiveness & School Improvement, 9(2), 157.

36
Horng, E., Klasik, D., & Loeb, S. (2010). Principal’s Time Use and School Effectiveness. American Journal of Education, 116(4), 491-523.
Jacob, B. A., & Lefgren, L. (2008). Can principals identify effective teachers? Evidence on
subjective performance evaluation in education. Journal of Labor Economics, 26(1), 101-136.
Jacob, B. A., Lefgren, L., & Sims D. (2010). The Persistence of Teacher-Induced Learning Gains.
Journal of Human Resources, 45(4), 915-943. Kane, T. J., & Staiger, D. O. (2002). The Promise and Pitfalls of Using Imprecise School
Accountability Measures. Journal of Economic Perspectives, 16 (4), 91–114. Kane, T, J., & Staiger, D. O. (2008). Are Teacher-Level Value-Added Estimates Biased? An
Experimental Validation of Non-Experimental Estimates (Working Paper). Retrieved from http://isites.harvard.edu/fs/docs/icb.topic245006.files/Kane_Staiger_3-17-08.pdf
Kane, T. J., & Staiger, D. O. (2012). Gathering Feedback for Teaching, Measures of Effective
Teaching Project. Bill and Melinda Gates Foundation. Koretz, D. (2002). Limitations in the Use of Achievement Tests as Measures of Educators’
Productivity. In E. Hanushek, J. Heckman, & D. Neal (Eds.), Designing Incentives to Promote Human Capital. Special issue of The Journal of Human Resources (pp. 752–777).
Lipscomb, S., Teh, B., Gill, B., Chiang, H., & Owens, A. (2010). Teacher and principal value-
added: Research findings and implementation practices. Cambridge, MA: Mathematica Policy Research.
Lockwood, J. R., McCaffrey, D. F., Hamilton, L. S., Stecher, B., Le, V., & Martinez, J. F. (2007).
The Sensitivity of Value-Added Teacher Effect Estimates to Different Mathematics Achievement Measures. Journal of Educational Measurement, (44)1, 47–67.
Loeb, S., Kalogrides, D., & Horng, E. (2010) Principal Preferences and the Uneven Distribution
of Principals across Schools. Educational Evaluation and Policy Analysis, 32(2), 205–229.
Louisiana State Legislature. (2010). Text of House Bill No. 1033. Retrieved from
http://www.legis.state.la.us/billdata/streamdocument.asp?did=689716. McCaffrey, D. F., Sass, T. R., & Lockwood, J. R. (2009). The Intertemporal Stability of Teacher
Effect Estimates (Working Paper). McCaffrey, D. F., Lockwood, J. R., Koretz, D., Louis, T. A., & Hamilton, L. S. (2004). Models for
value-added modeling of teacher effects. Journal of Education and Behavioral Statistics, 29(1), 67-101.
Measures of Effective Teaching Project (2010). Learning About Teaching: Initial Findings from
the Measures of Effective Teaching Project. The Gates Foundation.

37
Rivkin, S. G., Hanushek, E. A., & Kain, J. F. (2005). Teachers, Schools, and Academic Achievement. Econometrica, 73(2), 417–458.
Rockoff, J. E. (2004). The Impact of Individual Teachers on Student Achievement: Evidence
from Panel Data. American Economic Review, 94(2), 247-52. Rothstein, J. (2009). Student Sorting and Bias in Value-Added Estimation: Selection on
Observables and Unobservables. Education Finance and Policy, 4(4), 537-571. Sanders, W., & Rivers, K. (1996). Cumulative and Residual Effects of Teachers on Future
Academic Achievement (Technical Report). University of Tennessee Value-Added Research and Assessment Center.
Tennessee State Board of Education. (2011). Teacher and Principal Evaluation Policy. Retrieved
from http://www.tn.gov/sbe/Policies/5.201%20Teacher%20and%20Principal%20Eval uation%20Policy%20-%20Update%202011.pdf.
Witziers, B., Bosker, R.J., & Krüger, M.L. (2003). Educational leadership and student achievement: The elusive search for an association. Educational Administration Quarterly, 39(3), 398-425.

38
Figure 1: The distribution of Value-Added Principal Effectiveness Measures
02
46
-.5 -.25 0 .25 .5
Model 1A
02
46
-.5 -.25 0 .25 .5
Model 1B
05
1015
-.5 -.25 0 .25 .5
Model 2A0
24
6
-.5 -.25 0 .25 .5
Model 2B0
1020
-1 -.5 0 .5 1 1.5
Model 3
Estimated Effect EB Effect
02
46
-.5 -.25 0 .25 .5
Model 1A
02
46
-.5 -.25 0 .25 .5
Model 1B
05
1015
20
-.5 -.25 0 .25 .5
Model 2A
02
46
-.5 -.25 0 .25 .5
Model 2B
010
20
-1 -.5 0 .5 1 1.5
Model 3
Estimated Effect EB Effect
MATH
READING

39
Table 1. Descriptive StatisticsMean SD N Year Measured
Number of Principal-School Combinations 719Number of Principals 523Gender: Female 0.67 719 ConstantGender: Male 0.33 719 ConstantRace/Ethnicity: White 0.23 717 ConstantRace/Ethnicity: Black 0.35 717 ConstantRace/Ethnicity: Hispanic 0.41 717 ConstantRace/Ethnicity: Other 0.01 717 ConstantAverage Standardized Math Score, First Tested Grade -0.06 0.39 687 First Year at SchoolAverage Standardized Reading Score, First Tested Grade -0.06 0.40 683 First Year at SchoolProportion White 0.08 0.10 719 First Year at SchoolProportion Black 0.36 0.34 719 First Year at SchoolProportion Hispanic 0.54 0.31 719 First Year at SchoolProportion Absent 21 or More Days 0.10 0.10 719 First Year at SchoolProportion Suspended 0.08 0.11 719 First Year at SchoolAP Rating of Principal (Overall) -0.04 0.91 167 2008 SurveyAP Rating of Principal (Management) -0.03 0.97 216 2008 SurveyAP Rating of Principal (Operations) -0.01 0.91 211 2008 SurveyAP Rating of Principal (Instruction) -0.02 0.90 189 2008 SurveyAP Rating of Principal (Internal Relations) -0.04 0.92 228 2008 SurveyAP Rating of Principal (External Relations) -0.05 0.97 220 2008 SurveyPrincipal Rating of Own Effectiveness (Overall) 0.00 0.99 203 2008 SurveyPrincipal Rating of Own Effectiveness (Management) 0.00 0.99 236 2008 SurveyPrincipal Rating of Own Effectiveness (Operations) 0.01 1.00 232 2008 SurveyPrincipal Rating of Own Effectiveness (Instruction) -0.02 1.01 221 2008 SurveyPrincipal Rating of Own Effectiveness (Internal Relations) -0.02 1.01 233 2008 SurveyPrincipal Rating of Own Effectiveness (External Relations) -0.02 1.00 237 2008 SurveyTeacher Retention Rate (in School) 0.82 0.08 678 Average While at SchoolStudent Chronic Absence Rate 0.10 0.10 719 Average While at SchoolSchool Climate Scale-Student Report -0.14 1.00 703 Average While at SchoolSchool Climate Scale- Staff Report -0.16 1.05 712 Average While at SchoolSchool Climate Scale- Parent Report -0.19 1.05 706 Average While at SchoolSchool Accountability Grade, 0-4 Point Scale 2.81 1.20 690 Average While at SchoolAverage of Ratings Received From District (1-4) 3.54 0.51 658 Average While at SchoolProportion of Years Received Highest Rating From District 0.59 0.41 658 Average While at SchoolNotes: The data include one observation for each principal-school combination except in cases where 2008 survey items are used-- these just use principal-school combinations in 2008.

40
Table 2. Distribution of Principal Value-Added Estimates
FE EB TRUE 10th 25th 50th 95th 90th NMath
Approach 1: School EffectivenessModel 1A (No Student FE) 0.16 0.15 0.16 -0.18 -0.11 -0.03 0.11 0.22 725Model 1B (With Student FE) 0.19 0.13 0.17 -0.19 -0.10 -0.01 0.10 0.24 725
Approach 2: Relative Within-School EffectivenessModel 2A (Principal & School FE) 0.06 0.04 0.05 -0.05 -0.02 0.00 0.03 0.06 555Model 2B (Principal FE, Control for Prior School Effectiveness) 0.10 0.08 0.10 -0.09 -0.05 0.01 0.07 0.13 284
Approach 3: School ImprovementModel 3 (Principal by School Time Trend) 0.08 0.03 0.08 -0.04 -0.01 0.01 0.04 0.08 218
ReadingApproach 1: School Effectiveness
Model 1A (No Student FE) 0.12 0.11 0.12 -0.14 -0.09 -0.02 0.09 0.17 725Model 1B (With Student FE) 0.14 0.09 0.12 -0.16 -0.09 -0.01 0.08 0.15 725
Approach 2: Relative Within-School EffectivenessModel 2A (Principal & School FE) 0.04 0.02 0.04 -0.04 -0.02 0.00 0.02 0.04 558Model 2B (Principal FE, Control for Prior School Effectiveness) 0.07 0.06 0.07 -0.10 -0.05 0.00 0.03 0.09 284
Approach 3: School ImprovementModel 3 (Principal by School Time Trend) 0.06 0.02 0.05 -0.04 -0.01 0.01 0.03 0.06 218
Note: FE refers to the original fixed effects estimates while EB refers to the Empirical Bayes shrunken estimates. True calculates the standard deviation by taking the square root of the variance of the fixed effects minus the mean of the standard errors squared.
Standard Deviations Percentiles of Estimates before EB Shrinkage

41
Table 3: Pairwise Correlations Among Alternative Principal Effect Estimates
1A 1B 2A 2B 3-
Intercept 3 - Slope MATH
Model 1B: School Effectiveness (With Student FE) 0.29 1.00 Model 2A: Relative Within School Effectiveness (Principal & School
FE) 0.28 0.24 1.00 Model 2B: Relative Within School Effectiveness (Principal FE, Control
for Prior School Effectiveness) 0.46 0.23 0.44 1.00 Model 3: Intercept from Model with Principal by School Time Trend 0.75 0.33 0.04 0.11 1.00
Model 3: Principal by School Time Trend 0.07 0.17 0.25 0.18 -0.39 1.00 READING Model 1B: School Effectiveness (With Student FE) 0.44 1.00
Model 2A: Relative Within School Effectiveness (Principal & School FE) 0.30 0.25 1.00
Model 2B: Relative Within School Effectiveness (Principal FE, Control for Prior School Effectiveness) 0.47 0.29 0.36 1.00
Model 3: Intercept from Model with Principal by School Time Trend 0.80 0.41 0.03 0.12 1.00 Model 3: Principal by School Time Trend 0.02 0.05 0.07 -0.05 -0.32 1.00
Note: Bolded correlations are significant at p<=.05.

42
Table 4 Reclassification Rates (Math, Selected Models): Percent Appearing in Quartile 4 of Row Approach that Appear in Quartile 1 for Column Approach
Model 1A Model 1B Model 2A Model 2B Model 3Model 1A: School Effectiveness (No Student FE) -Model 1B: School Effectiveness (With Student FE) 10.1 -Model 2A: Relative Within School Effectiveness (Principal & School FE) 13.2 19.1 -Model 2B: Relative Within School Effectiveness (Principal FE, Control for Prior School Effectiveness) 5.9 20.6 17.2 -Model 3: Principal by School Time Trend 29 28 21 27 -
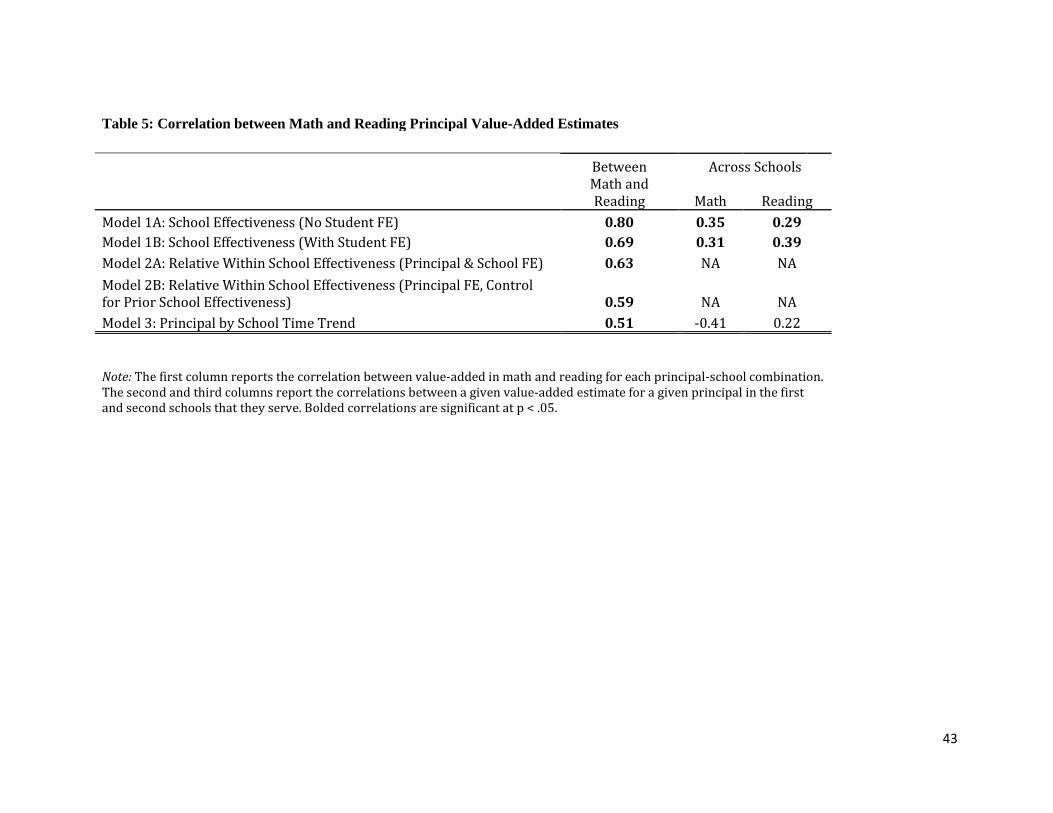
43
Table 5: Correlation between Math and Reading Principal Value-Added Estimates
Between Across Schools
Math and Reading Math Reading
Model 1A: School Effectiveness (No Student FE) 0.80 0.35 0.29 Model 1B: School Effectiveness (With Student FE) 0.69 0.31 0.39 Model 2A: Relative Within School Effectiveness (Principal & School FE) 0.63 NA NA Model 2B: Relative Within School Effectiveness (Principal FE, Control for Prior School Effectiveness) 0.59 NA NA Model 3: Principal by School Time Trend 0.51 -0.41 0.22
Note: The first column reports the correlation between value-added in math and reading for each principal-school combination. The second and third columns report the correlations between a given value-added estimate for a given principal in the first and second schools that they serve. Bolded correlations are significant at p < .05.
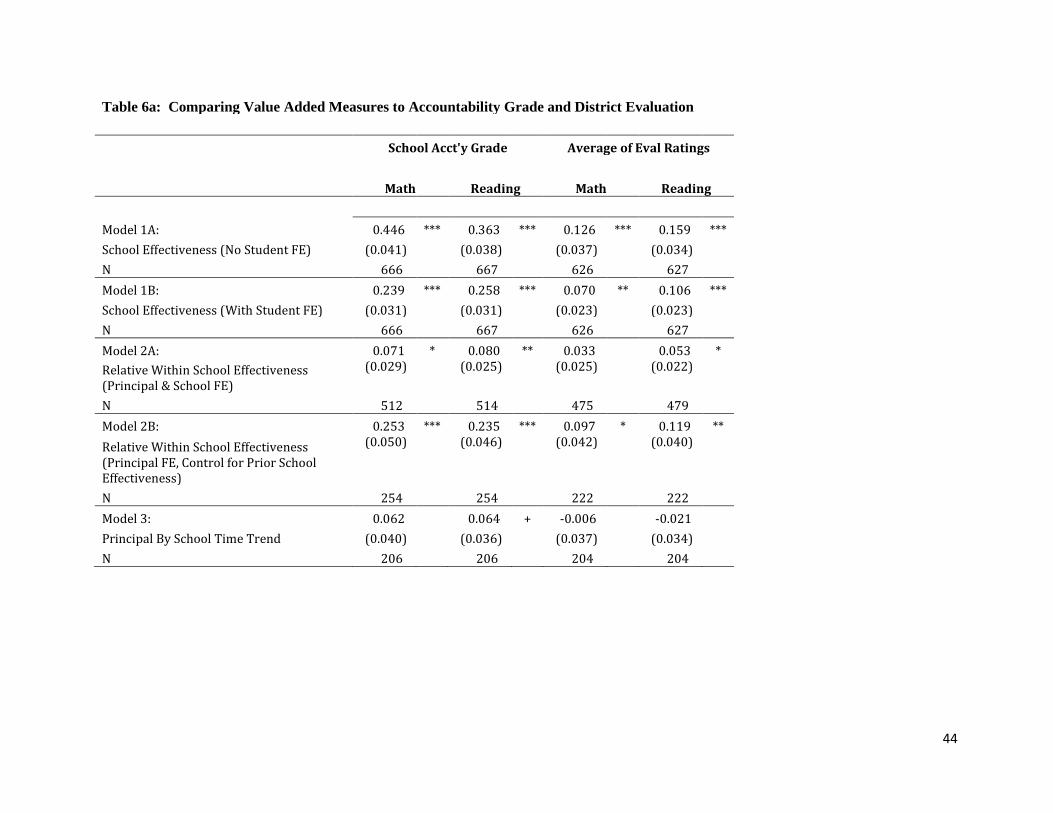
44
Table 6a: Comparing Value Added Measures to Accountability Grade and District Evaluation
School Acct'y Grade Average of Eval Ratings
Math Reading Math Reading
Model 1A: 0.446 *** 0.363 *** 0.126 *** 0.159 *** School Effectiveness (No Student FE) (0.041) (0.038) (0.037) (0.034) N 666 667 626 627 Model 1B: 0.239 *** 0.258 *** 0.070 ** 0.106 *** School Effectiveness (With Student FE) (0.031) (0.031) (0.023) (0.023) N 666 667 626 627 Model 2A: 0.071 * 0.080 ** 0.033 0.053 * Relative Within School Effectiveness (Principal & School FE)
(0.029) (0.025) (0.025) (0.022)
N 512 514 475 479 Model 2B: 0.253 *** 0.235 *** 0.097 * 0.119 ** Relative Within School Effectiveness (Principal FE, Control for Prior School Effectiveness)
(0.050) (0.046) (0.042) (0.040)
N 254 254 222 222 Model 3: 0.062 0.064 + -0.006 -0.021 Principal By School Time Trend (0.040) (0.036) (0.037) (0.034) N 206 206 204 204

45
Table 6b: Comparing Value Added Measures to Student, Parent and School Staff Assessment Student Report Staff Report Parent Report
Math Reading Math Reading Math Reading Model 1A: 0.189 *** 0.132 *** 0.184 *** 0.132 ** 0.130 ** 0.052 School Effectiveness (No Student FE) (0.041) (0.038) (0.046) (0.043) (0.044) (0.047) N 676 681 680 684 676 680 Model 1B: 0.234 *** 0.225 *** 0.174 *** 0.160 *** 0.166 *** 0.153 *** School Effectiveness (With Student FE) (0.032) (0.034) (0.033) (0.032) (0.034) (0.043) N 676 681 680 684 676 680 Model 2A: 0.019 0.020 0.052 + 0.046 0.000 0.013 Relative Within School Effectiveness (Principal & School FE)
(0.031) (0.028) (0.031) (0.031)
(0.033) (0.037)
N 518 524 522 528 518 523 Model 2B: 0.097 * 0.071 + 0.116 * 0.072 0.054 0.064 Relative Within School Effectiveness (Principal FE, Control for Prior School Effectiveness)
(0.043) (0.042) (0.055) (0.052)
(0.044) (0.045)
N 262 263 265 266 262 263 Model 3: 0.039 0.099 * -0.002 0.049 0.039 0.078 * Principal By School Time Trend (0.036) (0.041) (0.045) (0.043) (0.036) (0.039) N 206 206 207 207 206 206

46
Table 6c: Comparing to Assistant Principal Assessments of Principals’ Task Effectiveness Overall Rating Management Scale Instruction Scale
Math Reading Math Reading Math Reading Model 1A: 0.436 * 0.314 * 0.331 * 0.379 ** 0.377 * 0.268 * School Effectiveness (No Student FE) (0.169) (0.126) (0.152) (0.133) (0.163) (0.114) N 160 160 205 205 179 179 Model 1B: 0.217 + 0.115 0.171 0.096 0.153 0.116 School Effectiveness (With Student FE) (0.118) (0.100) (0.104) (0.075) (0.117) (0.087) N 160 160 205 205 179 179 Model 2A: 0.127 -0.049 0.092 -0.000 0.073 -0.071 Relative Within School Effectiveness (Principal & School FE)
(0.104) (0.088) (0.083) (0.069)
(0.100) (0.085)
N 104 107 138 140 118 121 Model 2B: 0.390 * 0.252 * 0.210 + 0.198 * 0.445 ** 0.247 * Relative Within School Effectiveness (Principal FE, Control for Prior School Effectiveness)
(0.151) (0.105) (0.115) (0.078)
(0.158) (0.097)
N 53 53 67 67 56 56 Model 3: 0.061 0.025 0.049 0.058 0.018 0.073 Principal By School Time Trend (0.104) (0.114) (0.083) (0.095) (0.097) (0.113) N 79 79 103 103 87 87

47
Table 6d: Comparing to Principal Assessments of Principals’ Task Effectiveness Overall Rating Management Scale Instruction Scale
Math Reading Math Reading Math Reading Model 1A: 0.303 * 0.204 0.267 + 0.257 * 0.347 * 0.268 * School Effectiveness (No Student FE) (0.150) (0.146) (0.148) (0.129) (0.137) (0.130) N 193 193 224 224 209 209 Model 1B: 0.044 0.089 0.077 0.154 + 0.099 0.162 + School Effectiveness (With Student FE) (0.105) (0.097) (0.109) (0.093) (0.092) (0.095) N 193 193 224 224 209 209 Model 2A: 0.003 0.097 0.048 0.150 + 0.164 + 0.149 Relative Within School Effectiveness (Principal & School FE)
(0.095) (0.082) (0.090) (0.077)
(0.085) (0.092)
N 120 123 143 146 133 136 Model 2B: 0.219 0.260 + 0.237 0.333 ** 0.320 * 0.279 * Relative Within School Effectiveness (Principal FE, Control for Prior School Effectiveness)
(0.179) (0.136) (0.156) (0.105)
(0.144) (0.122)
N 62 62 74 74 70 70 Model 3: -0.151 -0.228 * -0.053 -0.178 + -0.154 -0.202 * Principal By School Time Trend (0.112) (0.099) (0.122) (0.098) (0.112) (0.101) N 93 93 111 111 102 102

48
Table 6e: Comparing to Teacher Turnover and Student Absenteeism
Teacher Retention Rate (in School) Chronic Absence Rate (21+Days)
Math Reading Math Reading Model 1A: 0.001 0.001 -0.006 -0.026 *** School Effectiveness (No Student FE) (0.005) (0.005) (0.006) (0.005) N 644 645 714 714 Model 1B: 0.009 ** 0.004 -0.013 ** -0.020 *** School Effectiveness (With Student FE) (0.003) (0.003) (0.004) (0.004) N 644 645 714 714 Model 2A: 0.000 -0.001 -0.000 -0.003 Relative Within School Effectiveness (Principal & School FE) (0.003) (0.003) (0.003) (0.003) N 490 493 546 549 Model 2B: 0.010 + -0.002 0.004 -0.005 Relative Within School Effectiveness (Principal FE, Control for Prior School Effectiveness)
(0.006) (0.005) (0.004) (0.004)
N 236 236 274 274 Model 3: -0.007 * -0.006 + 0.009 * 0.002 Principal By School Time Trend (0.003) (0.003) (0.004) (0.007) N 207 207 217 217

49
Appendix 1: Bayesian Shrinkage
Our estimated principal effect ( sp
^δ ) is the sum of a “true” principal effect ( spδ ) plus
some measurement error8:
spspsp εδδ +=^
(1)
The empirical Bayes estimate of a principal’s effect is a weighted average of their estimated fixed
effect and the average fixed effect in the population where the weight, λsp, is a function of the
precision of each principal’s fixed effect and therefore varies by s and p. The less precise the
estimate, the more we weight the mean. The more precise the estimate, the more we weight the
estimate and the less we weight the mean. Similarly, the more variable the true score (holding
the precision of the estimate constant) the less we weight the mean, and the less variable the
true score, the more we weight the mean assuming the true score is probably close to the mean.
The weight, λsp, should give the proportion of the variance in what we observe that is due to the
variance in the true score relative to the variance due to both the variance in the true score and
precision of the estimate. This more efficient estimator of teacher quality is generated by:
^^*)())(1()|( spspspspE δλδλδδ +−=
−
(2)
where 22
2
)()()(
δε
δ
σσσλ
+=
jsp (3)
Thus, the term λsp can be interpreted as the proportion of total variation in the teacher effects
that is attributable to true differences between teachers. The terms in (3) are unknown so are
estimated with sample analogs.
)var()(^
2^
spsp εε δσ = (4)
8 Here we make the classical errors in variables (CEV) assumption, assuming that measurement error is not associated with an unobserved explanatory variable.

50
which is the square of the standard error of the teacher fixed effects. The variance of the true
fixed effect is determined by:
2^
2^
2 )()()( εδδ σσσ mean−= (5)
where 2^
)( δσ is the variance of the estimated teacher fixed effects (Gordon, Kane, and Staiger
2006; Jacob and Lefgren 2005). We shrink the school value-added estimates in the same
manner described above.