using steric hindrance and inertial microfluidics · analytical reagent-grade solvents and other...
TRANSCRIPT

Electronic Supplementary Information (ESI) for Lab on a Chip
This journal is © The Royal Society of Chemistry 2014
Electronic Supplementary Information
High-throughput rare cell separation from blood samples using steric hindrance and inertial microfluidics
Shaofei Shen,a Chao Ma,b Lei Zhao,b Yaolei Wang,a Jian-Chun Wang,a Juan Xu,a Tianbao
Li,a Long Pangb and Jinyi Wang*ab
a College of Science, Northwest A&F University, Yangling, Shaanxi 712100, China
b College of Veterinary Medicine, Northwest A&F University, Yangling, Shaanxi 712100,
China
Abstract. This supplementary information provides all the additional information as
mentioned in the text.
Materials and reagents
RTV 615 poly(dimethylsiloxane) (PDMS) pre-polymer and curing agent were purchased from
Momentive Performance Materials (Waterford, NY, USA); surface-oxidized silicon wafers
were from Shanghai Xiangjing Electronic Technology, Ltd. (Shanghai, China); AZ 50XT
photoresist and developer were from AZ Electronic Materials (Somerville, NJ, USA); acridine
1
Electronic Supplementary Material (ESI) for Lab on a Chip.This journal is © The Royal Society of Chemistry 2014

orange (AO) and propidium iodide (PI) were from Sigma–Aldrich (MO, USA); 15.5-μm
diameter polystyrene microspheres fluorescently labeled with dragon green (FS07F) were
from Bangs Laboratories, Inc.; and cell culture medium, fetal bovine serum (FBS), and
CellTracker Green CMFDA were from Gibco Invitrogen Corporation (CA, USA). The
analytical reagent-grade solvents and other chemicals were purchased from local commercial
suppliers, unless otherwise stated. All solutions were prepared using ultra-purified water
supplied by a Milli-Q system (Millipore®).
Device fabrication
The microfluidic devices utilized for this study were fabricated using standard soft lithography
with AZ 50XT master mold on a silicon substrate.1 First, patterns for the microchannels and
pillars were designed using AutoCAD software. Second, microchannels and pillars were
printed on glass substrates to form a chrome mask (MicroCAD Photomask, Ltd., Suzhou,
China). As a result, a mold (57 μm high) was fabricated through a single step under UV light
using an AZ 50XT Photoresist on a BG401A mask aligner (7 mW cm-2, CETC, China). Before
fabricating the microfluidic device, the mold was exposed to trimethylchlorosilane vapor for
2 min to 3 min. A well-mixed PDMS pre-polymer [RTV 615 A and B (10:1, w/w)] was poured
onto the mold placed in a Petri dish to yield 3 mm-thick PDMS replica. After degassing, the
mold was cured on a hot plate at 80 °C for 50 min. The PDMS replica was then peeled off the
mold. Holes for inlets and outlets were punched with a metal pin. Afterward, the PDMS
replica was trimmed, cleaned, and placed on a clean glass slide (3000 rpm, 60 s, ramp 15 s)
with a PDMS pre-polymer [RTV 615 A and B (20:1, w/w)] cured for 20 min in an oven at
80 °C. Finally, the microfluidic device was ready for use after baking at 80 °C for 48 h.
Sample preparation
Isolation of 15.5 μm fluorescent polystyrene microspheres was first performed to primarily
explore the separation effect and observe the movement trajectory of the isolates in the
designed microfluidic device. The 15.5 μm fluorescent polystyrene microspheres were
selected because their size was similar to cancer cell size, and they can be easily observed
under a fluorescent microscope. The suspension of the fluorescent microspheres (ρ 2

~1.06 g/mL) was prepared by diluting the microspheres in ultra-purified water containing 0.5%
w/v Tween 20. Prior to each experiment, the microsphere suspension in a 15 mL vial was
sonicated for at least 8 min to achieve a sufficiently mono-dispersed suspension.2
Three different types of human cancer cell lines, namely, human myelogenous leukemia
(K562), human cervical carcinoma (HeLa), and human breast adenocarcinoma (MCF-7),
were used to mimic different rare cell separation and enrichment processes for the
investigation of rare cell separation. All the cells were obtained from the Chinese Academy of
Sciences (Shanghai, China). K562 and HeLa cells were routinely cultured using Dulbecco’s
modified Eagle’s medium (DMEM, Invitrogen, Grand Island, NY) supplemented with 10%
FBS (Invitrogen), 100 U/mL penicillin, and 100 μg/mL streptomycin. MCF-7 cells were
routinely cultured with Roswell Park Memorial Institute medium 1640 (RPMI-1640 medium,
Invitrogen, Grand Island, NY) supplemented with 10% FBS, 100 U/mL penicillin, and
100 μg/mL streptomycin. The cells were then placed in a humidified atmosphere with 5%
CO2 at 37 °C. The cells were normally passaged at a ratio of 1:3 every 3 days to maintain
their exponential growth phase. HeLa and MCF-7 cells were harvested through trypsinization
with 0.25% trypsin (Invitrogen) in Ca2+ and Mg2+ free Hanks’ balanced salt solution at 37 °C
before use. Trypsinization was stopped upon the addition of fresh supplemented culture
medium, and then the cell suspension was centrifuged at a rotational speed of 800 rpm for
3 min. Given that K562 cells are rounded, nonadherent, and grow in suspension, the cells
were harvested directly after centrifugation at 1000 rpm for 3 min.
The rare cell suspensions for their respective isolation study were prepared by suspending
K562, HeLa, or MCF-7 cells in PBS working buffer (PBS, 0.01 mol/L, PH 7.4; citric acid,
4.8 g/L; trisodium citrate, 13.2 g/L; and dextrose, 14.7 g/L) supplemented with 1% bovine
serum albumin (Invitrogen) to prevent cell sedimentation and non-specific adsorption to the
microchannels during separation.3 For the blood cell tests, whole blood samples were
obtained from healthy volunteers and collected into ethylenediaminetetraacetic acid vacuum
tubes. Prior to use, the samples were diluted to 1:5, 1:20, 1:40, and 1:80 (v:v) with the above
PBS working buffer, corresponding to hematocrits (Hct) of 8%, 2%, 1%, and 0.5%,
3
respectively. All blood samples were used within 6 h of collection. For rare cell isolation study
from the blood samples, the rare cells were first stained with CellTracker Green CMFDA. The
harvested K562 cells in the suspension were first centrifuged, and then the supernatant was
aspirated. Afterward, the cells were resuspended gently in a pre-warmed CellTracker Green
CMFDA solution to stain for 30 min in a humidified atmosphere with 5% CO2 at 37 °C. Then,
staining of HeLa and MCF-7 cells was performed. The culture medium was removed when
the cells reached the exponential growth phase, after which pre-warmed CellTracker Green
CMFDA solution was added to stain the cells for 30 min in a humidified atmosphere with 5%
CO2 at 37 °C. The cells were stained to facilitate observation of rare cell and counting of cells
that recovered. The stained cells were centrifuged, diluted with PBS working buffer, and then
resuspended in healthy human blood for further use.
After evaluating the isolation effect of the designed microfluidic device using microspheres
(104 /mL), each type of rare cell line suspension (102, 103, and 104 cells/mL), and the actual
blood samples with various Hct (8%, 2%, 1%, and 0.5%), each fluorescence-labeled rare cell
line (102, 103, and 104 cells/mL) was spiked into unstained 40× diluted whole blood (1.32×10⁸
cells/mL) to model the low events of rare cells in blood and then applied for isolation study of
rare cells from the blood samples. Specifically, the spiked HeLa cell suspension included
single cells and 4 to 10 irregular gathering cells to mimic the CTC clusters because clustered
cells yield important prognostic significance in clinical samples.4 All concentrations of the
cells were determined using hemocytometer method.5
Numerical simulations
To evaluate velocity field fluctuations in the device, computational fluid dynamics (CFD)
simulation was performed using ESI-CFD software (V2010.0, ESI CFD, Inc.). The simulation
environment was verified for steady incompressible flows. Different Reynolds number flows
(Rec) were specified at the input, and the outlet was set to a fixed-pressure boundary
condition. No slip boundary condition was applied at the channel walls. FLOW and
TURBULENCE modules in CFD-ACE+ were used to explore the flow velocity distribution in
the microchannels. Based on the finite volume method, the conservation of Navier–Stokes 4

momentum in the device is described by Equation (1) as follows:
(1) V VV P
t
uv uvuv
The conservation of mass is described by the continuity Equation (2) as follows:
(2) 0V
t
uv
The local turbulent Reynolds number (Ret) is expressed as follows:
(3)
2
tkRev
where ρ is fluid density; is velocity vector; P is pressure; is stress tensor; k is turbulent Vuv
kinetic energy; ε is rate of dissipation, and ν is turbulent viscosity.
Isolation efficiency
The collection and enrichment efficiency of cancer cells were calculated using the following
equations:
Collection efficiency =
(4)1 1 100%outlet outlet
inlet inlet
n Rn R
Enrichment efficiency = (5)1outlet
inlet
RR
Purity = (6)1 1
1 1 1100%outlet outlet
outlet outlet outlet
n Rn R n
Where is the number density of blood cells, collected from the outlet 1, is that in 1outletn inletnthe original sample, is the ratio of cancer cells to blood cells in a sample collected 1outletR
from the outlet 1, is that in the original sample.inletR
5

Fig. S1. Schematic diagram of the steric hindrance region in the microfluidic device. The
amplifying image shows the design diagram of array 1 (more detailed design parameters can
be found in Table S1).
Table S1. Detailed design parameters of the devices used in the current study.
Device NumberParametersDevice 1 Device 2 Device 3
Width of base 1 (μm)Width of base 2 (μm)
Height (μm)Fillet radius of base 2 (μm)
Line offset (μm)Column offset (μm)Angle of array 1 (◦)Angle of array 2 (◦)
4020080105
233.941
- 110
40200801010
232.902
- 210
40200801015
231.304
- 410
6

Minimum spacing (μm)Number of arrays
31 16 11
Fig. S2. Computational simulation of the fluid velocities in the inertial focusing region under
various channel Reynolds numbers (Rec). (A) Various fluid velocity patterns were formed in
the inertial focusing region under various Rec. The width of contraction channel is 60 µm. The
red dotted lines were used to analyze fluid velocity distributions at the same lateral positions.
Quantitative comparison of fluid velocities (B) and ratios (C) of the flow velocity to the
maximum flow velocity (v/vmax) under various Rec at the same lateral positions which
7

correspond to the positions of red dotted lines in (A).
Fig. S3. Computational simulation of the fluid velocities in the inertial separation region under
various Rec. (A) Various fluid velocity patterns were formed in the inertial separation region
under various Rec. The red dotted lines were used to analyze fluid velocity distributions at the
8

same longitudinal positions. Comparison of fluid velocities (B) and ratios (C) of the flow
velocity to the maximum flow velocity (v/vmax) under various Rec at the same longitudinal
positions which correspond to the positions of red dotted lines in (A).
Fig. S4. Computational simulation of the fluid velocities in the steric hindrance region under
Rec = 72.22. (A) Fluid velocity pattern was formed in the steric hindrance region under Rec =
72.22. The white dotted lines were used to analyze the fluid velocity distributions between the
isosceles trapezoid-shaped pillars. (B) Quantitative comparison of fluid velocities under Rec =
72.22 between different isosceles trapezoid-shaped pillars, which correspond to the positions
of white dotted lines in (A).
9

Fig. S5. Fluorescence intensity analysis of the fluorescence microspheres under various Rec
in the inertial separation region, which correspond to the red dotted lines in Fig. 2.10

Table S2. Collection efficiency of fluorescence microspheres under various Rec in the inertial separation region after passing through
three different widths of contraction channels (30, 60, and 90 µm) of the inertial focusing region.
Q (µL/min) 1 20 50 90 130 170
Channels (µm) 30 60 90 30 60 90 30 60 90 30 60 90 30 60 90 30 60 90
Rec 0.74 0.56 0.44 14.81 11.11 8.89 37.04 27.78 22.22 66.67 50 40 96.23 72.22 57.78 125.93 94.44 75.56
Rep 0.10 0.03 0.02 2.08 0.69 0.39 5.21 1.74 0.97 9.38 3.13 1.74 13.54 4.51 2.51 17.71 5.90 3.28
Recovery Center 41.27 56.82 85.74 36 42.44 58.33 98.93 65.44 59.35 43.58 90.91 68.77 60.61 99.42 80.54 76.34 85.69 88.32
Side 58.73 43.18 14.26 64 57.56 41.67 1.07 34.56 40.65 56.42 9.09 31.23 39.39 0.58 19.46 23.66 14.31 11.68
11
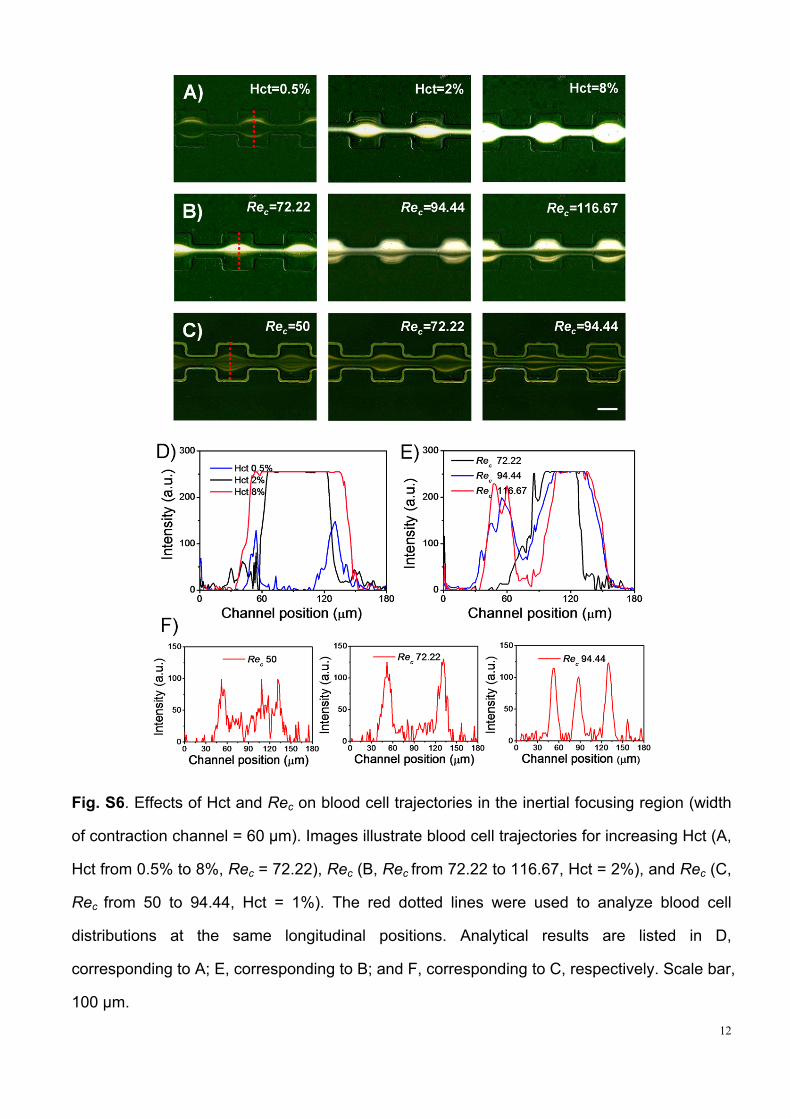
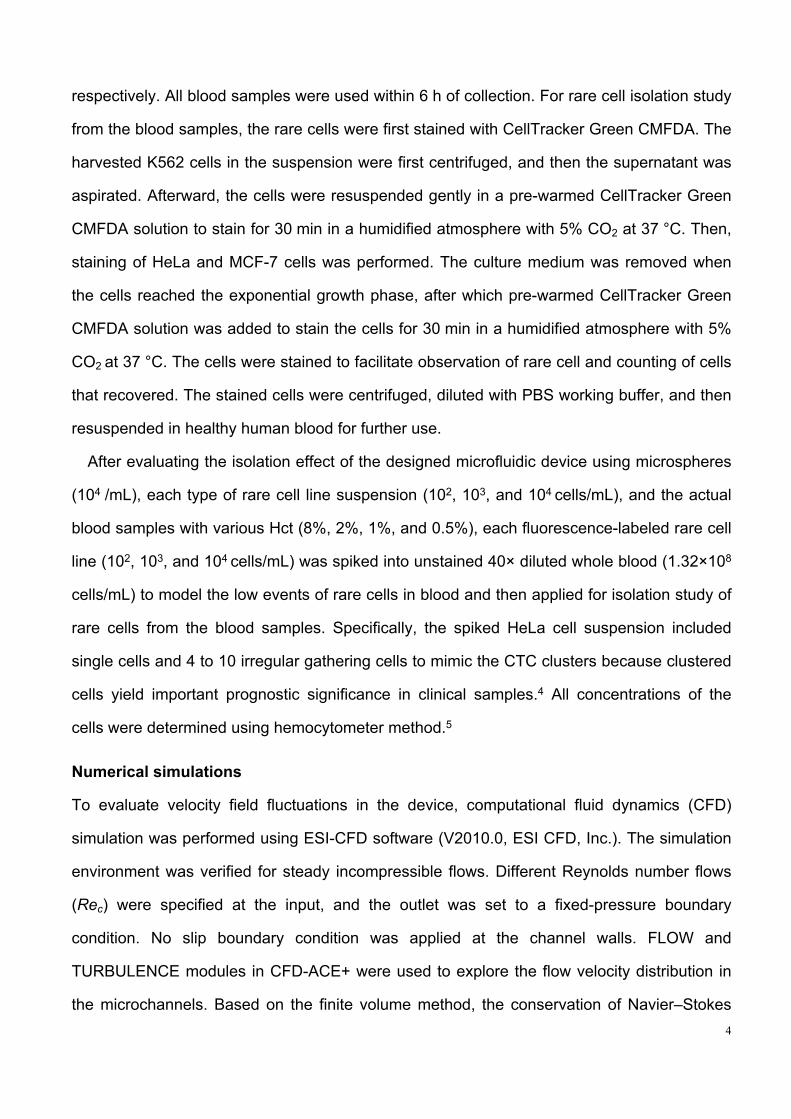
Fig. S6. Effects of Hct and Rec on blood cell trajectories in the inertial focusing region (width
of contraction channel = 60 µm). Images illustrate blood cell trajectories for increasing Hct (A,
Hct from 0.5% to 8%, Rec = 72.22), Rec (B, Rec from 72.22 to 116.67, Hct = 2%), and Rec (C,
Rec from 50 to 94.44, Hct = 1%). The red dotted lines were used to analyze blood cell
distributions at the same longitudinal positions. Analytical results are listed in D,
corresponding to A; E, corresponding to B; and F, corresponding to C, respectively. Scale bar,
100 μm.
12
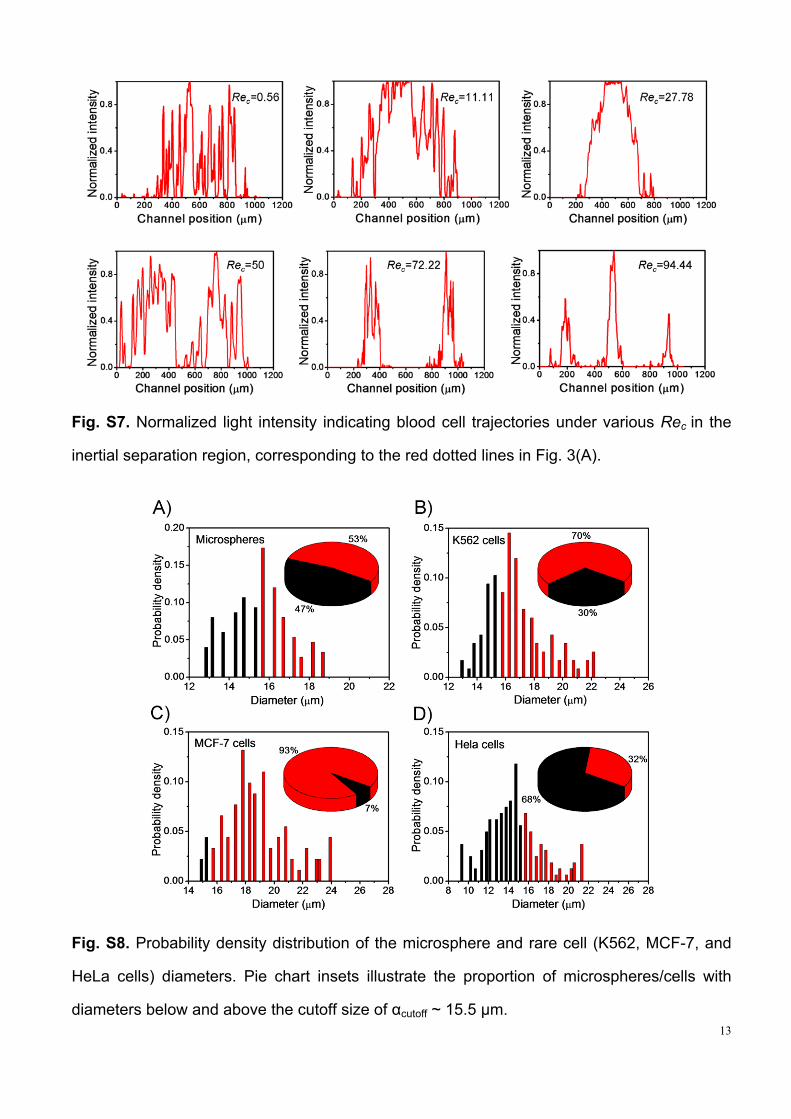
Fig. S7. Normalized light intensity indicating blood cell trajectories under various Rec in the
inertial separation region, corresponding to the red dotted lines in Fig. 3(A).
Fig. S8. Probability density distribution of the microsphere and rare cell (K562, MCF-7, and
HeLa cells) diameters. Pie chart insets illustrate the proportion of microspheres/cells with
diameters below and above the cutoff size of αcutoff ~ 15.5 μm.13

Fig. S9. Fluorescence intensity analysis indicating the microsphere trajectories under various
Rec in the steric hindrance region. (A) and (B) correspond to the red dotted lines in Figs. 4(A)
and (B), respectively.
Fig. S10. Plots presenting the effects of µITPAR on the collection efficiency of microspheres
(104 cells/mL), K562 cells (104 cells/mL), and blood cells (1% Hct) with increasing Rec,
respectively. Control groups represent the sample collection efficiency without steric
hindrance region.
14

Fig. S11. Evaluation of microfluidic system performance without steric hindrance region using
rare cells (K562, MCF-7, and HeLa cells). Statistical results of collection efficiency and
enrichment efficiency of rare cells at rare cell-to-blood cell ratio of 1/106. Each type of
independent rare cell spiked into diluted whole blood (sample 1, K562 cells; sample 2, MCF-7
cells; and sample 3, HeLa cells) was tested using optimum test conditions (1% Hct blood and
Rec = 72.22). Standard deviations deduced from ten parallel experiments are shown as the
error bars, with the significance assessed by ANOVA. **P < 0.01; *P < 0.05; N.S., not
significant.
15

Fig. S12. Comparison of bright-field (A–D) and fluorescence (A’ to D’) images of the mixture
of K562 and blood cells before separation (A and A’), cells collected from outlet 1 (B and B’),
cells from outlet 2 (C and C’), and cells from outlet 3 (D and D’). In the study, the ratio of
K562 cells-to-blood cells is 1/106 and Rec = 72.22. In addition, to facilitate the count of cell
recovery, K562 cells were stained with CellTracker Green. The results show that the rare
cells K562 were well enriched with a purity of 13.1%. Scale bar, 200 μm.
16

Fig. S13. Rare cell (K562, MCF-7, and HeLa cells) viability assay by reseeding them back
into culture. The bright-field images of cultures of control (unseparated) and separated rare
cells (104 cells/mL) collected from outlet 1 of the microfluidic device at Rec = 72.22. The
images indicate no significant differences between morphology and proliferation rate of the
rare cells, suggesting high viability and integrity. Scale bars, 200 μm.
17

Fig. S14. Comparison of cell viability between control (unseparated) and separated rare cells
(K562, MCF-7, and HeLa cells) using AO/PI double-staining method. (A) The bright-field (top)
and fluorescence (bottom) images of control (rows 1 and 2) and separated (rows 3 and 4)
rare cells. (B) Quantitative analysis of cellular viability of control (unseparated) and separated
rare cells. The results confirm that cells separated through the microfluidic system remain
highly viable, similar to control cells, retrieving > 92% viable cells. Scale bars, 100 μm.
References
1 J. Sha, Y. Wang, J. C. Wang, W. Liu, Q. Tu, A. Liu, L. Wang and J. Wang, Anal. Methods,
2011, 3, 1988–1994.
2 J.-S. Park, S.-H. Song and H.-I. Jung, Lab Chip, 2009, 9, 939–948.
3 A. A. S. Bhagat, H. W. Hou, L. D. Li, C. T. Lim and J. Han, Lab Chip, 2011, 11, 1870–1878.
4 S. L. Stott, C.-H. Hsu, D. I. Tsukrov, M. Yu, D. T. Miyamoto, B. A. Waltman, S. M.
Rothenberg, A. M. Shah, M. E. Smas, G. K. Korir, F. P. Floyd, A. J. Gilman, J. B. Lord, D.
Winokur, S. Springer, D. Irimia, S. Nagrath, L. V Sequist, R. J. Lee, K. J. Isselbacher, S.
Maheswaran, D. A. Haber and M. Toner, Proc. Natl. Acad. Sci. U. S. A., 2010, 107,
18392–18397.
5 J. Sun, M. Li, C. Liu, Y. Zhang, D. Liu, W. Liu, G. Hu and X. Jiang, Lab Chip, 2012, 12,
3952–3960.18

ESI Movies
Movie S1. Trajectories of fluorescence microspheres in the inertial separation region. Time-
lapse fluorescence images were acquired continuously when microspheres formed a single
band in the centerline of the inertial separation region at Rec = 72.22.
Movie S2. Trajectories of blood cells in the inertial focusing region and inertial separation
region. Time-lapse optical images were acquired continuously while three-band blood cell (1%
Hct) distributions occurred at Rec = 94.44.
Movie S3. Trajectories of K562 cells (spiked in diluted whole blood) in the inertial separation
region. Time-lapse optical images were acquired continuously, showing separation of K562
cells (102/mL, spiked in 1% Hct blood) at Rec = 72.22. The large K562 cells and a few blood
cells passed through the center channel, whereas most blood cells exited through the two
side channels.
Movie S4. Trajectories of fluorescence microspheres in the steric hindrance region. Time-
lapse fluorescence images were acquired continuously while microspheres formed a single
band in the centerline of the steric hindrance region at Rec = 72.22.
Movie S5. Trajectories of K562 cells (in PBS working buffer) in the steric hindrance region.
Time-lapse optical images were acquired continuously, showing trajectories of K562 cells
(104/mL) at Rec = 72.22. The K562 cells could not form a single band in the centerline of the
steric hindrance region, but they could be transported by μITPAR into outlet 1.
19