using social network analysis to explore digital student
TRANSCRIPT

Fort Hays State University Fort Hays State University
FHSU Scholars Repository FHSU Scholars Repository
TILT Faculty Publications TILT - Teaching Innovation and Learning Technologies
2015
Using Social Network Analysis to Explore Digital Student Using Social Network Analysis to Explore Digital Student
Interactions and Business Competency Learning in a Web-based Interactions and Business Competency Learning in a Web-based
Educational Platform: Educational Platform:
Andrew P. Feldstein Fort Hays State University, [email protected]
Kim Gower Virginia State University
Follow this and additional works at: https://scholars.fhsu.edu/learning_tech_facpubs
Part of the Education Commons
Recommended Citation Recommended Citation Feldstein, A., & Gower, K. (2015). Using Social Network Analysis to Explore Digital Student Interactions and Business Competency Learning in a Web-based Educational Platform: International Journal of Information Systems and Social Change, 6(1), 1–23. https://doi.org/10.4018/ijissc.2015010101
This Article is brought to you for free and open access by the TILT - Teaching Innovation and Learning Technologies at FHSU Scholars Repository. It has been accepted for inclusion in TILT Faculty Publications by an authorized administrator of FHSU Scholars Repository.

International Journal of Information Systems and Social Change, 6(1), 1-23, January-March 2015 1
Copyright © 2015, IGI Global. Copying or distributing in print or electronic forms without written permission of IGI Global is prohibited.
ABSTRACTWeb 2.0 tools occupy a large part of our lives, and their use in the classroom offers instructors a unique op-portunity to gather substantial information about individual and interactive student behaviors. The authors’ challenge is understanding the implications of this rich data source for assessing course efficacy and student learning, and applying these insights to further enhance the development of global business competencies. This paper reviews 311 student interactions as reflected in comments exchanged in a digital social learning community and, using social network analysis, discusses the potential to use these interactions to assess student critical thinking, communication, and collaborative feedback skills. The authors conclude with im-plications and recommendations for instructors who want to use Web 2.0 platforms and data to enhance their understanding of student and class digital interactions, and apply this information to course enhancement.
Using Social Network Analysis to Explore Digital Student Interactions and Business
Competency Learning in a Web-based Educational Platform
Andrew Feldstein, Department of Management and Marketing, Virginia State University, Petersburg, VA, USA
Kim Gower, Department of Management and Marketing, Virginia State University, Petersburg, VA, USA
Keywords: Assessment, Business Competencies, Collaboration, Critical Thinking, Data Mining, Learning Analytics, Learning Disruption, Social Change, Social Learning, Social Network Analysis, Web 2.0
INTRODUCTION
It has been suggested that Web 2.0 will change the face of society more than the invention of the printing press (Hargadon, 2008). As a result
of this technology disruption, the educational landscape has become extraordinarily turbu-lent (Shum & Ferguson 2012). As information becomes more plentiful and easier to access, the emphasis in the classroom, face-to-face or
DOI: 10.4018/ijissc.2015010101

Copyright © 2015, IGI Global. Copying or distributing in print or electronic forms without written permission of IGI Global is prohibited.
2 International Journal of Information Systems and Social Change, 6(1), 1-23, January-March 2015
virtual, begins to shift from information reten-tion to the process of knowledge management, including information gathering, evaluating, and sharing, and then assessment of these pro-cesses. This allows different learning flows to coexist, creating a need for the professor, and researcher, to identify which learning flows are most valued by students (Canzi, Folcio, Milani, Radice, Santangelo, & Zanoni, 2003).
Over a decade ago, management educators began to call for the extensive use of technol-ogy in the classroom as a way to familiarize students with its global information implications in the business world (e.g., Shrivastava, 1999). Recently, however, it has been suggested that we still lack the appropriate metrics to evaluate and assess the impact the digital world has on us (New Media Consortium, 2012). Therefore, it seems our ability to fully understand and as-sess student learning, even when using virtual tools in the classroom, is not keeping up with technology and changing student engagement techniques.
The current Web 2.0 platforms available to educators provide plentiful data about student activities and interactions that take place via the tracking of the digital “persistent history” they leave behind. These data, or artifacts, are found on many websites and online platforms including community forums (chat rooms), blogs (individual or group sites that share in-formation with visitors) and wikis (group web sites that allow content to be added and edited by any member of the group). When students download files, login to these websites, and perform various other tasks they create digital footprints. These footprints provide a sequential record of behaviors and interactions. Thus, individual student behaviors and group interac-tions can be charted, evaluated and assessed. The value to us as educators lies in our ability to assess these footprints since they provide data not normally available to the instructor via real-time interactions.
Despite the readily accessible volume of data provided by the persistent history feature of Web 2.0 systems, we still lack the appropriate understanding what all that data implies. In fact,
even in the business world, knowledge manage-ment and knowledge sharing are still in their infancy (Malhotra, 2010). Hence, learning how to best gather and assess student interactions in Web 2.0 platforms helps us analyze learning, and helps students learn how to share their knowledge across digital platforms, enhancing communication and collaboration.
This paper reviews 1,154 digital student contributions, taken over a semester in a junior level marketing course, and analyzes the 312 comments made regarding these contributions. Based on social learning theory, we discuss how these interactions apply to developing three key scholastic and employability skills: criti-cal thinking, oral and written communication and giving and receiving feedback. We will also discuss what the data can tell us about the quality of the communication and the collab-orative processes undertaken by students, and offer some determinations about how that data relates to student learning and the potential for assessment of the learning processes as opposed to merely evaluating the artifacts representing outcomes. We will conclude with implications and recommendations for instructors using Web 2.0 tools to assess learning and help develop student skills to benefit them the professional world.
LEARNING, DEVELOPING SKILLS, AND ASSESSING IN A VIRTUAL WORLD
Information and communication technologies (ICT’s) are now a ubiquitous part of our stu-dents’ everyday lives. The number of virtual tools available for student use grows every day and run from blogs to cloud computing (storing information on a web-based site versus directly on personal hardware) to social networking sites (Demski, 2010). In fact, this generation of college students is the first to be entering the work world with a lack of work experience and employer references, so their online history may play a large role in an employer’s evaluation (Melton, Miller, & Salmona, 2012).

Copyright © 2015, IGI Global. Copying or distributing in print or electronic forms without written permission of IGI Global is prohibited.
International Journal of Information Systems and Social Change, 6(1), 1-23, January-March 2015 3
Despite the difficulty of keeping up with these technology advances, management edu-cators must protect themselves from being left behind in the digital world (Bilimoria, 1997), and this includes understanding how ICT’s enhance individual and team communication, collaboration and effectiveness and allow instructors to better implement and facilitate technology as a learning tool.
Besides offering a curriculum in a familiar format for users, the resulting data created by an LMS allows instructors gain insight into their students’ learning progress and behaviors, and use this information to enhance and improve the student learning experience.
Social Learning
Typical performance indicators in educational settings usually involve outcome-centric ana-lytics based on learners’ performance on pre-defined tasks. Success is typically defined as the display of expertise through summative assessment tasks (for example, assignments, exams or quizzes) which gauge mastery of the knowledge. The focus, therefore, is on individual performance and on what has been achieved (Shum & Ferguson, 2012). This model is familiar and comfortable in today’s classrooms. However, as we become more con-nected to information and to each other through various web-based platforms, the opportunities as well as the imperative to take advantage of the myriad resources now readily available to everyone changes the way we need to think about learning and problem solving, particularly through the lens of social learning.
Social learning was made popular by Bandura (1977), and education literature high-lights the importance for instructors to adopt a community-centered pedagogy as a strategy for facilitating student learning (e.g. Brook & Oliver, 2003; Fink, 2003; Johnson, 2001). This model focuses on developing activities that promote learner-to-learner interactions and the co-construction of knowledge through sharing information and resources. In this context, learning activities frequently use group work
and collaboration (Dawson, 2008), which helps foster critical team skills surrounding social and organizational capabilities (De Meo, Plu-tino, Quattrone, & Ursino, 2010). In addition, research strongly supports collaborative learn-ing as a key critical thinking development tool (Sterbini & Temperini, 2011).
Social learning also creates additional value through community involvement and networking. The community aspect refers to the development of a shared identity around a topic or set of challenges. It creates a collective intention to harness a domain of knowledge and to sustain learning about it (Wenger, et al. 2011). The network aspect refers to the set of relationships, personal interactions, and con-nections among participants who have personal reasons to connect. It is viewed as a set of nodes and links with affordances for learning, such as information flows, helpful linkages, joint problem solving, and knowledge creation.
A true social learning community, there-fore, creates a social space in which participants can share an identity, network, and discover and further a learning partnership related to a common domain. This partnership can be formal or informal and its intention can be explicit or tacit. Activities such as sharing information, tips and documents, learning from each other’s experience, helping each other with challenges, creating knowledge together, keeping up with the field, stimulating change, and offering new types of professional development opportunities (Wenger, et al. 2011) all come together in a social learning environment, and often organically.
Online social learning communities sup-port this technological communication shift by creating open channels for the dissemination and exchange of information, thereby helping students develop relevant, critical industry skills. Andrews and Haythornthwaite (2007) suggest that there is a relationship between new technologies and learning which is reciprocal and co-evolutionary. From this perspective, we must acknowledge that social learning through technology is changing the very nature of learning as we know it, as it shifts from the use of individual technology to individuals using
Copyright © 2015, IGI Global. Copying or distributing in print or electronic forms without written permission of IGI Global is prohibited.
4 International Journal of Information Systems and Social Change, 6(1), 1-23, January-March 2015
technology to support relationships (Siemens, 2005).
As a result, on-line social learning plat-forms create communities of practice and bring additional value by providing community involvement and networking opportunities out-side of the traditional face to face (Wenger et al., 2011). Learners are able to actively participate as they contribute to the process as authors and knowledge managers (Ivanova, 2011). This community involvement and networking are the social fabric of learning, and generate learn-ing partnerships among people who use each other’s experience as a learning resource and then join forces to make sense of and address the challenges they face (Wenger et al., 2011).
In education, it is clear that the success of the social learning community requires that all participants commit to the community concept and take responsibility for the learning process. Success is also reliant on the connections and relationships that comprise the network formed by students, instructor, and the resulting flow of information. When a fully functional online component is incorporated in this community of practice the scope of interaction is increased dramatically. What was once a straightfor-ward interaction between an instructor, her or his chosen content and the students has now become a robust and participative learning experience. Additionally, creating this type of community also helps meet the challenges of today’s dynamic organizational environ-ment, further assisting the student in gaining valuable insight into their life after graduation (Monaghan, 2011).
Digital social learning spaces add yet another dimension of social interaction that creates a larger, more complex space for interac-tion, with multiple modes of communication, greater distances of potential interaction, and compressed/enhanced synchronous and asyn-chronous means of communication (Andrews & Haythornthwaite, 2007). By adding the tech-nology element, social learning environments are even more strongly mirroring the dynamic professional environment where interactions occur across a broad array of platforms and
proximities and involve a continuous exchange of information and feedback, contributing to the development of key global business skills.
Developing Business Ready Graduates
It is widely recognized that certain knowledge, skills and abilities (KSA’s) are required of management graduates in the global business environment, regardless of the position (McE-voy, 1998). For organizations to continue to be competitive, more and more is required of the new business professionals we send out into the market (Jackson, 2010). Despite this, higher education has been taken to task recently for producing graduates that are not ready to immediately add value to the organization (Blaylock, McDaniel, Falk, Hollandsworth, & Kopf, 2009), particularly in the area of soft skill competencies (e.g., Halfhill & Nielsen, 2007; Casner-Lotto & Barrington, 2006). Of more concern, even educators recognize that the acquisition of knowledge and the development of competencies are often separate entities in business school curriculums (Berdrow & Evers, 2011), and this lack of emphasis on soft skill development seems to effect students as they deem classes like organizational behavior to be relatively unimportant to their development as business professionals (Halfhill & Nielsen, 2007).
To further understand the significance of this gap, it has been found that more and more employers are placing the greatest emphasis on soft or “employability” skills, which they feel can be turned into intellectual capital versus simply the intellectual commodities of technical skills (Boston Area Advance Tech-nological Education Connections [BATEC], 2007). Employability skills are those personal characteristics that influence a wide variety of business skills and behaviors. While there are a broad array of competencies falling under the employability skill dimension (team work, leadership, etc.), three key elements emerge that play an important role in more than one skill (Jackson, 2010) and can be tracked via the digital
Copyright © 2015, IGI Global. Copying or distributing in print or electronic forms without written permission of IGI Global is prohibited.
International Journal of Information Systems and Social Change, 6(1), 1-23, January-March 2015 5
classroom learning data: critical thinking, oral and written communication skills and giving and receiving feedback.
Critical thinking, or the ability to use one’s knowledge and intellectual capacities to mentally process and achieve certain goals (Smith, 2003), is an important part of both higher education and organization requirements, including problem solving and decision making (Smith, 2003). Oral and written communica-tion skills are consistently ranked as some of the most important skills in all areas of job performance, yet experience some of the widest gaps between required and actual performance (Jackson, 2010). Finally, giving and receiving feedback is also a cross competency skill and applies to project management and team work (Jackson, 2011) and leadership skill develop-ment (Hess, 2007), just to name a few. In fact, The Association to Advance Collegiate Schools of Business (AACSB) lists feedback as one of its key standards for accreditation (AACSB, 2012). Unfortunately, this standard only applies to instructors providing feedback to students and does not embrace the more robust multi-source feedback systems that dominate employee evaluation and development in the U.S. (At-water, Waldman, Ostroff, Robie, & Johnson, 2005), highlighting yet another significant gap between education and practice.
We propose that implementing a digital social learning environment fills several needs. First, it offers students the ability to interact scholastically outside of the confines of a tra-ditional classroom. This type of communication and interaction is very familiar to almost all of them, so using social learning communities is merely giving them another, and more profes-sional, platform in which to interact. As a result, students are developing critical thinking, com-munication, and collaboration skills that more closely emulate what will be required of them in the technology driven business environment. Next, social learning communities provide the instructor with a built in source of learning as-sessment data. Both the frequency and quality of student touches in an online environment are readily available, and reviewing student contri-
butions helps the instructor see where strengths and opportunities exist in course content and student development. Finally, analyzing and applying this data to course elaboration, through the process of learning analytics, will enhance student progress and continue to narrow the gap between the classroom and the business world.
Learning Analytics
The Society for Learning Analytics Research defines learning analytics as the measurement, collection, analysis and reporting of data about learners and their contexts, for purposes of understanding and optimizing learning and the environments in which it occurs (http://www.solaresearch.org/mission/about/). Learning ana-lytics as a field of study is in its infancy but, fu-eled by the availability of large amounts of data that can be gathered from learning management systems and Web 2.0 platforms, it is attracting the attention of educators and administrators alike. As huge amounts of digital data about learners’ activities and interests become avail-able, there is an exciting opportunity to extract knowledge from the subsequent databases and turn them into knowledge (UmaMaheswari & Rajaram, 2009) that can be used to modify teaching styles and improve learning.
Analyzing comment interaction data from Web 2.0 education applications provides us with keen insights into where and how these connections occur, and the contributions they make to overall student learning. We can track instances where students access existing data and post new information via their own research and we can also view the feedback loops as a result of students sharing information among their community members. By viewing learning as a connection-making process, and analyzing the connections to understand how they are formed and what exchanges they create between people, we are able to better judge the impact of those connections (Siemens, 2004) and as-sess their contributions to important business skill development. Learning analytics are also helpful at the individual student level since we can see where and when they engage with these

Copyright © 2015, IGI Global. Copying or distributing in print or electronic forms without written permission of IGI Global is prohibited.
6 International Journal of Information Systems and Social Change, 6(1), 1-23, January-March 2015
online and mobile learning platforms, showing learning patterns and activity that might indicate risk of failure or drop out (Siemens & Gasevic 2012). In sum, using learning analytics to as-sess digital social learning platforms allow us to shift our focus from summative assessments of individual performance to visible, and in some cases actionable, behaviors and patterns at the individual and collaborative levels in the learning environment (Shum & Ferguson 2012).
The most popular method for viewing learning analytic data is through Social Net-work Analysis (SNA), which was developed to analyze the importance of relationships among interacting units (Wasserman & Faust 1994). From a research perspective, Borgatti and Foster (2003) noted the dramatic increase in organizational research from a social network perspective because of the move away from individualistic explanation toward more rela-tional, contextual, and systematic understanding (Borgatti & Foster 2003). Examples of SNA in education research include Reffay and Chanier (2003) who used it to describe relationships and interactions occurring among students and staff participating in a computer-supported col-laborative learning environment. The authors found SNA provided an opportunity to gauge the communicative interactions that take place and to assess the degree of cohesion within the group. Additionally, SNA was used to explore the relationship between a student’s position in a classroom social network and their reported level of sense of community, and the degree of personalized support the individual student needed (Dawson, 2008). SNA enables the re-searcher to use cluster visualization, an essential part in data mining, to validate and refine the clusters (Alagambigai & Thangavel, (2010).
Connecting Analytics to Outcomes
There is a paradigm shift at the center of this exploration. Earlier in the paper we have identi-fied three skills that business school graduates are expected to have. Critical thinking skills, oral and written communication skills, and the ability to give and receive feedback via
collaboration are all skills that are assessed as part of expected course outcomes. However, we typically assess these objectives in terms of individual performance. Although some of what we observe will touch on individual metrics, this exploration is designed to explore ways to incorporate the interactions between and among class members.
In a traditional classroom, either virtual or face-to-face, we examine student contributions to the comment network as discreet entities. We evaluate the quality of the content, and if the comment is part of an online discussion board, we might have a rubric that reflects our expecta-tions. Either way, the content of the comments are at the center of the evaluation. One reason we may rely on content as the centerpiece of student assessment is that content is a fixed product that we can attribute to a known con-text. Content, in the course setting, is usually the result of a specific assignment and so we can judge its relevance and its quality based on the nature of the assignment.
A number of unique opportunities have been created by virtue of the web-based char-acteristic of persistent history mentioned earlier. Persistent history provides us with meta-data that allows us a more holistic view of the net-work of interactions. Since we can now identify who is talking to whom and in what order, we can connect comments to context. Because of persistent history documenting an online conversation as to time, sequence, participant, and who is addressing whom has become a relatively easy task. These pieces of informa-tion are embedded in each post as a part of the community structure.
Abrams and Hall (2006) refer to this pro-cess as conversation mapping. “A Conversation Mapping can construct a rendering of each participant from the history of that person’s interactions in the environment. Such a depic-tion is meaningful: it can help make each person stand out as an individual. Persistent history is the information world’s version of a body” (Donath, 2006, p.73). Our exploratory analysis will attempt to map the comment network from a course-based, online social learning community.
Copyright © 2015, IGI Global. Copying or distributing in print or electronic forms without written permission of IGI Global is prohibited.
International Journal of Information Systems and Social Change, 6(1), 1-23, January-March 2015 7
The mapping process will include visual rep-resentations of the interactions taking place, as well as descriptive statistics designed to quantify the relative contributions of the members of the learning community. Since this is a classroom context we will combine relational network data with non-relational attributes such as student gender, classification, and grades.
In a graphical representation of the social learning community comment network, com-munity members are identified as nodes, and edges are the lines that convey information about the relations between nodes. A well-rendered graphical representation, or visualization of community member attributes and the rela-tionship between these members can present a picture of the network that can lead to intuitive revelations about the social structure and nature of the community (Bastian et al., 2009; Brandes et al., 2001; Fortunato, 2010; Freeman, 2007; Sharara et al., 2010; Wasserman & Faust 1994).
Below we describe our study, which took digital social learning platform data from a 300 level marketing class and used SNA to discover where, when, and how students were collaborating and connecting via an analysis of the student comment information.
METHODS
Participants
The course in the study is a required part of the core business curriculum taught at an AACSB accredited Historically Black College and University (HBCU) business school, with an enrollment of approximately 1200 students. The course was designed as a blended learning course (learning that is facilitated by combining different modes of delivery, models of teaching, styles of learning and transparent communica-tion among all involved parties) (Heinze & Procter, 2004) with an on-site classroom and an online digital social learning community plat-form, GoingOn (GO). The community allowed for a free flow of information across content areas, allowing instructors and students to post articles, videos, comments and links, and carry
on robust discussions between instructors and students, and from students to students.
The school where the study took place has been recognized several times for its progressive implementation of technology in the learning environment, and implementing a social learn-ing environment was the next strategic step after converting to primarily digital textbook initiative. GoingOn was chosen for its intuitive design (a big help for even the novice technol-ogy instructor and student) and its informal, on-demand, self-service collaboration tools and intelligent messaging (GoingOn, 2012).
The data was collected from 44 students in a 300-level Brand Management course, many of whom were using the GO system for the first time. The majority of the students were junior and senior business and communica-tion studies majors. In the specific community analyzed for this study, students contributed content in a number of different formats and for various purposes, and the instructor encouraged contributions as part of the class learning and community culture. Some contributions satis-fied the requirements of specific assignments, but a large percentage of contributions were posted because students wished to share relevant course information. Students initiated 82 forum discussions and posted 220 videos, 603 images, 49 bookmarks and over 200 blog posts. The instructor prompted students, throughout the semester, to offer each other encouragement and constructive feedback by using the GO comment tool.
Research Design
The methodology includes information gath-ering about student activities and their role in the learning process through monitoring and tracking students’ behavior and assessment results (Ivanova & Popova, 2011) via com-ments. Unlike any other form of interaction in the learning community, comments pos-sess two important characteristics that make them a good resource for our exploration of analytics as an assessment tool. First, they are spontaneous. Students were encouraged, but
Copyright © 2015, IGI Global. Copying or distributing in print or electronic forms without written permission of IGI Global is prohibited.
8 International Journal of Information Systems and Social Change, 6(1), 1-23, January-March 2015
not required, to use the comment feature in the community. They commented to ask for help, to offer encouragement to others, and to explore substantive issues that were being discussed in the course. Second, comments require some effort on the part of those commenting. Unlike posting a video, a bookmark, or an image to the community, comments required students to create something using their own words. Com-ments were also more personal than the other contributions because they were directed to and from individuals in the class. Posting something like a video is for the benefit of the class as a whole, posting comments create a directional relationship and opens up the conversation for feedback from other students or the instructor.
As stated earlier, the goal of this study was to map the comment network in a specific social learning community as a first step towards de-veloping a more versatile range of assessment tools. We will examine this community at three different levels but, in each case, we will be focusing on the interactions and the context rather than on content alone. The first step will be a preliminary one, in that we will keep sight of the content at all times. This is, perhaps, the most labor-intensive part of the study but will provide a baseline for our characterization of this specific learning community.
Interestingly, there are three subsystems of educational activities: formal, non-formal and informal (Ivanova & Popova, 2011), and com-ments give us an overview of all three. As an example, if the professor used a video in class and students commented on it later, it would be part of the formal, curriculum based subsystem. Non-formal comments would be those related to groups working together outside of class re-quirements, and informal are those spontaneous comments that arise purely from having a social networking site available for communication among students. This study holds that all three types are critical in the social learning process, hence all three are examined here.
The second step will be to look at the comment network as an entity in and of itself. Here we will rely on group level social network attributes such as density, and modularity. Each
of these characteristics speaks to the relative robustness of the community as represented by the comment network. Density, for instance, measures group cohesion. If all actors are di-rectly connected to one another the graph has a value of 1 and is said to be complete. On the other hand, an empty graph will have a value of 0 (Wasserman & Faust 1994). These numbers are meaningful only relative to graphs with a similar number of nodes. The primary goal, at this level of analysis, will be to determine how active and robust this community is. As instructors we have all certainly observed that some classes and courses seem to be much more engaged than others. These measures might be a way to quantify that level of engagement in the online learning communities.
The third step will be to look closely at network measures that identify the relative position of each of the community members in the network. Here we will attempt to make sense out of the meta-data available through persistent history as we compare the course interactions at the level of the individual student. We will employ social network analysis, using graph theory to identify ‘important actors’ in our comment network. (Wasserman & Faust, 1994) Network theorists apply the term centrality to a series of mathematical concepts that are used to visualize and quantify an actor’s centrality.
Centrality plays a key role in SNA. Degree centrality focuses on individual actors and measures how many other actors that person is in direct contact with. Actors with high degree have either made or received more connections. Eigenvector centrality measures the extent to which an actor (node) displays power and in-fluence in that community. We focus on these three centrality measures to gain some insight into each of the three skills identified earlier. Measures of centrality can help frame com-ments made by students, not only the quantity and quality of isolated student comments, but by seeing those comments in context. We will visualize the comment network focusing on degree centrality and eigenvector centrality.
Degree centrality shows, not only the num-ber of comments, but also their directionality.

Copyright © 2015, IGI Global. Copying or distributing in print or electronic forms without written permission of IGI Global is prohibited.
International Journal of Information Systems and Social Change, 6(1), 1-23, January-March 2015 9
In our comment network, out-degree represents comments made by individual students. Stu-dents who make a lot of comments will have a high out-degree score. The online comment network also allows us to determine to whom the comment was addressed. This in-degree behavior offers an important insight since we can infer a number of things about student interactions from the students to whom they choose to direct their comments. Eigenvector centrality measures add an additional layer to the analysis. By mapping the comment network as an interactive system we can also identify the most important and influential actors in the network.
Procedure
To prepare for this exploratory analysis it was necessary to divide all interactions in the com-ment network into two categories: node-based attributes and edge-based attributes. Node-based attributes we identified were student gender, major, classification, and then com-ments. These comments represents four func-tional comment categories identified through a content analysis of the comment network. They will be discussed in greater detail in the ‘Results’ section. When using ‘comment type’ as a node-based attribute, we chose the type they posted most often.
Edge-based attributes, however, were the primary focus of this study. An edge is the con-nection formed when a comment, made by one participant, is directed to another. Each initial comment was made in response to one of 1154 blog posts, bookmarks, or videos contributed by other students. The attributes we collected were directionality (who originated a comment and to whom it was directed), weight (if mul-tiple comments were directed by one student to another), and type of comment (again based on the comment categories). There were 311 total comments. 32 comments were eliminated because these created loops. In these cases a student was commenting on a comment they had just made. The comment wasn’t directed to anyone specifically. Edges were weighted
to indicate the number of times a student had directed comments to the same person, resulting in 179 of the edges weighted at 1 (meaning there was only one comment directed from student A to student B), 38 edges weighted at 2, two edges weighted at 3, three edges weighted at 4, and one edge weighted at 6. However, all but one of the interactions weighted over 3 were between the instructor and a student.
Social network analysis is based on the patterns of connections between the nodes (course participants) and edges (comments). Each connection was recorded and shown in Figure 1. The resulting .csv files (execrted in Table 1) were read by Gephi, which is “an in-teractive visualization and exploration platform for all kinds of networks and complex systems, dynamic and hierarchical graphs” (https://gephi.org/). All conversation maps and visualizations used for level two and three analyses in this study were rendered using the Gephi software platform.
RESULTS
Level One: Comment Types
Comments were categorized on three dimen-sions - directionality, sequence, and content. Directionality, in this case, refers to who is talking to whom. In social network analysis this is referred to as in-degree (someone has received a comment) and out-degree (someone has posted a comment). The community com-ments log clearly indicates this directionality. Also, since each comment is time stamped, we can also look at the comments sequentially. This might be important if we wanted to determine whether particular students initiated a discussion or whether they only responded to prompts from others. Finally, we look at content. In traditional learning situations we are used to assessing student comments as discreet contributions, and evaluate the content as the product of an individual student. Here we examine content in context. If we look at the comment network as an evolving conversation we have an opportunity to recognize contributions that, while having

Copyright © 2015, IGI Global. Copying or distributing in print or electronic forms without written permission of IGI Global is prohibited.
10 International Journal of Information Systems and Social Change, 6(1), 1-23, January-March 2015
little intrinsic value, challenged other class members to delve more deeply into a particular topic. To explore the different characteristics of the comments in the comment network we have created four categories.
The 2x2 matrix in Table 2 shows the basic distribution of four types of comments made throughout the course. High Content/ Primary comments were typically initiated in response to a community blog post written by another student. These comments were substantive in nature and typically requested clarification from the author of the blog or suggested areas of
improvement. By contrast High Social/ Primary comments were much less substantive. They usually consisted of an encouraging phrase but did little to add new ideas to the discussion.
Response comments were triggered by a primary comment. High Content/ Response comments were typically responses to the High Content/ Primary comments. Students didn’t show any sign of avoiding or ignoring com-ments directed to them. A High Social/ Response to a High Social/ Primary comment typically took the form of a “thank you”. Although High Content/ Primary comments were routinely
Table 1. Comment edge data set
Source Target Type Weight Comment Type
1 25 Directed 1 4
1 41 Dircted 1 3
1 44 Dircted 1 4
1 12 Directed 2 1
2 2 Directed 1 3
2 8 Directed 1 1
2 29 Directed 1 4
2 40 Dircted 1 4
3 37 Dircted 1 4
4 17 Directed 1 4
4 22 Directed 1 3
4 26 Directed 2 4
4 45 Directed 2 4
5 45 Dircted 1 4
5 36 Dircted 2 4
6 11 Dircted 1 2
6 16 Dircted 1 1
6 31 Dircted 1 1
6 38 Dircted 1 3
6 39 Dircted 1 1
6 45 Dircted 1 2
6 13 Dircted 2 2
6 28 Dircted 2 2
6 46 Dircted 2 1
7 39 Dircted 1 2

Copyright © 2015, IGI Global. Copying or distributing in print or electronic forms without written permission of IGI Global is prohibited.
International Journal of Information Systems and Social Change, 6(1), 1-23, January-March 2015 11
reciprocated, this was not always so with high social comments.
Real examples of comments from these four areas are below. A High Social/ Primary comment type is an encouraging comment typified by “Your evaluation was excellent. You
touched on every topic and explained clearly. In my opinion, I’m confident that there’s not much you need to change if anything” and “Your explanation of the new and improved Windows 8 was very informative. The video that you posted made everything much more clear and
Table 2. Comment count by type
Primary Response
High Content 81 81
High Social 81 62
Figure 1. Directional comment network by comment type
Copyright © 2015, IGI Global. Copying or distributing in print or electronic forms without written permission of IGI Global is prohibited.
12 International Journal of Information Systems and Social Change, 6(1), 1-23, January-March 2015
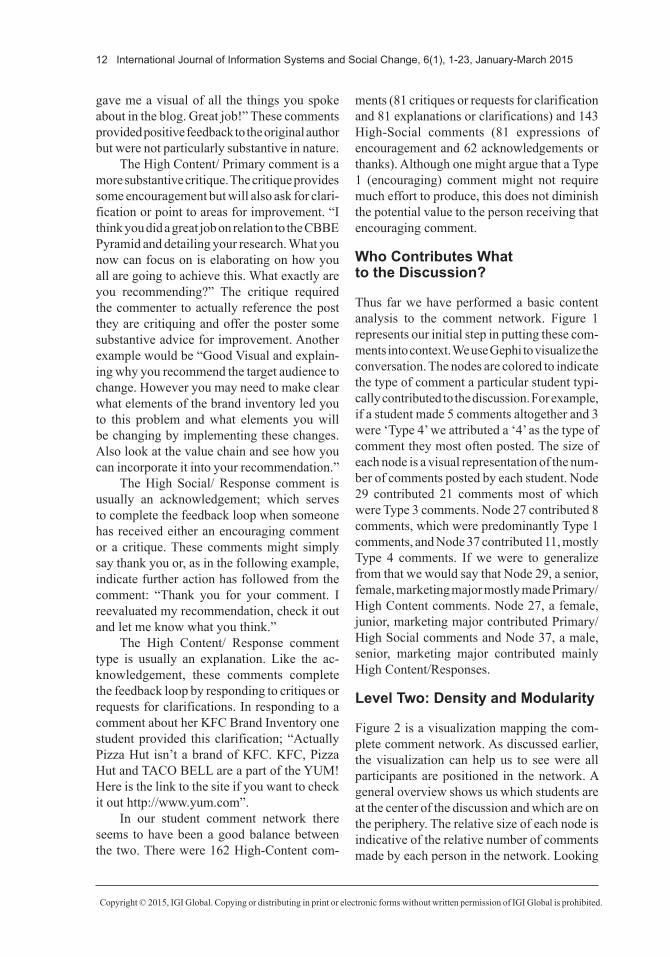
gave me a visual of all the things you spoke about in the blog. Great job!” These comments provided positive feedback to the original author but were not particularly substantive in nature.
The High Content/ Primary comment is a more substantive critique. The critique provides some encouragement but will also ask for clari-fication or point to areas for improvement. “I think you did a great job on relation to the CBBE Pyramid and detailing your research. What you now can focus on is elaborating on how you all are going to achieve this. What exactly are you recommending?” The critique required the commenter to actually reference the post they are critiquing and offer the poster some substantive advice for improvement. Another example would be “Good Visual and explain-ing why you recommend the target audience to change. However you may need to make clear what elements of the brand inventory led you to this problem and what elements you will be changing by implementing these changes. Also look at the value chain and see how you can incorporate it into your recommendation.”
The High Social/ Response comment is usually an acknowledgement; which serves to complete the feedback loop when someone has received either an encouraging comment or a critique. These comments might simply say thank you or, as in the following example, indicate further action has followed from the comment: “Thank you for your comment. I reevaluated my recommendation, check it out and let me know what you think.”
The High Content/ Response comment type is usually an explanation. Like the ac-knowledgement, these comments complete the feedback loop by responding to critiques or requests for clarifications. In responding to a comment about her KFC Brand Inventory one student provided this clarification; “Actually Pizza Hut isn’t a brand of KFC. KFC, Pizza Hut and TACO BELL are a part of the YUM! Here is the link to the site if you want to check it out http://www.yum.com”.
In our student comment network there seems to have been a good balance between the two. There were 162 High-Content com-
ments (81 critiques or requests for clarification and 81 explanations or clarifications) and 143 High-Social comments (81 expressions of encouragement and 62 acknowledgements or thanks). Although one might argue that a Type 1 (encouraging) comment might not require much effort to produce, this does not diminish the potential value to the person receiving that encouraging comment.
Who Contributes What to the Discussion?
Thus far we have performed a basic content analysis to the comment network. Figure 1 represents our initial step in putting these com-ments into context. We use Gephi to visualize the conversation. The nodes are colored to indicate the type of comment a particular student typi-cally contributed to the discussion. For example, if a student made 5 comments altogether and 3 were ‘Type 4’ we attributed a ‘4’ as the type of comment they most often posted. The size of each node is a visual representation of the num-ber of comments posted by each student. Node 29 contributed 21 comments most of which were Type 3 comments. Node 27 contributed 8 comments, which were predominantly Type 1 comments, and Node 37 contributed 11, mostly Type 4 comments. If we were to generalize from that we would say that Node 29, a senior, female, marketing major mostly made Primary/ High Content comments. Node 27, a female, junior, marketing major contributed Primary/High Social comments and Node 37, a male, senior, marketing major contributed mainly High Content/Responses.
Level Two: Density and Modularity
Figure 2 is a visualization mapping the com-plete comment network. As discussed earlier, the visualization can help us to see were all participants are positioned in the network. A general overview shows us which students are at the center of the discussion and which are on the periphery. The relative size of each node is indicative of the relative number of comments made by each person in the network. Looking

Copyright © 2015, IGI Global. Copying or distributing in print or electronic forms without written permission of IGI Global is prohibited.
International Journal of Information Systems and Social Change, 6(1), 1-23, January-March 2015 13
more closely we can identify who is talking directly to whom as well as the distance between each member. For reference Node 39 is the course instructor who, not surprisingly, appears near the center of the network. As we look at the relative position of each node in the network we can easily identify the smallest nodes, that are furthest from the center, as students who are least engaged in the conversation.
The overall density of the network is 0.111. This indicates that the network is approximately 11% complete. Had everyone in the network directed a comment to every other member the density would have reached 100%. In the realm of classroom conversations, whether online or face-to-face, 100% is probably an unrealistic expectation. It is reasonable, however, to ask whether we can relate density to the overall
quality of the comment network. For this we could compare the 11% completeness of this network with other networks of similar size. In an actual classroom situation we could experi-ment with strategies that might either increase of decrease the density of the network.
Modularity
Modularity is the division of the network into groups, with larger values indicating stron-ger community structures (Newman, 2006). Modularity is tied to eigenvector centrality; which will be discussed in more detail in part three of this analysis. For our purposes, each of the 4 modularity classes (visualized as radi-als in Figure 3) contains a subset of students who interacted more with others of the same
Figure 2. Complete comment network rendered in Gephi

Copyright © 2015, IGI Global. Copying or distributing in print or electronic forms without written permission of IGI Global is prohibited.
14 International Journal of Information Systems and Social Change, 6(1), 1-23, January-March 2015
modularity class than those outside that group. Community members with a high eigenvector centrality score hold each subgroup together. When looked at in isolation we identify nodes with a high eigenvector score (closer to 1 on a scale of 0 to 1) as being more influential. In the context of modularity classes we can see more clearly whom the students with a high eigenvector score are influencing.
In Figure 3 the larger nodes represent higher eigenvector scores. We can see an interesting distribution of high eigenvector scores across the modularity classes. There is, however no apparent parity here. Class 0, the largest of the 4 subgroups contains the instructor (Node 39) and the student with the highest overall eigenvector
score in the network (Node 29). Also in that modularity class is Node 4, whose eigenvector score is also higher than any other member of the network. This means that the other subgroups are, potentially, being led off-topic or having a more isolated discussion. We see Node 24 (the member with the highest eigenvector score in Class 2) at the bottom right of Figure 2.
What does this mean for the interactions of the 12 members of Class 2 that the lead node is so far from the center of the network? It might be interesting for the instructor to take a closer look here at the make-up of each modularity class. Newman suggests that these high eigenvector nodes can be influential in either a positive, or a negative, way. “The fundamental meaning
Figure 3. Modularity classes within network

Copyright © 2015, IGI Global. Copying or distributing in print or electronic forms without written permission of IGI Global is prohibited.
International Journal of Information Systems and Social Change, 6(1), 1-23, January-March 2015 15
of this centrality measure is thus that there are certain vertices that, as a consequence of their situation within the network, have the power to make substantial contributions, either positive or negative, to the overall modularity of the network. For this reason, we call this central-ity measure community centrality.” (Newman, 2006, p.18) It would be meaningful to discover if someone in the network is negatively impact-ing any of the smaller modularity classes. This might, if identified early enough in a semester, offer instructors an opportunity to do some restructuring or social engineering.
At the network level our questions tend to concern the structure of the network as a whole. We do not yet know what the ideal density of a network might be any more than we know how to interpret the number and make-up of modularity classes. In fact, these might not be the best questions to be asking. Now that we can see and measure the meta-data surround-ing these interactions our ‘next steps’ holds the promise of providing educators with a level of insight not previously available.
Level Three: Nodes and Attributes
We are now moving the analysis from the net-work level to the node level. The centrality of a node is a structural attribute that is used to visualize and quantify a person’s position within a network (Brandes et al., 2001). Researchers can employ different types of centrality mea-sures depending on the nature of the research question. Here we will identify social network measures that might give us some insight into each of these three skills. Measures of centrality can help frame comments made by students, not only the quantity and quality of isolated student comments, but by seeing those comments in context. We will visualize the comment network at degree centrality and eigenvector centrality. The first of these is degree centrality. In our com-ment’s network a learning community member’s degree centrality is measured by the frequency that a comment created by, or directed to, that member. The number of comments provides information regarding how active a student is
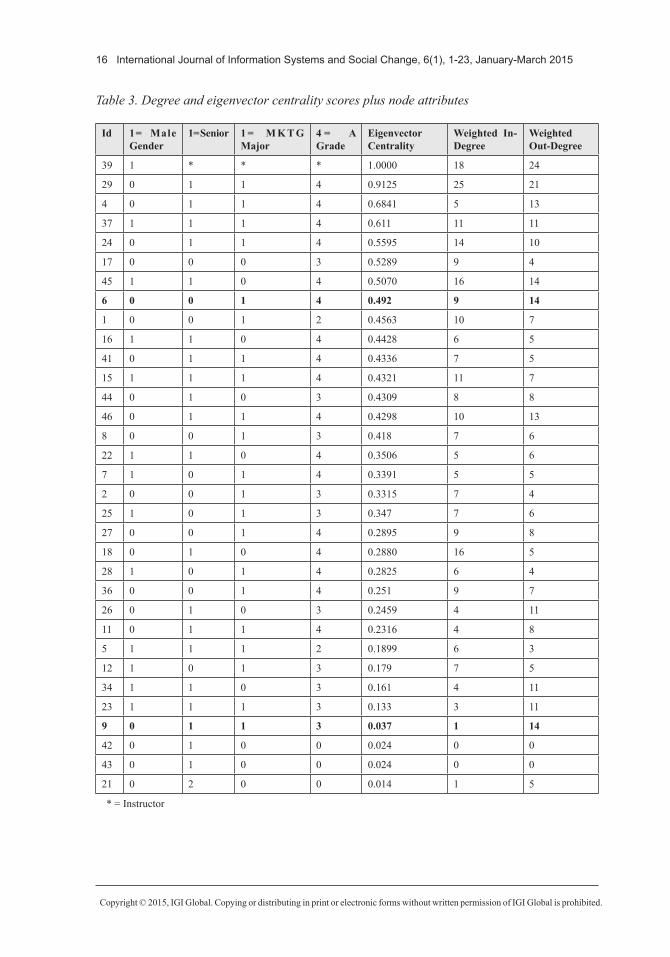
(out degree) or how much attention they are receiving (in degree). Degree centrality merely counts the number of posts made or received by individual community members and do not address of the social context of who is con-nected to whom. For those of us who are used to viewing students primarily as individuals this should be closer to our traditional view of assessment. Table 3 contains two centrality measures (degree and eigenvector) as well as four node attributes (gender, classification, ma-jor, and grade received in the course for which the comment network was created.
Degree centrality shows a comment ‘in action’ and there is an important distinction between two aspects of a comment. In our comment network, out-degree represents com-ments made by individual students. Students who make a lot of comments will have a high out-degree score. The online comment network also allows us to determine to whom the com-ment was addressed. This in-degree behavior offers an important insight since we can infer a number of things about student interactions from the students to whom they choose to direct their comments.
Eigenvector centrality adds an additional layer to the analysis. By mapping the comment network as an interactive system we can also identify the most important and influential actors in the network. “Eigenvector centrality measures importance of a node based on the importance of neighboring nodes” (Sharara et al., 2010, p. 124). This is the metric that forms the basis for the Google’s PageRank Algorithm (Bulte & Wuyts 2007). While degree centrality focuses on popularity, Eigenvector centrality is more concerned with power and influence. Higher eigenvector centrality scores are indica-tive of more powerful, tightly connected sets of concepts. Learning community members may have a high degree centrality score but a low eigenvector centrality score may indicate that community members feel marginalized or powerless.
Combining these scores can lead to some very interesting observations. The role of Node 29 was a surprising revelation as this analysis
Copyright © 2015, IGI Global. Copying or distributing in print or electronic forms without written permission of IGI Global is prohibited.
16 International Journal of Information Systems and Social Change, 6(1), 1-23, January-March 2015
Table 3. Degree and eigenvector centrality scores plus node attributes
Id 1= Male Gender
1= Senior 1 = M K T G Major
4 = A Grade
Eigenvector Centrality
Weighted In-Degree
Weighted Out-Degree
39 1 * * * 1.0000 18 24
29 0 1 1 4 0.9125 25 21
4 0 1 1 4 0.6841 5 13
37 1 1 1 4 0.611 11 11
24 0 1 1 4 0.5595 14 10
17 0 0 0 3 0.5289 9 4
45 1 1 0 4 0.5070 16 14
6 0 0 1 4 0.492 9 14
1 0 0 1 2 0.4563 10 7
16 1 1 0 4 0.4428 6 5
41 0 1 1 4 0.4336 7 5
15 1 1 1 4 0.4321 11 7
44 0 1 0 3 0.4309 8 8
46 0 1 1 4 0.4298 10 13
8 0 0 1 3 0.418 7 6
22 1 1 0 4 0.3506 5 6
7 1 0 1 4 0.3391 5 5
2 0 0 1 3 0.3315 7 4
25 1 0 1 3 0.347 7 6
27 0 0 1 4 0.2895 9 8
18 0 1 0 4 0.2880 16 5
28 1 0 1 4 0.2825 6 4
36 0 0 1 4 0.251 9 7
26 0 1 0 3 0.2459 4 11
11 0 1 1 4 0.2316 4 8
5 1 1 1 2 0.1899 6 3
12 1 0 1 3 0.179 7 5
34 1 1 0 3 0.161 4 11
23 1 1 1 3 0.133 3 11
9 0 1 1 3 0.037 1 14
42 0 1 0 0 0.024 0 0
43 0 1 0 0 0.024 0 0
21 0 2 0 0 0.014 1 5
* = Instructor
Copyright © 2015, IGI Global. Copying or distributing in print or electronic forms without written permission of IGI Global is prohibited.
International Journal of Information Systems and Social Change, 6(1), 1-23, January-March 2015 17
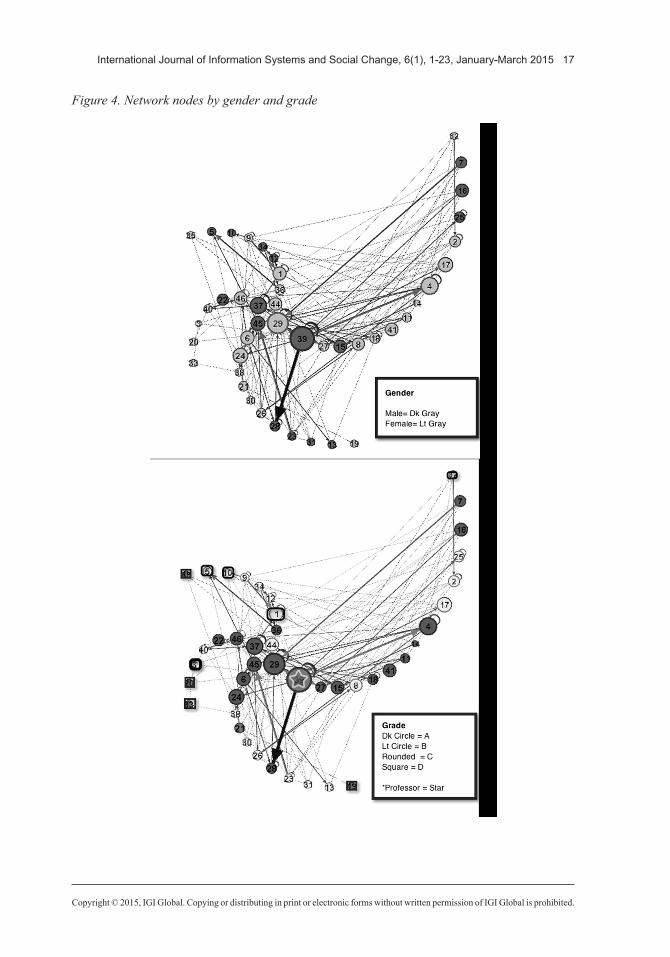
Figure 4. Network nodes by gender and grade

Copyright © 2015, IGI Global. Copying or distributing in print or electronic forms without written permission of IGI Global is prohibited.
18 International Journal of Information Systems and Social Change, 6(1), 1-23, January-March 2015
unfolded. According to the instructor this stu-dent was extremely quiet in class and yet her position in the network revealed that she was well positioned to have a significant impact. It was not merely the number of contributions she made or received that affected her influence score; it was with whom she was connecting to and from. Figure 3 shows her at the intersection of all four modularity classes. In contrast, Node 9 (a female, senior marketing major) had 14 out-degree comments. This is a fairly high number relative to the group. In fact, only four other community members had as high an out-degree score. However, her eigenvector centrality score was .0137 on a 0 to 1 scale compared to the next lowest score of .4792 for Node 6 (a male, junior marketing major). An explanation can be found by looking at the in-degree score for both students. Node 6 had nine, while Node 9 had only one. This reflects the basic premise on which the eigenvector score and the Page Rank algorithm are based. Outbound connections don’t indicate influence unless there are a high number of inbound connections. In other words, it isn’t how many people you connect to that is important, it is who connects to you. You will find her in Figure 3 positioned near the tail of Class 1; one of the weaker modularity classes.
Attribute data for each node was also col-lected for this study. Figure 4 illustrates two more comment network visualizations. In the top graph the nodes have been colored to reflect the relative position of male and female students. The bottom graph uses the same configuration to highlight the different grades students received in the course. The darker round indicate students who received an ‘A’ in the course. We offer no general conclusions based on this sample course. The visualizations are provided more to show some of the possible ways that these visualiza-tions can reveal patterns and potential trends.
DISCUSSION
We began this article with the premise that social learning environments encourage students to communicate and interact at higher frequencies
than what are found strictly in the classroom or our usual Blackboard environment. Rather than just talking to the people who are physi-cally around them, they have the opportunity to give and receive feedback to any student they want, and the range of opportunities they have for contributing and responding to the class content, outside the confines of the classroom, is extensive. By using the resulting Web 2.0 artifacts from these digital interfaces, we can explore all directed comments that are indicative of student engagement with the mate-rial, instructor and each other, as well as their direction and intent. There is a certain amount of risk involved when a student comments on something another student has contributed to the community because there is no anonymity. It is a persistent artifact of the community and provides rich meta-data to help provide us new insights into the interactions taking place in the community.
In a social learning system there is value to each type of comment, and we identified four basic types of comments here. In a more tradi-tional analysis an instructor might give more weight to a comment that had been categorized as a “critique” than one that merely offered “encouragement”. After all, telling someone they did a “good job” does not require much in the way of critical thinking skills. By the same token, an acknowledgement would not be considered as valuable as an explanation or a clarification from the instructor’s perspec-tive. However, while thanking someone for their critique or their encouraging comment is a less substantive response than providing new information that addresses concerns that have been raised, feedback does carry its own level of importance in relationship, and words of encouragement and thanks often served as bridges that led to more in depth conversations.
From the student perspective, we propose that, even at this early stage in the develop-ment of online social learning communities, the student interactions present additional op-portunities to build skills like critical thinking, communication, and collaboratively giving and receiving feedback. As an example, criti-

Copyright © 2015, IGI Global. Copying or distributing in print or electronic forms without written permission of IGI Global is prohibited.
International Journal of Information Systems and Social Change, 6(1), 1-23, January-March 2015 19
cal thinking in a social learning community is expressed through contributing materials, and then receiving and applying feedback about the quality of that material to the subject at hand. Commenting in either the critique and/or ex-planatory categories also shows that the student has thought about what has been contributed, made decisions about the content, accuracy, and completeness, and is now offering writ-ten feedback. In fact, one student said, “I am a lot more careful in what and how I post and respond because I realize that somebody other than the teacher is going to give me feedback”. Therefore, this student is thinking about what to post, working on her written communication skills and is also cognizant of the potential to receive feedback from classmates and/or the instructor from her work. Additionally, by add-ing an on-line discussion component, students who might be quiet in the classroom now have an opportunity to be more expressive, as was noted in the review of the social network pattern for the student depicted as Node 29.
Another way digital social learning con-tributes to skill development is that students are also asked to regularly share their research in the classroom, requiring them to succinctly talk about their topics in front of an audience of their peers, much like in the workplace. Since students have already viewed their cohorts work on-line, the context of the conversations take on new meaning as well since students are able to discuss the topics beyond the explanatory level. These interactions also tap into all three pro-fessional skills discussed in this paper: critical thinking, communication and collaboratively giving and receiving feedback. Finally, much like our success at work is built on our ability to effectively communicate, we find that in social learning communities students who are not extroverted in the classroom can openly communicate their thoughts and feedback with their classmates on a regular basis, elevating their level of participation in the class and top-ics. Additionally, in informal interviews, many students reported that the online interactions led them to become more familiar with their
classmates, even though they had previously shared several classes together.
One limitation to this study is that while we show strong numbers and the study speaks to student engagement in this particular course, for the most part contributions, other than those in the comments network are unidirectional. That is, a student posts a video or a bookmark that they find interesting and relevant, but no one directly acknowledges or responds. Students can typically see how many times someone has ‘viewed’ a video they have posted since views are tabulated and reported but this is a poor substitute for actual feedback. For the upcom-ing semester we are adding opportunities for student feedback that will encourage them to set up a dialogue and enhance their development of giving and receiving constructive feedback on a variety of course projects.
Another topic of debate is the correlation of comments to grades. We believe that our social learning community is helping to hone the soft skills that business school graduates so desperately need, but as instructors we know that learning is not always perfectly correlated to grades. We do feel that seeing how our stu-dents are interacting and using that information to enhance our course designs will continue to yield the learning outcomes we are looking for, and we will continue to track how these enhancements correlate to the grade outcomes.
From an instructor perspective, we believe that the meta-data generated through online social learning communities provides us with an opportunity to gain a deeper understanding of classroom interactions and the learning process. Having identified each comment, not only by who made or received the comment but also by comment type, we can use SNA to help us assess the types and patterns of interactions. This can go far in helping us see how well students understand the content, and what has them most engaged in the learning process. In this study we have done this analysis at two levels; the community level and at the level of the individual student.
An additional challenge to this and future studies is if we are to use meta-data and SNA
Copyright © 2015, IGI Global. Copying or distributing in print or electronic forms without written permission of IGI Global is prohibited.
20 International Journal of Information Systems and Social Change, 6(1), 1-23, January-March 2015
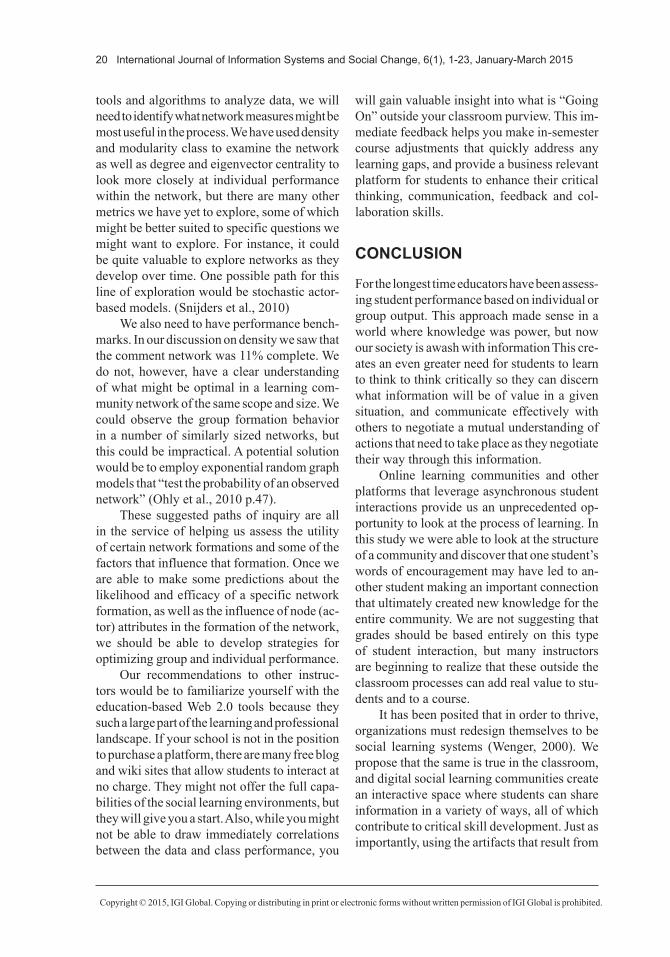
tools and algorithms to analyze data, we will need to identify what network measures might be most useful in the process. We have used density and modularity class to examine the network as well as degree and eigenvector centrality to look more closely at individual performance within the network, but there are many other metrics we have yet to explore, some of which might be better suited to specific questions we might want to explore. For instance, it could be quite valuable to explore networks as they develop over time. One possible path for this line of exploration would be stochastic actor-based models. (Snijders et al., 2010)
We also need to have performance bench-marks. In our discussion on density we saw that the comment network was 11% complete. We do not, however, have a clear understanding of what might be optimal in a learning com-munity network of the same scope and size. We could observe the group formation behavior in a number of similarly sized networks, but this could be impractical. A potential solution would be to employ exponential random graph models that “test the probability of an observed network” (Ohly et al., 2010 p.47).
These suggested paths of inquiry are all in the service of helping us assess the utility of certain network formations and some of the factors that influence that formation. Once we are able to make some predictions about the likelihood and efficacy of a specific network formation, as well as the influence of node (ac-tor) attributes in the formation of the network, we should be able to develop strategies for optimizing group and individual performance.
Our recommendations to other instruc-tors would be to familiarize yourself with the education-based Web 2.0 tools because they such a large part of the learning and professional landscape. If your school is not in the position to purchase a platform, there are many free blog and wiki sites that allow students to interact at no charge. They might not offer the full capa-bilities of the social learning environments, but they will give you a start. Also, while you might not be able to draw immediately correlations between the data and class performance, you
will gain valuable insight into what is “Going On” outside your classroom purview. This im-mediate feedback helps you make in-semester course adjustments that quickly address any learning gaps, and provide a business relevant platform for students to enhance their critical thinking, communication, feedback and col-laboration skills.
CONCLUSION
For the longest time educators have been assess-ing student performance based on individual or group output. This approach made sense in a world where knowledge was power, but now our society is awash with information This cre-ates an even greater need for students to learn to think to think critically so they can discern what information will be of value in a given situation, and communicate effectively with others to negotiate a mutual understanding of actions that need to take place as they negotiate their way through this information.
Online learning communities and other platforms that leverage asynchronous student interactions provide us an unprecedented op-portunity to look at the process of learning. In this study we were able to look at the structure of a community and discover that one student’s words of encouragement may have led to an-other student making an important connection that ultimately created new knowledge for the entire community. We are not suggesting that grades should be based entirely on this type of student interaction, but many instructors are beginning to realize that these outside the classroom processes can add real value to stu-dents and to a course.
It has been posited that in order to thrive, organizations must redesign themselves to be social learning systems (Wenger, 2000). We propose that the same is true in the classroom, and digital social learning communities create an interactive space where students can share information in a variety of ways, all of which contribute to critical skill development. Just as importantly, using the artifacts that result from

Copyright © 2015, IGI Global. Copying or distributing in print or electronic forms without written permission of IGI Global is prohibited.
International Journal of Information Systems and Social Change, 6(1), 1-23, January-March 2015 21
Web 2.0 tools allow the instructor to assess student activity across of variety of individual and collaborative efforts to help enhance course content and student learning in ways we perhaps never thought possible.
REFERENCES
Alagambigai, P., & Thangavel, K. (2010). Visual clustering through weight entropy. International Journal of Data Mining. Modelling and Manage-ment, 2(3), 196–215.
Andrews, R., & Haythornthwaite, C. (Eds.). (2007). The Handbook of E-learning Research. London: Sage.
Association to Advance College Schools of Business. (2012). AACSB business standards 2012 update. Retrieved June 27, 2012 from http://www.aacsb.edu/accreditation/standards-busn-jan2012.pdf
Bandura, A. (1977). Social Learning Theory. Upper Saddle River, NJ: Prentice Hall.
Bastian, M., Heymann, S., & Jacomy, M. (2009). Gephi: An open source software for exploring and manipulating networks. 2009 International AAAI Conference on Weblogs and Social Media.
Berdrow, I., & Evers, F. T. (2011). Bases of com-petence: A framework for facilitating reflective learner-centered educational environments. Jour-nal of Management Education, 3(3), 406–427. doi:10.1177/1052562909358976
Bilimoria, D. (1997). Management educators: In danger of becoming pedestrians on the information superhighway. Journal of Management Education, 21(2), 232–243. doi:10.1177/105256299702100208
Blaylock, B. K., McDaniel, J. L., Falk, C. F., Hol-landsworth, R., & Kopf, J. M. (2009). A borrowed approach for a more effective business education. Journal of Management Education, 33(5), 577–595. doi:10.1177/1052562908327889
Borgatti, S. P., & Foster, P. C. (2003). The Network Paradigm in organizational research: A Review and typology. Journal of Management, 29(6), 991–1013. doi:10.1016/S0149-2063(03)00087-4
Boston Area Advance Technological Education Connections (BATEC). (2007). BATEC information technology workforce skills study. Kent, WA: The Saflund Institute.
Brandes, U., Raab, J., & Wagner, D. (2001). Explor-atory network visualization: Simultaneous display of actor status and connections. Journal of Social Structure, 2(4), 28.
Canzi, A., Folcio, A., Milani, M., & Radice, S. San-tangelo, E., & Zanoni, E. (2003). The management of flows of distance communication between tutors and students in the context of an English course in blended learning held at the Università degli Studi of Milan. Retrieved November 1, 2013, from http://www.ctu. unimi.it/pdf/Edmedialucerna_2003.pdf
Casner-Lotto, J., & Barrington, L. (2006). Are they really ready to work? Employers’ perspectives on the basic knowledge and applied skills of new entrants to the 21st Century U.S. workforce. USA: The Conference Board, Inc., the Partnership for 21st Skills, Corporate Voices for Working Families, and the Society for Human Resource Management.
Dawson, S. (2008). A study of the relationship between student social networks and sense of community. Journal of Educational Technology & Society, 11(3), 224–238.
De Meo, P., Plutino, D., Quattrone, G., & Ursino, D. (2010). A team building and team update system in a projectised organisation scenario. International Journal of Data Mining. Modelling and Manage-ment, 2(1), 22–74.
Demski, J. (2010). 3 FOR 3. T.H.E. Journal, 37(7), 32–37.
Donath, J. (2006). The rhythm of salience: A Conver-sation map. In Abrams, Janet and Hall, Peter (Eds), Else/Where: Mapping Cartographies of Networks and Territories, 320. Minneapolis, Mn: University of Minnesota Design Institute.
Faust, K. (1997). Centrality in affiliation networks. Social Networks, 19(2), 157–191. doi:10.1016/S0378-8733(96)00300-0
Fortunato, S. (2010). Community detection in graphs, physics reports, 486 (3-5), Elsevier B.V., 75-174.
Freeman, L. C. (2000). Visualizing social networks. Journal of Social Structure, 1(1), 4–21.
GoingOn. (2012). About GoingOn. Retrieved June 26, 2012, from http://www.goingon.com
Halfhill, T. R., & Neilsen, T. M. (2007). Quantify-ing the “softer side” of management education: An example using the teamwork competencies. Journal of Management Education, 1(1), 64–80. doi:10.1177/1052562906287777

Copyright © 2015, IGI Global. Copying or distributing in print or electronic forms without written permission of IGI Global is prohibited.
22 International Journal of Information Systems and Social Change, 6(1), 1-23, January-March 2015
Hargadon, S. (2008). Retrieved on July 27, 20012 from http://www.stevehargadon.com/2008/03/web-20-is-future-of-education.html
Haythornthwaite, C. (2001). Exploring multiplexity: Social network structures in a computer-supported distance learning class. The Information Society, 17(3), 211–226. doi:10.1080/01972240152493065
Hess, P. W. (2007). Practice/feedback opportunities in the classroom. Journal of Management Education, 31(2), 195–213. doi:10.1177/1052562906290933
Ivanova, M., & Popova, A. (2011). Formal and in-formal learning flows: Cohesion in Web 2.0 environ-ment. International Journal of Information Systems and Social Change, 2(March), 1–15. doi:10.4018/jissc.2011010101
Jackson, D. (2010). An international profile of industry-relevant competencies and skill gaps in mod-ern graduates. International Journal of Management Education: Oxford Brookes University. 8, 29-58.
Malhotra, R. (2010). Using a meta-modelling knowl-edge management layer – a new approach to designing the enterprise information architecture. International Journal of Data Analysis Techniques and Strategies, 2(4), 307–335. doi:10.1504/IJDATS.2010.037475
McEvoy, G. M. (1998). Answering the challenge: Developing the management action skills of busi-ness students. Journal of Management Education, 22(5), 655–670. doi:10.1177/105256299802200507
Melton, J., Miller, R., & Salmona, M. (2012). Online social networks: Student perceptions and behavior across four countries. International Journal of In-formation Systems and Social Change, 3(2), 24–38. doi:10.4018/IJISSC.2012040102
Monaghan, C. H. (2010). Communities of practice: A learning strategy for management education. Journal of Management Education, 35(3), 428–453. doi:10.1177/1052562910387536
New Media Consortium. (2012). NMC Horizon Report 2012 K-12 Edition. The New Media Con-sortium. http://www.nmc.org/publications/2012-horizon-report-k12
Newman, M. E. J. (2006). Finding community structure in networks using the eigenvectors of matrices. Physical Review E: Statistical, Nonlinear, and Soft Matter Physics, 74(3), 1–22. doi:10.1103/PhysRevE.74.036104 PMID:17025705
Ohly, S., Kase, R., & Škerlavaj, M. (2010). Networks for generating and for validating ideas: The social side of creativity. Innovation Management Policy Practice, 12(1), 41–52. doi:10.5172/impp.12.1.41
Reffay, C., & Chanier, T. (2003). How social network analysis can help to measure cohesion in collaborative distance-learning. Paper presented at the Computer Support for Collaborative Learning Conference, June 14-18, 2003, Bergen, Norway. doi:10.1007/978-94-017-0195-2_42
Sharara, H., Singh, L., Getoor, L., & Mann, J. (2010). Understanding actor loyalty to event-based groups in affiliation networks. Social Network Analysis and Mining; doi:10.1007/s13278-010-0005-5
Shrivastava, P. (1999). Management class-es as online learning communities. Journal of Management Education, 23(6), 691–702. doi:10.1177/105256299902300607
Shum, S. B., & Ferguson, R. (2012). Social Learn-ing Analytics. Journal of Educational Technology & Society, 15(3), 3–26.
Siemens, G. (2005). Connectivism: A learning theory for the digital age. International Journal of Instructional Technology and Distance Learning, 2. Retrieved July 27, 2012 from http://www.itdl.org/Journal/Jan_05/article01.htm
Siemens, G., & Gasevic, D. (2012). Guest Edito-rial - Learning and knowledge analytics. Journal of Educational Technology & Society, 15(3), 1–2.
Snijders, T., Van De Bunt, G. G., & Steglich, C. E. G. (2010). Introduction to stochastic actor-based models for network dynamics. Social Networks, 32(1), 44–60. doi:10.1016/j.socnet.2009.02.004
Sterbini, A., & Temperini, M. (2011). Social X: Reputation based support to social collaborative learning through exercise sharing and project teamwork. International Journal of Information Systems and Social Change, 2(1), 16. doi:10.4018/jissc.2011010105
UmaMaheswari, P & Rajaram, M. (2009). Prin-cipal component analysis-based frequent pattern evaluation on the object-relational data model of a cricket match database. International Journal of Data Analysis Techniques and Strategies, 1(4), 364–384.
Van Den Bulte, C., & Wuyts, S. (2007). Social net-works and marketing (Marketing Science Institute (MSI) Relevant Knowledge Series). Cambridge, Ma: Marketing Science Institute.
Copyright © 2015, IGI Global. Copying or distributing in print or electronic forms without written permission of IGI Global is prohibited.
International Journal of Information Systems and Social Change, 6(1), 1-23, January-March 2015 23
Wasserman, S., & Faust, K. (1994). Social Network Analysis: Methods and Applications (14th ed.). New York: Cambridge University Press. doi:10.1017/CBO9780511815478
Wenger, E. (2000). Communities of practice and social learning systems. Organization, 2(2), 225–247. doi:10.1177/135050840072002
Wenger, E., Trayner, B., & de Laat, M. (2011). Pro-moting and assessing value creation in communities and networks: A Conceptual framework. Heerlen, NL: Ruud de Moor Centrum, Open Universitiet.
Andrew Feldstein is an associate professor of Marketing at Virginia State University. He teaches courses in Brand Management, Retail Management, Marketing Research, and has pioneered a seminar in e-marketing. It was in the e-marketing seminar that Dr. Feldstein began to develop a protocol for collaborative learn-ing communities. His primary research interest is in the impact of Web 2.0 tools on consumer-generated content and group collaboration. He focuses primarily on group dynamics in online communities. His primary method is social network analysis; which he uses to map community structure, track collaborative processes and reveal community-level narrative.
Kim Gower is an Assistant Professor of Management and Marketing at the Reginald F. Lewis College of Business at Virginia State University, and a lecturer at the Robins School of Business at the University of Richmond. Her research interests lie in community-based team learning, leadership, multisource feed-back, entrepreneurship, ethics, and applied business topics. Her Ph.D. is from Virginia Commonwealth University and her M.B.A. is from the University of Michigan-Flint. Gower teaches a variety of business courses including strategy, entrepreneurship, ethics, management issues, organizational behavior, and corporate sustainability. She is also involved with the Academy of Management as an elected member of the Management Education Division and part of the Teaching Theme Committee.