using publicly available information to proxy for ... using publicly available information to proxy...
TRANSCRIPT
Summer 2014
Using publicly available
information to proxy for
unidentified race and
ethnicity
A methodology and assessment

2 USING PUBLICLY AVAILABLE INFORMATION TO PROXY FOR UNIDENTIFIED RACE AND ETHNICITY
Table of contents Table of contents......................................................................................................... 2
1. Executive summary .............................................................................................. 3
2. Introduction ........................................................................................................... 4
3. Using census geography and surname data to construct proxies
for race and ethnicity ........................................................................................... 5
3.1 Data sources .............................................................................................. 7
3.2 Constructing the BISG probability ........................................................... 8
4. Assessing the ability to predict race and ethnicity: an application
to mortgage data ................................................................................................ 12
4.1 Composition of lending by race and ethnicity ....................................... 14
4.2 Predicting race and ethnicity for applicants ...........................................15
5. Conclusion .......................................................................................................... 23
6. Technical Appendix A: Constructing the BISG probability ............................. 24
7. Technical Appendix B: Receiver Operating Characteristics and
Area Under the Curve ......................................................................................... 28
8. Technical Appendix C: Additional tables ......................................................... 33
3 USING PUBLICLY AVAILABLE INFORMATION TO PROXY FOR UNIDENTIFIED RACE AND ETHNICITY
1. Executive summary The Consumer Financial Protection Bureau (CFPB) is charged with ensuring that lenders are
complying with fair lending laws and addressing discrimination across the consumer credit
industry. Information on consumer race and ethnicity is required to conduct fair lending
analysis of non-mortgage credit products, but auto lenders and other non-mortgage lenders are
generally not allowed to collect consumers’ demographic information. As a result, substitute, or
“proxy” information is utilized to fill in information about consumers’ demographic
characteristics. In conducting fair lending analysis of non-mortgage credit products in both
supervisory and enforcement contexts, the Bureau’s Office of Research (OR) and Division of
Supervision, Enforcement, and Fair Lending (SEFL) rely on a Bayesian Improved Surname
Geocoding (BISG) proxy method, which combines geography- and surname-based information
into a single proxy probability for race and ethnicity. This paper explains the construction of the
BISG proxy currently employed by OR and SEFL and provides an assessment of the
performance of the BISG method using a sample of mortgage applicants for whom race and
ethnicity are reported. Research has found that this approach produces proxies that correlate
highly with self-reported race and national origin and is more accurate than relying only on
demographic information associated with a borrower’s last name or place of residence alone.
The Bureau is committed to continuing our dialogue with other federal agencies, lenders,
advocates, and researchers regarding the methodology.
4 USING PUBLICLY AVAILABLE INFORMATION TO PROXY FOR UNIDENTIFIED RACE AND ETHNICITY
2. Introduction The Equal Credit Opportunity Act (ECOA) and Regulation B generally prohibit a creditor from
inquiring “about the race, color, religion, national origin, or sex of an applicant or any other
person in connection with a credit transaction”1 with a few exceptions, including for applications
for home mortgages covered under the Home Mortgage Disclosure Act (HMDA).2 Information
on applicant race and ethnicity, however, is often required to conduct fair lending analysis to
identify potential discriminatory practices in underwriting and pricing outcomes.3
Various techniques exist for addressing this data problem. Demographic information that
reflects applicants’ characteristics—for example, whether or not an individual is White—can be
approximated by constructing a proxy for the information. A proxy may definitively assign a
characteristic to a particular applicant—an individual is classified as being either White or non-
White—or may yield an assignment that is probabilistic—an individual is assigned a probability,
ranging from 0% to 100%, of being White. When characteristics are not reported for an entire
population of individuals, as is usually the case for non-mortgage credit products, techniques
focused on approximating the demographic data generally require relying on additional sources
of data and information to construct proxies.
1 12 C.F.R. § 1002.5(b).
2 12 C.F.R. § 1002.5(a)(2) and 12 C.F.R. § 1002.13. For HMDA and its implementing regulation, Regulation C, see 29
U.S.C § 2801-2810 and 12 C.F.R. Part 1003. For the Regulation B provisions concerning requests for information
generally, see 12 C.F.R. § 1002.5.
3 The ECOA makes it unlawful for “any creditor to discriminate against any applicant, with respect to any aspect of a
credit transaction (1) on the basis of race, color, religion, national origin, sex or marital status, or age (provided the
applicant has the capacity to contract); (2) because all or part of the applicant’s income derives from any public
assistance program; or (3) because the applicant has in good faith exercised any right under the Consumer Credit
Protection Act.” 15 U.S.C. § 1691(a).
5 USING PUBLICLY AVAILABLE INFORMATION TO PROXY FOR UNIDENTIFIED RACE AND ETHNICITY
3. Using census geography and surname data to construct proxies for race and ethnicity
In a variety of settings, including the analysis of administrative health care data and the
evaluation of fair lending risk in non-mortgage loan portfolios, researchers, statisticians, and
financial institutions often rely on publicly available demographic information associated with
an individual’s surname and place of residence from the U.S. Census Bureau to construct
proxies for race and ethnicity when this information is not reported. A proxy for race and
ethnicity may be based on the distribution of race and ethnicity within a particular geographic
area. Similarly, a proxy for race and ethnicity may be based on the distribution of race and
ethnicity across individuals who share the same last name. Traditionally, researchers and
statisticians have relied on information associated with either geography or surnames to develop
proxies.4
A research paper by Elliott et al. (2009) proposes a method to proxy for race and ethnicity that
integrates publicly available demographic information associated with surname and the
geographic areas in which individuals reside and generates a proxy that is more accurate than
those based on surname or geography alone.5 The method involves constructing a probability of
4 For example, in conducting fair lending analysis of indirect auto lending portfolios, the Federal Reserve relies on the
U.S. Census Bureau’s Spanish Surname List to proxy for Hispanic borrowers. Information on the Federal Reserve’s
methodology is available at: http://www.philadelphiafed.org/bank-resources/publications/consumer-compliance-
outlook/outlook-live/2013/indirect-auto-lending.cfm.
5 Marc N. Elliott et al., Using the Census Bureau’s Surname List to Improve Estimates of Race/Ethnicity and
Associated Disparities, HEALTH SERVICES & OUTCOMES RESEARCH METHODOLOGY (2009) 9:69-83.
6 USING PUBLICLY AVAILABLE INFORMATION TO PROXY FOR UNIDENTIFIED RACE AND ETHNICITY
assignment to race and ethnicity based on demographic information associated with surname
and then updating this probability using the demographic characteristics of the census block
group associated with place of residence. The updating is performed through the application of a
Bayesian algorithm, which yields an integrated probability that can be used to proxy for an
individual’s race and ethnicity. Elliott et al. (2009) refer to this method as Bayesian Improved
Surname Geocoding (BISG).
The Office of Research (OR) and the Division of Supervision, Enforcement, and Fair Lending
(SEFL) employ a BISG proxy methodology for race and ethnicity in our fair lending analysis of
non-mortgage credit products that relies on the same public data sources and general methods
used in Elliott et al. (2009).6 The following sections describe these public data sources, explain
the construction of the BISG proxy, identify any differences from the general methods used by
Elliott et al. (2009), and provide an assessment of the performance of the BISG proxy.
Statistical analysis based on proxies for race and ethnicity is only one factor taken into account
by OR and SEFL in our fair lending review of non-mortgage credit products. This paper
describes the methodology currently employed by OR and SEFL but does not set forth a
requirement for the way proxies should be constructed or used by institutions supervised and
regulated by the CFPB.7 Finally, our proxy methodology is not static: it will evolve over time as
enhancements are identified that improve accuracy and performance.
6 We also rely on a proxy for sex based on publicly available data from the Social Security Administration, available at:
http://www.ssa.gov/oact/babynames/limits.html. The focus of this paper, however, is on the BISG methodology
and the construction of the proxies for race and ethnicity.
7 The federal banking regulators have made it clear that proxy methods may be used in fair lending exams to estimate
protected characteristics where direct evidence of the protected characteristic is unavailable. The CFPB adopted the
Interagency Fair Lending Examination Procedures as part of its CFPB Supervision and Examination Manual. See
CFPB Supervision and Examination Manual, Part II, C, ECOA, Interagency Fair Lending Examination Procedures at
19, available at http://files.consumerfinance.gov/f/201210_cfpb_supervision-and-examination-manual-v2.pdf
(explaining that “[a] surrogate for a prohibited basis group characteristic may be used” in a comparative file review
and providing examples of surname proxies for race/ethnicity and first name proxies for sex).
7 USING PUBLICLY AVAILABLE INFORMATION TO PROXY FOR UNIDENTIFIED RACE AND ETHNICITY
3.1 Data sources
3.1.1 Surname
Information used to calculate the probability of belonging to a specific race and ethnicity given
an individual’s surname is based on data derived from Census 2000 that was released by the
U.S. Census Bureau in 2007.8 This release provides each surname held by at least 100
enumerated individuals, along with a breakdown of the percentage of individuals with that
name belonging to one of six race and ethnicity categories: Hispanic; non-Hispanic White; non-
Hispanic Black or African American; non-Hispanic Asian/Pacific Islander; non-Hispanic
American Indian and Alaska Native; and non-Hispanic Multiracial. These categories are
consistent with 1997 Office of Management and Budget (OMB) definitions.9,10 In total, the list
provides 151,671 surnames, covering approximately 90% of the U.S. population. Word et al.
(2008) provides a detailed description of how the census surname list was constructed and
describes the routines used to standardize surnames appearing on the list.11
3.1.2 Geography
Information on the racial and ethnic composition of the U.S. population by geography comes
from the Summary File 1 (SF1) from Census 2010, which provides counts of enumerated
8 The data and documentation are available at: http://www.census.gov/genealogy/www/data/2000surnames/. The
most recent census year for which the surname list exists is 2000. We will rely on more current data when it
becomes available.
9 This classification holds Hispanic as mutually exclusive from the race categories, with individuals identified as
Hispanic belonging only to that category, regardless of racial background. The Census relies on self-identification of
both race and ethnicity when determining race and ethnicity for these individuals, with an exception made for
classification to the “Some Other Race” category. In Census 2000, some individuals identifying as “Some Other
Race” also specified a Hispanic nationality (e.g., Salvadoran, Puerto Rican); in these instances, the Census identified
the respondent as Hispanic. OMB definitions are available at:
http://www.whitehouse.gov/omb/fedreg_1997standards.
10 In the census surname data, the Census Bureau suppressed exact counts for race and ethnicity categories with 2-5
occurrences for a given name. Similarly to Elliott et al. (2009), in these cases we distribute the sum of the
suppressed counts for each surname evenly across all categories with missing nonzero counts.
11 Word, D.L., Coleman, C.D., Nunziata, R., Kominski, R., Demographic aspects of surnames from Census 2000.
Available at: http://www.census.gov/genealogy/www/data/2000surnames/surnames.pdf.

8 USING PUBLICLY AVAILABLE INFORMATION TO PROXY FOR UNIDENTIFIED RACE AND ETHNICITY
individuals by race and ethnicity for various geographic area definitions, with census block
serving as the highest level of disaggregation (the smallest geography).12 In the decennial Census
of the Population, the Census Bureau uses a classification scheme for race and ethnicity that
differs slightly from the scheme used by OMB. Census treats Hispanic as an ethnicity and the
other OMB categories as racial identities. However, Census does report population counts by
race and ethnicity in a way that allows for the creation of race and ethnicity population totals
that are consistent with the OMB definition.13 Our method relies on race and ethnicity
information for the adult (age 18 and over) population at the census block group, census tract,
and 5-digit zip code levels, as discussed in the next section.14,15
3.2 Constructing the BISG probability Constructing the BISG proxy for race and ethnicity for a given set of applicants requires place of
residence (address) and name information for those applicants, the census surname list, and
census demographic information by census block group, census tract, and 5-digit zip code. The
process occurs in a number of steps:
1. Applicants’ surnames are standardized and edited, including removing special characters
and titles, such as JR and SR, and parsing compound names.
12 The hierarchy of census geographic entities, from smallest to largest, is: block, block group, tract, county, state,
division, region, and nation. Block group level information appears in Table P9 (“Hispanic or Latino, and Not
Hispanic or Latino by Race”) in the SF1. Table P11 in the SF1 provides similar counts for the restricted population of
individuals 18 and over. The public can access these data in a variety of ways, including through the American
FactFinder portal at: http://factfinder2.census.gov/faces/nav/jsf/pages/index.xhtml.
13 In the 2010 SF1, Census produced tabulations that report counts of Hispanics and non-Hispanics by race. These
tabulations include a “Some Other Race” category. As in Elliott et al. (2009), we reallocate the “Some Other Race”
counts to each of the remaining six race and ethnicity categories using an Iterative Proportional Fitting procedure to
make geography based demographic categories consistent with those on the census surname list.
14 Throughout this paper, we use 5-digit zip code, when referring to zip code demographics, as a synonym for ZIP
Code Tabulation Areas (ZCTAs) as defined by the U.S. Census Bureau. More information on the construction of
ZCTAs is available at: https://www.census.gov/geo/reference/zctas.html.
15 From the SF1, we retain population counts for the contiguous U.S., Alaska, and Hawaii in order to ensure
consistency with the population covered by the census surname list.
9 USING PUBLICLY AVAILABLE INFORMATION TO PROXY FOR UNIDENTIFIED RACE AND ETHNICITY
2. Standardized surnames are matched to the census surname list. For applicants with
compound surnames, if the first word of the compound surname successfully matches to
the surname data, it is used to calculate the surname based probability. If the first word
does not match, the second word is then tried. For example, if an applicant’s last name is
Smith-Jones, the demographic information associated with Smith is used if Smith
appears on the name list. If Smith does not appear on the name list, then the information
associated with Jones is used if Jones is on the list.
3. For each name that matches the census surname list, the probability of belonging to a
given racial or ethnic group (for each of the six race and ethnicity categories) is
constructed. The probability is simply the proportion (or percentage) of individuals who
identify as being a member of a given race or ethnicity for a given surname. For example,
according to the census surname list, 73% of individuals with the surname Smith report
being non-Hispanic White; thus, for any individual with the last name Smith, the
surname-based probability of being non-Hispanic White is 73%. For applications with
names that do not match the census surname list, a probability is not constructed. These
records are excluded in subsequent analysis.16 Given that approximately 10% of the U.S.
population is not included on the census surname list, one would reasonably expect
roughly a 10% reduction in the number of records in a proxied dataset due to non-
matches to the census surname list.
4. Applicant address information is standardized in preparation for geocoding.
Standardization includes basic checks such as removing non-numeric characters from
zip codes, making sure zip codes with leading zeroes are accurately identified, and
ensuring address information is in the correct format, for example, that house number,
street, city, state, and zip code are appropriately parsed into separate fields.
5. Addresses are mapped into census geographic areas using a geocoding and mapping
software application.17 The geocoding application used by OR and SEFL in building the
16 Elliott et al. (2009) retain records in their assessment data that do not appear on the surname list. To do so, they
use the distribution of race and ethnicity appearing on the name list and the national population counts in the
Census 2000 SF1 to characterize the unlisted population. OR and SEFL continue to evaluate the approach
undertaken by Elliott et al. (2009) and may adopt a method for proxying the unlisted surname population in future
updates to the proxy methodology.
17 We currently use ArcGIS Version 10.1 with Street Map Premium 2011 Release 3 to geocode data when building the
proxy. We may rely on updated releases as they become available or may move to different geocoding technology in
the future. The BISG proxy methodology does not require the use of a specific geocoding technology.

10 USING PUBLICLY AVAILABLE INFORMATION TO PROXY FOR UNIDENTIFIED RACE AND ETHNICITY
proxy identifies the geographic precision to which an address is geocoded, and the
precision of geocoding determines the precision of the demographic information relied
upon.18 For addresses that are geocoded to the latitude and longitude of an exact street
address (often referred to as a “rooftop”), information on race and ethnicity for the adult
population residing in the census block group containing the street address is used; if the
census block group has zero population, information for the census tract is used. For
addresses that are geocoded to street name, 9-digit zip code, and 5-digit zip code, the
race and ethnicity information for the adult population residing in the 5-digit zip code is
used. Addresses that cannot be geocoded or that can be geocoded only to a geographical
area that is less precise than 5-digit zip code (for example, city or state) are excluded in
subsequent analysis.
6. For geocoded addresses, the proportion (or percentage) of the U.S. adult population for
each race and ethnicity residing in the geographic area containing the address or
associated with the 5-digit zip code is calculated.
7. Bayes Theorem is used to update the surname-based probabilities constructed in Step 3
with the information on the concentration of the U.S. adult population constructed in
Step 6 to create a probability—a value between, or equal to, 0 and 1—of assignment to
each of the 6 race and ethnicity categories. These proxy probabilities can be used in
statistical analysis aimed at identifying potential differences in lending outcomes.
Appendix A provides the mathematical formula associated with Step 7 and an example of the
construction of the BISG proxy probabilities for an individual with the last name Smith residing
in California. The statistical software code, written in Stata, and the publicly available census
data files used to build the BISG proxy are available at: https://github.com/cfpb/proxy-
methodology. Because OR and SEFL currently use ArcGIS to geocode address information when
building the proxy, the geocoding of address information must occur before running the Stata
code that builds the BISG proxy. The use of alternative geocoding applications may return
slightly different geocoding results and, therefore, may yield different BISG probabilities than
those generated using ArcGIS.
Steps 1 through 7 describe the general process currently undertaken by OR and SEFL to
construct proxies for race and ethnicity for fair lending analysis. Unique features of a dataset
18 The precision of the geocoding is driven by the availability of address information and the geocoding software
application’s assessment of the quality of address information provided.

11 USING PUBLICLY AVAILABLE INFORMATION TO PROXY FOR UNIDENTIFIED RACE AND ETHNICITY
under review, for example, the quality of surname data and the ability to match individuals to
the census surname list, or the quality of address information and the ability to geocode to an
acceptable level of precision, may lead to a modification of the general methodology, as
appropriate.
12 USING PUBLICLY AVAILABLE INFORMATION TO PROXY FOR UNIDENTIFIED RACE AND ETHNICITY
4. Assessing the ability to predict race and ethnicity: an application to mortgage data
Elliott et al. (2009) demonstrate, using health plan enrollment data with reported race and
ethnicity, that the BISG proxy methodology is more accurate than either the traditional
surname-only or geography-only methodologies. In this section, we discuss a similar validation
of the BISG proxy in the mortgage lending context.
To assess the performance of the BISG proxy in this context, the geography-only, surname-only,
and BISG proxies for race and ethnicity were constructed for applicants appearing in a sample of
mortgage loan applications in 2011 and 2012 for which address, name, and race and ethnicity
were reported.19,20 These data were provided to the CFPB by a number of lenders pursuant to the
CFPB’s supervisory authority. Applications with surnames that did not match the surname list
19 The geography-only probability proxy is constructed in a manner that is similar to the construction of the surname-
only proxy. For each geocoded address, the probability of belonging to a given racial or ethnic group (for each of the
six race and ethnicity categories) is constructed. The probability is simply the proportion (or percentage) of
individuals who identify as being a member of a given race or ethnicity who reside in the block group, census tract,
or area corresponding to the 5-digit zip code, depending on the precision to which an applicant’s address is
geocoded.
20 The reported race and ethnicity used in the assessment are derived from the HMDA reported race and ethnicity
contained in the mortgage data sample. Ethnicity (Hispanic) and race—American Indian/Alaska Native, Asian,
Black or African American, Native Hawaiian or Other Pacific Islander, and White—are reported at the applicant
level. For a given applicant, up to five races may be reported. The reported HMDA race and ethnicity are used to
classify applicants in a manner consistent with the six mutually exclusive race and ethnicity categories defined by
the Office of Management and Budget and used on the census surname list. Applications for which race or ethnicity
information was not provided were omitted from the initial sample.
13 USING PUBLICLY AVAILABLE INFORMATION TO PROXY FOR UNIDENTIFIED RACE AND ETHNICITY
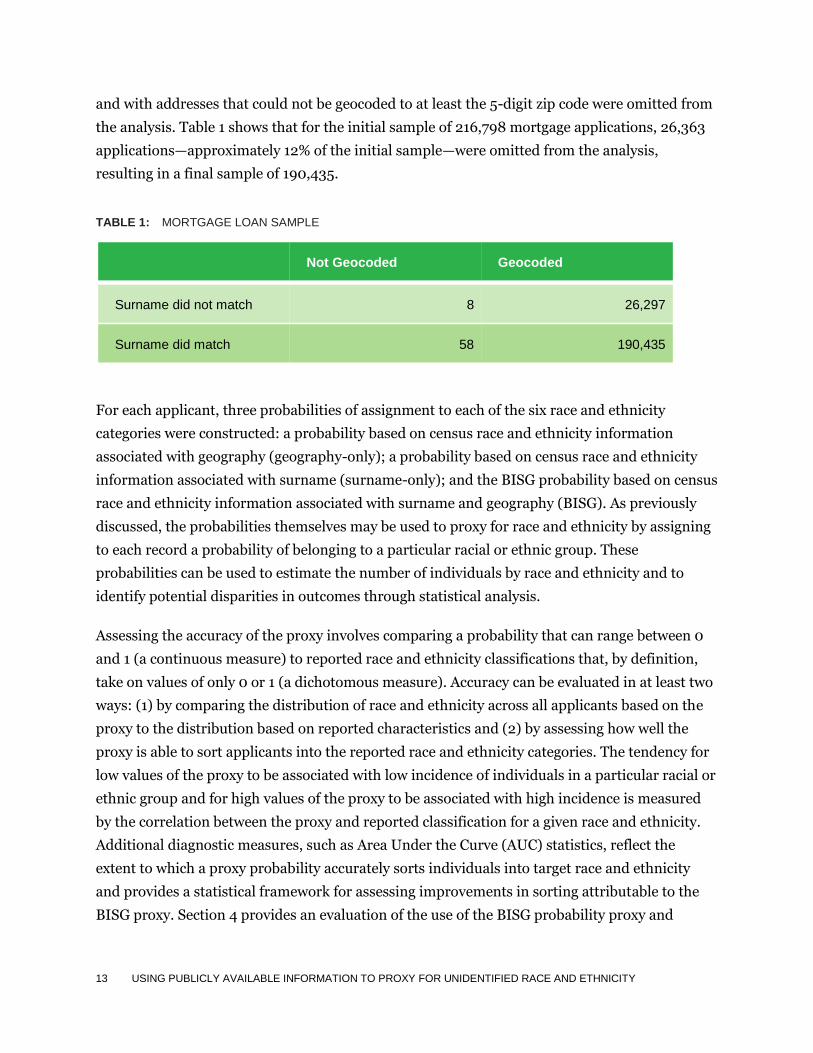
and with addresses that could not be geocoded to at least the 5-digit zip code were omitted from
the analysis. Table 1 shows that for the initial sample of 216,798 mortgage applications, 26,363
applications—approximately 12% of the initial sample—were omitted from the analysis,
resulting in a final sample of 190,435.
TABLE 1: MORTGAGE LOAN SAMPLE
Not Geocoded Geocoded
Surname did not match 8 26,297
Surname did match 58 190,435
For each applicant, three probabilities of assignment to each of the six race and ethnicity
categories were constructed: a probability based on census race and ethnicity information
associated with geography (geography-only); a probability based on census race and ethnicity
information associated with surname (surname-only); and the BISG probability based on census
race and ethnicity information associated with surname and geography (BISG). As previously
discussed, the probabilities themselves may be used to proxy for race and ethnicity by assigning
to each record a probability of belonging to a particular racial or ethnic group. These
probabilities can be used to estimate the number of individuals by race and ethnicity and to
identify potential disparities in outcomes through statistical analysis.
Assessing the accuracy of the proxy involves comparing a probability that can range between 0
and 1 (a continuous measure) to reported race and ethnicity classifications that, by definition,
take on values of only 0 or 1 (a dichotomous measure). Accuracy can be evaluated in at least two
ways: (1) by comparing the distribution of race and ethnicity across all applicants based on the
proxy to the distribution based on reported characteristics and (2) by assessing how well the
proxy is able to sort applicants into the reported race and ethnicity categories. The tendency for
low values of the proxy to be associated with low incidence of individuals in a particular racial or
ethnic group and for high values of the proxy to be associated with high incidence is measured
by the correlation between the proxy and reported classification for a given race and ethnicity.
Additional diagnostic measures, such as Area Under the Curve (AUC) statistics, reflect the
extent to which a proxy probability accurately sorts individuals into target race and ethnicity
and provides a statistical framework for assessing improvements in sorting attributable to the
BISG proxy. Section 4 provides an evaluation of the use of the BISG probability proxy and
14 USING PUBLICLY AVAILABLE INFORMATION TO PROXY FOR UNIDENTIFIED RACE AND ETHNICITY
assesses performance relative to reported race and ethnicity, illustrating the merits of relying on
the BISG probability proxy rather than on a proxy based solely on information associated with
geography or surname alone.
4.1 Composition of lending by race and ethnicity
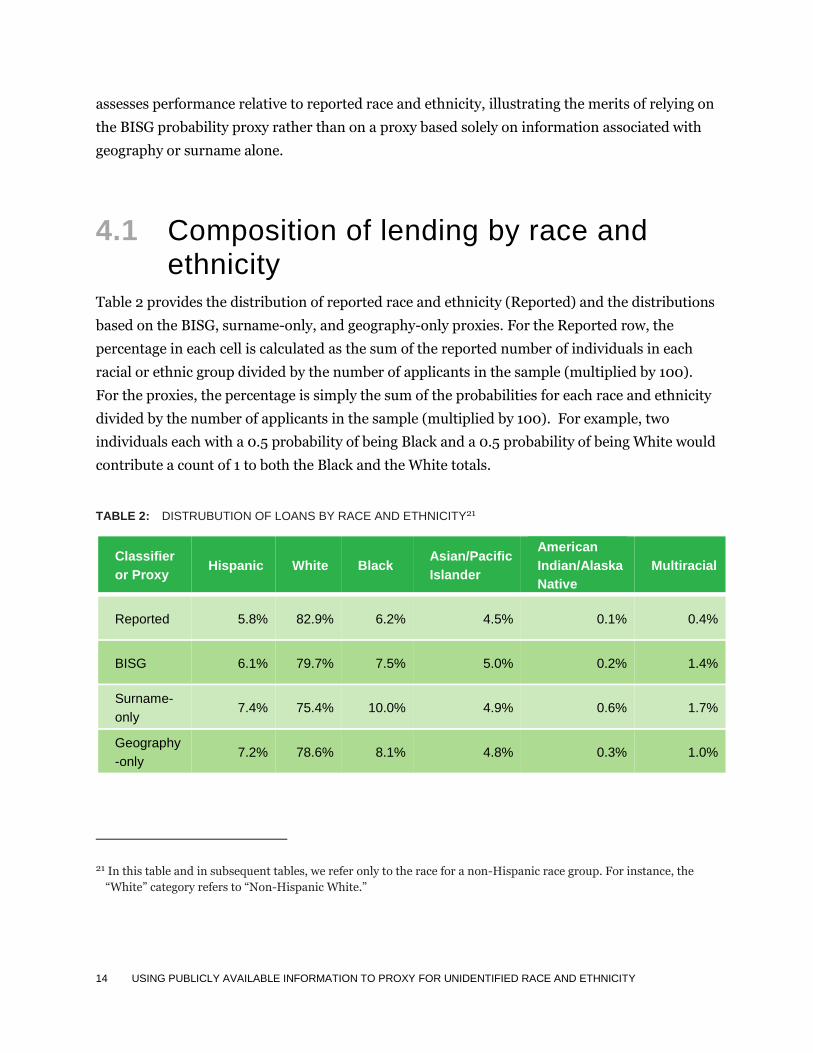
Table 2 provides the distribution of reported race and ethnicity (Reported) and the distributions
based on the BISG, surname-only, and geography-only proxies. For the Reported row, the
percentage in each cell is calculated as the sum of the reported number of individuals in each
racial or ethnic group divided by the number of applicants in the sample (multiplied by 100).
For the proxies, the percentage is simply the sum of the probabilities for each race and ethnicity
divided by the number of applicants in the sample (multiplied by 100). For example, two
individuals each with a 0.5 probability of being Black and a 0.5 probability of being White would
contribute a count of 1 to both the Black and the White totals.
TABLE 2: DISTRUBUTION OF LOANS BY RACE AND ETHNICITY21
Classifier
or Proxy Hispanic White Black
Asian/Pacific
Islander
American
Indian/Alaska
Native
Multiracial
Reported 5.8% 82.9% 6.2% 4.5% 0.1% 0.4%
BISG 6.1% 79.7% 7.5% 5.0% 0.2% 1.4%
Surname-
only 7.4% 75.4% 10.0% 4.9% 0.6% 1.7%
Geography
-only 7.2% 78.6% 8.1% 4.8% 0.3% 1.0%
21 In this table and in subsequent tables, we refer only to the race for a non-Hispanic race group. For instance, the
“White” category refers to “Non-Hispanic White.”
15 USING PUBLICLY AVAILABLE INFORMATION TO PROXY FOR UNIDENTIFIED RACE AND ETHNICITY
As the table indicates, all three proxies tend to approximate the reported population race and
ethnicity. However, each also tends to underestimate the population of non-Hispanic Whites
and overestimate the other race and ethnicity categories, which may reflect differences between
the racial and ethnic composition of the census based populations used to construct the proxies
and the racial and ethnic composition of individuals applying for mortgages.
Importantly, however, the BISG proxy comes closer to approximating the reported race and
ethnicity than the traditional proxy methodologies, with the only exception being for
Asian/Pacific Islanders and Multiracial. Though we see small absolute gains in accuracy from
use of a BISG proxy for some groups relative to the traditional methods of proxying, these gains
frequently represent a sizeable improvement in terms of relative performance. For example, the
gap between reported race and estimated race for non-Hispanic Whites shrinks by 1.1% (from
82.9% – 78.6% = 4.3% to 82.9% – 79.7% = 3.2%) when moving from a geography-only to the
BISG proxy. Given the initial gap of 4.3% this represents an almost 25% reduction in the
difference between estimated and reported race. The gaps for non-Hispanic Black, non-Hispanic
American Indian/Alaska Native, and Hispanic shrink in a similar manner. For non-Hispanic
Asian/Pacific Islander, the gap between estimated and reported totals increases by 0.2% in
absolute terms compared to the geography-only alternative and by 0.1% compared to the
surname-only alternative. For the non-Hispanic Multiracial category, the BISG proxy does
slightly better than the surname-only and slightly worse than the geography-only proxy in
approximating the reported percentage.
4.2 Predicting race and ethnicity for applicants
4.2.1 Correlations between the proxy and reported race and ethnicity
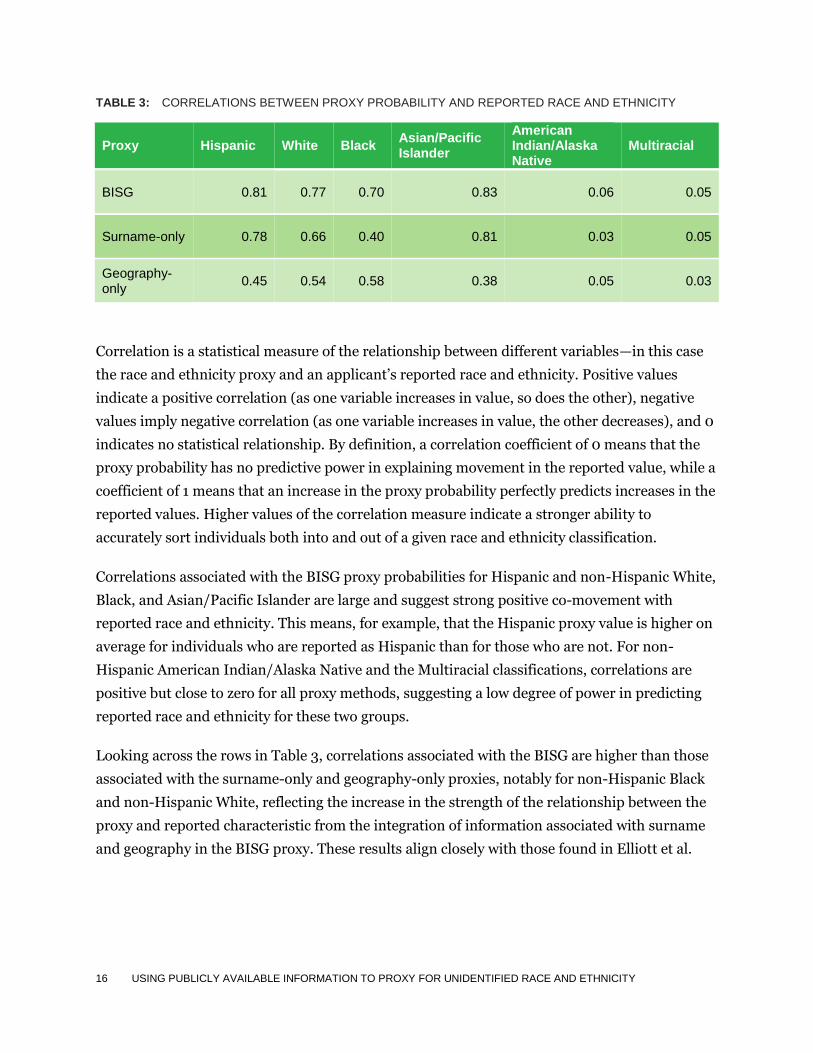
Table 3 provides the correlations between reported race and ethnicity and the BISG, surname-
only, and geography-only proxies.
16 USING PUBLICLY AVAILABLE INFORMATION TO PROXY FOR UNIDENTIFIED RACE AND ETHNICITY
TABLE 3: CORRELATIONS BETWEEN PROXY PROBABILITY AND REPORTED RACE AND ETHNICITY
Proxy Hispanic White Black Asian/Pacific Islander
American Indian/Alaska Native
Multiracial
BISG 0.81 0.77 0.70 0.83 0.06 0.05
Surname-only 0.78 0.66 0.40 0.81 0.03 0.05
Geography-only
0.45 0.54 0.58 0.38 0.05 0.03
Correlation is a statistical measure of the relationship between different variables—in this case
the race and ethnicity proxy and an applicant’s reported race and ethnicity. Positive values
indicate a positive correlation (as one variable increases in value, so does the other), negative
values imply negative correlation (as one variable increases in value, the other decreases), and 0
indicates no statistical relationship. By definition, a correlation coefficient of 0 means that the
proxy probability has no predictive power in explaining movement in the reported value, while a
coefficient of 1 means that an increase in the proxy probability perfectly predicts increases in the
reported values. Higher values of the correlation measure indicate a stronger ability to
accurately sort individuals both into and out of a given race and ethnicity classification.
Correlations associated with the BISG proxy probabilities for Hispanic and non-Hispanic White,
Black, and Asian/Pacific Islander are large and suggest strong positive co-movement with
reported race and ethnicity. This means, for example, that the Hispanic proxy value is higher on
average for individuals who are reported as Hispanic than for those who are not. For non-
Hispanic American Indian/Alaska Native and the Multiracial classifications, correlations are
positive but close to zero for all proxy methods, suggesting a low degree of power in predicting
reported race and ethnicity for these two groups.
Looking across the rows in Table 3, correlations associated with the BISG are higher than those
associated with the surname-only and geography-only proxies, notably for non-Hispanic Black
and non-Hispanic White, reflecting the increase in the strength of the relationship between the
proxy and reported characteristic from the integration of information associated with surname
and geography in the BISG proxy. These results align closely with those found in Elliott et al.
17 USING PUBLICLY AVAILABLE INFORMATION TO PROXY FOR UNIDENTIFIED RACE AND ETHNICITY
(2009), which, as previously noted, assessed the BISG proxy using national health plan
enrollment data.22
4.2.2 Area Under the Curve (AUC)
While correlations illustrate the overall extent of co-movement between the proxies and
reported race and ethnicity, it is also important to assess the extent to which the proxy
probabilities successfully sort individuals into each race and ethnicity.
A statistic that can be used to calculate this is called the Area Under the Curve (AUC), which
represents the likelihood that the proxy will accurately sort individuals into a particular racial or
ethnic group.23 For example, if one randomly selects an individual who is reported as Hispanic
and a second individual who is reported as non-Hispanic, the AUC represents the likelihood that
the randomly selected individual reported as Hispanic has a higher proxy value of being
Hispanic than the randomly selected individual reported as non-Hispanic. The AUC can be used
to test the hypothesis that one proxy is more accurate than another at sorting individuals in
order of likelihood of belonging to a given race and ethnicity. An AUC value of 1 (or 100%)
reflects perfect sorting and classification, and a value of 0.5 (or 50%) suggests that the proxy is
only as good as a random guess (e.g., a coin toss).
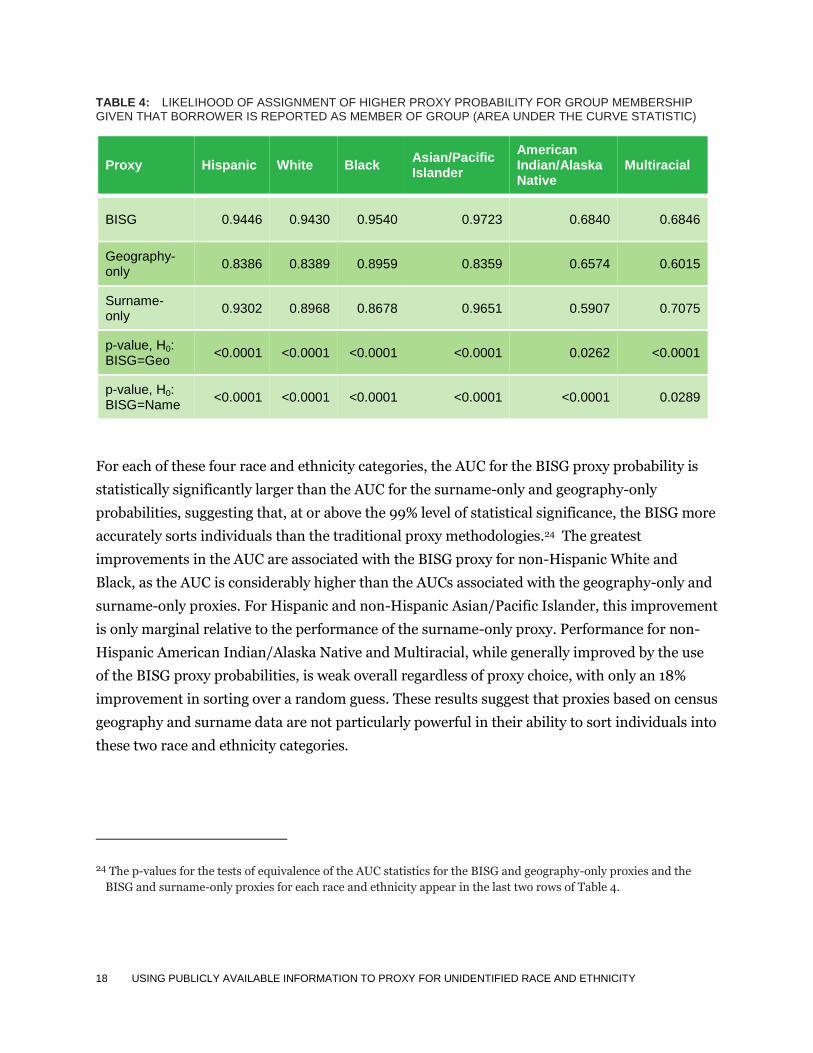
Table 4 provides the results of statistical comparisons of the geography-only, surname-only, and
BISG probabilities. The AUC statistics associated with the BISG proxy for Hispanic and non-
Hispanic White, Black, and Asian/Pacific Islander are large and exceed 90%. For instance, the
AUC statistic associated with the BISG proxy for non-Hispanic Black is 0.9540, suggesting that
95% of the time, a randomly chosen individual reported as Black will have a higher BISG
probability of being Black than a randomly chosen individual reported as non-Black.
22 Table 4 of Elliott et al. (2009): Non-Hispanic White (0.76); Hispanic (0.82); Black (0.70); Asian/Pacific Islander
(0.77); American Indian/Alaska Native (0.11); and Multiracial (0.02).
23 The AUC is based on the Receiver Operating Characteristic (ROC) curve, which plots the tradeoff between the true
positive rate and the false positive rate for a given proxy probability over the entire range of possible threshold
values that could be used to classify individuals with certainty to the race and ethnicity being proxied. See Appendix
B for more detail on the construction of the ROC curves and calculation of the AUC.
18 USING PUBLICLY AVAILABLE INFORMATION TO PROXY FOR UNIDENTIFIED RACE AND ETHNICITY
TABLE 4: LIKELIHOOD OF ASSIGNMENT OF HIGHER PROXY PROBABILITY FOR GROUP MEMBERSHIP GIVEN THAT BORROWER IS REPORTED AS MEMBER OF GROUP (AREA UNDER THE CURVE STATISTIC)
Proxy Hispanic White Black Asian/Pacific Islander
American Indian/Alaska Native
Multiracial
BISG 0.9446 0.9430 0.9540 0.9723 0.6840 0.6846
Geography-only
0.8386 0.8389 0.8959 0.8359 0.6574 0.6015
Surname-only
0.9302 0.8968 0.8678 0.9651 0.5907 0.7075
p-value, H0: BISG=Geo
<0.0001 <0.0001 <0.0001 <0.0001 0.0262 <0.0001
p-value, H0: BISG=Name
<0.0001 <0.0001 <0.0001 <0.0001 <0.0001 0.0289
For each of these four race and ethnicity categories, the AUC for the BISG proxy probability is
statistically significantly larger than the AUC for the surname-only and geography-only
probabilities, suggesting that, at or above the 99% level of statistical significance, the BISG more
accurately sorts individuals than the traditional proxy methodologies.24 The greatest
improvements in the AUC are associated with the BISG proxy for non-Hispanic White and
Black, as the AUC is considerably higher than the AUCs associated with the geography-only and
surname-only proxies. For Hispanic and non-Hispanic Asian/Pacific Islander, this improvement
is only marginal relative to the performance of the surname-only proxy. Performance for non-
Hispanic American Indian/Alaska Native and Multiracial, while generally improved by the use
of the BISG proxy probabilities, is weak overall regardless of proxy choice, with only an 18%
improvement in sorting over a random guess. These results suggest that proxies based on census
geography and surname data are not particularly powerful in their ability to sort individuals into
these two race and ethnicity categories.
24 The p-values for the tests of equivalence of the AUC statistics for the BISG and geography-only proxies and the
BISG and surname-only proxies for each race and ethnicity appear in the last two rows of Table 4.

19 USING PUBLICLY AVAILABLE INFORMATION TO PROXY FOR UNIDENTIFIED RACE AND ETHNICITY
4.2.3 Classification over the range of proxy values
The BISG proxy’s ability to sort individuals is made clear through an evaluation of the number of
applicants falling within ranges of proxy probability values. For example, for 10% bands of the
BISG proxy probability for Hispanics, Table 5 provides: the number of total applicants (column
1); the estimated number of Hispanic applicants based on the summation of the BISG
probability (column 2); the number of reported Hispanic applicants (column 3); the number of
reported non-Hispanic White applicants (column 4); and the number of reported other
minority, non-Hispanic applicants (column 5). A few results are worth noting.
TABLE 5: CLASSIFICATION OVER RANGE OF BISG PROXY FOR HISPANIC
Hispanic BISG Proxy Probability Range
Total Applicants (1)
Estimated Hispanic (BISG) (2)
Reported Hispanic (3)
Reported White (4)
Reported Other Minority (5)
0% - 10% 176,116 1,129 1,677 153,974 20,465
10% - 20% 1,720 240 163 1,207 350
20% - 30% 653 163 130 414 109
30% - 40% 541 189 147 312 82
40% - 50% 557 251 226 261 70
50% - 60% 597 328 279 258 60
60% - 70% 802 522 455 263 84
70% - 80% 1,135 853 766 286 83
80% - 90% 1,788 1,529 1,347 347 94
90% - 100% 6,526 6,312 5,883 534 109
Total 190,435 11,516 11,073 157,856 21,506
*Estimated Hispanic (BISG) is calculated as the sum of the BISG probabilities for being Hispanic within the corresponding proxy
probability range.
20 USING PUBLICLY AVAILABLE INFORMATION TO PROXY FOR UNIDENTIFIED RACE AND ETHNICITY
First, the distribution of the BISG proxy probability is bimodal with concentrations of total
applicants for low (e.g., 0%-20%) and high (e.g., 80%-100%) values of the proxy, which
illustrates the sorting feature of the proxy. Reported Hispanic applicants are concentrated
within high values of the proxy. For example, 65% ((1,347+5,883)/11,073) of reported Hispanic
applicants (column 3) have BISG proxy probabilities greater than 80%; this concentration is
mirrored by the estimated number of Hispanic applicants (column 2), 68% of whom have BISG
proxy probabilities greater than 80% ((1,529+6,312)/11,516). While the BISG proxy may assign
high values to some non-Hispanic applicants, 98% ((153,974+1,207)/157,856) of the reported
non-Hispanic White and 97% ((20,465+350)/21,506) of the reported other non-Hispanic
minority borrowers have Hispanic BISG proxy probabilities that are less than 20%.
Second, there are reported Hispanic applicants over the full range of values of the BISG proxy;
this is also reflected by the estimated counts in column 2. For example, there are 597 applicants
with BISG proxy values between 50% and 60%, of whom 279 are reported as being Hispanic,
while the BISG proxy estimate of the number of Hispanic applicants in this range—calculated by
summing probabilities for individuals within this probability range—is 328.
As suggested by Table 5 the BISG proxy tends to overestimate the number of Hispanic
applicants for the mortgage pool under review. In the final row of column (3) we see that the
total number of reported Hispanic applicants is 11,073. The estimated total number of Hispanic
applicants—calculated as the sum of the BISG probabilities for Hispanic applicants—is 11,516
(column 2), which overestimates the number of Hispanic applicants by 4%. This overestimation
may reflect, as discussed in Section 4.1, the use of demographic information based on the
population at large to proxy the characteristics of mortgage applicants. According to the 2010
Census of Population, 14% of the U.S. adult population was Hispanic; 67% non-Hispanic White;
12% non-Hispanic Black; 5% Asian/Pacific Islander; and 1% American Indian/Alaska Native.
According to the 2010 HMDA loan application data for all reporting mortgage originators, only
7% of applicants for home mortgages were Hispanic; 80% non-Hispanic White; 6% non-
Hispanic Black; 6% Asian/Pacific Islander; and less than 1% American Indian/Alaska Native.25
Mortgage borrowers tend to be disproportionately non-Hispanic White and, in particular,
underrepresent Hispanic and non-Hispanic Blacks relative to the population of the U.S.
25 The HMDA distributions for race and ethnicity are based only on applicant information for which race and
ethnicity is reported and for applications that were originated, approved but not accepted, and denied by lenders.
21 USING PUBLICLY AVAILABLE INFORMATION TO PROXY FOR UNIDENTIFIED RACE AND ETHNICITY
OR and SEFL rely directly on the BISG probability in our fair lending related statistical analyses.
In contrast, some practitioners rely on the use of a probability proxy and a threshold rule to
classify individuals into race and ethnicity. When a threshold rule is used, individuals with
proxy probabilities equal to and greater than a specific value, for example 80%, are considered
to belong to a group with certainty, while all others are considered non-members with certainty.
Consider two individuals who are assigned BISG probabilities of being non-Hispanic Black:
individual A with 82% and individual B with 53%. The application of an 80% threshold rule for
assignment would force individual A’s probability to 100% and classify that individual as being
Black and force individual B’s probability to 0% and classify that individual as being non-Black.
The threshold rule removes the uncertainty about group membership at the cost of decreased
statistical precision, with that precision deteriorating with decreases in the proxy’s ability to
create separation across races and ethnicity. In situations in which researchers can obtain clear
separation between groups—for instance, situations for which the probabilities of assignment
tend to be very close to 0 or 1—the consequences of using a threshold assignment rule, beyond
simple measurement error, would be minor. However, when insufficient separation exists—for
example, when there are a significant number of individuals with probabilities between 20% and
80% of belonging to a particular group—the use of thresholds can artificially bias, usually
downward, estimates of the number of individuals belonging to particular racial and ethnic
groups and potentially attenuate estimates of differences in outcomes between groups.
Table 5 makes clear the consequence of applying a threshold rule to the BISG proxy probability
to force classification with certainty. If an 80% threshold rule is applied, the estimated number
of Hispanic applicants is 8,314—the sum of all applicants in column (1) with a BISG probability
equal to or greater than 80%—which underestimates the reported number of 11,073 Hispanic
applicants by 25%. The underestimation is driven by the failure to count the large number of
individuals in column (3) who are reported as being Hispanic in the mortgage sample but for
whom the BISG probability of assignment is less than 80%.
It is worth noting that the application of an 80% threshold rule to classify individuals also yields
false positives: individuals who are reported as being non-Hispanic but, nonetheless, are
assigned BISG proxy probabilities of being Hispanic equal to or greater than 80%. For the
mortgage pool under review, 881 applicants who are reported as being non-Hispanic White and
203 applicants who are reported as being some other minority would be classified as Hispanic
by an 80% threshold rule. The false positive rate associated with these 1,084 observations is
0.6%, measured as the number of false positives (1,084) as a percentage of the total number of
false positives plus the 178,278 true negative reported non-Hispanics with BISG probabilities

22 USING PUBLICLY AVAILABLE INFORMATION TO PROXY FOR UNIDENTIFIED RACE AND ETHNICITY
less than 80%. The false discovery rate for these same 1,084 observations is 13%, measured as
the number of false positives (1,084) as a percentage of 8,314 applicants identified as Hispanic
by the 80% threshold rule.
Classification and misclassification tables for the other five race and ethnicity categories appear
in Appendix C.
23 USING PUBLICLY AVAILABLE INFORMATION TO PROXY FOR UNIDENTIFIED RACE AND ETHNICITY
5. Conclusion Information on consumer race and ethnicity is generally not collected for non-mortgage credit
products. However, information on consumer race and ethnicity is required to conduct fair
lending analysis. Publicly available data characterizing the distribution of the population across
race and ethnicity on the basis of geography and surname can be used to develop a proxy for
race and ethnicity. Historically, practitioners have relied on proxies based on geography or
surname only. A new approach proposed in the academic literature—the BISG method—
combines geography- and surname-based information into a single proxy probability. In
supervisory and enforcement contexts, OR and SEFL rely on a BISG proxy probability for race
and ethnicity in fair lending analysis conducted for non-mortgage products.
This paper explains the construction of the BISG proxy currently employed by OR and SEFL and
provides an assessment of the performance of the BISG method using a sample of mortgage
applicants for whom race and ethnicity are reported. Our assessment demonstrates that the
BISG proxy probability is more accurate than a geography-only or surname-only proxy in its
ability to predict individual applicants’ reported race and ethnicity and is generally more
accurate than a geography-only or surname-only proxy at approximating the overall reported
distribution of race and ethnicity. We also demonstrate that the direct use of the BISG
probability does not introduce the sample attrition and significant underestimation of the
number of individuals by race and ethnicity that occurs when commonly-relied-upon threshold
values are used to classify individuals into race and ethnicity categories.
OR and SEFL do not require the use of or reliance on the specific proxy methodology put forth
in this paper, but we are making available to the public the methodology, statistical software
code, and our understanding of the performance of the methodology for a pool of mortgage
applicants in an effort to foster transparency around our work. The methodology has evolved
over time and will continue to evolve as enhancements are identified that improve accuracy and
performance. Finally, the Bureau is committed to continuing our dialogue with other federal
agencies, lenders, advocates, and researchers regarding the methodology.
24 USING PUBLICLY AVAILABLE INFORMATION TO PROXY FOR UNIDENTIFIED RACE AND ETHNICITY
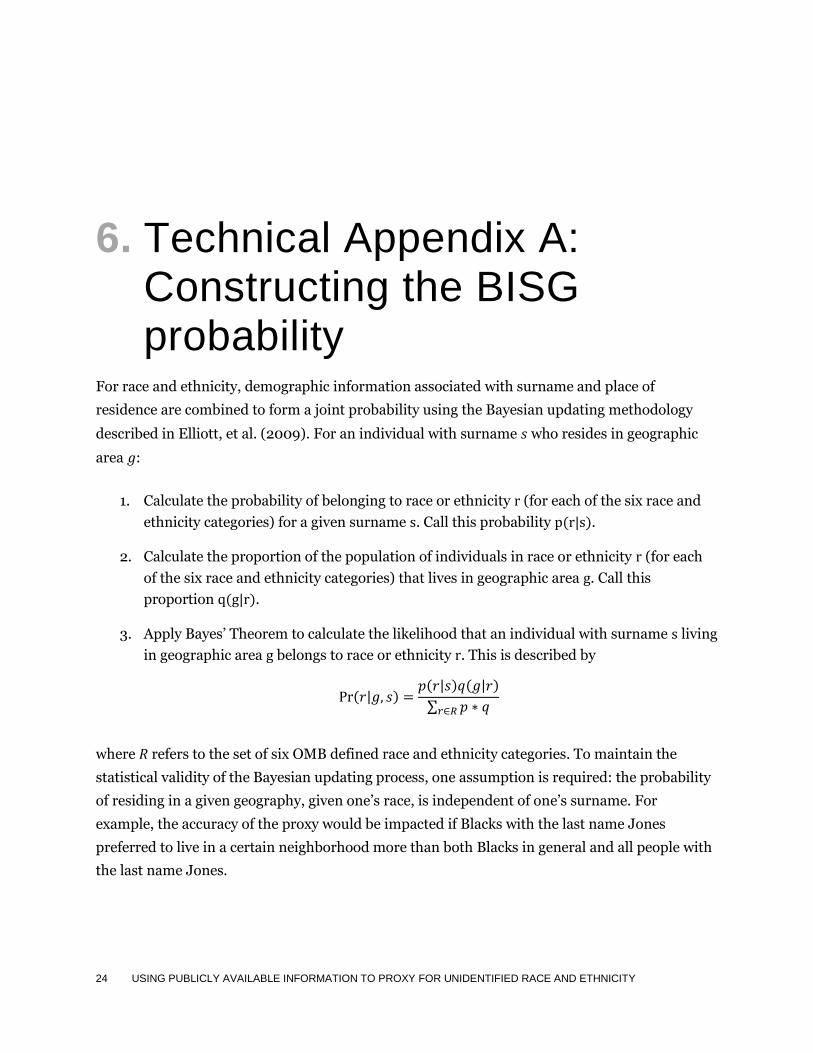
6. Technical Appendix A: Constructing the BISG probability
For race and ethnicity, demographic information associated with surname and place of
residence are combined to form a joint probability using the Bayesian updating methodology
described in Elliott, et al. (2009). For an individual with surname 𝑠 who resides in geographic
area 𝑔:
1. Calculate the probability of belonging to race or ethnicity r (for each of the six race and
ethnicity categories) for a given surname s. Call this probability p(r|s).
2. Calculate the proportion of the population of individuals in race or ethnicity r (for each
of the six race and ethnicity categories) that lives in geographic area g. Call this
proportion q(g|r).
3. Apply Bayes’ Theorem to calculate the likelihood that an individual with surname s living
in geographic area g belongs to race or ethnicity r. This is described by
( |𝑔 𝑠) ( |𝑠) (𝑔| )
∑
where 𝑅 refers to the set of six OMB defined race and ethnicity categories. To maintain the
statistical validity of the Bayesian updating process, one assumption is required: the probability
of residing in a given geography, given one’s race, is independent of one’s surname. For
example, the accuracy of the proxy would be impacted if Blacks with the last name Jones
preferred to live in a certain neighborhood more than both Blacks in general and all people with
the last name Jones.
25 USING PUBLICLY AVAILABLE INFORMATION TO PROXY FOR UNIDENTIFIED RACE AND ETHNICITY
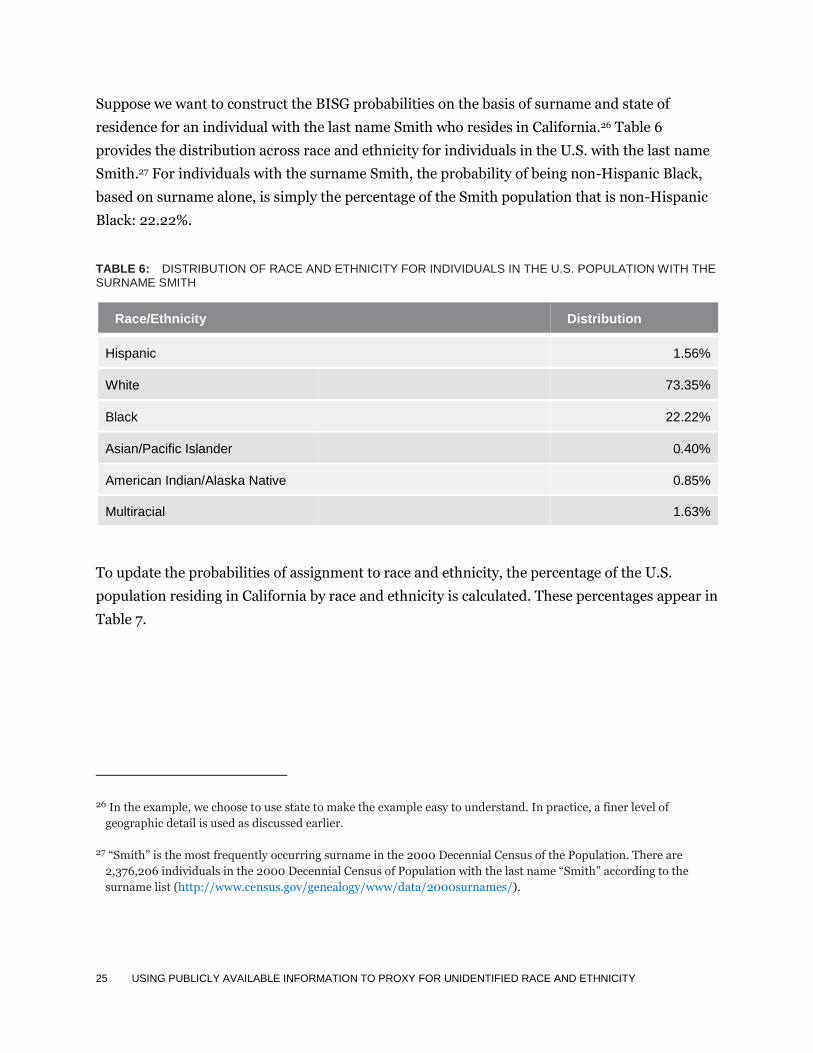
Suppose we want to construct the BISG probabilities on the basis of surname and state of
residence for an individual with the last name Smith who resides in California.26 Table 6
provides the distribution across race and ethnicity for individuals in the U.S. with the last name
Smith.27 For individuals with the surname Smith, the probability of being non-Hispanic Black,
based on surname alone, is simply the percentage of the Smith population that is non-Hispanic
Black: 22.22%.
TABLE 6: DISTRIBUTION OF RACE AND ETHNICITY FOR INDIVIDUALS IN THE U.S. POPULATION WITH THE SURNAME SMITH
Race/Ethnicity Distribution
Hispanic 1.56%
White 73.35%
Black 22.22%
Asian/Pacific Islander 0.40%
American Indian/Alaska Native 0.85%
Multiracial 1.63%
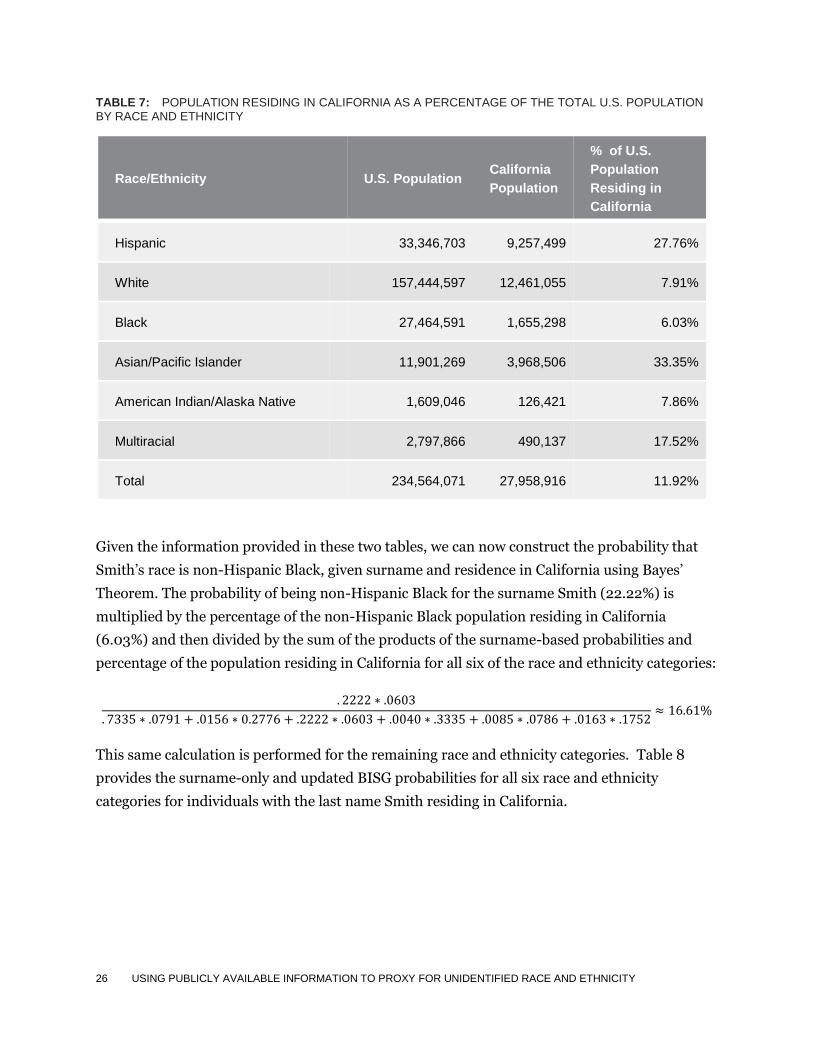
To update the probabilities of assignment to race and ethnicity, the percentage of the U.S.
population residing in California by race and ethnicity is calculated. These percentages appear in
Table 7.
26 In the example, we choose to use state to make the example easy to understand. In practice, a finer level of
geographic detail is used as discussed earlier.
27 “Smith” is the most frequently occurring surname in the 2000 Decennial Census of the Population. There are
2,376,206 individuals in the 2000 Decennial Census of Population with the last name “Smith” according to the
surname list (http://www.census.gov/genealogy/www/data/2000surnames/).
26 USING PUBLICLY AVAILABLE INFORMATION TO PROXY FOR UNIDENTIFIED RACE AND ETHNICITY
TABLE 7: POPULATION RESIDING IN CALIFORNIA AS A PERCENTAGE OF THE TOTAL U.S. POPULATION BY RACE AND ETHNICITY
Race/Ethnicity U.S. Population California
Population
% of U.S.
Population
Residing in
California
Hispanic 33,346,703 9,257,499 27.76%
White 157,444,597 12,461,055 7.91%
Black 27,464,591 1,655,298 6.03%
Asian/Pacific Islander 11,901,269 3,968,506 33.35%
American Indian/Alaska Native 1,609,046 126,421 7.86%
Multiracial 2,797,866 490,137 17.52%
Total 234,564,071 27,958,916 11.92%
Given the information provided in these two tables, we can now construct the probability that
Smith’s race is non-Hispanic Black, given surname and residence in California using Bayes’
Theorem. The probability of being non-Hispanic Black for the surname Smith (22.22%) is
multiplied by the percentage of the non-Hispanic Black population residing in California
(6.03%) and then divided by the sum of the products of the surname-based probabilities and
percentage of the population residing in California for all six of the race and ethnicity categories:
This same calculation is performed for the remaining race and ethnicity categories. Table 8
provides the surname-only and updated BISG probabilities for all six race and ethnicity
categories for individuals with the last name Smith residing in California.
27 USING PUBLICLY AVAILABLE INFORMATION TO PROXY FOR UNIDENTIFIED RACE AND ETHNICITY
TABLE 8: SURNAME-ONLY AND BISG PROBABILITIES FOR "SMITH" IN CALIFORNIA
Race/Ethnicity Surname-only BISG
Hispanic 1.56% 5.37%
White 73.35% 72.00%
Black 22.22% 16.61%
Asian and Pacific Islander 0.40% 1.65%
American Indian/Alaska Native 0.85% 0.83%
Multiracial 1.63% 3.54%
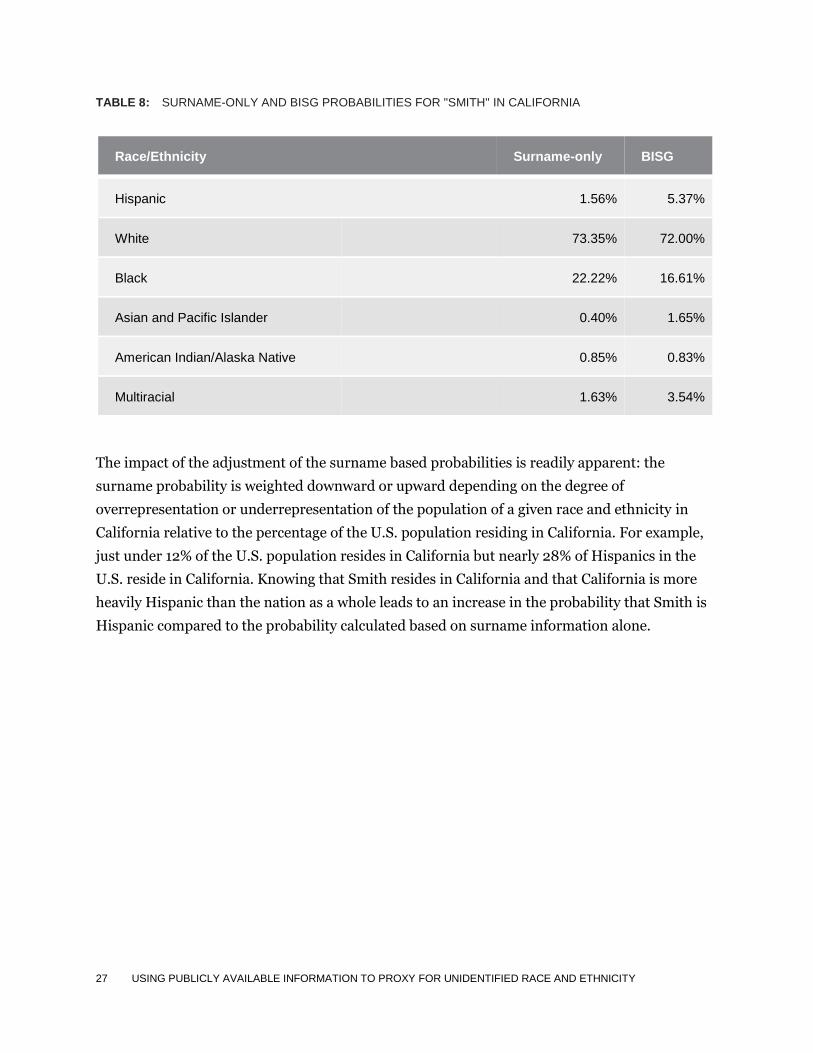
The impact of the adjustment of the surname based probabilities is readily apparent: the
surname probability is weighted downward or upward depending on the degree of
overrepresentation or underrepresentation of the population of a given race and ethnicity in
California relative to the percentage of the U.S. population residing in California. For example,
just under 12% of the U.S. population resides in California but nearly 28% of Hispanics in the
U.S. reside in California. Knowing that Smith resides in California and that California is more
heavily Hispanic than the nation as a whole leads to an increase in the probability that Smith is
Hispanic compared to the probability calculated based on surname information alone.
28 USING PUBLICLY AVAILABLE INFORMATION TO PROXY FOR UNIDENTIFIED RACE AND ETHNICITY
7. Technical Appendix B: Receiver Operating Characteristics and Area Under the Curve
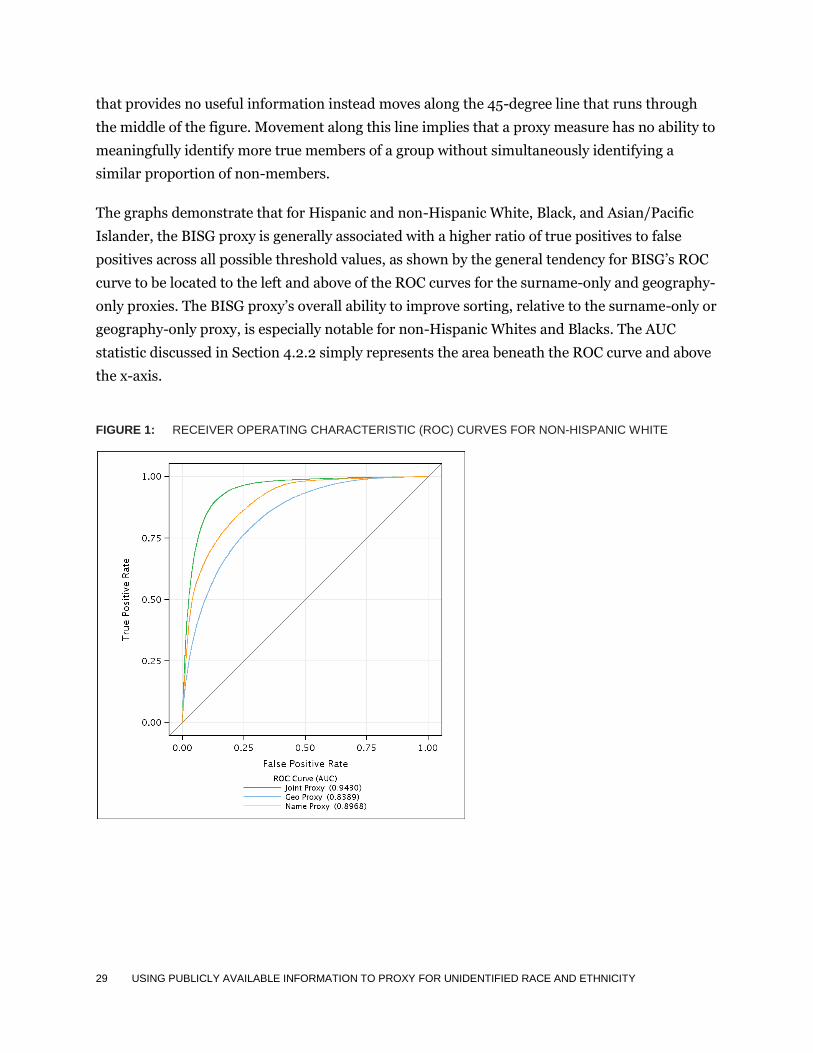
One way to characterize the proxy’s ability to sort individuals into race and ethnicity is to plot
the Receiver Operating Characteristic (ROC) curve. The ROC curve is constructed by applying a
threshold rule for classification to each race and ethnicity, where probabilities above the
threshold yield classification to a given race and ethnicity and those below do not, and then
plotting the relationship between the false positive rate and the true positive rate over the range
of possible threshold values.
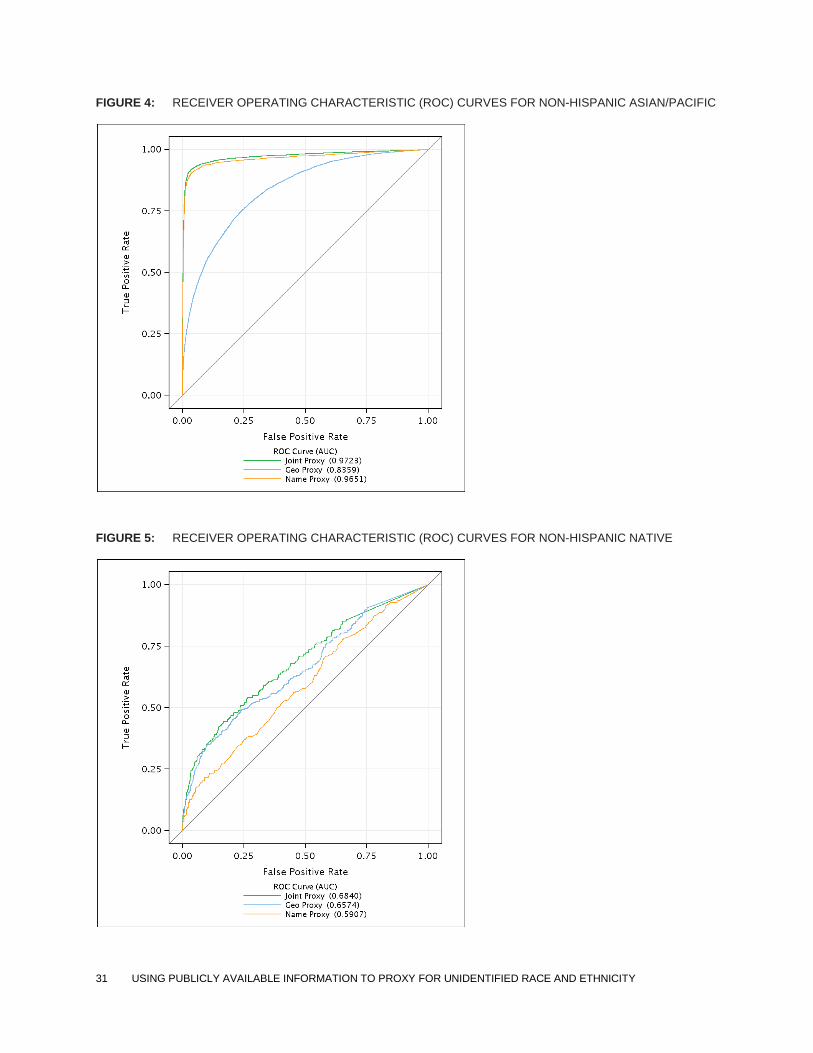
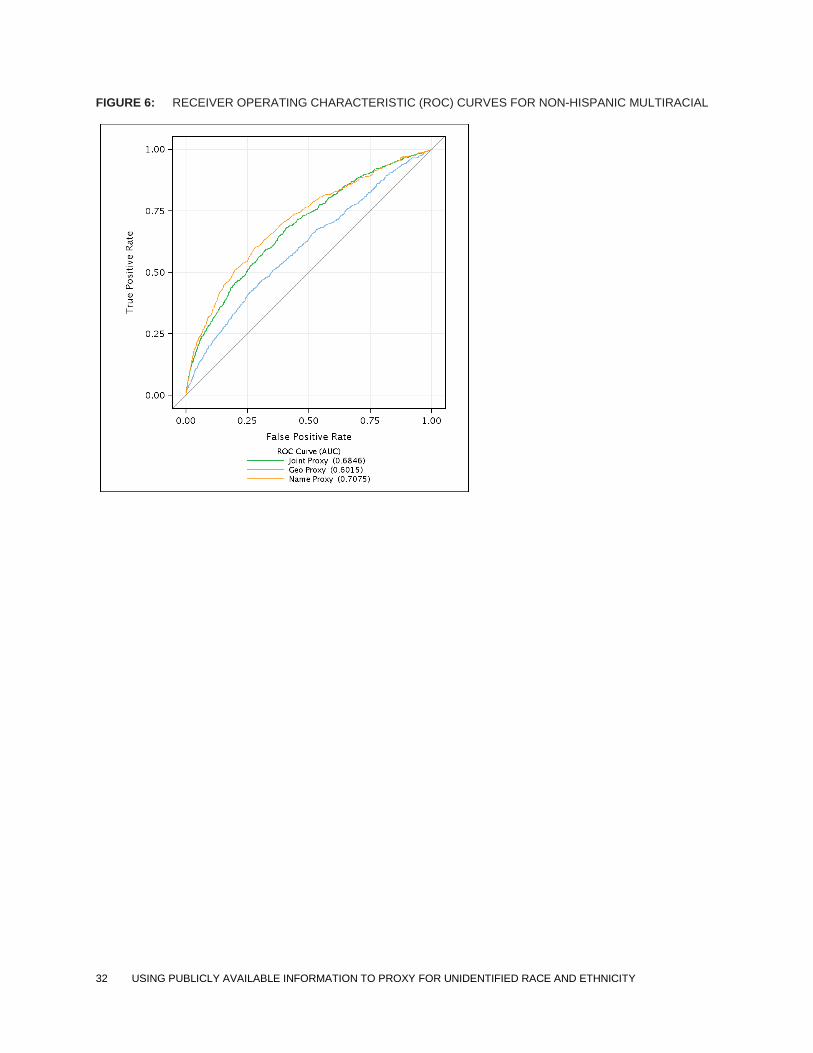
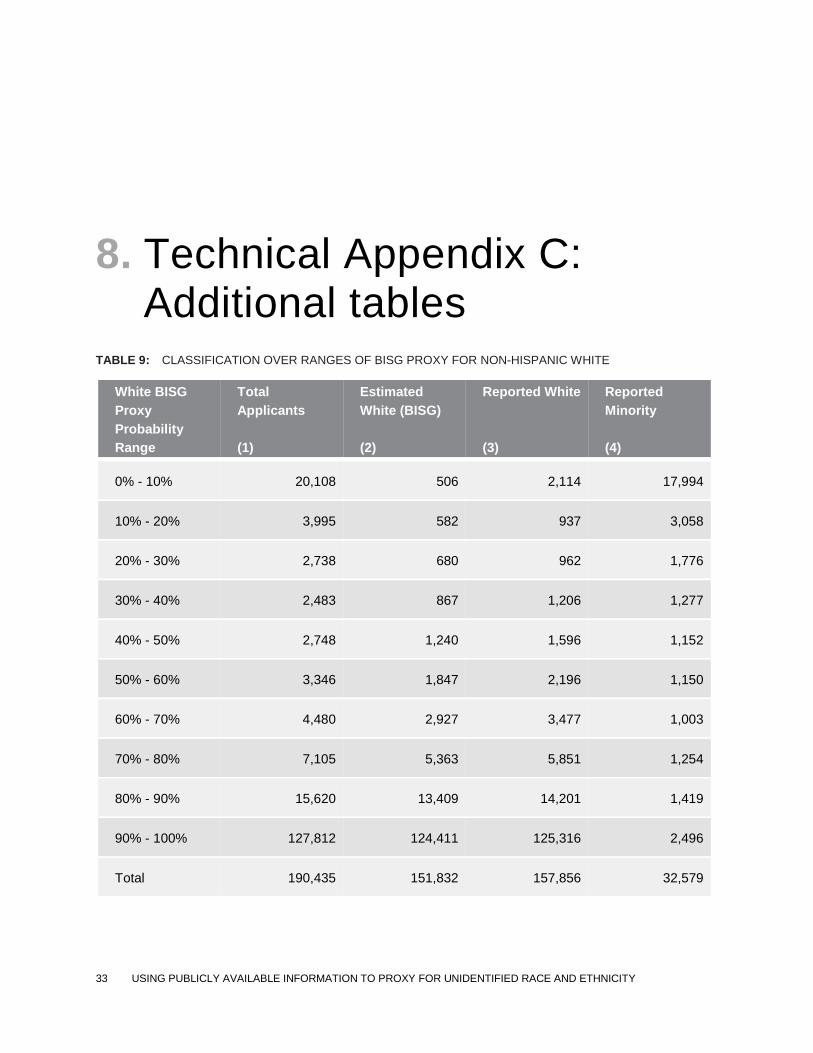
Figures 1 through 6 show the ROC curves for the geography-only, name-only, and BISG
probabilities by race and ethnicity. In each plot, the true positive rate is measured on the y-axis
and the false positive rate is measured on the x-axis.28 The slope of the ROC curve represents the
tradeoff between identifying true positives at the expense of increasing false positives over the
range of possible threshold values. The ROC curve for a perfect proxy—one that could classify
individuals into and out of a given race and ethnicity with no misclassification—moves along the
edges of the figure from (0,0) to (0,1) to (1,1). The closer that the ROC curve is to the left and
upper edge of the plot area, the better the proxy is at correctly classifying individuals. A proxy
28 The true positive rate is defined as the ratio of the number of applicants correctly classified into a reported race and
ethnicity by a given threshold divided by the total number applicants reporting the race and ethnicity; the false
positive rate is defined as the ratio of applicants incorrectly classified into a reported race and ethnicity by a given
threshold divided by the total number of applicants not reporting the race and ethnicity.
29 USING PUBLICLY AVAILABLE INFORMATION TO PROXY FOR UNIDENTIFIED RACE AND ETHNICITY
that provides no useful information instead moves along the 45-degree line that runs through
the middle of the figure. Movement along this line implies that a proxy measure has no ability to
meaningfully identify more true members of a group without simultaneously identifying a
similar proportion of non-members.
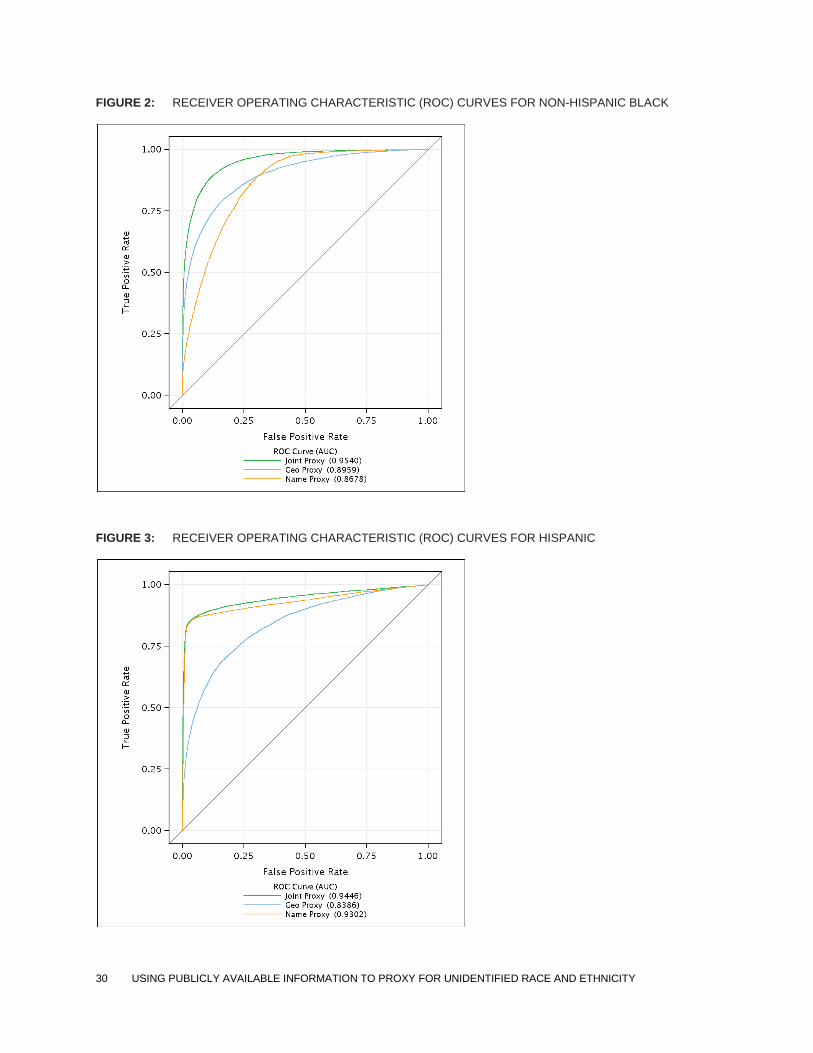
The graphs demonstrate that for Hispanic and non-Hispanic White, Black, and Asian/Pacific
Islander, the BISG proxy is generally associated with a higher ratio of true positives to false
positives across all possible threshold values, as shown by the general tendency for BISG’s ROC
curve to be located to the left and above of the ROC curves for the surname-only and geography-
only proxies. The BISG proxy’s overall ability to improve sorting, relative to the surname-only or
geography-only proxy, is especially notable for non-Hispanic Whites and Blacks. The AUC
statistic discussed in Section 4.2.2 simply represents the area beneath the ROC curve and above
the x-axis.
FIGURE 1: RECEIVER OPERATING CHARACTERISTIC (ROC) CURVES FOR NON-HISPANIC WHITE
30 USING PUBLICLY AVAILABLE INFORMATION TO PROXY FOR UNIDENTIFIED RACE AND ETHNICITY
FIGURE 2: RECEIVER OPERATING CHARACTERISTIC (ROC) CURVES FOR NON-HISPANIC BLACK
FIGURE 3: RECEIVER OPERATING CHARACTERISTIC (ROC) CURVES FOR HISPANIC
31 USING PUBLICLY AVAILABLE INFORMATION TO PROXY FOR UNIDENTIFIED RACE AND ETHNICITY
FIGURE 4: RECEIVER OPERATING CHARACTERISTIC (ROC) CURVES FOR NON-HISPANIC ASIAN/PACIFIC
FIGURE 5: RECEIVER OPERATING CHARACTERISTIC (ROC) CURVES FOR NON-HISPANIC NATIVE
32 USING PUBLICLY AVAILABLE INFORMATION TO PROXY FOR UNIDENTIFIED RACE AND ETHNICITY
FIGURE 6: RECEIVER OPERATING CHARACTERISTIC (ROC) CURVES FOR NON-HISPANIC MULTIRACIAL
33 USING PUBLICLY AVAILABLE INFORMATION TO PROXY FOR UNIDENTIFIED RACE AND ETHNICITY
8. Technical Appendix C: Additional tables
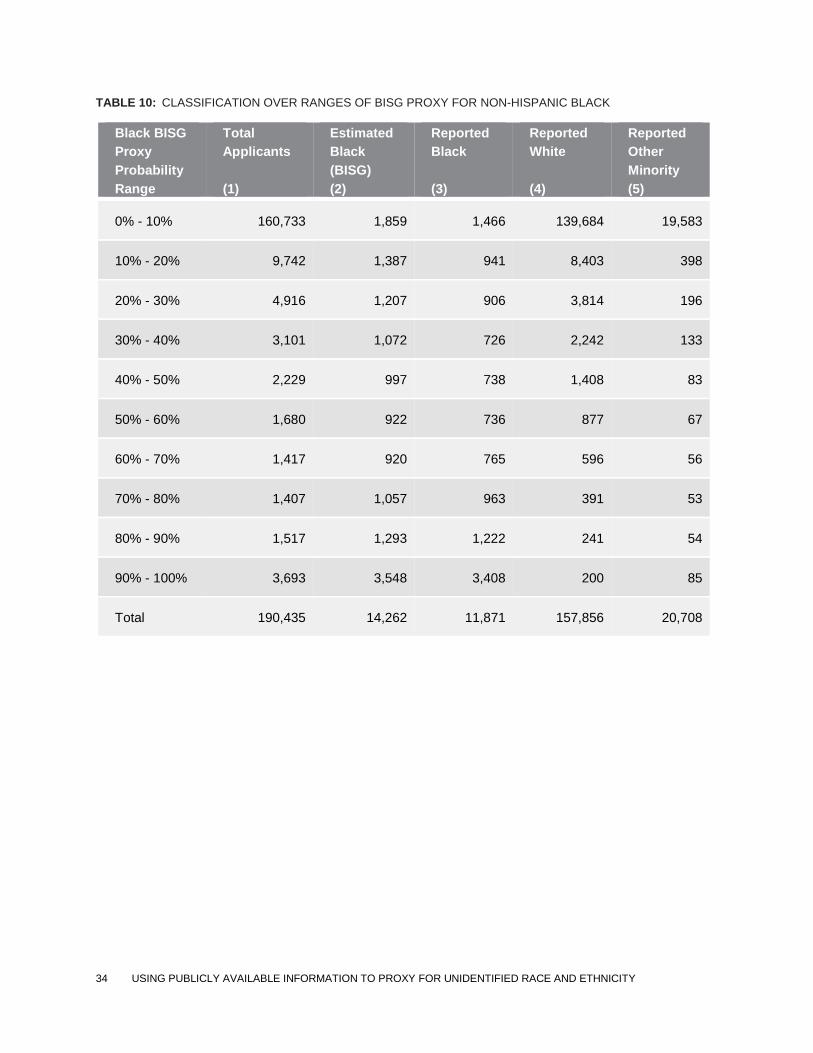
TABLE 9: CLASSIFICATION OVER RANGES OF BISG PROXY FOR NON-HISPANIC WHITE
White BISG
Proxy
Probability
Range
Total
Applicants
(1)
Estimated
White (BISG)
(2)
Reported White
(3)
Reported
Minority
(4)
0% - 10% 20,108 506 2,114 17,994
10% - 20% 3,995 582 937 3,058
20% - 30% 2,738 680 962 1,776
30% - 40% 2,483 867 1,206 1,277
40% - 50% 2,748 1,240 1,596 1,152
50% - 60% 3,346 1,847 2,196 1,150
60% - 70% 4,480 2,927 3,477 1,003
70% - 80% 7,105 5,363 5,851 1,254
80% - 90% 15,620 13,409 14,201 1,419
90% - 100% 127,812 124,411 125,316 2,496
Total 190,435 151,832 157,856 32,579
34 USING PUBLICLY AVAILABLE INFORMATION TO PROXY FOR UNIDENTIFIED RACE AND ETHNICITY
TABLE 10: CLASSIFICATION OVER RANGES OF BISG PROXY FOR NON-HISPANIC BLACK
Black BISG
Proxy
Probability
Range
Total
Applicants
(1)
Estimated
Black
(BISG)
(2)
Reported
Black
(3)
Reported
White
(4)
Reported
Other
Minority
(5)
0% - 10% 160,733 1,859 1,466 139,684 19,583
10% - 20% 9,742 1,387 941 8,403 398
20% - 30% 4,916 1,207 906 3,814 196
30% - 40% 3,101 1,072 726 2,242 133
40% - 50% 2,229 997 738 1,408 83
50% - 60% 1,680 922 736 877 67
60% - 70% 1,417 920 765 596 56
70% - 80% 1,407 1,057 963 391 53
80% - 90% 1,517 1,293 1,222 241 54
90% - 100% 3,693 3,548 3,408 200 85
Total 190,435 14,262 11,871 157,856 20,708
35 USING PUBLICLY AVAILABLE INFORMATION TO PROXY FOR UNIDENTIFIED RACE AND ETHNICITY
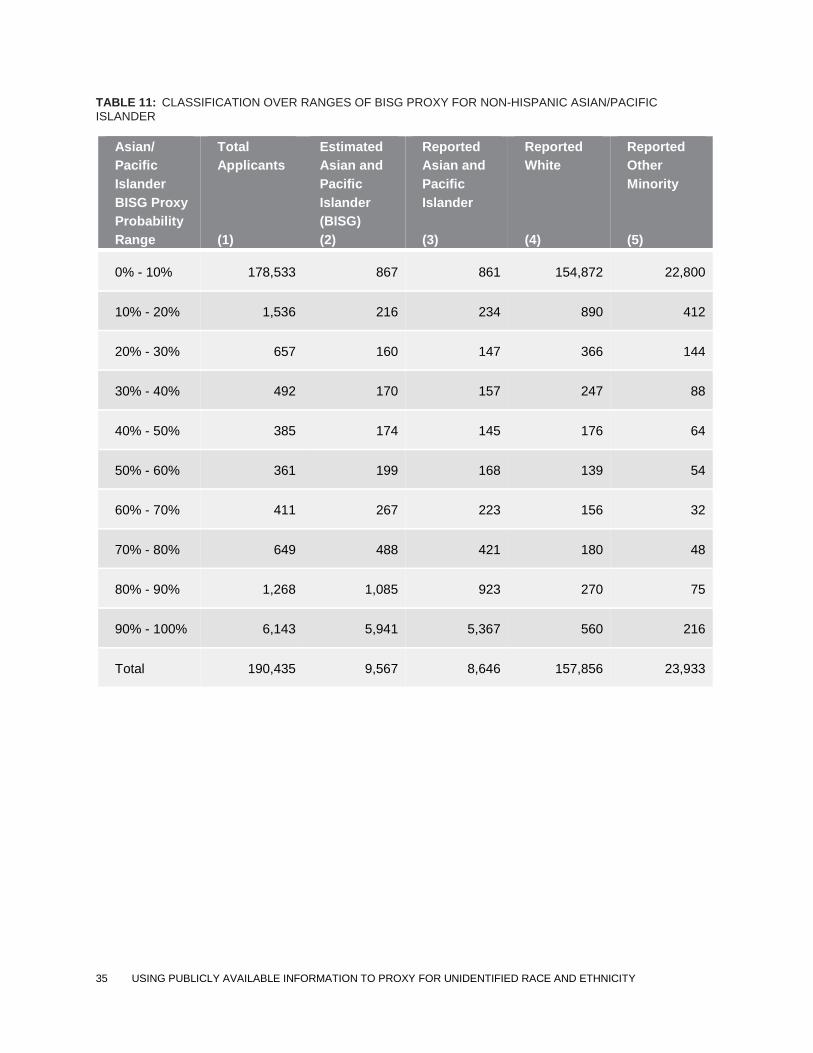
TABLE 11: CLASSIFICATION OVER RANGES OF BISG PROXY FOR NON-HISPANIC ASIAN/PACIFIC ISLANDER
Asian/
Pacific
Islander
BISG Proxy
Probability
Range
Total
Applicants
(1)
Estimated
Asian and
Pacific
Islander
(BISG)
(2)
Reported
Asian and
Pacific
Islander
(3)
Reported
White
(4)
Reported
Other
Minority
(5)
0% - 10% 178,533 867 861 154,872 22,800
10% - 20% 1,536 216 234 890 412
20% - 30% 657 160 147 366 144
30% - 40% 492 170 157 247 88
40% - 50% 385 174 145 176 64
50% - 60% 361 199 168 139 54
60% - 70% 411 267 223 156 32
70% - 80% 649 488 421 180 48
80% - 90% 1,268 1,085 923 270 75
90% - 100% 6,143 5,941 5,367 560 216
Total 190,435 9,567 8,646 157,856 23,933
36 USING PUBLICLY AVAILABLE INFORMATION TO PROXY FOR UNIDENTIFIED RACE AND ETHNICITY
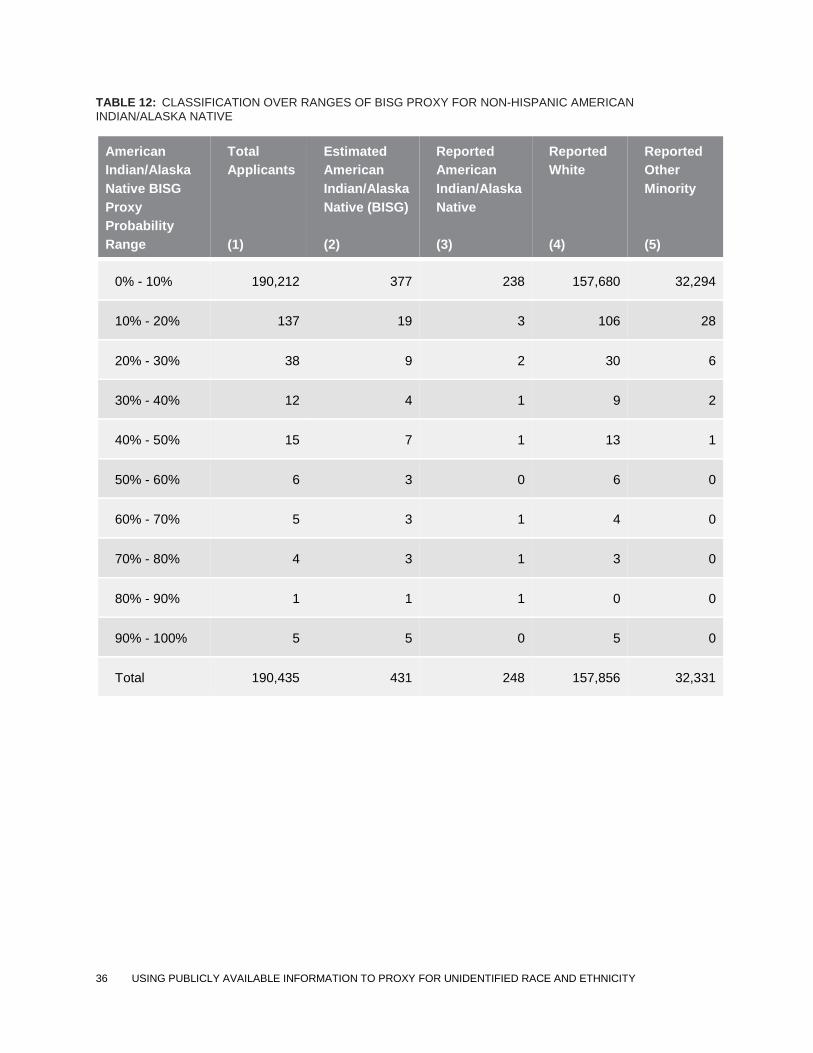
TABLE 12: CLASSIFICATION OVER RANGES OF BISG PROXY FOR NON-HISPANIC AMERICAN INDIAN/ALASKA NATIVE
American
Indian/Alaska
Native BISG
Proxy
Probability
Range
Total
Applicants
(1)
Estimated
American
Indian/Alaska
Native (BISG)
(2)
Reported
American
Indian/Alaska
Native
(3)
Reported
White
(4)
Reported
Other
Minority
(5)
0% - 10% 190,212 377 238 157,680 32,294
10% - 20% 137 19 3 106 28
20% - 30% 38 9 2 30 6
30% - 40% 12 4 1 9 2
40% - 50% 15 7 1 13 1
50% - 60% 6 3 0 6 0
60% - 70% 5 3 1 4 0
70% - 80% 4 3 1 3 0
80% - 90% 1 1 1 0 0
90% - 100% 5 5 0 5 0
Total 190,435 431 248 157,856 32,331
37 USING PUBLICLY AVAILABLE INFORMATION TO PROXY FOR UNIDENTIFIED RACE AND ETHNICITY
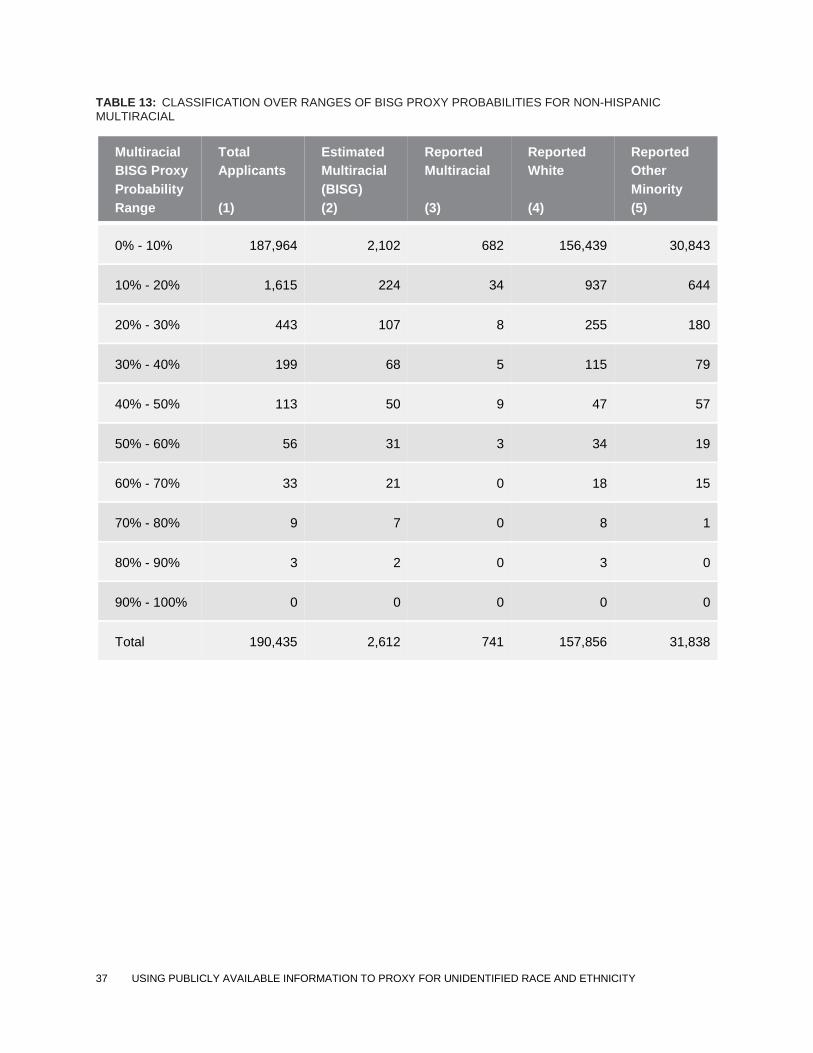
TABLE 13: CLASSIFICATION OVER RANGES OF BISG PROXY PROBABILITIES FOR NON-HISPANIC MULTIRACIAL
Multiracial
BISG Proxy
Probability
Range
Total
Applicants
(1)
Estimated
Multiracial
(BISG)
(2)
Reported
Multiracial
(3)
Reported
White
(4)
Reported
Other
Minority
(5)
0% - 10% 187,964 2,102 682 156,439 30,843
10% - 20% 1,615 224 34 937 644
20% - 30% 443 107 8 255 180
30% - 40% 199 68 5 115 79
40% - 50% 113 50 9 47 57
50% - 60% 56 31 3 34 19
60% - 70% 33 21 0 18 15
70% - 80% 9 7 0 8 1
80% - 90% 3 2 0 3 0
90% - 100% 0 0 0 0 0
Total 190,435 2,612 741 157,856 31,838