using optimized eccentricity rexolite lens for electrical ... · progress in electromagnetics...
TRANSCRIPT

Progress In Electromagnetics Research B, Vol. 44, 345–365, 2012
USING OPTIMIZED ECCENTRICITY REXOLITE LENSFOR ELECTRICAL BEAM STEERING WITH INTE-GRATED APERTURE COUPLED PATCH ARRAY
A. Karttunen1, *, J. Saily2, A. E. I. Lamminen2,J. Ala-Laurinaho1, R. Sauleau3, and A. V. Raisanen1
1 Department of Radio Science and Engineering, SMARAD/MilliLab,School of Electrical Engineering, Aalto University, P. O. Box 13000,FI-00076 AALTO, Finland
2VTT Technical Research Centre of Finland, 02044 VTT, Finland
3Institute of Electronics and Telecommunications of Rennes (IETR),UMR CNRS 6164, University of Rennes 1, Rennes 35042, France
Abstract—Design and measurement results of a beam-steeringintegrated lens antenna at 77 GHz are presented. An 8-element LTCCaperture coupled patch antenna feed array with a switching networkis used to electrically steer the main beam in H-plane. A 100-mmdiameter Rexolite (εr = 2.53) lens is simulated and tested. Theeccentricity of the lens is optimized in an earlier work with ray-tracingsimulations for improved beam-steering properties compared to theconventional extended hemispherical and elliptical lenses. The beam-steering properties including scan loss, main-beam width and direction,side-lobe levels, directivity, and cross-polarization are analyzed indetail with both simulations and radiation pattern measurements. Asexpected, the results show that the side-lobe and cross-polarizationlevels are not predicted accurately with large feed offsets using theray-tracing simulations. Nevertheless, it is shown that the lens shapecan be successfully optimized with the simple and fast ray-tracingsimulations. The measured half-power beam-width at 77 GHz is2.5◦ ± 0.2◦ up to the largest tested beam-steering angle of 30◦. Theoptimized eccentricity low permittivity lens results in smaller scan lossthan the conventional lenses.
Received 29 August 2012, Accepted 21 September 2012, Scheduled 1 October 2012* Corresponding author: Aki Karttunen ([email protected]).

346 Karttunen et al.
1. INTRODUCTION
Electrical beam steering with a narrow high-directivity beamhas potential use in many millimeter-wave applications, such asautomotive radar at 77–81 GHz with high angular resolution [1]or telecommunications for high data rate links at E-band (71–86GHz) [2, 3]. One potential antenna solution is an integrated lensantenna with a feed array and switching network [3, 4]. The switchesare used to select one of the feed array elements, and the lens producesthe main beam in a direction relative to the active element’s positionon the lens bottom.
The conventional integrated lens types that produce diffraction-limited beams are the extended hemispherical lenses [3–11] andthe elliptical ones [6, 8, 12–18]. The beam-steering propertieshave been widely studied with simulations [3–9, 12, 13], and withmeasurements without electrical beam steering, i.e., without switches,e.g., in [3, 5, 9, 12]. Moreover, double-shell integrated lenses [19, 20],and shaped integrated lens antennas with optimized lens shapes havebeen studied, e.g., in [13, 14]. The planar feed array is integrated tothe flat surface of the lens, and the lens enhances the directivity ofthe relatively low-directivity feed array antenna element. As the feedis integrated into direct contact with the lens, it offers mechanicalrigidity, elimination of substrate modes, and good coupling to the lens.
With a conventional elliptical lens, with an eccentricity of (εr)−1/2
and with the feed at the focal point, the rays emitted from thehemiellipse are parallel, and the equiphase surface is planar providingthe diffraction-limited beam (see Fig. 7(i)). The directivity ofan extended hemispherical lens can be optimized by selecting theextension length [3–5, 7–11]. Using a shorter extension leads tolower losses (e.g., [12]), but does not produce the diffraction-limitedbeam, and thus it is not preferable when narrow beam and highdirectivity are priority. With small beam-steering angles up to about15◦–25◦, the elliptical lens is better, but with larger angles theextended hemispherical lens provides higher directivity and nearlyconstant beam width [6, 8]. With high permittivity lens, the differencebetween the elliptical and extended hemispherical lenses is relativelysmall [6], but with low permittivity lenses the differences in beam-steering properties are significant. In [8], an optimized eccentricitylow permittivity integrated lens is investigated that combines theadvantages of the conventional lenses: high directivity and constantbeam width over a wide beam-steering range of ±30◦. In this paper,the promising theoretical results from [8] are tested in practice andanalyzed in detail.

Progress In Electromagnetics Research B, Vol. 44, 2012 347
Electrical beam steering with integrated lens antenna requiresboth an array of feed elements and a switching network. Thefeed antennas, the switches, and other needed components can beintegrated in one package using low-temperature cofired ceramic(LTCC) technology, e.g., [3, 21–28]. The LTCC packaging andintegrated circuits are widely used at 60 GHz, e.g., [21–24]. LTCC hasbeen used at W-band 77–110GHz [3, 25–27], and up to 150 GHz [28],proving that LTCC technology offers cost-effective solutions also above60GHz. In this paper, an 8-element aperture coupled microstrip line-fed patch antenna (ACMPA) array is designed. The distance betweenthe feed elements is designed for good beam-overlap that providescontinuous coverage in H-plane direction. One SPDT and two SP4Tswitches are used to select the active feed element. The designedfeed array is used to test the beam-steering properties of the 100-mmdiameter optimized eccentricity Rexolite (εr = 2.53) lens at 77GHz.
The main reason for the choice of the lens type and material isto verify the result of [8]. Other important reasons are the mechanicalsimplicity and manufacturability of a single material lens with acanonical elliptical shape, low density, availability, and relatively lowdielectric losses of Rexolite.
The design of the LTCC integrated feed array, switchingnetwork, and the lens are presented in Section 2. The beam-steering properties of the designed antenna are tested with radiationpattern measurements at 77 GHz in Section 3. The simulation andmeasurement results are used to study the beam-steering properties,i.e., scan loss, beam width, directivity, and cross-polarization as afunction of the beam-steering angle. Also, the effects due to internalreflections and the origin of the side-lobes and cross-polarization arestudied in detail.
2. BEAM-STEERING INTEGRATED LENS ANTENNADESIGN
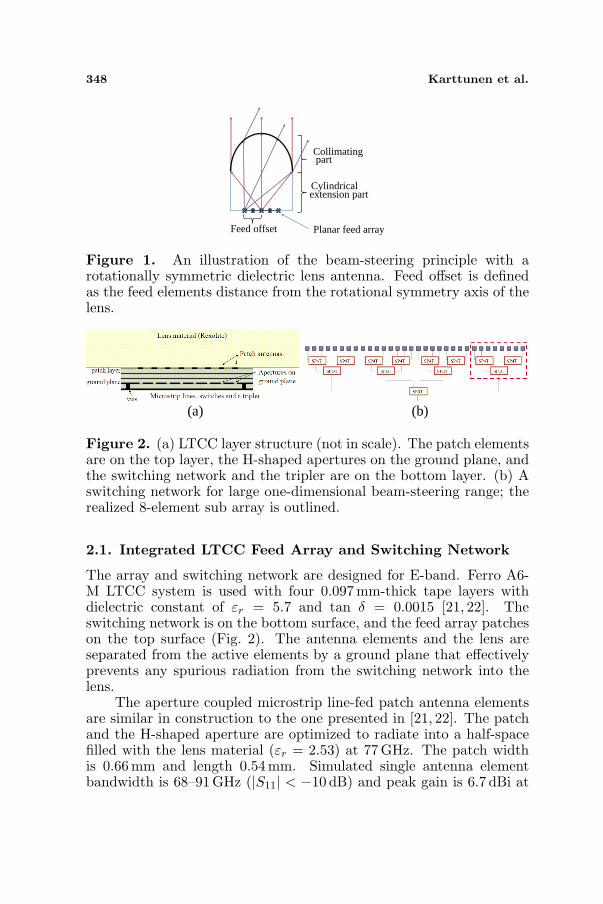
An integrated lens antenna consists of two parts: the dielectric lensand the feed array. The beam-steering principle with an integratedlens antenna is illustrated in Fig. 1. For electrical beam steering, aswitching network is needed to select the active feed array element.
In this work, a LTCC integrated feed array with a switchingnetwork and a 100-mm diameter Rexolite lens are designed. The LTCCfeed array is presented in Section 2.1. The aperture coupled microstripline-fed patch feed elements radiation pattern into the lens is given inSection 2.2. It is used in the lens simulations in Sections 2.3 and 3.
348 Karttunen et al.
Collimatingpart
Cylindricalextension part
Planar feed arrayFeed offset
Figure 1. An illustration of the beam-steering principle with arotationally symmetric dielectric lens antenna. Feed offset is definedas the feed elements distance from the rotational symmetry axis of thelens.
(a) (b)
Figure 2. (a) LTCC layer structure (not in scale). The patch elementsare on the top layer, the H-shaped apertures on the ground plane, andthe switching network and the tripler are on the bottom layer. (b) Aswitching network for large one-dimensional beam-steering range; therealized 8-element sub array is outlined.
2.1. Integrated LTCC Feed Array and Switching Network
The array and switching network are designed for E-band. Ferro A6-M LTCC system is used with four 0.097mm-thick tape layers withdielectric constant of εr = 5.7 and tan δ = 0.0015 [21, 22]. Theswitching network is on the bottom surface, and the feed array patcheson the top surface (Fig. 2). The antenna elements and the lens areseparated from the active elements by a ground plane that effectivelyprevents any spurious radiation from the switching network into thelens.
The aperture coupled microstrip line-fed patch antenna elementsare similar in construction to the one presented in [21, 22]. The patchand the H-shaped aperture are optimized to radiate into a half-spacefilled with the lens material (εr = 2.53) at 77 GHz. The patch widthis 0.66 mm and length 0.54 mm. Simulated single antenna elementbandwidth is 68–91 GHz (|S11| < −10 dB) and peak gain is 6.7 dBi at

Progress In Electromagnetics Research B, Vol. 44, 2012 349
77GHz. The patch antenna elements are arranged in a linear array inH-plane with a pitch of 2.0 mm. The simulated coupling to neighboringelement is low (|S21| < −22 dB). The distance between the elements isdesigned for beam overlap of about −2 dB with the designed lens.
A schematic of the switching network for large one-dimensionalbeam-steering is shown in Fig. 2(b)). In this work, only eight feedelements are realized in order to keep the switching network losses andcost relatively low. The switching network for the eight element sub-array has one SPDT-type PIN-diode switch (Hittite HMC-SDD112)that is used to select one of the two four-element sub-arrays. SP4T-type PIN-diode switches (TriQuint TGS4306-FC) are used to select theactive element of the chosen sub-array. According to the datasheets,the SPDT switch has typical insertion loss of 2 dB and isolation of30 dB, and the SP4T switches have typical insertion loss of 3 dB andisolation of 20 dB. Attenuation in the microstrip lines is in the orderof 1.4 dB/cm. The combined attenuation in the 8-element switchingnetwork, i.e., the insertion losses of 2 dB and 3 dB and an average ofabout 1.5 cm of microstrip lines, is approximated to be in the order of7 dB. With the integrated beam-steering lens antennas the number ofbeams, i.e., the number feed elements, is limited due to the increasingswitching network losses. In future, low loss switches could be used,e.g., SP4T RF-MEMS with insertion loss of only about 1 dB at 75GHzis reported in [29].
A frequency tripler (HMC-XTB110) is implemented in the LTCCboard and an attached K-connector is used for the 25.67GHz inputsignal. The MMIC devices are mounted using flip-chip and wire-bonding techniques. The bias currents for the PIN-diode switchesare controlled with a board of rocker switches. The designed feedis manufactured in VTT. A photograph of the feed array is shown inFig. 3.
Figure 3. Photographs of the LTCC feed array attached to a circuit-board and the designed 100-mm diameter Rexolite lens. The totalheight of the lens equals 110.37 mm.

350 Karttunen et al.
2.2. Feed Element Radiation Pattern into the Lens Material
The radiation pattern of a single aperture coupled microstrip line-fed patch antenna into Rexolite is simulated at 77GHz using FDTDsimulator developed by IETR [11, 30]. This radiation pattern is usedin the ray-tracing simulations of the lens in Sections 2.3 and 3. Thesimulated amplitude and phase patterns are presented in Fig. 4.The simulated directivity into Rexolite half-space is 7.7 dB, and thehalf-power beam-widths are 66◦ and 91◦ in H-plane and E-plane,respectively. In general, the choice of directivity of the feed element
Figure 4. Simulated normalized main polarization amplitude andphase of the aperture coupled patch feed element into Rexolite (εr =2.53) half space at 77 GHz. The two diagonal planes are identical dueto symmetry.
Figure 5. Simulated cross-polarization level of the aperture coupledpatch feed element into Rexolite (εr = 2.53) half space at 77 GHz. Thetwo diagonal planes are identical due to symmetry. The simulatedcross-polarization in the E-plane is below −50 dB.

Progress In Electromagnetics Research B, Vol. 44, 2012 351
is a compromise. With higher directivity feed elements, the reflectionloss would be higher, and with lower directivity feed elements, the totalof spillover and reflection losses are higher [7–9]. The simulated phasecentre is about 0.15 mm below the patch, i.e., below the bottom ofthe lens. The phase centre is defined for minimal phase variations forθ < 30◦. Its location is important as in the lens simulations the raysare launched from the phase centre point. With some feeds, as e.g.,in [10], the phase centre can be quite far from the geometrical centreof the feed.
The simulated cross-polarization pattern is presented in Fig. 5.Ludwig’s s second definition of polarization [31] is used. The maximumcross-polarization level is about −9 dB.
2.3. Optimized Lens Shape
The conventional high directivity integrated lens types are theextended hemispherical [3–11] and the elliptical lens [6, 8, 12–18].Diffraction-limited patterns are attained with an elliptical lens thathas an eccentricity of e = (εr)−1/2, and its extension length L equalse · a, where εr is the relative permittivity of the lens material and ais the semimajor axis of the ellipse. The eccentricity of an ellipse isdefined as
e =√
1− (b/a)2, (1)
where b is the semiminor axis of the ellipse, i.e., the radius of thelens. In the case of the hemispherical lens, the eccentricity is 0, andthe diffraction-limited patterns can be approximated by optimizing theextension length [3–5, 7–11].
The mechanically simpler extended hemispherical lens is some-times used to approximate the elliptical lens, e.g., [5, 6, 10, 16]. Withhigh permittivity lenses, the beam-steering properties are relativelysimilar, e.g., in [6] with Alumina (εr = 9.8) and GaAs (εr = 12.8)lenses the difference in directivity is at most only about 1 dB. Simi-larly spherical reflector approximates paraboloidal reflector with largef/D compared to D/λ [32]. With low permittivity integrated lensesthe difference is much larger both in mechanical dimensions and inbeam-steering properties.
In [8], it is proposed for the first time that the eccentricity oflow permittivity integrated lens can be optimized to improve thebeam-steering properties. The role of the eccentricity on the focusingproperties is studied with ray-tracing simulations using simple feedmodel and lossless lens material. The lens eccentricity is variedbetween 0 and (εr)−1/2, the extension lengths are optimized for eacheccentricity, and the beam-steering properties are studied based on

352 Karttunen et al.
Figure 6. Normalized amplitude patterns simulated with FDTD with(dash) and without (solid) offsets at 77 GHz. Extended hemisphericallens (blue, offsets 0 and 270 = 40.50mm), optimized eccentricity lens(red, offsets 0 and 2384 = 35.70mm), and conventional ellipticallens (black, offsets 0 and 2274 = 34.05 mm). The amplitudes arenormalized to the maximum of the simulated on-axis beam of theoptimized eccentricity lens.
simulations with feed offsets. The lens eccentricity and extensionlength optimization is presented in [8] and will not be repeated here.The optimal eccentricity of a low permittivity integrated lens for abeam-steering antenna is found to be an intermediate value between0 and (εr)−1/2. Optimized eccentricity provides nearly constant beamwidth and directivity as a function of the beam-steering angle.
In this paper, the promising results from [8] are tested andanalyzed with realized integrated feed array and lens. The geometricalparameters of the 100mm-diameter optimized eccentricity Rexolitelens are chosen to be eccentricity of 0.78 ·(εr)−1/2 and extension lengthof 53 mm [8]. A photograph of the lens is shown in Fig. 3.
The lens antenna is designed using an in-house developed ray-tracing program [3, 7, 8]. Because of the large electrical size ofthese high-directivity lenses ray tracing is preferred in antenna designand optimization compared to the computationally heavier full-wavesimulations. Only the main result of [8], i.e., that the optimizedeccentricity lens provides improved beam-steering properties with largeoffset, is confirmed with FDTD simulator developed by IETR [30]. InFig. 6, the extended hemispherical lens (e = 0, L = 70 mm), theoptimized eccentricity lens (e = 0.78 · (εr)−1/2, L = 53 mm), andthe conventional elliptical lens (e = (εr)−1/2, L = e · a ≈ 40.4 mm)are compared without offset and with 30◦ beam steering. The lenseshave a diameter of 100 mm and the frequency is 77GHz. In these

Progress In Electromagnetics Research B, Vol. 44, 2012 353
simulations the patch is only a simple square patch with a currentelement excitation, to make the simulation model simple, and thereforethese results are not directly comparable with the results in Section 3.The FDTD cell size is 4 = 0.15mm and the feed is 44× 44 squarepatch with 24-thick LTCC substrate and infinite ground plane. Theoptimized eccentricity lens has the smallest scan loss, i.e., decrease inamplitude compared to the on-axis beam, and highest amplitude andlowest side-lobes with the large offsets. Although the feed is not exactlythe same as the realized LTCC feed, this result confirms the results ofthe lens eccentricity comparison of [8].
In [8], the feed radiation pattern is considered to be a point sourcewith amplitude pattern
|E(φ, θ)| = cosN (θ), 0 ≤ θ ≤ 90◦, 0 ≤ φ ≤ 360◦, (2)
at the main polarization of Ludwig’s second definition of polariza-tion [31]. The directivity of the feed element is varied with the pa-rameter N . To confirm that the same conclusions about the role ofthe lens eccentricity can be made also with the realized aperture cou-pled patch feed antennas, the three lens shapes, the extended hemi-spherical, the optimized eccentricity, and the conventional elliptical,are compared with ray-tracing simulations. The simulated half-powerbeam-width, scan loss, directivity, and cross-polarization levels are pre-sented in Figs. 12 and 13. Also, these results are then compared tothe measurement results of the optimized eccentricity lens with theintegrated feed array. Detailed analysis and comparison is presented
(a)
(b)
(c)
(d)
(e)
(f)
(g)
(h)
(i)
(j)
(k)
(l)
Figure 7. Ray illustrations; (a)–(d) extended hemispherical, (e)–(h)optimized eccentricity and (i)–(l) elliptical Rexolite lenses with feedoffsets 0%, 20%, 40%, and 60% of the lens radius. Yellow rays aretotally reflected. The red line outside the lens is an equiphase surface.
354 Karttunen et al.
in Section 3.In ray tracing different loss factors and field components can
be easily separated and therefore ray tracing is an excellent tool foranalyzing integrated lens antennas. In order to better understand therole of the lens eccentricity let us examine in detail Fig. 7, in which theextended hemispherical, the optimized eccentricity, and the ellipticalRexolite lenses are compared with and without feed offsets. Threeobservations can be made from Fig. 7:
1) A planar equiphase surface of variable diameter is formed bythe hemispherical/elliptical part of the lens. The main-beam width,and therefore also directivity, depends mostly on the diameter ofthe planar section of the equiphase surface. In this paper, as alsoin [8], the equivalent currents are calculated on the equiphase surface(Fig. 7). The equiphase surface is orthogonal to the rays, and thereforetangential to integration surface, and thus, it is not necessary toapproximate the tangential field by projection, as e.g., in [5, 10, 12, 15].Comparison of using different integration surfaces is outside the scopeof this paper.
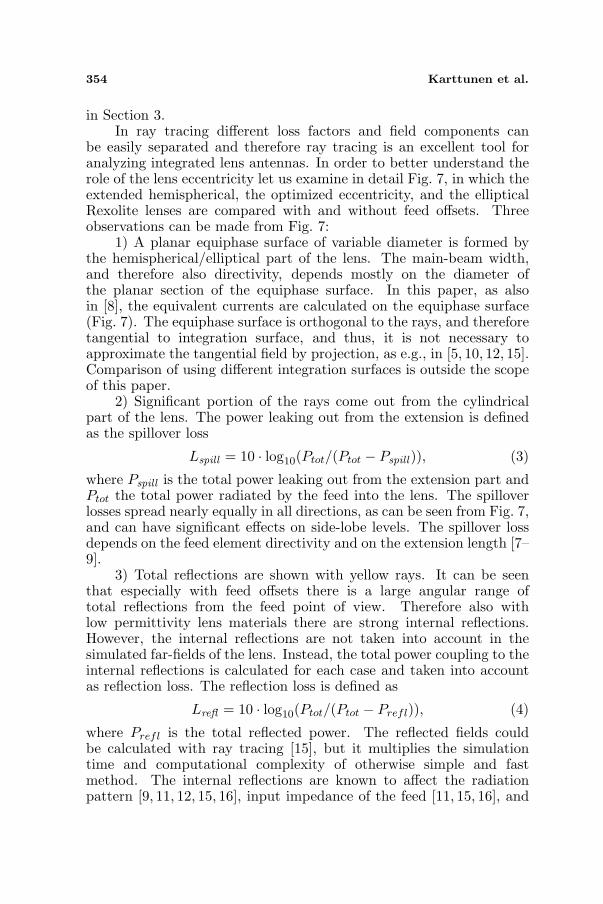
2) Significant portion of the rays come out from the cylindricalpart of the lens. The power leaking out from the extension is definedas the spillover loss
Lspill = 10 · log10(Ptot/(Ptot − Pspill )), (3)
where Pspill is the total power leaking out from the extension part andPtot the total power radiated by the feed into the lens. The spilloverlosses spread nearly equally in all directions, as can be seen from Fig. 7,and can have significant effects on side-lobe levels. The spillover lossdepends on the feed element directivity and on the extension length [7–9].
3) Total reflections are shown with yellow rays. It can be seenthat especially with feed offsets there is a large angular range oftotal reflections from the feed point of view. Therefore also withlow permittivity lens materials there are strong internal reflections.However, the internal reflections are not taken into account in thesimulated far-fields of the lens. Instead, the total power coupling to theinternal reflections is calculated for each case and taken into accountas reflection loss. The reflection loss is defined as
Lrefl = 10 · log10(Ptot/(Ptot − Prefl)), (4)
where Prefl is the total reflected power. The reflected fields couldbe calculated with ray tracing [15], but it multiplies the simulationtime and computational complexity of otherwise simple and fastmethod. The internal reflections are known to affect the radiationpattern [9, 11, 12, 15, 16], input impedance of the feed [11, 15, 16], and

Progress In Electromagnetics Research B, Vol. 44, 2012 355
the mutual coupling [17]. In case of total reflections also a surfacewave is generated that is partly responsible for the effects generallyassociated with internal reflections, i.e., with Prefl .
Because the reflection loss increases as a function of the feed offsetit should be considered as one of the limiting factors for the maximumusable offset [5, 7, 12]. With large feed offsets, the reflection loss can bemore than 3 dB (50%) with any feed element directivity and with anylens eccentricity or permittivity. This is due to the fact that, with largeenough feed offset, there is total reflection directly above the feed (e.g.,see Figs. 7(d), (h), and (l)), i.e., at the direction of the maximum of thefeed radiation pattern. For example, with the optimized eccentricityRexolite lens used in this paper, there is total reflection directly abovethe feed with offsets of 29 mm (58% of radius) or more. With feedoffsets, the edge illumination is far from the optimal as defined in [18].
The imaginary part of permittivity is taken into account onlyas power loss and not in Snell’s law or reflection or transmissioncoefficients [33]. This approximation can be made because Rexoliteis relatively low loss material (tan δ = 0.0013 in W-band [34]. Similarto spillover and reflection losses, the dielectric loss is calculated as
Ldiel = 10 · log10(Ptot/(Ptot − Pdiel)), (5)where Pdiel is the power loss due to dielectric loss. Due to the factthat the reflected fields are not calculated in the simulations, Eq. (5)underestimates the total dielectric losses as the reflected fields are alsoattenuated due to dielectric losses before exiting the lens.
The simulated spillover, reflection, and dielectric losses, with therealized patch feed, of the extended hemispherical lens, the optimizedeccentricity lens, and the conventional elliptical lens are compared in
Figure 8. Simulated reflection (solid), spillover (dash-dot), anddielectric (dash) losses as a function of the main-beam direction withthe simulated LTCC patch at 77 GHz. Extended hemispherical lens(blue), optimized eccentricity lens (red), and conventional ellipticallens (black).

356 Karttunen et al.
Fig. 8. The spillover losses are nearly identical because the lenses areidentical in the lens extension below the total reflection (Fig. 7). Alsothe dielectric losses are nearly equal because of the relatively smalldifferences in the lens sizes. The reflection losses increase as a functionof the main-beam direction with all the lens shapes mainly due to thetotal reflections. With small beam-steering angles the conventionalelliptical lens has clearly the lowest reflection loss, but with large angleshas nearly equal losses with the optimized eccentricity lens.
3. MEASUREMENT RESULTS
The radiation patterns are measured with the designed optimizedeccentricity Rexolite lens and the LTCC patch antenna array at77GHz. The beam-steering properties of the lens are tested byswitching the elements on one by one and measuring the radiationpatterns.
The antenna is measured in a planar near-field scanning rangewith AB Millimetre MVNA 8-350 vector network analyzer as themeasurement device. An external frequency doubler is used in orderto provide the 25.67 GHz signal for the frequency tripler integrated inthe LTCC board. Antenna gain measurements are not conducted aswith the integrated feed it is difficult and time consuming, requiringadditional test structures, and is considered to be beyond this study.A harmonic mixer is used as the receiver. An open-ended WR-10 waveguide is the probe antenna. Probe correction is done withthe simulated radiation pattern obtained from FDTD simulator [30].Most of the measurements are done with a relatively small scanningarea (390 mm × 390mm) and with a sampling interval (3 mm) largerthan the Nyquist sampling criterion (λ0/2) in order to reduce themeasurement time. In most cases, an angular range of ±30◦ is largeenough. Some of the most important offsets are measured with ascanning area of 500 mm × 500mm and a scanning interval of 2mm inorder to capture a larger angular range of about ±60◦. The antennameasurements are done only at one frequency mainly to save time.According to simulations, frequency mainly affects the beam-width, aswith diffraction limited beams the beam-width is directly proportionalto wavelength.
As explained in Section 2, only an 8-element array is realized.In order to test larger beam-steering angles, the feed array is moved.First, the feed array is placed close to the centre of the lens so that theelement 1 is at the centre and element 8 is at the feed offset of 14 mm.Then the whole feed array is moved manually, and feed offsets up to36mm are measured in order to test also the wide angle beam-steering

Progress In Electromagnetics Research B, Vol. 44, 2012 357
(a) (b) (c)
Figure 9. Measured normalized H-plane cuts with feed offsets from(a) 0 to 14 mm, (b) 8 mm to 22 mm, and (c) 22mm to 36mm. Allpatterns normalized to the maximum of the on-axis beam.
Figure 10. Measured −3 dB contours with feed offsets from 0 to36mm. The 3 dB contours illustrate only the angular range coveredby each beam; the relative amplitudes are presented in Fig. 12(b).
properties. Patterns with feed offsets of 8 to 14 mm and 22 mm aremeasured twice. There are only small differences in the patterns andrelative power levels (see Figs. 9, 10, 12, and 13) even though differentpatches and different switches were used. The measured normalizedH-plane cuts at 77 GHz with feed offsets 0–36 mm are shown in Fig. 9.As expected, the main beam is steered nearly linearly as a function ofthe feed offset. A beam-steering range of about 13◦ is covered with theeight beams.
The beam overlap is between −1 dB and −2 dB over the wholebeam-steering range. This beam overlap is well suitable for fine beamsteering or tracking. The −3 dB contours of the measured patterns,shown in Fig. 10, provide a continuous one-dimensional coverage inH-plane direction.
The level of the first few side lobes is increasing as a function ofthe feed offset. Further away from the main beam, the side-lobe levelsstay at around −25 dB to −30 dB. These side-lobe levels are partly dueto fields from the hemielliptical part of the lens, partly due to fields

358 Karttunen et al.
(a) (b)
Figure 11. Measured and simulated normalized H-plane cuts(a) without feed offset and (b) with 36 mm feed offset. The internalreflections are not taken into account in the simulations. The measuredamplitudes are normalized to the maximum of the measured on-axisbeam. The simulated amplitudes are normalized to the maximum ofthe simulated on-axis beam.
leaking out from the cylindrical extension (spillover losses), and alsopartly due to reflected fields. This is better explained by examiningFig. 11, in which the measured and simulated normalized radiationpatterns are presented with feed offsets 0 and 36 mm. In addition, thesimulated patterns with the fields radiated by only the hemiellipticalpart or by only the cylindrical extension part are shown separately.These patterns are simulated, for diagnostic purposes, using the in-house developed ray-tracing program. Radiation patterns with alloffsets are compared similarly (not shown for brevity). The differencebetween the measured and the simulated results can be assumed to bemostly due to reflected fields not included in the simulations. It canbe seen that the main beam and the first side lobes originate from thehemiellipse. Side-lobe levels away from the main beam are stronglyaffected by the spillover losses. With large offsets, the reflectionloss is very high and the reflected fields increase the side-lobe levelssignificantly. To our best knowledge, this kind of detailed explanationof the origin of side lobes has not been presented explicitly previously.
In Figs. 12 and 13, the measured half-power beam-widths(HPBW), main beam amplitudes, directivity, and cross-polarizationare compared to the simulation results with ray tracing with theoptimized eccentricity lens and also with the conventional lens shapes.The measured half-power beam-width in H-plane is 2.5◦ ± 0.2◦ up tothe largest measured beam-steering angle of 30◦. The measured beamwidth is nearly constant and agrees well with the simulated beam width

Progress In Electromagnetics Research B, Vol. 44, 2012 359
(a) (b)
Figure 12. Measured (feed offsets from 0 to 14mm (◦), 8mm to22mm (×), and 22mm to 36 mm(5)) and simulated (lines) H-planehalf-power beam-widths (HPBW) and normalized amplitudes with feedoffsets from 0 to 36mm. The measured amplitudes are normalizedto the maximum of the measured on-axis beam. The simulatedamplitudes are normalized to the maximum of the simulated on-axisbeam of the optimized eccentricity lens. The internal reflections arenot taken into account in the simulations. Extended hemispherical lens(blue), optimized eccentricity lens (red), and conventional ellipticallens (black).
as a function of the main-beam direction as shown in Fig. 12(a)). Withthe extended hemispherical and with the conventional elliptical lensesthe beam-width increases significantly with large beam-steering angles.
The measured normalized maximum main polarization amplitudedecreases about 6 dB, from boresight to 30◦ (Fig. 12(b)). Thesimulated scan loss of about 5 dB agrees well with the measured one.The comparison of the simulated normalized amplitudes, with thedifferent lens shapes, shows that the optimized eccentricity lens hasthe smallest scan loss and the highest amplitude with the large beam-steering angles.
The measured and simulated directivities are compared inFig. 13(a). The measured directivities are calculated only from thelarge near-field scans (500 mm × 500mm). The measured directivitydecreases by about 2 dB from boresight to 20◦–30◦ because of theincreasing side-lobe levels (Figs. 9 and 13). Also, the simulatedreflection loss increases as a function of the beam-steering angle(Fig. 8). Because the internal reflections are not taken into accountin these simulations the ray-tracing simulations do not accurately
360 Karttunen et al.
(a) (b)
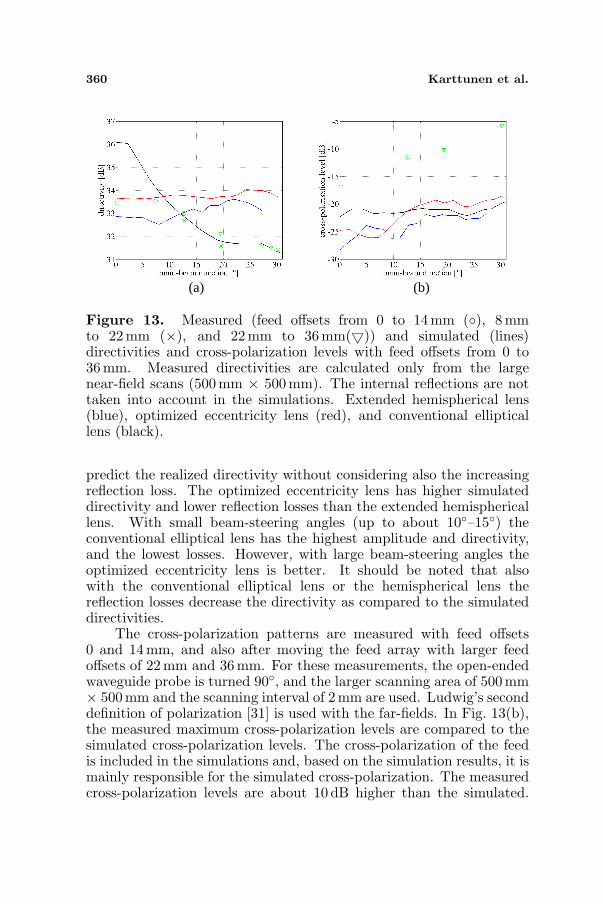
Figure 13. Measured (feed offsets from 0 to 14 mm (◦), 8 mmto 22 mm (×), and 22mm to 36mm(5)) and simulated (lines)directivities and cross-polarization levels with feed offsets from 0 to36mm. Measured directivities are calculated only from the largenear-field scans (500mm × 500mm). The internal reflections are nottaken into account in the simulations. Extended hemispherical lens(blue), optimized eccentricity lens (red), and conventional ellipticallens (black).
predict the realized directivity without considering also the increasingreflection loss. The optimized eccentricity lens has higher simulateddirectivity and lower reflection losses than the extended hemisphericallens. With small beam-steering angles (up to about 10◦–15◦) theconventional elliptical lens has the highest amplitude and directivity,and the lowest losses. However, with large beam-steering angles theoptimized eccentricity lens is better. It should be noted that alsowith the conventional elliptical lens or the hemispherical lens thereflection losses decrease the directivity as compared to the simulateddirectivities.
The cross-polarization patterns are measured with feed offsets0 and 14mm, and also after moving the feed array with larger feedoffsets of 22 mm and 36 mm. For these measurements, the open-endedwaveguide probe is turned 90◦, and the larger scanning area of 500mm× 500mm and the scanning interval of 2mm are used. Ludwig’s seconddefinition of polarization [31] is used with the far-fields. In Fig. 13(b),the measured maximum cross-polarization levels are compared to thesimulated cross-polarization levels. The cross-polarization of the feedis included in the simulations and, based on the simulation results, it ismainly responsible for the simulated cross-polarization. The measuredcross-polarization levels are about 10 dB higher than the simulated.

Progress In Electromagnetics Research B, Vol. 44, 2012 361
This difference is probably due to the internal reflections. Inside the−3 dB contours of the main beam the measured and the simulatedcross-polarization levels are within ±2 dB from each other. The highmeasured levels of cross-polarization are outside the main beam.
4. CONCLUSION
An integrated lens antenna is designed and electrical beam steeringis demonstrated at 77 GHz. An 8-element aperture coupled patchantenna feed array with a switching network is integrated in LTCC.One SPDT and two SP4T PIN-diode switches are used to select theactive element. The feed array is integrated to the bottom of a 100-mmdiameter Rexolite lens. The eccentricity of the lens is optimized withray-tracing simulations for improved beam-steering properties. Theray-tracing result is verified with full-wave FDTD simulations. Thedesigned optimized eccentricity lens is compared with simulations tothe conventional extended hemispherical and elliptical lenses.
The designed antenna is tested with radiation pattern measure-ments using planar near-field scanning. The eight elements are ar-ranged in a linear configuration with a pitch of 2mm, and they pro-vide a continuous coverage in H-plane with beam overlap of −1 dBto −2 dB between adjacent beams. Beam-steering range of about 13◦is covered with the eight beams. Also the wide angle beam-steeringproperties are tested, by manually moving the whole feed array, andbeam-steering angles up to 30◦ are tested. The effects due to the re-flection and the spillover losses are analyzed in detail using both theray-tracing simulation and the measurement results. Side-lobe levelsaway from the main beam are strongly affected by the spillover losses.Because of the internal reflections the side-lobes and cross-polarizationoutside the main-beam region increase compared to the simulation re-sults. These results highlight that the lens shape can be optimizedwith the simple and fast ray-tracing simulations when the reflectionlosses are also taken into account in the comparison of different lensshapes.
The measured directivity decreases by about 2 dB from theboresight up to 20◦–30◦ beam-steering angles due to the increasingreflection losses. The measured scan loss from boresight to 30◦ is about6 dB. The optimized eccentricity lens results in smaller scan loss thanthe conventional low permittivity lenses. The half-power beam-widthin H-plane is 2.5◦ ± 0.2◦ up to the largest measured beam-steeringangle. Good scanning characteristics are obtained with the designedlens for a very wide angular range of ±30◦.

362 Karttunen et al.
ACKNOWLEDGMENT
This work was supported in part by the Academy of Finland throughthe Centre of Excellence program (SMARAD), and Tekes throughBRAWE and BEAMS projects. The authors would like to thankVTT’s LTCC-processing staff, Mr. E. Kahra for his help in mechanicalwork, and Dr. N. T. Nguyen for his help with the FDTD simulations.
REFERENCES
1. Rasshofer, R. R. and K. Naab, “77GHz long range radar systemsstatus, ongoing developments and future challenges,” Proc. 2ndEur. Radar Conf., 161–164, Paris, France, 2005.
2. ETSI-Standard, ETSI EN 302 217-4-2 v1.4.1 (2008-8), FixedRadio Systems; Characteristics and requirements for point-to-point equipment and antennas; Part 4–2: Antennas, 36, 2008.
3. Ala-Laurinaho, J., A. Karttunen, J. Saily, A. Lamminen,R. Sauleau, and A. V. Raisanen, “Mm-wave lens antenna with anintegrated LTCC feed array for beam steering,” Proc. 4th Eur.Conf. Antennas Propag., C09P1-2/1841151, Barcelona, Spain,Apr. 12–16, 2010.
4. Artemenko, A., A. Maltsev, R. Maslennikov, A. Sevastyanov, andV. Ssorin, “Beam steerable quartz integrated lens antenna for60GHz frequency band,” Proc. 5th Eur. Conf. Antennas Propag.,788–792, Rome, Italy, Apr. 11–15, 2011.
5. Filipovic, D. F., G. P. Gauthier, S. Raman, and G. M. Rebeiz,“Off-axis properties of silicon and quartz dielectric lens antennas,”IEEE Trans. Antennas Propag., Vol. 45, No. 5, 760–766,May 1997.
6. Van der Vorst, M. J. M., P. J. I. de Maagt, and M. H. A. J. Herben,“Scan-optimized integrated lens antennas,” Proc. 27th EuropeanMicrowave Conference, 605–610, Jerusalem, Israel, 1997.
7. Karttunen, A., J. Ala-Laurinaho, R. Sauleau, and A. V. Raisanen,“A study of extended hemispherical lenses for a high-gain beam-steering antenna,” Proc. 4th Eur. Conf. Antennas Propag., A25-1/1842008, Barcelona, Spain, Apr. 12–16, 2010.
8. Karttunen, A., J. Ala-Laurinaho, R. Sauleau, and A. V. Raisanen,“Optimal eccentricity of a low permittivity integrated lens for ahigh-gain beam-steering antenna,” Proc. 5th Eur. Conf. AntennasPropag., 3522–3526, Rome, Italy, Apr. 11–15, 2011.
9. Karttunen, A., J. Ala-Laurinaho, R. Sauleau, and A. V. Raisanen,“Reduction of internal reflections in low permittivity integrated

Progress In Electromagnetics Research B, Vol. 44, 2012 363
lens antennas,” Proc. Millimetre Wave Days, Espoo, Finland,May 23–25, 2011.
10. Llombart, N., G. Chattopadhyay, A. Skalare, and I. Mehdi, “Novelterahertz antenna based on a silicon lens fed by a leaky waveenhanced waveguide,” IEEE Trans. Antennas Propag., Vol. 59,No. 6, 2160–2168, Jun. 2011.
11. Godi, G., R. Sauleau, and D. Thouroude, “Performance of reducedsize substrate lens antennas for millimeter-wave communications,”IEEE Trans. Antennas Propag., Vol. 53, No. 4, 1278–1286,Apr. 2005.
12. Wu, X., G. V. Eleftheriades, and T. E. van Deventer-Perkins,“Design and characterization of single- and multiple-beam mm-wave circularly polarized substrate lens antennas for wirelesscommunications,” IEEE Trans. Microwave Theory Tech., Vol. 49,No. 3, 431–441, Mar. 2001.
13. Boriskin, A. V. and R. Sauleau, “Synthesis of arbitrary-shaped lens antennas for beam-switching applications,” Proc.40th European Microwave Conference, 739–742, Paris, France,Sept. 28–30, 2010.
14. Boriskin, A. V. and R. Sauleau, “Lens shaping aimed atimprovement of the beam-switching antenna off-axis properties,”Proc. 2nd Eur. Conf. Antennas Propag., 739–742, Edinburgh, UK,Nov. 11–16, 2007.
15. Van der Vorst, M. J. M., P. J. I. de Maagt, and M. H. A. J. Herben,“Effect of internal reflections on the radiation properties and inputadmittance of integrated lens antennas,” IEEE Trans. MicrowaveTheory Tech., Vol. 47, No. 9, 1696–1704, Sept. 1999.
16. Van der Vorst, M. J. M., P. J. I. de Maagt, A. Neto,A. L. Ryenolds, R. M. Heeres, W. Luinge, and M. H. A. J. Herben,“Effect of internal reflections on the radiation properties andinput admittance of integrated lens antennas comparison betweenmeasurements and theory,” IEEE Trans. Microwave Theory Tech.,Vol. 49, No. 6, 1118–1125, Jun. 2001.
17. Neto, A., A. Toccafondi, and S. Maci, “Mutual coupling betweenslots printed at the back of elliptical dielectric lenses,” IEEETrans. Microwave Theory Tech., Vol. 49, No. 6, 1118–1125,Jun. 2001.
18. Boriskin, A. V., R. Sauleau, and A. I. Nosich, “Performanceof hemielliptic dielectric lens antennas with optimal edgeillumination,” IEEE Trans. Antennas Propag., Vol. 57, No. 7,2193–2198, Jul. 2009.
19. Costa, J. R., M. Silveirinha, and C. A. Fernandes, “Double-shell

364 Karttunen et al.
axial-symmetric imaging lens antenna for space applications,”Antennas and Propagation Society International Symposium,Vol. 1B, 438–441, Jul. 2005.
20. Costa, J. R., M. G. Silveirinha, and C. A. Fernandes, “Evaluationof a double-shell integrated scanning lens antenna,” IEEEAntennas Wireless Propag. Lett., Vol. 8, 781–784, Oct. 2008.
21. Lamminen, A., J. Saily, and A. Vimpari, “Design and processingof 60GHz antennas on low temperature co-fired ceramic (LTCC)substrates,” Proc. 4th ESA Workshop on Millimetre-WaveTechnology and Applications, 43–48, Espoo, Finland, Feb. 15–17,2006.
22. Lamminen, A. E. I., J. Saily, and A. R. Vimpari, “60-GHz patchantennas and arrays on LTCC with embedded-cavity substrates,”IEEE Trans. Antennas Propag., Vol. 56, No. 9, 2865–2874,Sept. 2008.
23. Pursula, P., T. Karttaavi, M. Kantanen, A. Lamminen,J. Holmberg, M. Lahdes, I. Marttila, M. Lahti, A. Luukanen, andT. Vaha-Heikkila, “60-GHz millimeter-wave identification readeron 90-nm CMOS and LTCC,” IEEE Trans. Microwave TheoryTech., Vol. 59, No. 4, 1166–1172, Apr. 2011.
24. Kam, D., D. Liu, A. Natarajan, S. Reynolds, H.-C. Chen,and B. A. Floyd, “LTCC packages with embedded phased-arrayantennas for 60 GHz communications,” IEEE Microwave andWireless Components Letters, Vol. 21, No. 3, 142–144, Mar. 2011.
25. Niciloiu, D., M. Lahti, A. Stefanescu, A. A. Muller, and T. Vaha-Heikkila, “Design and experiments of 77GHz antennas in LTCCtechnology,” Proc. 5th Eur. Conf. Antennas Propag., 253–257,Rome, Italy, Apr. 11–15, 2011.
26. Lamminen, A. and J. Saily, “Wideband stacked patch antennaarray on LTCC for W-band,” Proc. 5th Eur. Conf. AntennasPropag., 2962–2966, Rome, Italy, Apr. 11–15, 2011.
27. Aguirre, J., H.-Y. Pao, H.-S. Lin, P. Garland, D. O’Neil, andK. Horton, “An LTCC 94 GHz antenna array,” IEEE Antennasand Propagation Society International Symposium, San Diego,CA, Jul. 2008.
28. Khalil, A., D. Passerieux, S. Verdeyme, L. Rigaudeau, andD. Baillargeat, “150GHz bandpass filter using LTCC technology,”IEEE Microwave and Wireless Components Letters, Vol. 19, No. 7,455–457, Jul. 2009.
29. Gong, S., H. Shen, and N. S. Baker, “A 60-GHz 2-bit switched-line phase shifter using SP4T RF-MEMS switches,” IEEE Trans.Microwave Theory Tech., Vol. 59, No. 4, 894–900, Apr. 2011.

Progress In Electromagnetics Research B, Vol. 44, 2012 365
30. Hoteit, H., R. Sauleau, B. Philippe, P. Coquet, and J.-P. Daniel,“Vector and parallel implementations for the FDTD analysisof millimeter wave planar antennas,” Int. Journ. of High SpeedComputing, Vol. 10, No. 2, 209–234, Dec. 1999.
31. Ludwig, A. C., “The definition of cross polarization,” IEEE Trans.Antennas Propag., Vol. 21, No. 1, 116–119, Jan. 1973.
32. Holt, F. S. and E. L. Bouche, “A Gregorian corrector for sphericalreflector,” IEEE Trans. Antennas Propag., Vol. 12, No. 1, 44–47,Jan. 1964.
33. Bourreau, D., A. Peden, and S. Le Maguer, “A quasi-optical free-space measurement setup without time-domain gating for materialcharacterization in the W-band,” IEEE Trans. Instrum. Meas.,Vol. 55, No. 6, 2022–2028, Dec. 2006.
34. Chang, P. C. Y., J. G. Walker, and K. I. Hopcraft, “Ray tracingin absorbing media,” Journal of Quantitative Spectroscopy &Radiative Transfer, Vol. 96, 323–341, 2005.