using mobile device samples to estimate traffic volumes · using mobile device samples to estimate...
TRANSCRIPT

Using Mobile Device Samples to Estimate Traffic Volumes
Shawn Turner, Principal InvestigatorTexas A&M Transportation Institute
December 2017
Research ProjectFinal Report 2017-49
• mndot.gov/research

To request this document in an alternative format, such as braille or large print, call 651-366-4718 or 1-800-657-3774 (Greater Minnesota) or email your request to [email protected]. Please request at least one week in advance.

Technical Report Documentation Page 1. Report No. 2. 3. Recipients Accession No.
MN/RC 2017-49
4. Title and Subtitle 5. Report Date
Using Mobile Device Samples to Estimate Traffic Volumes December 2017 6.
7. Author(s) 8. Performing Organization Report No.
Shawn Turner and Pete Koeneman 9. Performing Organization Name and Address 10. Project/Task/Work Unit No.
Texas A&M Transportation Institute 3135 TAMU College Station, Texas 77843-3135
11. Contract (C) or Grant (G) No.
(c) 99007 (wo) 5
12. Sponsoring Organization Name and Address 13. Type of Report and Period Covered
Minnesota Department of Transportation Research Services & Library 395 John Ireland Boulevard, MS 330 St. Paul, Minnesota 55155-1899
Final Report 14. Sponsoring Agency Code
15. Supplementary Notes
http:// mndot.gov/research/reports/2017/201749.pdf 16. Abstract (Limit: 250 words)
In this project, TTI worked with StreetLight Data to evaluate a beta version of its traffic volume estimates derived from global positioning system (GPS)-based mobile devices. TTI evaluated the accuracy of average annual daily traffic (AADT) volume estimates as well as average annual hourly volume (AAHV) estimates from Streetlight Data using actual volume counts from MnDOT traffic monitoring sites. Traffic volume estimation from mobile devices has potential, but analytic enhancements are needed to improve accuracy and granularity of estimated traffic volumes. Some of the AADT volume estimates from StreetLight Data were within acceptable error ranges (10% to 20% absolute percent error), but other estimates were significantly outside this acceptable error range (greater than 100% absolute percent error). Lower volume roadways had the highest errors, presumably due to lower mobile device sample sizes. The AAHV evaluation results at 12 non-public MnDOT sites reinforce the need for analytic improvements, as these results showed higher error (49% mean absolute percent error) than the results at the 69 public permanent sites (39% mean absolute percent error).
17. Document Analysis/Descriptors 18. Availability Statement
Traffic volume, Traffic forecasting, Global Positioning System,
mobile devices, Annual average daily traffic, Accuracy
No restrictions. Document available from:
National Technical Information Services,
Alexandria, Virginia 22312
19. Security Class (this report) 20. Security Class (this page) 21. No. of Pages 22. Price
Unclassified Unclassified 26

USING MOBILE DEVICE SAMPLES TO ESTIMATE TRAFFIC VOLUMES
FINAL REPORT
Prepared by:
Shawn Turner
Pete Koeneman
Texas A&M Transportation Institute
December 2017
Published by:
Minnesota Department of Transportation
Research Services & Library
395 John Ireland Boulevard, MS 330
St. Paul, Minnesota 55155-1899
This report represents the results of research conducted by the authors and does not necessarily represent the views or policies
of the Minnesota Department of Transportation or the Texas A&M Transportation Institute. This report does not contain a
standard or specified technique.
The authors, the Minnesota Department of Transportation, and the Texas A&M Transportation Institute do not endorse
products or manufacturers. Trade or manufacturers’ names appear herein solely because they are considered essential to this
report because they are considered essential to this report.

ACKNOWLEDGMENTS
The Minnesota Department of Transportation (MnDOT) funded the research described in this report.
The authors acknowledge members of the project’s Technical Advisory Panel, who provided valuable
oversight, direction, and feedback:
Mr. Gene Hicks, MnDOT, technical liaison
Ms. Farideh Amiri, MnDOT, project coordinator
Ms. Beth Klemann, MnDOT, project coordinator
Mr. Paul Czech, MnDOT
Mr. Mark Filipi, Metropolitan Council
Mr. Mark Flinner, MnDOT
Mr. Jason Junge, MnDOT
Mr. Brian Kary, MnDOT
Mr. Michael Merrill, MnDOT
Mr. Benjamin Timerson, MnDOT
Mr. Ian Vaagenes, MnDOT
Ms. Mao Yang, MnDOT
At the Texas A&M Transportation Institute, Mr. Shawn Turner and Mr. Pete Koeneman authored the
report. Mr. John Wikander provided valuable initial support with the experimental design, and Ms.
Michelle Young provided support in preparing and formatting technical reports.
The authors acknowledge the participation of StreetLight Data in this research project. In particular, Ms.
Laura Schewel (chief executive officer) and Mr. Paul Friedman (chief technology officer) were especially
helpful in providing access to their data for the purpose of evaluation.
TABLE OF CONTENTS
CHAPTER 1: Introduction ....................................................................................................................1
CHAPTER 2: Development of Traffic Volume Analytics ........................................................................2
CHAPTER 3: Findings: Evaluation of Traffic Volume Estimates ..............................................................3
3.1 Evaluation of AADT Estimates ............................................................................................................ 3
3.2 Evaluation of Annual Average Hourly Volume Estimates ................................................................... 9
CHAPTER 4: Conclusions ................................................................................................................... 13
4.1 Evaluation Results ............................................................................................................................. 13
4.2 Improving Future Evaluations ........................................................................................................... 13
4.3 Other Related Research .................................................................................................................... 14
APPENDIX A: MnDOT Permanent Monitoring Sites Used to Calibrate Streetlight Data Analytics

LIST OF FIGURES
Figure 3.1 Illustration of StreetLight Data “gates” that have been manually re-configured where several
roads are in close proximity. ......................................................................................................................... 4
Figure 3.2 Visual comparison of StreetLight Data AADT Estimates to MnDOT AADT estimates. ................. 5
Figure 3.3 Box-and-whiskers plot for StreetLight Data error, 300 to 5,000 AADT. ...................................... 7
Figure 3.4 Box-and-whiskers plot for StreetLight Data error, 5,000 to 10,000 AADT. ................................. 7
Figure 3.5 Box-and-whiskers plot for StreetLight Data error, 10,00 to 20,000 AADT. ................................. 8
Figure 3.6 Box-and-whiskers plot for StreetLight Data error, 20,000 to 50,000 AADT. ............................... 8
Figure 3.7 Box-and-whiskers plot for StreetLight Data error, Greater than 50,000 AADT. .......................... 9
Figure 3.8 Visual comparison of StreetLight Data average annual hourly volume estimates to comparable
MnDOT volume values (69 permanent sites). ............................................................................................ 10
Figure 3.9 Visual comparison of StreetLight Data average annual day-of-week hourly volume estimates
to comparable MnDOT volume values (12 non-public sites). .................................................................... 11
Figure 3.10 Estimation error by hour of the day and day of week (12 non-public sites). .......................... 12
LIST OF TABLES
Table 3.1 Accuracy Measures for StreetLight Data AADT Estimates ............................................................ 6
Table 3.2 Accuracy measures for StreetLight Data average annual hourly volume estimates (69
permanent sites) ......................................................................................................................................... 10
Table 3.3 Accuracy measures for StreetLight Data average annual hourly volume estimates (12 non-
public sites) ................................................................................................................................................. 12
EXECUTIVE SUMMARY
INTRODUCTION
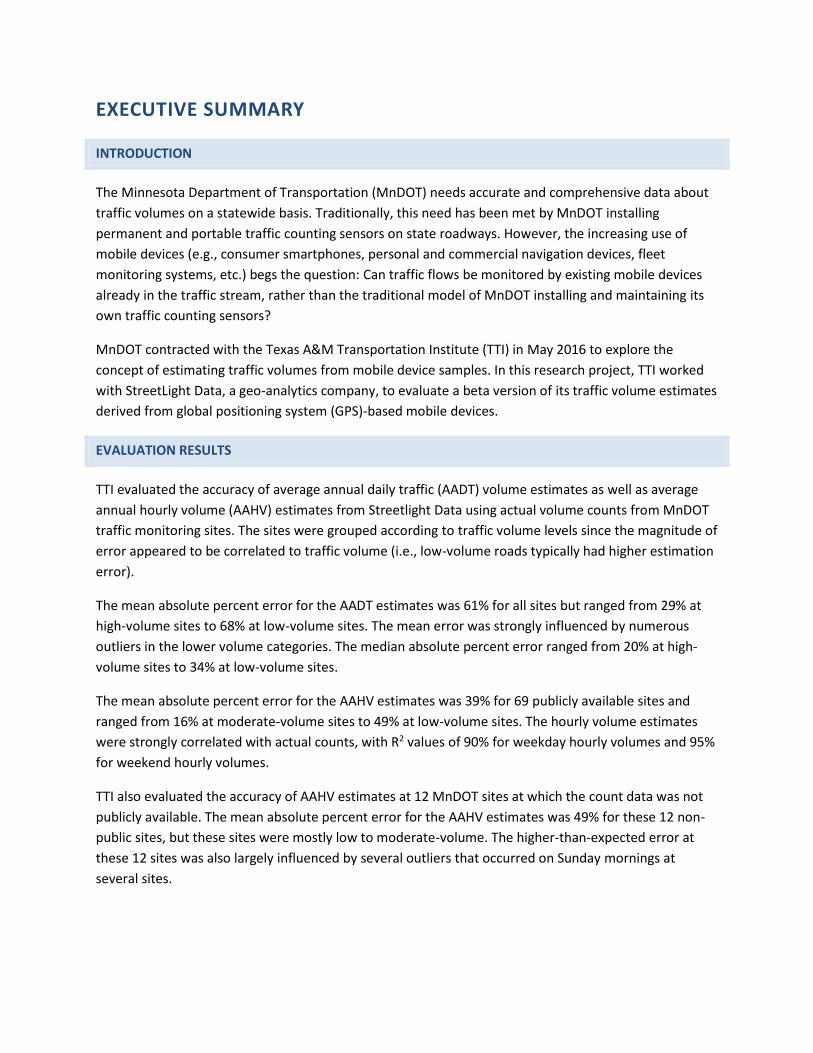
The Minnesota Department of Transportation (MnDOT) needs accurate and comprehensive data about
traffic volumes on a statewide basis. Traditionally, this need has been met by MnDOT installing
permanent and portable traffic counting sensors on state roadways. However, the increasing use of
mobile devices (e.g., consumer smartphones, personal and commercial navigation devices, fleet
monitoring systems, etc.) begs the question: Can traffic flows be monitored by existing mobile devices
already in the traffic stream, rather than the traditional model of MnDOT installing and maintaining its
own traffic counting sensors?
MnDOT contracted with the Texas A&M Transportation Institute (TTI) in May 2016 to explore the
concept of estimating traffic volumes from mobile device samples. In this research project, TTI worked
with StreetLight Data, a geo-analytics company, to evaluate a beta version of its traffic volume estimates
derived from global positioning system (GPS)-based mobile devices.
EVALUATION RESULTS
TTI evaluated the accuracy of average annual daily traffic (AADT) volume estimates as well as average
annual hourly volume (AAHV) estimates from Streetlight Data using actual volume counts from MnDOT
traffic monitoring sites. The sites were grouped according to traffic volume levels since the magnitude of
error appeared to be correlated to traffic volume (i.e., low-volume roads typically had higher estimation
error).
The mean absolute percent error for the AADT estimates was 61% for all sites but ranged from 29% at
high-volume sites to 68% at low-volume sites. The mean error was strongly influenced by numerous
outliers in the lower volume categories. The median absolute percent error ranged from 20% at high-
volume sites to 34% at low-volume sites.
The mean absolute percent error for the AAHV estimates was 39% for 69 publicly available sites and
ranged from 16% at moderate-volume sites to 49% at low-volume sites. The hourly volume estimates
were strongly correlated with actual counts, with R2 values of 90% for weekday hourly volumes and 95%
for weekend hourly volumes.
TTI also evaluated the accuracy of AAHV estimates at 12 MnDOT sites at which the count data was not
publicly available. The mean absolute percent error for the AAHV estimates was 49% for these 12 non-
public sites, but these sites were mostly low to moderate-volume. The higher-than-expected error at
these 12 sites was also largely influenced by several outliers that occurred on Sunday mornings at
several sites.
CONCLUSIONS AND RECOMMENDATIONS
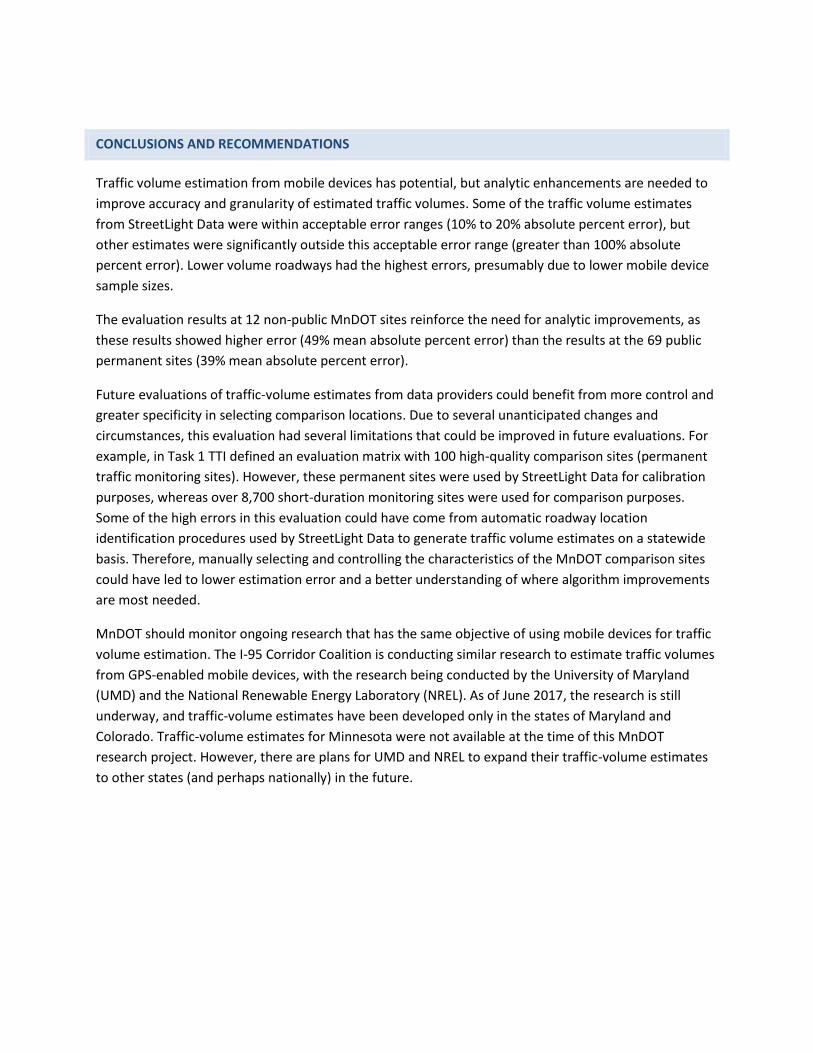
Traffic volume estimation from mobile devices has potential, but analytic enhancements are needed to
improve accuracy and granularity of estimated traffic volumes. Some of the traffic volume estimates
from StreetLight Data were within acceptable error ranges (10% to 20% absolute percent error), but
other estimates were significantly outside this acceptable error range (greater than 100% absolute
percent error). Lower volume roadways had the highest errors, presumably due to lower mobile device
sample sizes.
The evaluation results at 12 non-public MnDOT sites reinforce the need for analytic improvements, as
these results showed higher error (49% mean absolute percent error) than the results at the 69 public
permanent sites (39% mean absolute percent error).
Future evaluations of traffic-volume estimates from data providers could benefit from more control and
greater specificity in selecting comparison locations. Due to several unanticipated changes and
circumstances, this evaluation had several limitations that could be improved in future evaluations. For
example, in Task 1 TTI defined an evaluation matrix with 100 high-quality comparison sites (permanent
traffic monitoring sites). However, these permanent sites were used by StreetLight Data for calibration
purposes, whereas over 8,700 short-duration monitoring sites were used for comparison purposes.
Some of the high errors in this evaluation could have come from automatic roadway location
identification procedures used by StreetLight Data to generate traffic volume estimates on a statewide
basis. Therefore, manually selecting and controlling the characteristics of the MnDOT comparison sites
could have led to lower estimation error and a better understanding of where algorithm improvements
are most needed.
MnDOT should monitor ongoing research that has the same objective of using mobile devices for traffic
volume estimation. The I-95 Corridor Coalition is conducting similar research to estimate traffic volumes
from GPS-enabled mobile devices, with the research being conducted by the University of Maryland
(UMD) and the National Renewable Energy Laboratory (NREL). As of June 2017, the research is still
underway, and traffic-volume estimates have been developed only in the states of Maryland and
Colorado. Traffic-volume estimates for Minnesota were not available at the time of this MnDOT
research project. However, there are plans for UMD and NREL to expand their traffic-volume estimates
to other states (and perhaps nationally) in the future.

1
CHAPTER 1: INTRODUCTION
The Minnesota Department of Transportation (MnDOT) needs accurate and comprehensive data about
traffic volumes on a statewide basis. Traditionally, this need has been met by MnDOT installing
permanent and portable traffic counting sensors on state roadways. However, the increasing use of
mobile devices (e.g., consumer smartphones, personal and commercial navigation devices, fleet
monitoring systems, etc.) begs the question: Can traffic flows be monitored by existing mobile devices
already in the traffic stream, rather than the traditional model of MnDOT installing and maintaining its
own traffic counting sensors?
MnDOT contracted with the Texas A&M Transportation Institute (TTI) in May 2016 to explore the
concept of estimating traffic volumes from mobile device samples. In Task 1 of the research project, TTI
identified several data providers that expressed interest in participating in the research project. All of
the interested companies actively gather, aggregate, and analyze location data from global positioning
system (GPS) mobile devices, and have the necessary mobile device data to estimate traffic volumes.
However, in mid-2016, not all of the companies had a traffic-volume data product for sale (i.e., the
product was still in research and development).
Because multiple companies expressed interest in providing traffic volume estimates in mid-2016, TTI
proposed to be an independent evaluator that would conduct a fair and unbiased assessment of each
data provider’s traffic-volume estimates. The alternative approach was for TTI to work collaboratively
with one of the data providers to develop and evaluate traffic volume estimation methods, but this
approach was initially not selected because of multiple providers’ interest.
By early 2017, two of the three interested data providers had withdrawn from participating in this
research project. Their rationale was that, although they were developing a traffic-volume data product,
they did not feel that it was ready for rigorous publicly reported testing and evaluation. Therefore, after
discussions with the MnDOT Technical Advisory Panel, TTI pursued the alternative approach of working
collaboratively with a single data provider ─ StreetLight Data ─ to develop and evaluate traffic volume
estimates from GPS-based mobile device samples.
The rest of this report documents the analysis conducted to develop and evaluate the traffic-volume
estimates from StreetLight Data. Also, Streetlight Data publicly announced the availability of its traffic
volume product on June 6, 2017, (http://blog.streetlightdata.com/introducing-streetlight-volume-2016-
aadt-metrics). The launch of this product was due, in part, to the development and evaluation activities
in this MnDOT research project.

2
CHAPTER 2: DEVELOPMENT OF TRAFFIC VOLUME ANALYTICS
In Task 3, Streetlight Data was responsible for developing nearly all of the analytics for estimating traffic
volumes at no cost to this MnDOT research project. TTI did provide MnDOT traffic count data for model
calibration purposes, as well as several suggestions for possibly enhancing the analytics. Therefore, the
details of the traffic volume estimation models are the intellectual property of StreetLight Data and
considered confidential. However, StreetLight Data has provided information on their overall approach
to traffic volume estimation.
The Streetlight Data approach can be summarized in the following three generalized steps:
1. Combine GPS-enabled navigation data with location based services (LBS) data. These are two distinct datasets that StreetLight Data aggregates from source data providers, and more details on these two datasets are available on their web site.
2. Normalize GPS and LBS mobile device data by US Census population estimates. This provides the first scaling factor that attempts to account for the mobile device sampling.
3. Calibrate the mobile device samples using public agency traffic volume sources. This provides the second scaling factor that attempts to account for the mobile device scaling. The public agency traffic volumes typically come from permanent traffic monitoring sites, where there is greatest confidence in the traffic volume accuracy.
Analysts at StreetLight Data applied these three steps to develop traffic volume estimates for the
MnDOT research project. TTI received the traffic volume estimates once they had been generated by
StreetLight Data. Therefore, TTI was not involved in using or applying StreetLight Data’s proprietary
analytics to generate the traffic volume estimates.
StreetLight Data used traffic counts from 69 MnDOT permanent monitoring sites to calibrate the mobile
device samples (Step 3 from above). These MnDOT locations had originally been identified by TTI for the
purposes of evaluation/validation, since these 69 locations represented an ideal mix of location types,
functional classes, and traffic volume levels (see Appendix A). Permanent monitoring sites with annual
average daily traffic (AADT) volumes less than 300 vehicles per day were removed from the calibration
dataset, due to very low mobile device sample sizes and correspondingly poor prediction results in
subsequent steps.
StreetLight Data did provide TTI with unscaled and uncalibrated sample sizes to corroborate their
analytic process. At the 69 MnDOT locations, the correlation between the MnDOT AADT values and
StreetLight Data’s unscaled and uncalibrated sample sizes was 79% (R2=0.79). StreetLight Data’s scaling
and calibration process improved the correlation to 85% (R2=0.85).
3
CHAPTER 3: FINDINGS: EVALUATION OF TRAFFIC VOLUME
ESTIMATES
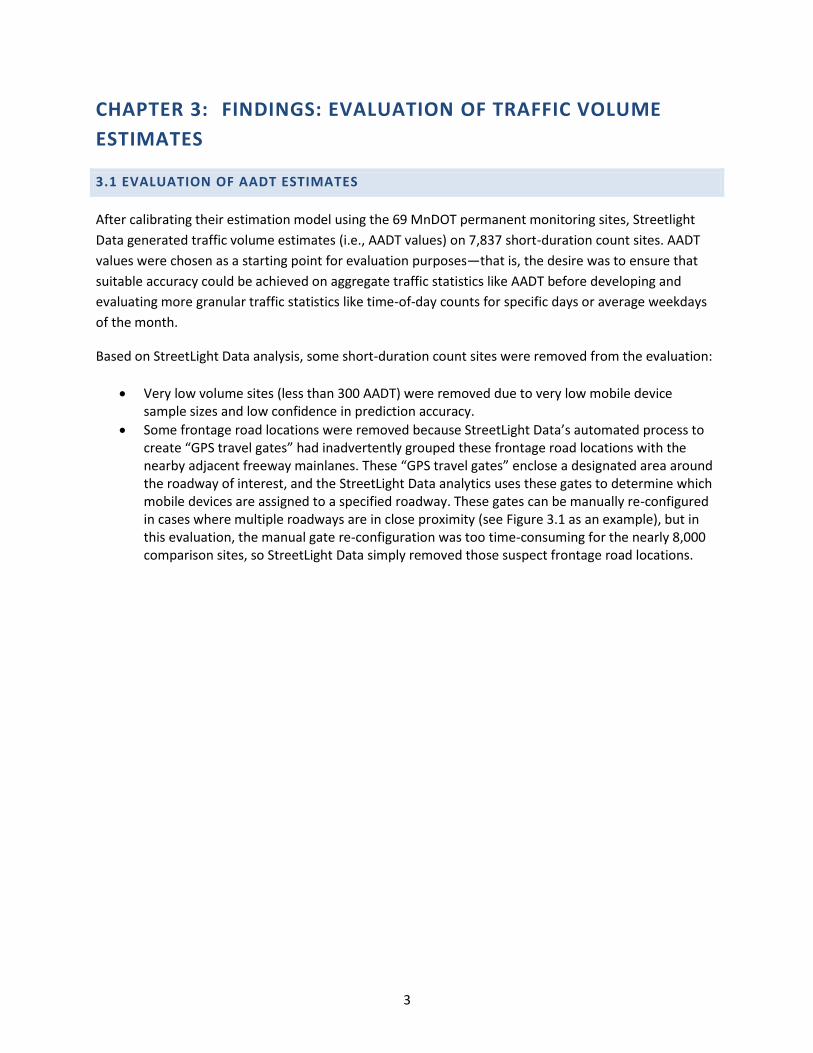
3.1 EVALUATION OF AADT ESTIMATES
After calibrating their estimation model using the 69 MnDOT permanent monitoring sites, Streetlight
Data generated traffic volume estimates (i.e., AADT values) on 7,837 short-duration count sites. AADT
values were chosen as a starting point for evaluation purposes—that is, the desire was to ensure that
suitable accuracy could be achieved on aggregate traffic statistics like AADT before developing and
evaluating more granular traffic statistics like time-of-day counts for specific days or average weekdays
of the month.
Based on StreetLight Data analysis, some short-duration count sites were removed from the evaluation:
Very low volume sites (less than 300 AADT) were removed due to very low mobile device sample sizes and low confidence in prediction accuracy.
Some frontage road locations were removed because StreetLight Data’s automated process to create “GPS travel gates” had inadvertently grouped these frontage road locations with the nearby adjacent freeway mainlanes. These “GPS travel gates” enclose a designated area around the roadway of interest, and the StreetLight Data analytics uses these gates to determine which mobile devices are assigned to a specified roadway. These gates can be manually re-configured in cases where multiple roadways are in close proximity (see Figure 3.1 as an example), but in this evaluation, the manual gate re-configuration was too time-consuming for the nearly 8,000 comparison sites, so StreetLight Data simply removed those suspect frontage road locations.

4
Figure 3.1 Illustration of StreetLight Data “gates” that have been manually re-configured where several roads
are in close proximity.
5
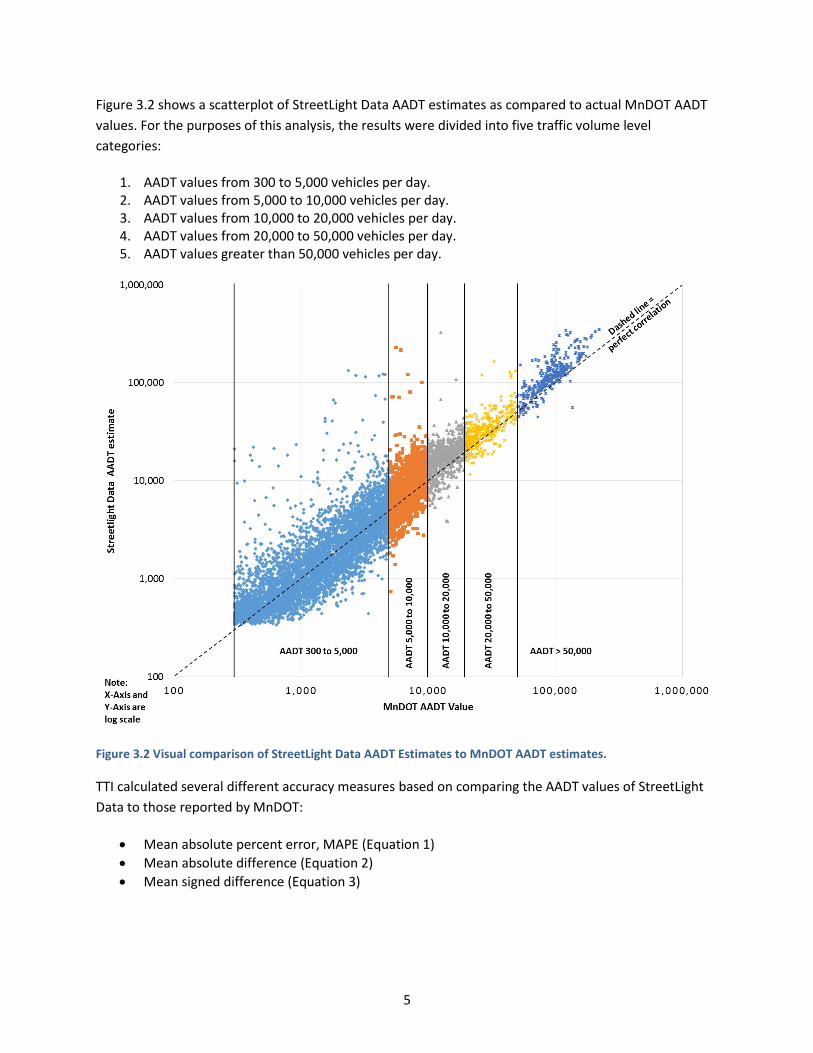
Figure 3.2 shows a scatterplot of StreetLight Data AADT estimates as compared to actual MnDOT AADT
values. For the purposes of this analysis, the results were divided into five traffic volume level
categories:
1. AADT values from 300 to 5,000 vehicles per day. 2. AADT values from 5,000 to 10,000 vehicles per day. 3. AADT values from 10,000 to 20,000 vehicles per day. 4. AADT values from 20,000 to 50,000 vehicles per day. 5. AADT values greater than 50,000 vehicles per day.
Figure 3.2 Visual comparison of StreetLight Data AADT Estimates to MnDOT AADT estimates.
TTI calculated several different accuracy measures based on comparing the AADT values of StreetLight
Data to those reported by MnDOT:
Mean absolute percent error, MAPE (Equation 1)
Mean absolute difference (Equation 2)
Mean signed difference (Equation 3)
6
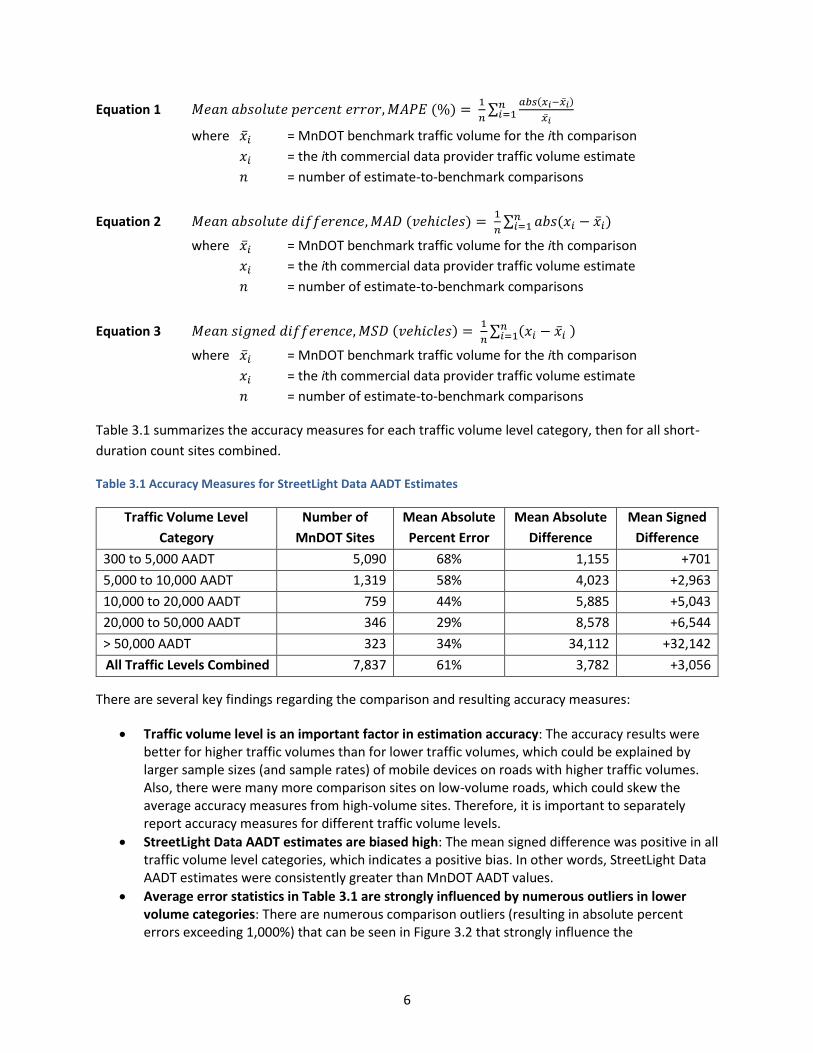
Equation 1 𝑀𝑒𝑎𝑛 𝑎𝑏𝑠𝑜𝑙𝑢𝑡𝑒 𝑝𝑒𝑟𝑐𝑒𝑛𝑡 𝑒𝑟𝑟𝑜𝑟, 𝑀𝐴𝑃𝐸 (%) = 1
𝑛∑
𝑎𝑏𝑠(𝑥𝑖−�̅�𝑖)
�̅�𝑖
𝑛𝑖=1
where �̅�𝑖 = MnDOT benchmark traffic volume for the ith comparison
𝑥𝑖 = the ith commercial data provider traffic volume estimate
𝑛 = number of estimate-to-benchmark comparisons
Equation 2 𝑀𝑒𝑎𝑛 𝑎𝑏𝑠𝑜𝑙𝑢𝑡𝑒 𝑑𝑖𝑓𝑓𝑒𝑟𝑒𝑛𝑐𝑒, 𝑀𝐴𝐷 (𝑣𝑒ℎ𝑖𝑐𝑙𝑒𝑠) = 1
𝑛∑ 𝑎𝑏𝑠(𝑥𝑖 − �̅�𝑖)𝑛
𝑖=1
where �̅�𝑖 = MnDOT benchmark traffic volume for the ith comparison
𝑥𝑖 = the ith commercial data provider traffic volume estimate
𝑛 = number of estimate-to-benchmark comparisons
Equation 3 𝑀𝑒𝑎𝑛 𝑠𝑖𝑔𝑛𝑒𝑑 𝑑𝑖𝑓𝑓𝑒𝑟𝑒𝑛𝑐𝑒, 𝑀𝑆𝐷 (𝑣𝑒ℎ𝑖𝑐𝑙𝑒𝑠) = 1
𝑛∑ (𝑥𝑖 − �̅�𝑖 )𝑛
𝑖=1
where �̅�𝑖 = MnDOT benchmark traffic volume for the ith comparison
𝑥𝑖 = the ith commercial data provider traffic volume estimate
𝑛 = number of estimate-to-benchmark comparisons
Table 3.1 summarizes the accuracy measures for each traffic volume level category, then for all short-
duration count sites combined.
Table 3.1 Accuracy Measures for StreetLight Data AADT Estimates
Traffic Volume Level
Category
Number of
MnDOT Sites
Mean Absolute
Percent Error
Mean Absolute
Difference
Mean Signed
Difference
300 to 5,000 AADT 5,090 68% 1,155 +701
5,000 to 10,000 AADT 1,319 58% 4,023 +2,963
10,000 to 20,000 AADT 759 44% 5,885 +5,043
20,000 to 50,000 AADT 346 29% 8,578 +6,544
> 50,000 AADT 323 34% 34,112 +32,142
All Traffic Levels Combined 7,837 61% 3,782 +3,056
There are several key findings regarding the comparison and resulting accuracy measures:
Traffic volume level is an important factor in estimation accuracy: The accuracy results were better for higher traffic volumes than for lower traffic volumes, which could be explained by larger sample sizes (and sample rates) of mobile devices on roads with higher traffic volumes. Also, there were many more comparison sites on low-volume roads, which could skew the average accuracy measures from high-volume sites. Therefore, it is important to separately report accuracy measures for different traffic volume levels.
StreetLight Data AADT estimates are biased high: The mean signed difference was positive in all traffic volume level categories, which indicates a positive bias. In other words, StreetLight Data AADT estimates were consistently greater than MnDOT AADT values.
Average error statistics in Table 3.1 are strongly influenced by numerous outliers in lower volume categories: There are numerous comparison outliers (resulting in absolute percent errors exceeding 1,000%) that can be seen in Figure 3.2 that strongly influence the
7
average/mean error statistics in Table 3.1. For example, the median absolute percent error is markedly lower for the same categories as shown in Table 3.1:
o 300 to 5,000 AADT: 31% median absolute percent error o 5,000 to 10,000 AADT: 34% median absolute percent error o 10,000 to 20,000 AADT: 33% median absolute percent error o 20,00 to 50,000 AADT: 20% median absolute percent error o > 50,000 AADT: 23% median absolute percent error
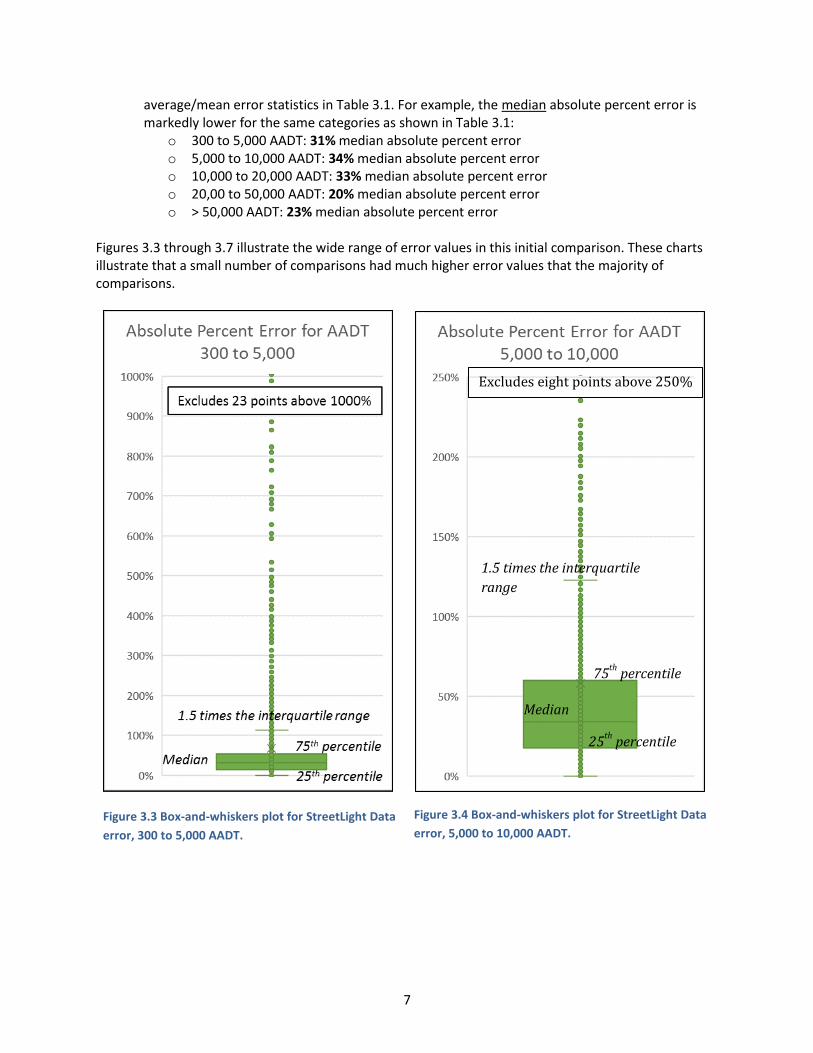
Figures 3.3 through 3.7 illustrate the wide range of error values in this initial comparison. These charts illustrate that a small number of comparisons had much higher error values that the majority of comparisons.
Figure 3.3 Box-and-whiskers plot for StreetLight Data
error, 300 to 5,000 AADT.
Figure 3.4 Box-and-whiskers plot for StreetLight Data
error, 5,000 to 10,000 AADT.
Excludes eight points above 250%
75th
percentile
25th
percentile
Median
1.5 times the interquartile
range

8
Figure 3.5 Box-and-whiskers plot for StreetLight Data
error, 10,00 to 20,000 AADT.
Figure 3.6 Box-and-whiskers plot for StreetLight Data
error, 20,000 to 50,000 AADT.
9
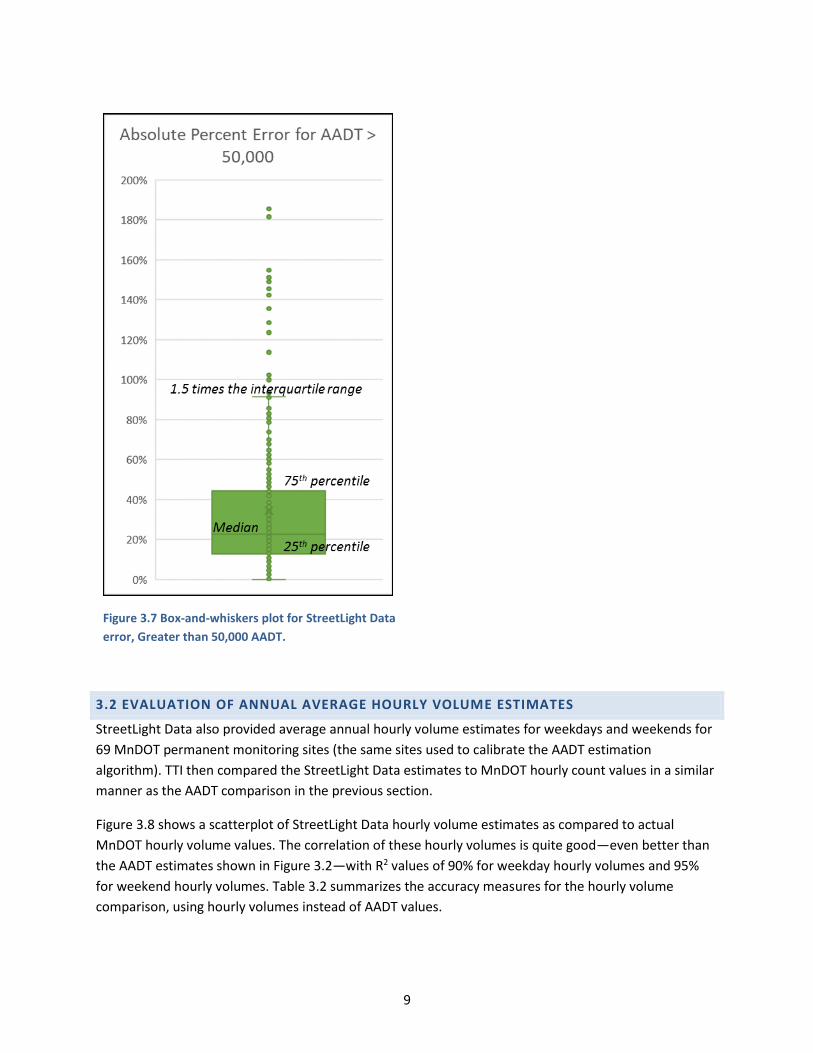
Figure 3.7 Box-and-whiskers plot for StreetLight Data
error, Greater than 50,000 AADT.
3.2 EVALUATION OF ANNUAL AVERAGE HOURLY VOLUME ESTIMATES
StreetLight Data also provided average annual hourly volume estimates for weekdays and weekends for
69 MnDOT permanent monitoring sites (the same sites used to calibrate the AADT estimation
algorithm). TTI then compared the StreetLight Data estimates to MnDOT hourly count values in a similar
manner as the AADT comparison in the previous section.
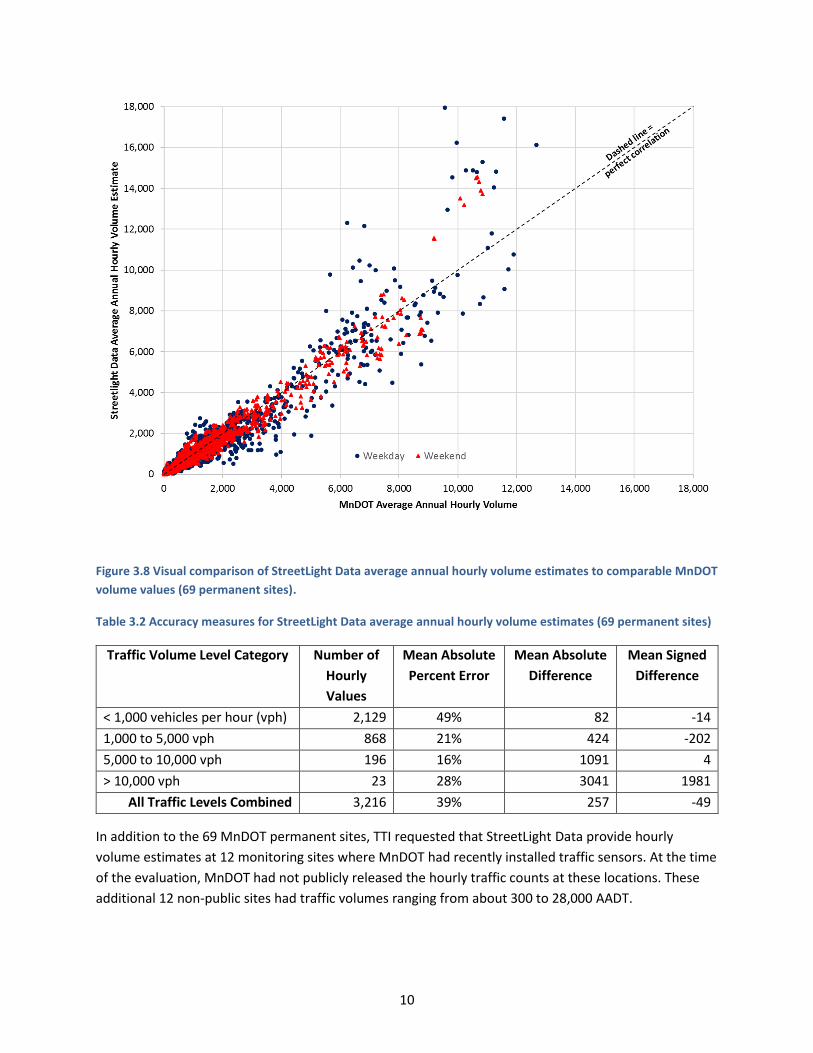
Figure 3.8 shows a scatterplot of StreetLight Data hourly volume estimates as compared to actual
MnDOT hourly volume values. The correlation of these hourly volumes is quite good—even better than
the AADT estimates shown in Figure 3.2—with R2 values of 90% for weekday hourly volumes and 95%
for weekend hourly volumes. Table 3.2 summarizes the accuracy measures for the hourly volume
comparison, using hourly volumes instead of AADT values.
10
Figure 3.8 Visual comparison of StreetLight Data average annual hourly volume estimates to comparable MnDOT
volume values (69 permanent sites).
Table 3.2 Accuracy measures for StreetLight Data average annual hourly volume estimates (69 permanent sites)
Traffic Volume Level Category Number of
Hourly
Values
Mean Absolute
Percent Error
Mean Absolute
Difference
Mean Signed
Difference
< 1,000 vehicles per hour (vph) 2,129 49% 82 -14
1,000 to 5,000 vph 868 21% 424 -202
5,000 to 10,000 vph 196 16% 1091 4
> 10,000 vph 23 28% 3041 1981
All Traffic Levels Combined 3,216 39% 257 -49
In addition to the 69 MnDOT permanent sites, TTI requested that StreetLight Data provide hourly
volume estimates at 12 monitoring sites where MnDOT had recently installed traffic sensors. At the time
of the evaluation, MnDOT had not publicly released the hourly traffic counts at these locations. These
additional 12 non-public sites had traffic volumes ranging from about 300 to 28,000 AADT.
11
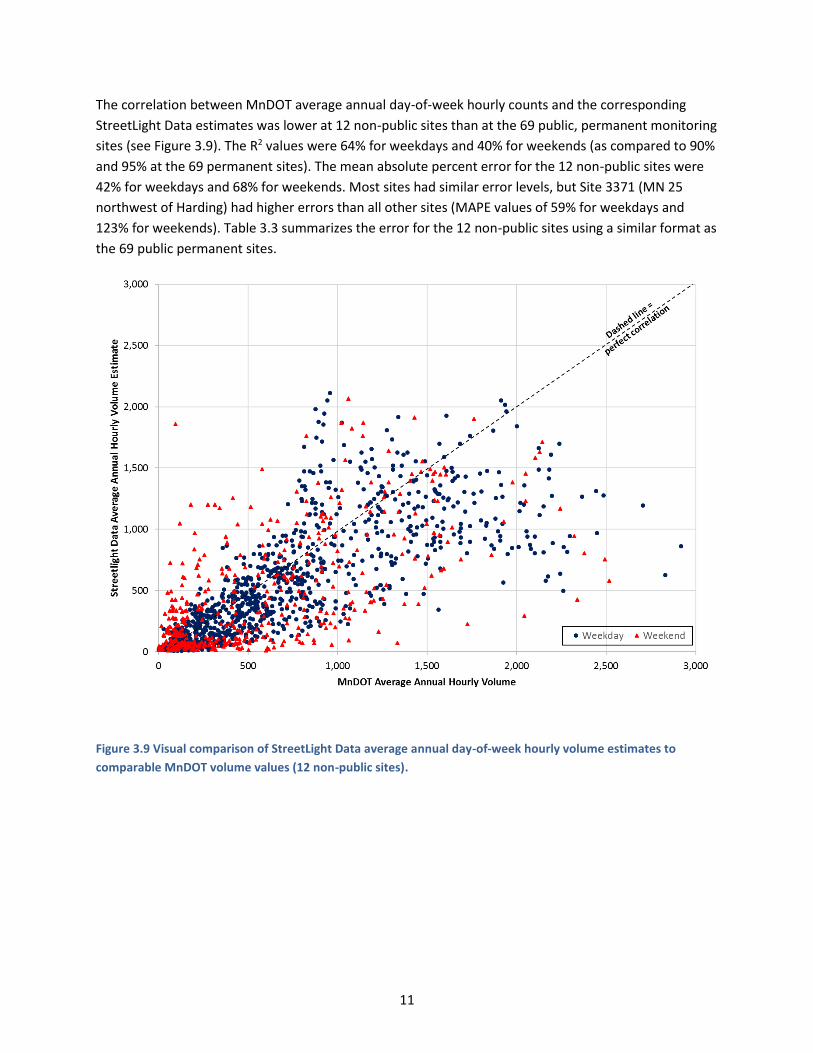
The correlation between MnDOT average annual day-of-week hourly counts and the corresponding
StreetLight Data estimates was lower at 12 non-public sites than at the 69 public, permanent monitoring
sites (see Figure 3.9). The R2 values were 64% for weekdays and 40% for weekends (as compared to 90%
and 95% at the 69 permanent sites). The mean absolute percent error for the 12 non-public sites were
42% for weekdays and 68% for weekends. Most sites had similar error levels, but Site 3371 (MN 25
northwest of Harding) had higher errors than all other sites (MAPE values of 59% for weekdays and
123% for weekends). Table 3.3 summarizes the error for the 12 non-public sites using a similar format as
the 69 public permanent sites.
Figure 3.9 Visual comparison of StreetLight Data average annual day-of-week hourly volume estimates to
comparable MnDOT volume values (12 non-public sites).

12
Table 3.3 Accuracy measures for StreetLight Data average annual hourly volume estimates (12 non-public sites)
Traffic Volume Level Category Number of
Hourly Values
Mean Absolute
Percent Error
Mean Absolute
Difference
Mean Signed
Difference
< 1,000 vehicles per hour
(vph) 1,247 53% 165 -63
1,000 to 5,000 vph 334 34% 535 -433
5,000 to 10,000 vph 0 - - -
> 10,000 vph 0 - - -
All Traffic Levels Combined 1,581 49% 243 -141
The analysis at these 12 sites did reveal an oddity—all non-public sites displayed much higher than
average estimation error on several hours on Sunday morning (see Figure 3.10). The cause of this much
higher error is not understood at this time. However, even if one disregards this Sunday morning oddity,
the average error value is 44% for all other days of the week and hours of the day (ranging from 17% to
79% for specific hours and days).
Figure 3.10 Estimation error by hour of the day and day of week (12 non-public sites).

13
CHAPTER 4: CONCLUSIONS
This report summarized one of the first attempts to estimate total traffic volumes from mobile device
samples on a statewide basis. Despite the withdrawal of two data providers that had tentatively agreed
to participate in the project, TTI was still able to work with StreetLight Data to evaluate traffic volume
estimates generated from its analytics. Most recently, Streetlight Data publicly announced the
availability of its traffic volume product on June 6, 2017, (http://blog.streetlightdata.com/introducing-
streetlight-volume-2016-aadt-metrics). The launch of this product was due, in part, to the development
and evaluation activities in this MnDOT research project. The following sections provide conclusions for
this research project.
4.1 EVALUATION RESULTS
Traffic volume estimation from mobile devices has potential, but analytic enhancements are needed to
improve accuracy and granularity of estimated traffic volumes. Some of the traffic-volume estimates
from StreetLight Data were within acceptable error ranges (10% to 20% absolute percent error), but
other estimates were significantly outside this acceptable error range (greater than 100% absolute
percent error). Lower volume roadways had the highest errors, presumably due to lower mobile device
sample sizes.
Also, in this evaluation, StreetLight Data provided AADT and average annual hourly volume estimates for
comparison to MnDOT traffic volumes. While AADT values are a very common traffic count statistic used
in transportation planning, there is also a demand for more granular traffic volume data in many
applications. However, it is expected that the analytics to estimate more granular traffic volumes will
develop in the future.
The evaluation results at 12 non-public MnDOT sites reinforce the need for analytic improvements, as
these results showed higher error (49% mean absolute percent error) than the results at the 69 public
permanent sites (39% mean absolute percent error).
4.2 IMPROVING FUTURE EVALUATIONS
Future evaluations of traffic volume estimates from data providers could benefit from more control and
greater specificity in selecting comparison locations. Due to several unanticipated changes and
circumstances, this evaluation had several limitations that could be improved in future evaluations. For
example, in Task 1, TTI defined an evaluation matrix with 100 high-quality comparison sites (permanent
traffic monitoring sites). However, these permanent sites were used by StreetLight Data for calibration
purposes, whereas over 8,700 short-duration monitoring sites were used for comparison purposes.
Some of the high errors in this evaluation could have come from automatic roadway location
identification procedures used by StreetLight Data to generate traffic volume estimates on a statewide
basis. Therefore, manually selecting and controlling the characteristics of the MnDOT comparison sites
could have led to lower estimation error and a better understanding of where algorithm improvements
are most needed.

14
4.3 OTHER RELATED RESEARCH
The I-95 Corridor Coalition is conducting similar research to estimate traffic volumes from GPS-enabled
mobile devices, with the research being conducted by the University of Maryland (UMD) and the
National Renewable Energy Laboratory (NREL).1 As of June 2017, the research is still underway and
traffic volume estimates have been developed only in the states of Maryland and Colorado. Traffic
volume estimates for Minnesota were not available at the time of this MnDOT research project.
However, there are plans for UMD and NREL to expand their traffic volume estimates to other states
(and perhaps nationally) in the future.
1 Select Volume and Turning Mvmt Project tab at http://i95coalition.org/projects/vehicle-probe-project/.

APPENDIX A:
MNDOT PERMANENT MONITORING SITES USED TO CALIBRATE
STREETLIGHT DATA ANALYTICS

A-1
Location Category Traffic Volume
Category
MnDOT Site ID 2015 AADT Value
Urban, Typical Grid Medium 36 39,557
39 10,624
45 12,105
103 46,839
110 24,769
191 44,426
208 29,827
212 26,597
335 47,344
352 34,217
365 41,523
384 28,995
388 20,097
390 9,716
402 19,902
407 16,662
425 21,990
High 40 52,679
301 154,695
303 122,659
315 120,436
341 76,817
354 82,853
Urban, Interchanges or
Closely Spaced
Roadways
Medium 38 36,381
389 41,268
420 29,200
High 305 104,928
309 100,891
321 144,576
342 116,199
405 90,603
Rural, Major Roads Low 27 4,884
34 3,198
170 4,015
179 2,170

A-2
Location Category Traffic Volume
Category
MnDOT Site ID 2015 AADT Value
Rural, Major Roads Low 198 2,867
210 1,141
211 3,695
219 3,793
220 1,977
221 2,992
223 4,313
225 2,855
Medium 26 20,061
29 8,355
33 5,176
35 5,902
42 32,028
43 17,095
164 8,828
175 23,709
187 21,383
200 44,899
204 10,632
227 9,399
353 22,069
381 12,740
382 30,341
Rural, Minor Roads Low 41 426
51 496
56 353
199 1,487
209 638
214 404
218 859
222 1,743
228 736
229 1,115
232 317