using mechanobiological mimicry of red blood cells to extend
TRANSCRIPT

Using mechanobiological mimicry of red blood cellsto extend circulation times of hydrogel microparticlesTimothy J. Merkela, Stephen W. Jonesb, Kevin P. Herlihya, Farrell R. Kerseyc, Adam R. Shieldsd, Mary Napiera,c,e,f,J. Christopher Lufta,c,e,f, Huali Wug, William C. Zambonic,e,g,h, Andrew Z. Wangc,James E. Bearb,c,i, and Joseph M. DeSimonea,c,e,f,g,j,k,l,1
aDepartment of Chemistry, bCell and Developmental Biology, cLineberger Comprehensive Cancer Center, dPhysics, eCarolina Center of CancerNanotechnology Excellence, fInstitute for Nanomedicine, gEschelman School of Pharmacy, hInstitute for Pharmacogenomics and Individualized Therapy,iHoward Hughes Medical Institute, jInstitute for Advanced Materials, University of North Carolina, Chapel Hill, NC 27599; kDepartment of Chemical andBiomolecular Engineering, North Carolina State University, Raleigh, NC 27695; and lSloan–Kettering Institute for Cancer Research,Memorial Sloan–Kettering Cancer Center, 1275 York Avenue, New York, NY 10065
Edited by Chad A. Mirkin, Northwestern University, Evanston, IL, and approved November 22, 2010 (received for review July 9, 2010)
It has long been hypothesized that elastic modulus governs thebiodistribution and circulation times of particles and cells in blood;however, this notion has never been rigorously tested. We synthe-sized hydrogel microparticles with tunable elasticity in the physio-logical range, which resemble red blood cells in size and shape,and tested their behavior in vivo. Decreasing the modulus of theseparticles altered their biodistribution properties, allowing them tobypass several organs, such as the lung, that entrapped their morerigid counterparts, resulting in increasingly longer circulation timeswell past those of conventional microparticles. An 8-fold decreasein hydrogel modulus correlated to a greater than 30-fold increase inthe elimination phase half-life for these particles. These results de-monstrate a critical design parameter for hydrogel microparticles.
biomimetic ∣ deformability ∣ drug carriers ∣ long circulating ∣red blood cell mimic
The ability of mammalian cells to contract or stretch stronglyinfluences their motility and biodistribution (1). The extraor-
dinary flexibility of mammalian RBCs enables them to deformmany thousands of times during their long lives in the circulationwith up to 100% strain (2) as they pass through restrictions in thevasculature that is smaller than their diameter. During their 120-dlifetime, RBCs experience chemical changes to their membranestructure, rendering them less flexible, and leading to theirremoval from the circulation via splenic filtration (3). BeyondRBCs, cancer cells, especially metastatic cancer cells, are elasti-cally softer than healthy cells, a characteristic that is believed tobe integral to their ability to spread to new locations (1, 4).Although much attention has been directed toward the enhance-ment of the circulation time of particles, including alterations ofparticle size (5, 6), shape (7–9), and surface characteristics (10),the role played by deformability in the in vivo circulation profileof particles has not been well explored.
Though particle size has long been considered dominant indetermining in vivo behaviors such as circulation time and biodis-tribution profile, it stands to reason that physical filtrationbarriers in the body could be navigated by larger, but more de-formable particles (11, 12). Deformable particles that resembledRBCs in size and shape have been shown to deform in restrictedchannels (13) or capillaries (14) that were smaller than theparticle diameter, though the modulus of these particles was notcharacterized (13) or was poorly matched to RBCs (14) and wasrestricted to in vitro testing in both cases. In a simulation of renalfiltration of soft particles, microgels translocated through poresthat were 1∕10th of the particle diameter under physiologicallyrelevant pressures (15). Filamentous worm-like micelles werefound to have increased circulation times with respect to theirspherical counterparts, though this effect was attributed to thesize and shape of these particles as well as the deformability (8).Inspired by nature’s example of long-circulating microparticles,
we sought to mimic the size and shape of RBCs while varyingthe modulus across a physiologically relevant range to probe thephysical barriers encountered in vivo by soft microparticles. Herewe show that increasing the deformability of RBC-sized particlesincreased their circulation times beyond that of conventionalmicroparticles and significantly altered their biodistributions.We found that, as a consequence of their low modulus, these dis-coid microparticles bypassed several in vivo filtration mechan-isms, illustrated by animal survival and dramatic increases inelimination half-lives of particles with decreasing modulus. Suchdeformable and long-circulating particles may find utility in thefields of drug delivery and medical imaging, where long-circula-tion times and varied biodistributions are often desirable charac-teristics (6, 16, 17). Further, we expect these results will stand asan introduction for particle deformability as a vital design para-meter that can affect the behavior of particles on both the micro-and nanoscales.
Results and DiscussionFabrication of Red Blood Cell Mimics (RBCMs). The particle replica-tion in nonwetting templates (PRINT®) technique that hasbeen developed in our laboratory allows for the fabrication ofnonspherical, shape-specific particles through use of elastomericfluoropolymer molds (18, 19). Using PRINT, we fabricated par-ticles with similar size, shape, and deformability characteristics asRBCs (Fig. 1). In this study we chose to model the 6-μm diametermouse RBC (20) and observe the in vivo behavior of the RBCMs.Although the distinctive biconcave discoidal shape of matureRBCs is generally conserved throughout the animal kingdom,mouse RBCs (6-μm diameter) are slightly smaller than theirhuman counterparts (8-μm diameter) (20). Many hydrogels exhi-bit excellent biocompatibility (21), with their swelling anddeformability controllable by varying the amount of cross-linkingin the gel (22). We used hydrogels composed primarily of 2-hy-droxyethyl acrylate (HEA) that were lightly (1–10%, by weight)cross-linked with poly(ethylene glycol) diacrylate (PEGDA,MW ¼ 4;000 g∕mol) with a photoinitiator (1-hydroxycyclohexyl
Author contributions: T.J.M., S.W.J., A.R.S., M.N., A.Z.W., J.E.B., and J.M.D. designedresearch; T.J.M., S.W.J., K.P.H., F.R.K., A.R.S., and J.C.L. performed research; T.J.M., H.W.,and W.C.Z. analyzed data; J.E.B. contributed new reagents/analytic tools; and T.J.M. wrotethe paper.
Conflict of interest statement: The authors declare competing financial interest. JosephDeSimone is a founder, member of the board of directors, and maintains a financialinterest in Liquidia Technologies. Liquidia was founded in 2004 to commercialize PRINTtechnology and other discoveries of Professor Joseph DeSimone and colleagues at theUniversity of North Carolina, Chapel Hill.
This article is a PNAS Direct Submission.1To whom correspondence should be addressed at: 257 Caudill Labs, The University ofNorth Carolina at Chapel Hill, Department of Chemistry, CB#3290, Chapel Hill, NC27599-3290. E-mail: [email protected].
This article contains supporting information online at www.pnas.org/lookup/suppl/doi:10.1073/pnas.1010013108/-/DCSupplemental.
586–591 ∣ PNAS ∣ January 11, 2011 ∣ vol. 108 ∣ no. 2 www.pnas.org/cgi/doi/10.1073/pnas.1010013108
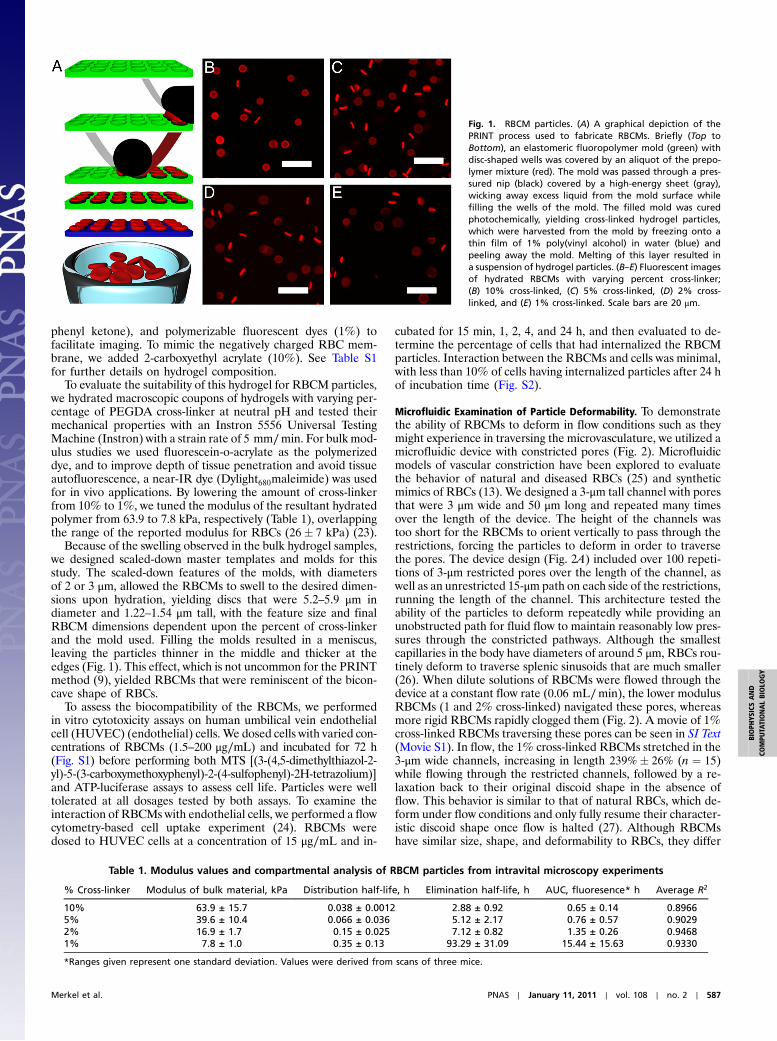
phenyl ketone), and polymerizable fluorescent dyes (1%) tofacilitate imaging. To mimic the negatively charged RBC mem-brane, we added 2-carboxyethyl acrylate (10%). See Table S1for further details on hydrogel composition.
To evaluate the suitability of this hydrogel for RBCM particles,we hydrated macroscopic coupons of hydrogels with varying per-centage of PEGDA cross-linker at neutral pH and tested theirmechanical properties with an Instron 5556 Universal TestingMachine (Instron) with a strain rate of 5 mm∕min. For bulk mod-ulus studies we used fluorescein-o-acrylate as the polymerizeddye, and to improve depth of tissue penetration and avoid tissueautofluorescence, a near-IR dye (Dylight680maleimide) was usedfor in vivo applications. By lowering the amount of cross-linkerfrom 10% to 1%, we tuned the modulus of the resultant hydratedpolymer from 63.9 to 7.8 kPa, respectively (Table 1), overlappingthe range of the reported modulus for RBCs (26� 7 kPa) (23).
Because of the swelling observed in the bulk hydrogel samples,we designed scaled-down master templates and molds for thisstudy. The scaled-down features of the molds, with diametersof 2 or 3 μm, allowed the RBCMs to swell to the desired dimen-sions upon hydration, yielding discs that were 5.2–5.9 μm indiameter and 1.22–1.54 μm tall, with the feature size and finalRBCM dimensions dependent upon the percent of cross-linkerand the mold used. Filling the molds resulted in a meniscus,leaving the particles thinner in the middle and thicker at theedges (Fig. 1). This effect, which is not uncommon for the PRINTmethod (9), yielded RBCMs that were reminiscent of the bicon-cave shape of RBCs.
To assess the biocompatibility of the RBCMs, we performedin vitro cytotoxicity assays on human umbilical vein endothelialcell (HUVEC) (endothelial) cells. We dosed cells with varied con-centrations of RBCMs (1.5–200 μg∕mL) and incubated for 72 h(Fig. S1) before performing both MTS [(3-(4,5-dimethylthiazol-2-yl)-5-(3-carboxymethoxyphenyl)-2-(4-sulfophenyl)-2H-tetrazolium)]and ATP-luciferase assays to assess cell life. Particles were welltolerated at all dosages tested by both assays. To examine theinteraction of RBCMs with endothelial cells, we performed a flowcytometry-based cell uptake experiment (24). RBCMs weredosed to HUVEC cells at a concentration of 15 μg∕mL and in-
cubated for 15 min, 1, 2, 4, and 24 h, and then evaluated to de-termine the percentage of cells that had internalized the RBCMparticles. Interaction between the RBCMs and cells was minimal,with less than 10% of cells having internalized particles after 24 hof incubation time (Fig. S2).
Microfluidic Examination of Particle Deformability. To demonstratethe ability of RBCMs to deform in flow conditions such as theymight experience in traversing the microvasculature, we utilized amicrofluidic device with constricted pores (Fig. 2). Microfluidicmodels of vascular constriction have been explored to evaluatethe behavior of natural and diseased RBCs (25) and syntheticmimics of RBCs (13). We designed a 3-μm tall channel with poresthat were 3 μm wide and 50 μm long and repeated many timesover the length of the device. The height of the channels wastoo short for the RBCMs to orient vertically to pass through therestrictions, forcing the particles to deform in order to traversethe pores. The device design (Fig. 2A) included over 100 repeti-tions of 3-μm restricted pores over the length of the channel, aswell as an unrestricted 15-μm path on each side of the restrictions,running the length of the channel. This architecture tested theability of the particles to deform repeatedly while providing anunobstructed path for fluid flow to maintain reasonably low pres-sures through the constricted pathways. Although the smallestcapillaries in the body have diameters of around 5 μm, RBCs rou-tinely deform to traverse splenic sinusoids that are much smaller(26). When dilute solutions of RBCMs were flowed through thedevice at a constant flow rate (0.06 mL∕min), the lower modulusRBCMs (1 and 2% cross-linked) navigated these pores, whereasmore rigid RBCMs rapidly clogged them (Fig. 2). A movie of 1%cross-linked RBCMs traversing these pores can be seen in SI Text(Movie S1). In flow, the 1% cross-linked RBCMs stretched in the3-μm wide channels, increasing in length 239%� 26% (n ¼ 15)while flowing through the restricted channels, followed by a re-laxation back to their original discoid shape in the absence offlow. This behavior is similar to that of natural RBCs, which de-form under flow conditions and only fully resume their character-istic discoid shape once flow is halted (27). Although RBCMshave similar size, shape, and deformability to RBCs, they differ
Fig. 1. RBCM particles. (A) A graphical depiction of thePRINT process used to fabricate RBCMs. Briefly (Top toBottom), an elastomeric fluoropolymer mold (green) withdisc-shaped wells was covered by an aliquot of the prepo-lymer mixture (red). The mold was passed through a pres-sured nip (black) covered by a high-energy sheet (gray),wicking away excess liquid from the mold surface whilefilling the wells of the mold. The filled mold was curedphotochemically, yielding cross-linked hydrogel particles,which were harvested from the mold by freezing onto athin film of 1% poly(vinyl alcohol) in water (blue) andpeeling away the mold. Melting of this layer resulted ina suspension of hydrogel particles. (B–E) Fluorescent imagesof hydrated RBCMs with varying percent cross-linker;(B) 10% cross-linked, (C) 5% cross-linked, (D) 2% cross-linked, and (E) 1% cross-linked. Scale bars are 20 μm.
Table 1. Modulus values and compartmental analysis of RBCM particles from intravital microscopy experiments
% Cross-linker Modulus of bulk material, kPa Distribution half-life, h Elimination half-life, h AUC, fluoresence* h Average R2
10% 63.9 ± 15.7 0.038 ± 0.0012 2.88 ± 0.92 0.65 ± 0.14 0.89665% 39.6 ± 10.4 0.066 ± 0.036 5.12 ± 2.17 0.76 ± 0.57 0.90292% 16.9 ± 1.7 0.15 ± 0.025 7.12 ± 0.82 1.35 ± 0.26 0.94681% 7.8 ± 1.0 0.35 ± 0.13 93.29 ± 31.09 15.44 ± 15.63 0.9330
*Ranges given represent one standard deviation. Values were derived from scans of three mice.
Merkel et al. PNAS ∣ January 11, 2011 ∣ vol. 108 ∣ no. 2 ∣ 587
BIOPH
YSICSAND
COMPU
TATIONALBIOLO
GY

in fundamental structure: RBCs are fluid-filled sacs contained bya complex membrane that has extreme flexibility originating fromthe membrane structure (28, 29), whereas the RBCMs are unin-terrupted hydrogel discs. These two disparate structures shouldhave different behaviors and mechanisms of deformation in con-stricted flow (13) though further studies are needed to elucidatethese details for the RBCMs.
Compartmental Analysis of RBCM Circulation Profile After IntravenousAdministration.We used an intravital imaging method to examinethe behavior of RBCMs when intravenously injected into mice.For intravital approaches, the microcirculation is directly ob-served with high spatial and temporal resolution, often throughthe use of surgical techniques to expose tissues of interest (30,31). In our approach, we observed the peripheral vasculaturethrough the skin of an anesthetized mouse’s ear. We directly ob-served the RBCMs via the near-IR fluorescence of the particlesby imaging every 2 s for 2 h as the particles traversed this portionof the vasculature (see Movies S2 and S3). Elimination curveswere generated by tracking the change in fluorescent signal fromthe particles over time (Fig. 3), normalizing each scan to the max-
imum intensity slice and plotting decay as a function of this max-imum intensity.
Several pharmacokinetic models were investigated using astandard pharmacokinetic modeling program [WinNonlin (ver-sion 5.2.1; Pharsight Corp.)] to describe the plasma concentrationversus time profiles to determine the best model. One- and two-compartment models with elimination from the central compart-ment, from the software’s library, were investigated, as was atwo-compartment model with elimination from both the centraland peripheral compartments, which was built by our group. Theevaluation of the goodness of fit was based on the Akaike infor-mation criterion, the variability of the parameter estimates, andthe absence of a significant correlation between independentmodel parameters (<0.95). The two-compartment model withone elimination step from the central compartment providedthe best fit for all of the datasets examined.
To evaluate the kinetics of RBCM clearance, we used thistwo-compartment pharmacokinetic model, characterized by abiexponential decrease in particle concentration over time (32),with parameters fit by nonlinear regression analysis (33). Thismodel describes an initial (distribution) phase where the particles
Fig. 2. Microfluidic evaluation of RBCM deformability.(A) A schematic of the microfluidic devices, with flow drivenby a syringe pump. (B) An image sequence showing a 1%cross-linked RBCM (6.0-μm diameter) deforming to passthrough a 3 × 3.5 μm channel (25 ms between frames).(C) Ten percent cross-linked RBCMs stuck in the entranceof the 3-μm pores in a microfluidic device. Scale bars are30 μm.
Fig. 3. Intravital microscopy data and compartmen-tal analysis. (A) Vasculature highlighted with rhoda-mine B labeled dextran prior to injection of RBCMs.(B) Dylight 680 labeled 1% cross-linked RBCMs flow-ing through this stretch of vasculature 20 min afterdosing, with ROI outlined in yellow. (C) Colored over-lay of A and B, with dextran in blue and particlesshown in red. Scale bars are 100 μm. (D) Two-com-partment model schematic and governing equationsused to fit the data. (E) Decrease in fluorescent signalin the ROI for the 2-h scan in this mouse. The semilogplot shows calculated fit for the two-compartmentpharmacokinetic models.
588 ∣ www.pnas.org/cgi/doi/10.1073/pnas.1010013108 Merkel et al.

distribute from the plasma into various tissues, followed by a late(elimination) phase that describes the ultimate clearance of par-ticles from the plasma (Fig. 3). For small molecules and nanopar-ticles the distribution is attributed to extravasation into tissue;because of their size, the distribution of RBCMs may be dueto physical entrapment in constricted capillaries or tissues withlow blood flow rather than by an extravasation process. Althoughwe observed the RBCMs only for the initial 2 h in vivo, the un-certainty associated with the mathematical fitting was minimizeddue to the large number of data points used to fit each curve (over350). Calculated distribution and elimination half-lives (t1∕2ðαÞand t1∕2ðβÞ, respectively) trended to longer times with decreasedmodulus (Table 1). Although the least flexible RBCMs werecleared quite rapidly, circulation times increased with increasingparticle elasticity, with the most deformable RBCMs eliminatedover 30 times more slowly than their most rigid counterparts(t1∕2ðβÞ ¼ 3.9 d).
Intravital microscopy provided a method for direct observationof RBCM particles in the peripheral vasculature of mice andallowed us to make a close and thorough examination of theinitial clearance profiles of these particles. Our analysis providedcurves with approximately 350 data points illustrating the elimi-nation of these particles from the circulation over each 2-h scan.Nonlinear regression analysis yielded excellent fits, with the largenumber of data points adding a measure of certainty to the shapedefined by these elimination curves. With a method of directlyobserving the particles, we expect that our detection limits shouldbe quite low as we are able to discern individual particles in thescans. However, this method was not without limitations. Directcorrelation of the intensity of the fluorescent signal of the parti-cles to a particle concentration was difficult due to several factors,including variabilities in the depth, volume, and flow rates inobserved portions of vasculature and the relatively fast movementof particles relative to the scanning speed of the microscope.Lacking the correlation to particle concentration, we were unableto perform a full pharmacokinetic analysis on the RBCMs exam-ined, though much was learned through an analysis of the shapeof these curves.
To verify the long-circulating behavior of 1% cross-linkedRBCMs, we tracked particle concentration in blood at timepoints out to 5 d postinjection via a more traditional blood-drawmethod. We examined three mice per time point, including 2, 8,24, 72, and 120 h postinjection. At each time point examined, wesacrificed the mice, collected blood via cardiac puncture, andmeasured the fluorescent signal from the particles in the wholeblood, which was correlated to concentration through the genera-tion of a standard curve (see SI Text). Pharmacokinetic analysis ofthese data by the two-compartment model discussed above was ingood agreement with the data obtained from the intravital tech-nique; both techniques showed a fairly rapid distribution of themajority of the dose to various tissues, with 10–15% remaining inthe blood after 2 h, resulting in an elimination half-life of 3.6 d,with 5% of the injected dose remaining in the blood after 5 d(Table 2).
Biodistribution of RBCM Particles After Intravenous Injection. To ex-amine the biodistribution of RBCMs with changing deformabil-ity, we sacrificed the mice 2 h postinjection and harvested tissueand blood samples for further analysis. Tissue samples werenot perfused prior to analysis. Five and 10% cross-linked RBCMsdistributed primarily into the capillary beds in the lungs (Fig. 4).This behavior is typical for intravenously injected micro-particles,
with the bulk of the dose most likely sequestered immediatelypostinjection as this is the first downstream tissue with microvas-culature. These stiffer RBCMs were poorly tolerated, with signif-icant distress requiring sacrifice of some mice prior to scancompletion; presumably due to the stiff particles contributingto pulmonary embolism. More flexible RBCMs (1 and 2% cross-linker) were very well tolerated, presumably due to the avoidanceof filtration in the lungs. Mice that were sacrificed early were notincluded in any datasets presented here, as the time postinjectionwas incongruent with the bulk of the data analyzed. The mostdeformable RBCMs (1% cross-linked) were primarily seques-tered in the spleen (67% recovered fluorescence∕g), having lar-gely avoided filtration in the lungs. Lung filtration was largelyavoided by particles with 2% or less cross-linker (≤16.9 kPa, bulkmaterial), suggesting that the modulus of these materials may in-dicate a threshold value for avoidance of filtration by the lungs.Uptake in the kidneys was significant for all but the 1% cross-linked RBCMs, though further studies will be required to eluci-date the mechanism of this clearance.
Distribution of 1% cross-linked RBCMs in liver, lung, spleen,kidneys, and blood was tracked for 2, 8, 24, 72, and 120 h post-injection (Figs. S4 and S5). Saturation of tissues occurred atdifferent times, indicating a redistribution of particles after someinitial distribution at the time of dosing. Although splenic accu-mulation peaked at 24 h, signal in the lungs decreased over thetime course of the experiment; suggesting a delayed release of thephysically entrapped particles back into the circulation.
With approximately 5% of the cardiac output flowing throughthe spleen (3) and the total blood volume of the mouse circulating7–8 times per minute (34), the whole blood volume was passedthrough the mouse spleen some 42–48 times over the course ofour 2-h scans. The continued persistence of 1% cross-linkedRBCMs in the circulation after this time suggests that splenicaccumulation may be due in part to long residence time ratherthan permanent filtration, as is the case for RBCs, where filtra-tion occurs first as an effect of slow blood flow through themacrophage containing red pulp, followed by physical filtrationwhen passing through the sinusoids or transmural apertures (3).
Further studies will be required to illuminate the capabilityof these particles to carry and deliver therapeutic payloads;however, extremely low modulus RBCMs could have therapeuticapplications for splenic disorders due to their preferential accu-mulation in this tissue and the have potential for drug deliveryapplications due to their long-circulation times and low accumu-lation in the liver. Drug dosing can be limited by toxicity to aclearance organ such as the liver (35, 36). The apparent splenicclearance of RBCMs affords the possibility of different dosingrestrictions if these particles were to be used as drug carriers be-cause of the low concentrations found in the liver, as well as thepossibility for direct treatment or imaging of the spleen. The mostdeformable of the RBCMs tested here successfully navigated re-gions of constricted blood flow, resulting in extended circulationtimes and illuminating a critical design parameter for micropar-ticles. Further experimentation with extremely deformable mate-rials on different size scales—from tens of nanometers to the6-μm diameter particles used in this study, should cast light onthe role played by deformability in enhancing the circulationtimes of biologically relevant particles.
Materials and MethodsMaterials. Commercially available HEA (96%, Aldrich) contains impuritiessuch as acrylic acid, ethylene glycol, and ethyleneglycol diacrylate (EGDA)
Table 2. Pharmacokinetic parameters for 1% cross-linked RBCMs calculated from blood draws taken out to 5 d postinjection
A, mg∕mL B, mg∕mL α, h−1 β, h−1 αt1∕2, h βt1∕2, h VC, mL AUC, mg � h∕mL CLT , mL∕h Vdβ , mL
0.190 0.0482 0.241 0.00768 2.876 90.235 2.934 7.067 0.0990 12.894
Merkel et al. PNAS ∣ January 11, 2011 ∣ vol. 108 ∣ no. 2 ∣ 589
BIOPH
YSICSAND
COMPU
TATIONALBIOLO
GY

and was purified prior to use according to the procedure set forth by Elif andAli (37). Briefly, HEAwas dissolved in water (25% by volume) and the solutionextracted 10 times with hexanes. Salt (200 g of NaCl∕L) was added tothe aqueous phase, and the monomer was extracted by washing with ether(4 times). The solution was dried with MgSO4 (3 wt %), and ether was re-moved by rotary evaporator. The purified monomer was distilled undervacuum prior to use. PEG 4000 diacrylate (DA) (Polysciences, Inc.), 2-carbox-yethyl acrylate (Aldrich), fluorescein-o-acrylate (97%, Aldrich), 1-hydroxycy-clohexyl phenyl ketone (99%, Aldrich), Dylight 680 maleimide (ThermoScientific), Fluorescein-o-acrylate (97%, Aldrich) and methacryloxyethylthiocarbamoyl rhodamine B (PolyFluor 570, Polysciences, Inc.) were usedas received. All other materials were used as received, unless otherwisenoted.
Modulus Testing. To measure the mechanical properties of the cross-linkedHEA hydrogels, we polymerized macroscopic coupons of the prepolymer mix-tures described in Table S1 via UV light (λ ¼ 365 nm, power ¼ 20 mW∕cm2) ina Teflon mold. The cross-linked hydrogels were removed from the mold,weighed, and then placed in pH 7.4 PBS buffer for 24 h to fully hydrate.The coupons were patted dry with paper towels and weighed again priorto testing with an Instron 5556 Universal Testing Machine (Instron) with astrain rate of 5 mm∕min.
Particle Fabrication. For the PRINT technique (9, 18), master templates wereprepared via traditional photolithography to have ordered arrays of raiseddiscs with low aspect ratios, mimicking the shape of RBCs. A photocurableperfluoropolyether (Fluorocur, Liquidia Technologies) was drop cast onto amaster template, and a flexible plastic sheet was applied to the top ofthe resin to act as a supportive backing for the mold that resulted fromphotocuring of the resin and subsequent removal from the master template.The master templates and molds used in this study had discoid features with2- and 3-μm diameters and heights of 0.6 and 0.9 μm, respectively, andproduced particles with 5- to 6-μm diameters due to swelling of the particlehydrogel material. For the fabrication of the particles, the prepolymermixture was spread onto a mold that was chilled to 2–5 °C on a custom-builtlaminator platform. The reduced temperature prevented evaporation of theprepolymer solution prior to photocuring. A poly(ethylene terepthalate)(PET) sheet was laminated to the top of the mold and prepolymer solution,wetting the total mold area. The sheet was peeled away at the nip point ofthe laminator, leaving the wells of the mold filled while wicking awayexcess solution. The filled mold was immediately transferred into a chilled(2–5 °C), nitrogen purged UV oven and cured with UV light (λ ¼ 365 nm,
power ¼ 20 mW∕cm2). After curing, the filled mold was placed face downon a thin film of 0.1% 2;000 g∕mol poly(vinyl alcohol) (PVOH, Acros) in wateron top of another PET sheet. This assembly was placed in a −80 °C cooler,allowing the water to freeze and adhere to the particles. After freezing,the mold was peeled away from the particles trapped in the ice layer, andthe ice was allowed to melt. RBCMs and water were collected, then washedand concentrated via tangential flow filtration with a MicroKros hollow fiberfilter (500 kDa, Spectrum Laboratories, Inc.) to remove any sol fraction fromsolution. Particles were then suspended in 0.1% 2;000 g∕mol PVOH in PBS,pH 7.4 for subsequent experiments.
Particle Characterization. These methods (confocal microscopy, cell viability,cell uptake, and zeta potential) are described in SI Text, Figs. S1 and S2,and Table S2.
Microfluidics. Microfluidic devices were fabricated from silicone (Sylgard 184,Dow Corning) sealed to glass after treatment with oxygen plasma, with flowdriven by a syringe pump at a fixed rate (0.06 μL∕min). Dilute solutions of 1%cross-linked RBCMs (1–5 μg∕mL in PBS with 0.1% PVOH) were pumpedthrough the channel and observed with a fluorescence microscope (NikonTE2000). Videos were taken with a with a Photometrics Cascade II∶512 cam-era. Particle stretching was analyzed with ImageJ software.
Intravital Microscopy. Intravital microscopy experiments were performedusing an IV 100 laser scanning microscope (Olympus) on female BALB/c miceof 22- to 26-g body weight (Harlan Sprague Dawley). Hair was removed fromthe ear and a tail vein catheter was applied. The mice were anesthetized withisofluorane and placed onto a heated stage (37 °C) in a prone position, withan ear immobilized by taping to an aluminum block. Vasculature was locatedby injection with a solution of 20 mg∕mL rhodamine B labeled 70-kDa dex-tran (Invitrogen) in PBS and visualized by excitation with a 568-nm laser. Asuspension of RBCMs, 33 mg particles∕kg mouse weight via a 3.5 mg∕mLsolution of RBCMs in PBS with 0.1% PVOH, was then injected and visualizedusing a 633-nm laser. Controls were injected with the dextran solutionfollowed by 200 μL of PBS with 0.1% poly(vinyl alcohol). Imaging scans pro-ceeded for 2 h, with an image taken every 2 s. For analysis of the circulationpersistence of the particles, the image files from each scan were exported toimageJ. For ease of analysis, we followed the example of Tong et al. (38) andstacked the images in groups of 10. We analyzed the region of interestcontaining vasculature for fluorescent signal in each scan and correctedfor variation in laser intensity or autofluorescence by background correctingeach image with the signal from a region of the scan that was free of vas-
Fig. 4. Biodistribution of RBCMs. (A) Distribution ofRBCMs into various tissues 2 h postdosing by percentrecovered fluorescence normalized for tissue weight.Error bars represent one standard deviation, withn ¼ 3 for each case. (B) Lung tissue from a mouse dosedwith 10% cross-linked RBCMs. Particles are shown inred, with cell nuclei in purple, and cytoskeleton (F-actin)stained green. (C) Lung tissue from a mouse dosed with1% cross-linked RBCMs, with tissue stained as in B. Veryfew RBCMs were in this tissue compared to mice dosedwith more rigid particles, consistent with the tissue dis-tribution data. Scale bars are 50 μm.
590 ∣ www.pnas.org/cgi/doi/10.1073/pnas.1010013108 Merkel et al.

culature. For comparison, we normalized each scan to the maximum intensityslice for that scan, providing curves that measured the clearance of particlesfrom the peripheral vasculature over time as a percentage of the maximumsignal. Further details are outlined in SI Text.
Controls and dosed mice were sacrificed 2 h after injections, and bloodand tissues were harvested for imaging. Harvested tissues including liver,lung, spleen, kidneys, heart, and intestines were weighed, then imaged usingan IVIS Kinetic fluorescence imaging system (Caliper Life Sciences) with exci-tation at 675 nm and emission measured at 720 nm. Blood was harvested viacardiac puncture and pipetted in 100-μL aliquots to black 96-well plates foranalysis on the imager. The fluorescent signal for each tissue sample wasbackground corrected by subtracting the signal from control tissues. Biodis-tribution profiles for the RBCMs at 2 h postdose were determined by percentof recovered fluorescence in the above tissues (Fig. 4). Fluorescent signal inthe blood was calculated by measuring the fluorescent signal from severalaliquots of blood and extrapolating to account for the total blood volumein the mice (approximately 1.7 mL∕20 g of body weight) (39).
Biodistribution. Harvested blood was analyzed for fluorescent signal with anIVIS Kinetic imager with excitation at 675 nm and emission measured at720 nm, and concentrations were calculated with a standard curve. Harvested
tissues were analyzed as above, with biodistribution profiles presented as apercent of the recovered fluorescence per gram of tissue weight.
Blood-Draw Experiments. For evaluation of longer time points, particles wereinjected as in the previously described study, with mice sacrificed at the in-dicated time points by cardiac puncture. Fluorescent signal from harvestedblood was measured as above, with concentrations determined from a stan-dard curve resulting from serial dilutions of particles in mouse blood (Fig. S2).
Hisology. Details of the procedure for staining and imaging the harvestedtissues are found in SI Text.
Pharmacokinetic Analysis. Further details on the pharmacokinetic analysiscarried out for the RBCMs can be found in SI Text.
ACKNOWLEDGMENTS. We thank the University of North Carolina AnimalStudies Core for its assistance. This work was supported by the STC programof the National Science Foundation (CHE-9876674), National Institutes ofHealth (NIH) Director’s Pioneer Award (1DP1OD006432-01), the Center forCancer Nanotechnology Excellence (NIH 5-U54-CA119373-02), Liquidia Tech-nologies, and NIH (1R21HL092814-01).
1. Suresh S (2007) Biomechanics and biophysics of cancer cells. Acta Biomater 3:413–438.2. Fung YC (1993) Biomechanics Mechanical Properties of Living Tissues (Springer, New
York), 2nd Ed, p 121.3. Bowdler AJ, ed. (2002) The Complete Spleen. Structure, Function, and Clinical Disor-
ders (Humana Press, Totowa, NJ), 2nd Ed, 140,, pp 18–20–30–47.4. Suresh S (2007) Nanomedicine: Elastic clues in cancer detection. Nature Nanotechnol
2:748–749.5. Champion JA, Walker A, Mitragotri S (2008) Role of particle size in phagocytosis of
polymeric microspheres. Pharm Res 25:1815–1821.6. Kohane DS (2007) Microparticles and nanoparticles for drug delivery. Biotechnol
Bioeng 96:203–209.7. Champion JA, Katare YK, Mitragotri S (2007) Particle shape: A new design parameter
for micro- and nanoscale drug delivery carriers. J Control Release 121:3–9.8. Geng Y, et al. (2007) Shape effects of filaments versus spherical particles in flow and
drug delivery. Nature Nanotechnol 2:249–255.9. Gratton SE, et al. (2008) The effect of particle design on cellular internalization path-
ways. Proc Natl Acad Sci USA 105:11613–11618.10. Drummond DC, Meyer O, Hong K, Kirpotin DB, Papahadjopoulos D (1999) Optimizing
liposomes for delivery of chemotherapeutic agents to solid tumors. Pharmacol Rev51:691–743.
11. Fox ME, Szoka FC, Frechet JM (2009) Soluble polymer carriers for the treatment ofcancer: The importance of molecular architecture. Acc Chem Res 42:1141–1151.
12. Mitragotri S, Lahann J (2009) Physical approaches to biomaterial design. Nat Mater8:15–23.
13. Haghgooie R, Toner M, Doyle PS (2009) Squishy non-spherical hydrogel microparticles.Macromol Rapid Comm 31:128–134.
14. Doshi N, Zahr AS, Bhaskar S, Lahann J, Mitragotri S (2009) Red blood cell-mimickingsynthetic biomaterial particles. Proc Natl Acad Sci USA 106:21495–21499.
15. Hendrickson GR, Lyon LA (2010) Microgel translocation through pores under confine-ment. Angew Chem Int Edit 49:2193–2197.
16. Alexis F, Pridgen E, Molnar LK, Farokhzad OC (2008) Factors affecting the clearanceand biodistribution of polymeric nanoparticles. Mol Pharmacol 5:505–515.
17. Canelas DA, Herlihy KP, DeSimone JM (2009) Top-down particle fabrication: Controlof size and shape for diagnostic imaging and drug delivery. Wiley Interdiscip RevNanomed Nanobiotechnol 1(4):391–404.
18. Merkel TJ, et al. (2009) Scalable, shape-specific, top-down fabrication methods for thesynthesis of engineered colloidal particles. Langmuir 26:13086–13096.
19. Rolland JP, et al. (2005) Direct fabrication and harvesting of monodisperse, shape-specific nanobiomaterials. J Am Chem Soc 127:10096–10100.
20. Snyder GK, Weathers WW (1977) Hematology, viscosity, and respiratory functions ofwhole blood of the lesser mouse deer, Tragulus javanicus. J Appl Physiol 42:673–678.
21. Nguyen KT, West JL (2002) Photopolymerizable hydrogels for tissue engineeringapplications. Biomaterials 23:4307–4314.
22. Rehfeldt F, Engler AJ, Eckhardt A, Ahmed F, Discher DE (2007) Cell responses to themechanochemical microenvironment—implications for regenerative medicine anddrug delivery. Adv Drug Deliver Rev 59(13):1329–1339.
23. Dulinska I, et al. (2006) Stiffness of normal and pathological erythrocytes studied bymeans of atomic force microscopy. J Biochem Biophys Methods 66:1–11.
24. Fattorossi A, Nisini R, Pizzolo JG, D’Amelio R (1989) New, simple flow cytometrytechnique to discriminate between internalized and membrane-bound particles inphagocytosis. Cytometry 10:320–325.
25. Shevkoplyas SS, Yoshida T, Gifford SC, Bitensky MW (2006) Direct measurement ofthe impact of impaired erythrocyte deformability on microvascular network perfusionin a microfluidic device. Lab Chip 6:914–920.
26. Cho Y, De Bruyn PP (1975) Passage of red blood cells through the sinusoidal wall of thespleen. Am J Anat 142:91–105.
27. McWhirter JL, Noguchi H, Gompper G (2009) Flow-induced clustering and alignmentof vesicles and red blood cells in microcapillaries. Proc Natl Acad Sci USA106:6039–6043.
28. Li J, Lykotrafitis G, Dao M, Suresh S (2007) Cytoskeletal dynamics of human erythro-cyte. Proc Natl Acad Sci USA 104:4937–4942.
29. Park Y, et al. Measurement of red blood cell mechanics during morphological changes.Proc Natl Acad Sci USA 107:6731–6736.
30. Sandanaraj BS, Gremlich HU, Kneuer R, Dawson J, Wacha S (2010) Fluorescent nanop-robes as a biomarker for increased vascular permeability: Implications in diagnosis andtreatment of cancer and inflammation. Bioconjugate Chem 21:93–101.
31. Smith BR, et al. (2008) Real-time intravital imaging of RGD-quantum dot binding toluminal endothelium in mouse tumor neovasculature. Nano Lett 8:2599–2606.
32. Neubauer AM, et al. (2008) Nanoparticle pharmacokinetic profiling in vivo usingmagnetic resonance imaging. Magn Reson Med 60:1353–1361.
33. Brown AM (2001) A step-by-step guide to non-linear regression analysis of experimen-tal data using a Microsoft Excel spreadsheet. Comput Method Programs Biomed65:191–200.
34. Janssen B, Debets J, Leenders P, Smits J (2002) Chronic measurement of cardiac outputin conscious mice. Am J Physiol Regul Integr Comp Physiol 282:R928–935.
35. Bissell DM, Gores GJ, Laskin DL, Hoofnagle JH (2001) Drug-induced liver injury:Mechanisms and test systems. Hepatology 33:1009–1013.
36. Lee WM, Senior JR (2005) Recognizing drug-induced liver injury: Current problems,possible solutions. Toxicol Pathol 33(1):155–164.
37. Elif V, Ali U (2005) Polymerization of 2-hydroxyethyl acrylate in bulk and solution bychemical initiator and by ATRP method. J Polym Sci Pol Chem 43:3957–3965.
38. Tong L, He W, Zhang Y, Zheng W, Cheng JX (2009) Visualizing systemic clearance andcellular level biodistribution of gold nanorods by intrinsic two-photon luminescence.Langmuir 25:12454–12459.
39. Gratton SE, et al. (2007) Nanofabricated particles for engineered drug therapies: Apreliminary biodistribution study of PRINT nanoparticles. J Control Release 121:10–18.
Merkel et al. PNAS ∣ January 11, 2011 ∣ vol. 108 ∣ no. 2 ∣ 591
BIOPH
YSICSAND
COMPU
TATIONALBIOLO
GY