using machine-readable bloomberg news data to trade fx 2
TRANSCRIPT

Seeking the cues in macro markets
1
Cuemacro Ltd. Non-independent investment research (see disclaimers)
Robo-news reader
Using machine-readable Bloomberg News data to trade FX
In this paper, we examine how machine-readable articles from Bloomberg News
can be used to understand FX markets both from a cash and vol perspective. We
create sentiment scores for currencies based on the newsfeed. Using Bloomberg
News articles as a signal input, we have created a news-based FX trading strategy
since 2010; our strategy has risk-adjusted returns of 0.6, considerably
outperforming a generic FX-trend-following strategy over the same period. Our
news-based trading strategy has little or no correlation to trend-following
returns, hence, news-based strategies could help to diversify the returns for those
invested in trend followers. Later, we show how news volume has a strong
positive correlation with FX volatility. In particular, we show how news can help
understand FX volatility around FOMC and ECB meetings.
Introduction
Traders filter news to gauge a signal to trade markets. However, news volumes are
massive; one human cannot possibly read all the news produced daily. Can we
replicate such a news-based approach to trading in an automated way? In this
paper, we shall discuss how precisely machine-readable news can be used to
develop trading strategies, with a focus on FX markets.
Figure 1: News vs. Trend model returns Figure 2: USD/JPY news volume vs. 1M
implied
Source: Cuemacro, Bloomberg Source: Cuemacro, Bloomberg
In Figure 1, we present the returns of a news-based trading strategy for developed
market FX USD pairs. In Figure 2, we show the relationship between USD/JPY
implied volatility and news volume. In the rest of the paper, we shall go into some
detail to explain these results.
80
100
120
140
160
2010 2012 2014 2016
News Ret=4.2% Vol=6.6% IR=0.6 Dr=-16.9%
Trend Ret=-1.5% Vol=5.8% IR=-0.3 Dr=-22.3%
2
7
12
17
22
-2
-1
0
1
2
3
2014 2015 2016 2017
News Volume Score Smoothed
Implied
News Volume Score Implied Vol
Saeed Amen
Quantitative Strategy
+44 20 3290 9624
@cuemacro
http://www.cuemacro.com
2 January 2018
This article has been
kindly sponsored by
Bloomberg L.P.

Seeking the cues in macro markets
2
Cuemacro Ltd. Non-independent investment research (see disclaimers)
General process for preparing a text-based dataset
As mentioned in the introduction, our objective is to use a news-based dataset to
trade FX. We shall examine news available on the Bloomberg Terminal® for users
and also in machine-readable form through Bloomberg Event-Driven Feeds (EDF).
This consists of several Bloomberg News-generated news sources, including
Bloomberg News (BN) and Bloomberg First Word (BFW). It also includes content
sourced externally, for example, from the web.
The dataset that we shall use in our study consists of articles that appeared on
from the Bloomberg News (BN) newswire between 2009 and 2017. Our objective is
to aggregate sentiment across many news articles to inform longer-term trading as
opposed to “headline”-style trading, which is typically done by high-frequency
traders. Working with text-based data as an input to trading usually involves several
steps; we have given examples of what can be done at each step.
• Collecting raw data
o web scraping
o accessing internal databases
• Cleaning dataset
o removing irrelevant textual information such as HTML tags
o removing invalid observations
• Structuring dataset
o adding tags to describe the data, eg. entity detection
o application of sentiment analysis to text
o creating a single database record to describe the data
• Filtering dataset
o focusing on the most relevant entries — which are likely to be most
useful for our trading rule — to help prune our search space
• Creating an indicator
o aggregating records to create indicators (typically done for specific
tags)
o often aggregating high-frequency data into lower frequency
snapshots
• Applying a trading rule on the indicator
o creating a specific trading rule for that indicator
o more likely, using the indicator as an additional factor in a trading
framework

Seeking the cues in macro markets
3
Cuemacro Ltd. Non-independent investment research (see disclaimers)
Summary of Bloomberg News dataset
Our Bloomberg News dataset is already a structured dataset, which helps to
simplify the above process significantly. Hence, we can skip some of the initial,
often time-consuming, steps of data collection. Furthermore, the general writing
style of the articles is consistent, which makes further analysis easier. This contrasts
to web-based content, which can be aggregated from vastly disparate sources.
The dataset we are using consists of compressed XML files aggregated for each
day. Bloomberg’s event-driven feed dataset is both available at the end of day in
this format and also through a real-time feed for ingestion by high-frequency
trading algorithms. Each news article is represented as an XML record that includes
fields such as (a full list of all available fields is available from Bloomberg):
• Timestamp of news article
• Title of news article
• Text body of the news article
• Tagging for tradable tickers related to the news (eg. %EUR for EURUSD)
• Tagging for the topic related to the news (eg. FED for articles related to
Federal Reserve)
Creating subject-based news filters
We can prune our search space and also reduce the computational complexity of
our analysis if we first apply a filter to the specific tickers/topics/languages most
relevant for us.
We filter first for articles written in English. We also focus on those instances when
a story is first published (denoted by the ADD_STORY event), rather than when an
article is updated. Typically, an article can be updated multiple times—sometimes
involving changes in the article’s body text, other times involving the update of one
of the attributes in the metadata.
Our asset universe consists of the G10 USD crosses (except for CHF, which was a
heavily managed currency during much of our sample). Hence, we shall filter for
news that has been tagged for currency tickers defined in Bloomberg as:
• %EUR, %GBP, %AUD, %NZD, %USD, %CAD, %NOK, %SEK and %JPY
We could have chosen to focus our search on other news topics, such as economic
news for each country (for example, USECO for US economic news). Later, we shall
also analyse news data for both FOMC and ECB to understand the behaviour of FX
volatility around these events. This will involve filtering for the Bloomberg news
topics:
• FED and ECB

Seeking the cues in macro markets
4
Cuemacro Ltd. Non-independent investment research (see disclaimers)
In Figure 3, we show the news associated with EUR/USD using Bloomberg News
(BN) as a source on the Bloomberg Terminal as an illustration. We can do news-
based queries on the Bloomberg Terminal for topics to quickly see whether the
filters we might wish to code up later are relevant. We can use TNI <GO> to create
multilevel customised filters for news, specifying multiple tickers, topics, sources,
etc.
Figure 3: News for EUR/USD using Bloomberg News (BN) as a source
Source: Bloomberg
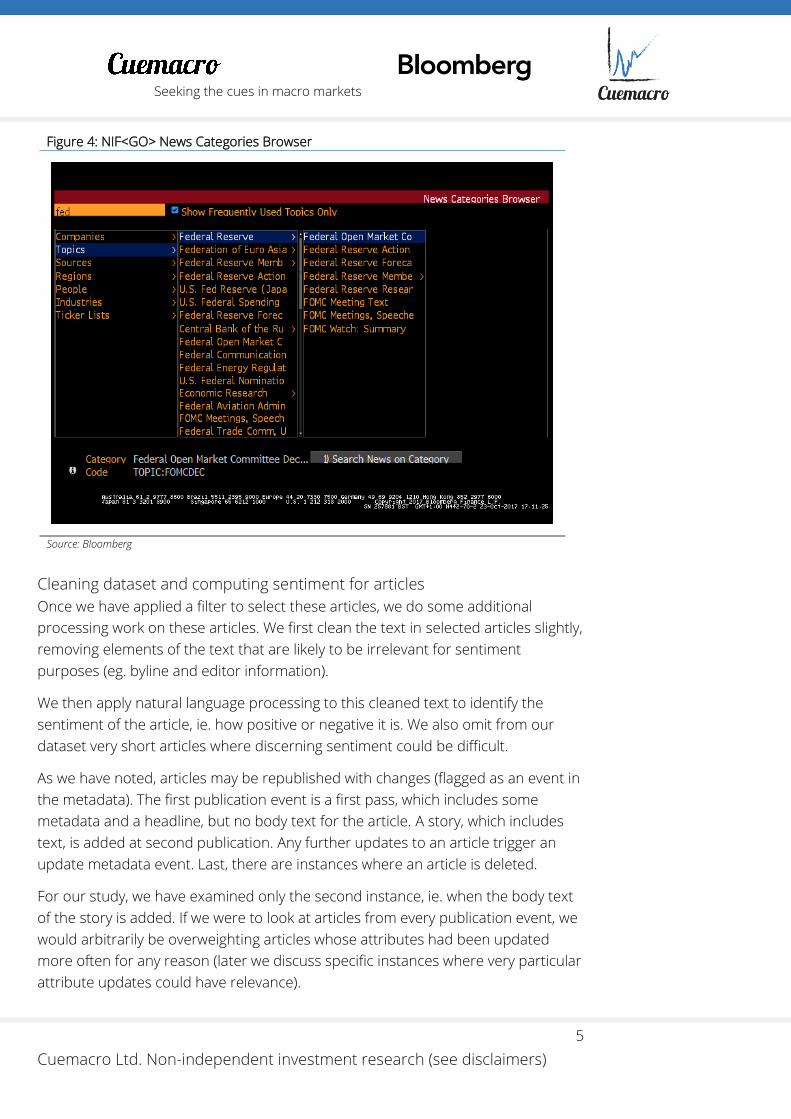
A great number of news topics are available on Bloomberg. We can quickly browse
the topics available on Bloomberg News by using a Bloomberg Terminal and typing
NIF <GO>. In Figure 4, we show an illustration of browsing news topics associated
with the Federal Reserve from NIF <GO>.
Seeking the cues in macro markets
5
Cuemacro Ltd. Non-independent investment research (see disclaimers)
Figure 4: NIF<GO> News Categories Browser
Source: Bloomberg
Cleaning dataset and computing sentiment for articles
Once we have applied a filter to select these articles, we do some additional
processing work on these articles. We first clean the text in selected articles slightly,
removing elements of the text that are likely to be irrelevant for sentiment
purposes (eg. byline and editor information).
We then apply natural language processing to this cleaned text to identify the
sentiment of the article, ie. how positive or negative it is. We also omit from our
dataset very short articles where discerning sentiment could be difficult.
As we have noted, articles may be republished with changes (flagged as an event in
the metadata). The first publication event is a first pass, which includes some
metadata and a headline, but no body text for the article. A story, which includes
text, is added at second publication. Any further updates to an article trigger an
update metadata event. Last, there are instances where an article is deleted.
For our study, we have examined only the second instance, ie. when the body text
of the story is added. If we were to look at articles from every publication event, we
would arbitrarily be overweighting articles whose attributes had been updated
more often for any reason (later we discuss specific instances where very particular
attribute updates could have relevance).

Seeking the cues in macro markets
6
Cuemacro Ltd. Non-independent investment research (see disclaimers)
In Figure 5, we show the number of daily articles on average in our dataset for FX
tickers after our filtering (such as excluding holidays). As we might expect, more-
liquid currencies have more news associated with them. Particularly volatile periods
(eg. 2009) tend to have more news. Later, we discuss the relationship between
news volume and volatility more broadly. Note that even for less-liquid currencies,
such as the scandis, we still have a couple of news articles a day in our dataset after
our various filtering steps. In very illiquid assets, such as low-cap stocks, we might
rarely have news on them. Hence, we might need to think of a different approach
when it comes to processing news data for such illiquid assets.
Figure 5: Average daily count of articles per ticker
Source: Cuemacro, Bloomberg
Given that our objective is FX, our focus is on articles related to macro news as
opposed to company-specific news, which would be the main input into an
equities-based trading strategy. It should be noted that for company-specific
articles, Bloomberg already offers a number of additional news analytics tags,
including sentiment scores. Hence, traders wishing to parse company-specific news
can skip this sentiment computation step.
We have several choices when it comes to applying sentiment analysis to our
macro news articles of interest, which we list below.
• We can write our own NLP (natural language processing) library from
scratch. This is very time-consuming and likely to detract from our primary
objective of creating a trading strategy.
• Alternatively, we can use a proprietary NLP service from vendor, which is
likely quickest way to access high-quality sentiment computation.
• Last, we could do our analysis using an open source NLP tool, which might
need to be customised to fit our needs.
In our study, we have chosen the last option: using an open source library. There
are many options for doing NLP in Python, such as NLTK, textblob (a wrapper on
several libraries, including NLTK), Stanford’s OpenNLP, spacy and, more recently,
0
50
100
150
200
250
300
EUR GBP AUD NZD USD CAD NOK SEK JPY
2009 2010 2011 2012 2013 2014 2015 2016 2017
Average Daily Count

Seeking the cues in macro markets
7
Cuemacro Ltd. Non-independent investment research (see disclaimers)
AllenNLP. It is also possible to train them for specific texts, although this might be a
time-consuming process.
Aggregating sentiment scores and standardising
We cut off each day at 5pm NYC time, which is defined as our trading point. For this
point, we create a daily sentiment score for articles related to each ticker, which is
an equally weighted average of the sentiment of each filtered article. As mentioned
earlier, our focus is only on instances when stories are first added and we also
exclude very short articles.
We also calculate a total daily count for these articles. For the articles related to
FED and ECB topics, we do the same, but do a cut-off at 10am NYC. This time
relates to options expiries — given that our analysis of those points will be done
then.
We then construct (Z) scores for the daily news sentiment scores. This enables us
to make some comparisons between various currencies. When interpreting news,
the quotation conventions in FX can introduce some complications. Let’s say we are
looking at the ticker associated with %JPY. In many cases, the news might be
referring to JPY directly, although in some instances it could also be referring to
USD/JPY, which would require flipping the sign of the signal. We have assumed that
most articles will, in practice, not require “flipping” based on a sample of news we
have read.
We should also note that we are likely to have multiple tickers tagged in a single
story on FX. Potentially, further work could involve looking at this point more
systematically. One possible idea might be to count the number of instances where
an actual currency pair is mentioned in the title or body text to try to gauge
whether the article needs to “flipped”. Even in this case, it will require us to make
certain assumptions about the news (for example, a whole article might well be
about JPY strengthening, but it could mention USD/JPY quote once towards the
end).
However, provided we have a sufficient number of news articles, we think that the
effects of this will even out. We also remove any news on weekends or holidays (US
or UK). News volume declines significantly on these days, hence it makes sense to
avoid these days. In the very unlikely event that there are no news articles on a
specific day, we use the score from the previous day. For other asset classes, where
news articles are very sparse (for example, where there might only be a single
article every few days), we would likely need to apply a decay function rather than
simply carrying forward the score.
The result is a currency sentiment index for individual currencies. To construct a
sentiment index for a specific currency pair, we simply combine the two, given that

Seeking the cues in macro markets
8
Cuemacro Ltd. Non-independent investment research (see disclaimers)
they are comparable. For example, the USD/JPY score is simply USD score – JPY
score (see Figure 6).
Figure 6: USD/JPY news sentiment score vs. weekly returns
Source: Cuemacro, Bloomberg
We also create standardised scores for the news counts (ie. computing Z scores). In
this instance, the news counts are the same no matter the quotation. As news
volumes can differ vastly between tickers, using a standard metric makes it easier
to compare them. We are likely to have a lot more volume for articles related to
EUR than we are for NZD, as an example.
Different weighting schemes for news articles?
We have chosen an equal-weighting scheme primarily for its simplicity when
aggregating the daily sentiment scores. The implicit assumption is that each news
article has equal importance.
There is, of course, the question of whether we should adopt a different weighting
scheme to give certain articles more weighting in this daily average if they are
considered more “important”? One way to do this is to also consider processing
articles when certain attributes related to readership statistics are updated.
When a news article reaches a certain threshold of user readership on the
Bloomberg Terminal, an update attribute is added. Articles that are read more on
the Bloomberg Terminal could thus have a higher weighting. The rationale: they
should have more market impact.
Creating an FX trading rule using news sentiment scores
Above we have shown how to create news-based sentiment scores for specific
currencies and also currency pairs. The next step: determine whether these
sentiment scores can be used to generate a profitable trading strategy.
There are several approaches we can use. One would be to follow the short-term
signal from sentiment. The rationale is that “good’” news should encourage buyers,
while “bad” news is likely to encourage sellers.
-4%
-2%
0%
2%
4%
-4
-2
0
2
4
6
Jan 2017 Mar 2017 May 2017 Jul 2017 Sep 2017
USDJPY Score USDJPY Rets 1W
News Sentiment Score Returns

Seeking the cues in macro markets
9
Cuemacro Ltd. Non-independent investment research (see disclaimers)
Alternatively, we can try to fade extremes in sentiment. The rationale here is that
once good news is abundant, the market will have likely already priced it in. Hence,
there is the likelihood of a pullback in the price. By the same token, a continual
flurry of bad news would desensitise the market to further worsening news flow.
Indeed, if we think about the way that growth surprise indices behave, they have
this type of mean-reverting property
Here we have chosen to do the former, focusing on following short-term changes
in the news rather than on identifying extremes in news flow. We illustrate our
simple trading rule with USD/JPY:
• If the USD/JPY news score is above zero, we buy USD/JPY
• Otherwise, we sell USD/JPY
In other words, whenever the score in Figure 6 is above the line, we would be long;
on or below the line, we would be short.
We also use volatility weighting for each currency pair, leveraging the notional such
that we reach a 10% volatility target for each currency pair. This leverage weighting
is done at the start of each month. So, if EUR/USD realised volatility over the past
month is 5%, we would leverage 2 times to reach 10%. Applying volatility targeting
for each currency pair is particularly useful when creating a basket. If we were to
use an equal-sized notional for each signal, we would end up implicitly
overweighting those currency pairs with high volatility.
For comparison with our news trading rule, we employ a simple trend-following
trading rule that uses an equally weighted trading rule based upon 3-month, 6-
month and 12-month returns — similar to the approach of Hurst, Hua Ooi &
Pedersen (2013)1. For example, if 3-month, 6-month and 12-month returns in
EUR/USD are positive, we would have a maximum-sized long EUR/USD position. As
with our news example, we also use a volatility target. In Figure 7, we illustrate our
EUR/USD trading rule (excluding the adjustable leverage, based upon a volatility
target).
1 Hurst, Hua Ooi & Pedersen (2013) Demystifying Managed Futures, Journal of Investment
Management, Feb 2013

Seeking the cues in macro markets
10
Cuemacro Ltd. Non-independent investment research (see disclaimers)
Figure 7: EUR/USD signal for trend-following model
Source: Cuemacro, Bloomberg
In Figure 8, we present the risk-adjusted returns for our news-based strategy and
for our generic trend rule. Our trading sample is from 2010-2017. We have
included some transaction costs (1bp bid/ask). We have used Bloomberg’s FX total
return indices, which include both spot and carry returns. In Figure 9, we also give
the long-term correlations between the news and trend-following rules for each
currency pair.
Our first observation is that our news-based trading rule outperforms trend-
following in our sample in every currency pair. It is particularly profitable in
EUR/USD and USD/JPY. This is perhaps not surprising given that these are the most
liquid currency pairs, hence are likely to have the most news flow associated with
them.
We also note that the correlation shows no consistent pattern, suggesting that
news-based strategies can be used to diversify the return of investors already
exposed to trend-following.
-1.50
-1.00
-0.50
0.00
0.50
1.00
1.50
-20%
-15%
-10%
-5%
0%
5%
10%
15%
Oct 2015 Feb 2016 Jun 2016 Oct 2016 Feb 2017 Jun 2017
60D% 120D% 252D% Trend Signal
Returns Signal

Seeking the cues in macro markets
11
Cuemacro Ltd. Non-independent investment research (see disclaimers)
Figure 8: News vs. Trend IR Figure 9: News vs. Trend Correlation
Source: Cuemacro, Bloomberg Source: Cuemacro, Bloomberg
As we might expect, the trading rule trades relatively frequently, with a holding
period of around 2 working days on average. However, it is possible to slow the
trading rate by changing the parameters, for example, trading when the score
crosses +1/-1 as opposed to zero.
News-trading basket for FX
We earlier saw that a news-based strategy outperforms trend-following in our
sample on a currency pair basis. In this section, we repeat our analysis, but this
time we create baskets for all the USD crosses in our sample, using both the news-
based and trend-following trading rules.
We present the cumulative returns for both strategies in Figure 10. In Figure 11, we
show the year-on-year returns. Our news-based strategy has risk-adjusted returns
of 0.6 in our sample, whilst the trend-following basket shows a loss. The correlation
of returns between both baskets is 6%, which is quite low.
Figure 10: News vs. Trend model returns Figure 11: News vs. Trend model YoY
returns
Source: Cuemacro, Bloomberg Source: Cuemacro, Bloomberg
-0.8
-0.3
0.3
0.8
EU
RU
SD
GB
PU
SD
AU
DU
SD
NZ
DU
SD
USD
CA
D
USD
NO
K
USD
SEK
USD
JPY
News IR Trend IRIR
-15%
-10%
-5%
0%
5%
10%
EU
RU
SD
GB
PU
SD
AU
DU
SD
NZ
DU
SD
USD
CA
D
USD
NO
K
USD
SEK
USD
JPY
Correlation Trend vs News
Correlation
80
100
120
140
160
2010 2012 2014 2016
News Ret=4.2% Vol=6.6% IR=0.6 Dr=-16.9%
Trend Ret=-1.5% Vol=5.8% IR=-0.3 Dr=-22.3%
-20%
-10%
0%
10%
20%
20
10
20
11
20
12
20
13
20
14
20
15
20
16
20
17
News TrendYoY
Seeking the cues in macro markets
12
Cuemacro Ltd. Non-independent investment research (see disclaimers)
The news basket especially outperformed trend-following in 2011 and 2013.
However, we should note there have been some years where a news-based
strategy underperformed significantly, in particular during 2010. In practice, we
note that investors are likely to run a portfolio of different strategies as opposed to
single strategy in isolation.
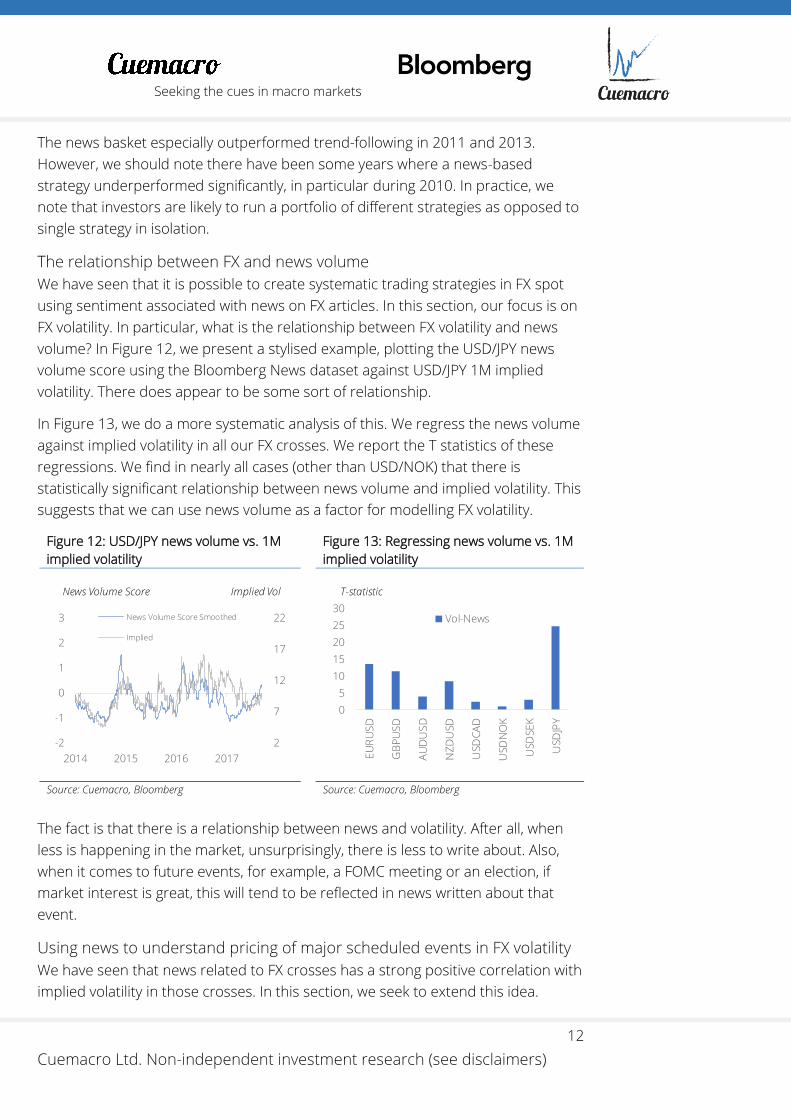
The relationship between FX and news volume
We have seen that it is possible to create systematic trading strategies in FX spot
using sentiment associated with news on FX articles. In this section, our focus is on
FX volatility. In particular, what is the relationship between FX volatility and news
volume? In Figure 12, we present a stylised example, plotting the USD/JPY news
volume score using the Bloomberg News dataset against USD/JPY 1M implied
volatility. There does appear to be some sort of relationship.
In Figure 13, we do a more systematic analysis of this. We regress the news volume
against implied volatility in all our FX crosses. We report the T statistics of these
regressions. We find in nearly all cases (other than USD/NOK) that there is
statistically significant relationship between news volume and implied volatility. This
suggests that we can use news volume as a factor for modelling FX volatility.
Figure 12: USD/JPY news volume vs. 1M
implied volatility
Figure 13: Regressing news volume vs. 1M
implied volatility
Source: Cuemacro, Bloomberg Source: Cuemacro, Bloomberg
The fact is that there is a relationship between news and volatility. After all, when
less is happening in the market, unsurprisingly, there is less to write about. Also,
when it comes to future events, for example, a FOMC meeting or an election, if
market interest is great, this will tend to be reflected in news written about that
event.
Using news to understand pricing of major scheduled events in FX volatility
We have seen that news related to FX crosses has a strong positive correlation with
implied volatility in those crosses. In this section, we seek to extend this idea.
2
7
12
17
22
-2
-1
0
1
2
3
2014 2015 2016 2017
News Volume Score Smoothed
Implied
News Volume Score Implied Vol
0
5
10
15
20
25
30
EU
RU
SD
GB
PU
SD
AU
DU
SD
NZ
DU
SD
USD
CA
D
USD
NO
K
USD
SEK
USD
JPY
Vol-News
T-statistic
Seeking the cues in macro markets
13
Cuemacro Ltd. Non-independent investment research (see disclaimers)
However, rather than using news on FX crosses, we instead focus on news
associated with two major scheduled events, FOMC and ECB meetings.
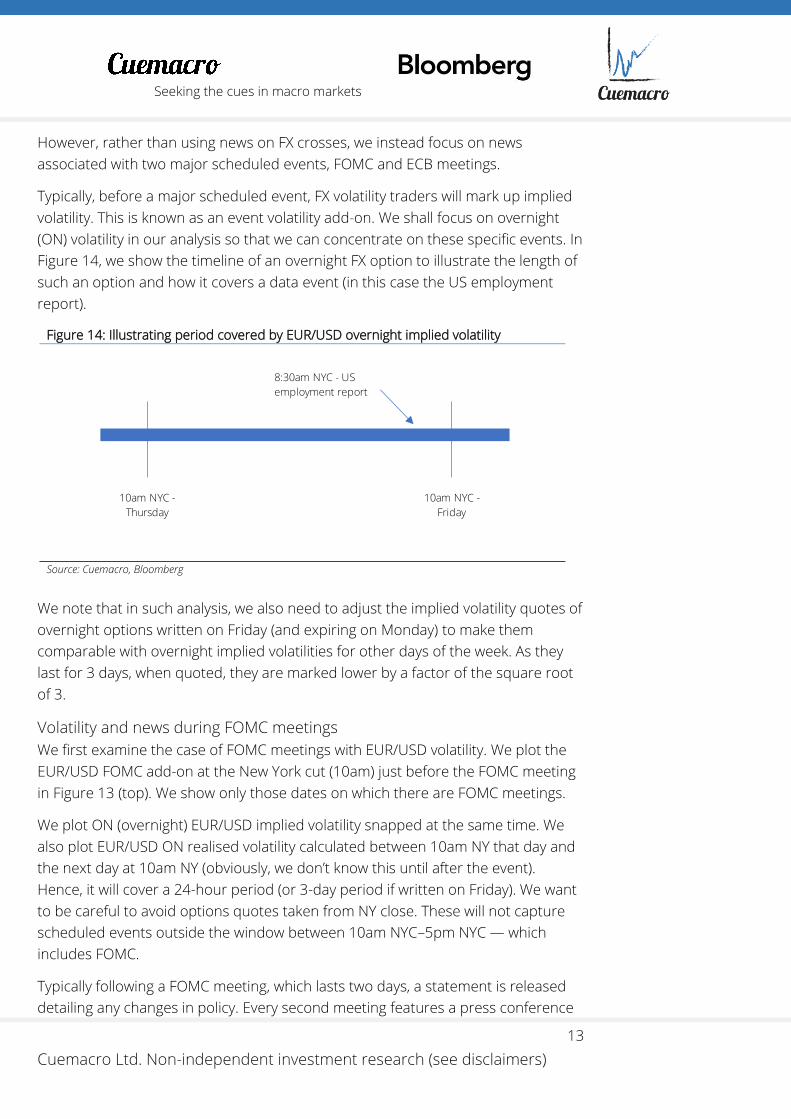
Typically, before a major scheduled event, FX volatility traders will mark up implied
volatility. This is known as an event volatility add-on. We shall focus on overnight
(ON) volatility in our analysis so that we can concentrate on these specific events. In
Figure 14, we show the timeline of an overnight FX option to illustrate the length of
such an option and how it covers a data event (in this case the US employment
report).
Figure 14: Illustrating period covered by EUR/USD overnight implied volatility
Source: Cuemacro, Bloomberg
We note that in such analysis, we also need to adjust the implied volatility quotes of
overnight options written on Friday (and expiring on Monday) to make them
comparable with overnight implied volatilities for other days of the week. As they
last for 3 days, when quoted, they are marked lower by a factor of the square root
of 3.
Volatility and news during FOMC meetings
We first examine the case of FOMC meetings with EUR/USD volatility. We plot the
EUR/USD FOMC add-on at the New York cut (10am) just before the FOMC meeting
in Figure 13 (top). We show only those dates on which there are FOMC meetings.
We plot ON (overnight) EUR/USD implied volatility snapped at the same time. We
also plot EUR/USD ON realised volatility calculated between 10am NY that day and
the next day at 10am NY (obviously, we don’t know this until after the event).
Hence, it will cover a 24-hour period (or 3-day period if written on Friday). We want
to be careful to avoid options quotes taken from NY close. These will not capture
scheduled events outside the window between 10am NYC–5pm NYC — which
includes FOMC.
Typically following a FOMC meeting, which lasts two days, a statement is released
detailing any changes in policy. Every second meeting features a press conference
10am NYC -
Thursday
10am NYC -
Friday
8:30am NYC - US
employment report

Seeking the cues in macro markets
14
Cuemacro Ltd. Non-independent investment research (see disclaimers)
— keenly observed by market participants. Typically, other data is also released
such as the Fed’s economic forecasts and the “dot plot” that gives rate forecasts for
individual FOMC members. However, the dots are not annotated with names.
We also show EUR/USD ON VRP (volatility risk premium) — the difference between
implied and realised. Vol traders can monetise this by gamma trading. When VRP is
heavily positive, it is beneficial for short gamma traders (option sellers). Conversely,
if VRP is negative, long gamma traders (option buyers) are likely to be profitable.
VRP, in general, tends to be positive. The rationale: insurance sellers need to be
compensated for their risk if they are selling volatility (premium). Hence, being
short gamma is usually profitable. The obvious caveat is that it can suffer from tail
risk on those rare occasions when realised volatility massively outperforms.
We also plot the FOMC event vol add-on in the same plot using a simple model that
compares the ON implied vol just before FOMC against that of the recent past. This
obviously assumes that most of the add-on is associated with FOMC and not with
other scheduled events on that day. This assumption can be problematic should
there be multiple important scheduled events on the same day.
We see that our model suggests that the add-on for FOMC is around 4 vol points in
ON EUR/USD implied vol. We also note that, for the most part, the volatility risk
premium is positive.
Can we use news flow to get an understanding of whether implied vol is cheap or
expensive over these days? Can it give us an indication of where realised volatility
could be over the event day? Is the event add-on priced correctly compared with
the news on that event?
In the bottom of Figure 15, we plot the FOMC standardised news volume score
against ON implied volatility in EUR/USD just before the event. We see what
appears to be a fairly strong relationship between Fed news flow and the implied
vol quoted just before the event. This seems intuitive, given that news flow is likely
to be correlated to the market’s interest in the FOMC meeting (and hence a
correlation with implied). If there is more media interest (and, by implication, more
market interest), it seems reasonable that options would be bid up more
beforehand. By contrast, if there is not much chatter about a pending FOMC
meeting, we wouldn’t expect as much hedging activity to occur beforehand.

Seeking the cues in macro markets
15
Cuemacro Ltd. Non-independent investment research (see disclaimers)
Figure 15: EUR/USD ON vol on FOMC days (top) vs. news (bottom)
Source: Cuemacro, Bloomberg
Volatility and news over ECB meetings
We repeat the exercise for ECB days, EUR/USD ON volatility and news associated
with ECB in Figure 16. Like with the Fed, an initial statement signals major changes
in monetary policy. However, unlike with the Fed, a press conference is held after
every ECB meeting.
As with the Fed, we see that the volatility risk premium (implied/realised) is nearly
always positive, suggesting that long gamma exposure is rarely likely to be
profitable over ECB meetings.
-10
0
10
20
30
40
2009 2010 2011 2012 2013 2014 2015 2016 2017
Add-on Implied Realised VRPVolatility
-3
-2
-1
0
1
2
3
0
5
10
15
20
25
30
35
2009 2010 2011 2012 2013 2014 2015 2016 2017
Implied Fed News VolumeVolatility News Score

Seeking the cues in macro markets
16
Cuemacro Ltd. Non-independent investment research (see disclaimers)
Figure 16: EUR/USD ON vol on ECB days (top) vs. news (bottom)
Source: Cuemacro, Bloomberg
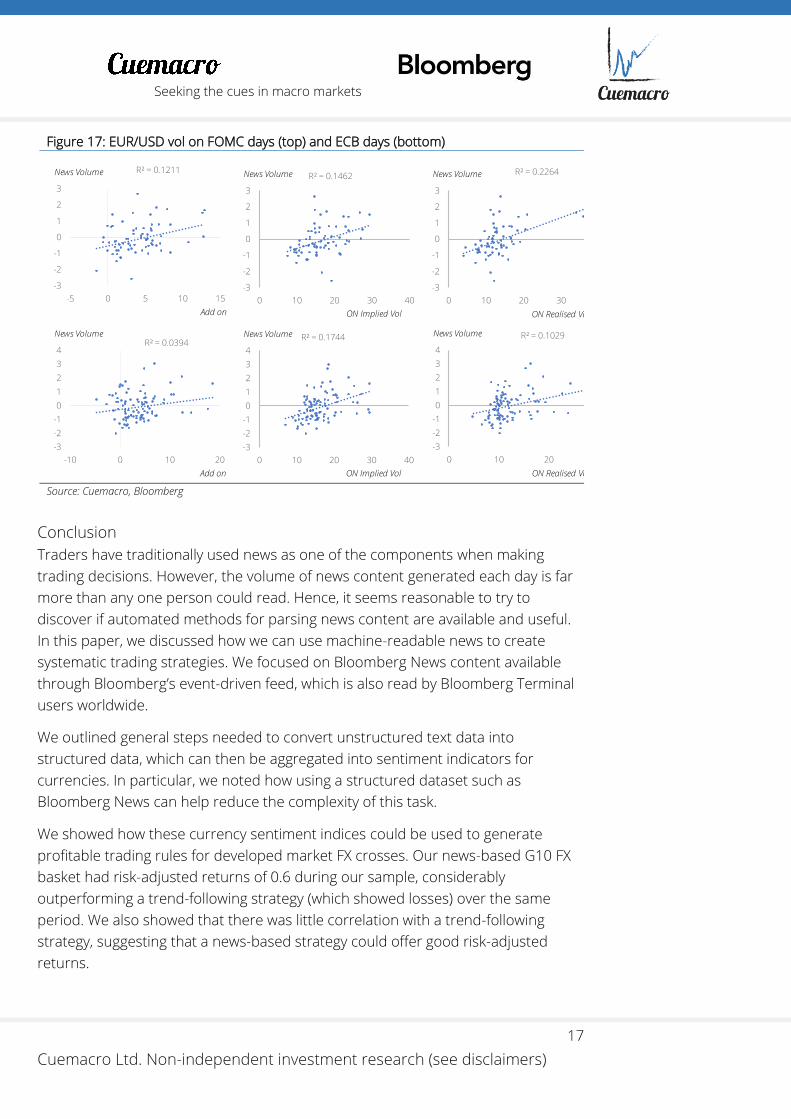
Generalised relationship between ECB, FOMC, volatility and news
We can aggregate all these observations into some scatter plots — plotting our
standardised news measure for FOMC and ECB against the EUR/USD ON event
add-on, ON implied volatility and ON realised volatility (see Figure 17). For both ECB
and FOMC meetings, there is a correlation in the volatility with news flow around
these events.
Whilst the R^2 of these regressions are not huge, there does appear to be some
relationship — which suggests that we could potentially use news flow around ECB
and FOMC to seek to understand whether implied vols are cheap versus general
market interest (as proxied by the news flow) or expensive. Hence, potentially, FX
options traders could use news flow indicators to judge whether it was worthwhile
to be long or short gamma over these events. It also to some extent helps you
understand whether the event vol add-ons for these events are reasonable.
Outside of trading-use cases, news volume about future scheduled events could
also be useful to risk managers as a metric to assess whether those scheduled
events could push the firm’s risk over pre-defined limits.
-10
0
10
20
30
40
2009 2010 2011 2012 2013 2014 2015 2016 2017
Add-on Implied Realised VRPVolatility
-3
-2
-1
0
1
2
3
4
0
5
10
15
20
25
30
35
2009 2010 2011 2012 2013 2014 2015 2016 2017
Implied ECB News VolumeVolatility News Score
Seeking the cues in macro markets
17
Cuemacro Ltd. Non-independent investment research (see disclaimers)
Figure 17: EUR/USD vol on FOMC days (top) and ECB days (bottom)
Source: Cuemacro, Bloomberg
Conclusion
Traders have traditionally used news as one of the components when making
trading decisions. However, the volume of news content generated each day is far
more than any one person could read. Hence, it seems reasonable to try to
discover if automated methods for parsing news content are available and useful.
In this paper, we discussed how we can use machine-readable news to create
systematic trading strategies. We focused on Bloomberg News content available
through Bloomberg’s event-driven feed, which is also read by Bloomberg Terminal
users worldwide.
We outlined general steps needed to convert unstructured text data into
structured data, which can then be aggregated into sentiment indicators for
currencies. In particular, we noted how using a structured dataset such as
Bloomberg News can help reduce the complexity of this task.
We showed how these currency sentiment indices could be used to generate
profitable trading rules for developed market FX crosses. Our news-based G10 FX
basket had risk-adjusted returns of 0.6 during our sample, considerably
outperforming a trend-following strategy (which showed losses) over the same
period. We also showed that there was little correlation with a trend-following
strategy, suggesting that a news-based strategy could offer good risk-adjusted
returns.
R² = 0.1211
-3
-2
-1
0
1
2
3
-5 0 5 10 15
News Volume
Add on
R² = 0.1462
-3
-2
-1
0
1
2
3
0 10 20 30 40
News Volume
ON Implied Vol
R² = 0.2264
-3
-2
-1
0
1
2
3
0 10 20 30 40
News Volume
ON Realised Vol
R² = 0.0394
-3
-2
-1
0
1
2
3
4
-10 0 10 20
News Volume
Add on
R² = 0.1744
-3
-2
-1
0
1
2
3
4
0 10 20 30 40
News Volume
ON Implied Vol
R² = 0.1029
-3
-2
-1
0
1
2
3
4
0 10 20 30
News Volume
ON Realised Vol

Seeking the cues in macro markets
18
Cuemacro Ltd. Non-independent investment research (see disclaimers)
We discussed the behaviour of volatility around major scheduled events (FOMC
and ECB meetings). We used overnight implied volatility to back out how much
these events are typically worth in the market.
We also noted how typically realised tends to underperform implied over those
periods. We showed how news volume in currencies has a strong relationship with
implied volatility. Using a similar approach, we noted how news flow around FOMC
and ECB meetings was related to implied volatility before these events and, to a
lesser extent, the event volatility add-ons associated with them. We also showed
how news volume could be used to model subsequent realised volatility over
FOMC and ECB days. Furthermore, we briefly discussed other use cases, such as in
risk management.

Seeking the cues in macro markets
19
Cuemacro Ltd. Non-independent investment research (see disclaimers)
Appendix: Computation tips and tricks
The Bloomberg News dataset that we examined is reasonably large in the order of
gigabytes/terabytes. Admittedly, such a dataset can fit on a single hard disk.
However, it is still large enough to warrant thinking about ways to speed up the
processing of the dataset, particularly if we would like to do a long-term back-test.
In our case, we have used Python primarily to process the dataset into daily scores.
Whilst not the fastest language, it has many pre-built libraries that help us process
our dataset. We give a brief outline of how we approached converting the text-
based news data into a time series of numerical scores. This time series of scores
can then be used elsewhere, for example, in further analysis such as the back-
testing of a trading rule.
• Convert daily XML into pandas DataFrames for each day
o Go through the XML file, line by line, identifying full news articles
(denoted by the ContentT tags)
o Create an XML tree for each full news article
o Grab specific XML tags of interest for our specific analysis (such as
date/time, event, tickers, topics, headline, body text, etc.) to keep,
throw away all the other tags
o Determine if tickers/topics match those we are looking for and body
text is of sufficient length
▪ Calculate sentiment using open source libraries
▪ Create a single data row
o For those articles where the tickers/topics are not of interest, throw
away those articles to save computation time
o Aggregate into a single pandas DataFrame for each row and dump
to disk, which is a lot smaller than the original XML file and is easier
to number crunch (eg. can easily run fast vectorized operations on a
pandas DataFrame)
• Use multi-process library to simultaneously parse many daily XML files as
the task can be done totally in parallel
The second step is to aggregate all the daily pandas DataFrames files into hourly
metrics
• Convert each daily pandas DataFrame file into a daily summary
o Filter news articles by specific events (ADD_STORY)
o For each ticker, calculate the daily news count and the total
sentiment for each hour of the day
• This can be done in parallel using multi-process
• Output is aggregated into a single file (eg. CSV file)

Seeking the cues in macro markets
20
Cuemacro Ltd. Non-independent investment research (see disclaimers)
The third step is to create a daily average:
• Convert the hourly pandas DataFrame data into a daily score (with a cut-off
at our daily close [ 5pm NYC for our spot backtest; 10am NYC for our
options analysis])
o The score is an average of the daily sum of sentiment/daily total
number of articles (ie. an equally weighted average of sentiment)
The next step can be done in Python or even in Excel because the size of our
dataset is very small. This involves computing Z scores, which is an input into our
trading rule. We use a rolling window for calculating of the Z scores. (Calculating a Z
score for the full sample would introduce look-ahead bias, which we should avoid
in a trading context.)
Whilst we have discussed the general approach of how to construct an algorithm
and some of the libraries we have been using in Python, we would expect that it
would be similar for other programming languages such as R (with similar libraries).

Seeking the cues in macro markets
21
Cuemacro Ltd. Non-independent investment research (see disclaimers)
Non-independent investment research disclaimer This investment research has not been prepared in accordance with legal requirements intended to promote the independence of investment research.
It is also not subject to any prohibition on dealing ahead of the dissemination of investment research. Cuemacro Ltd., its affiliates or staff may perform
services for, solicit business from, hold long or short positions in, or otherwise be interested in the investments (including derivatives), of any issuer
mentioned herein.
Material within this note is confidential and should not be copied, distributed, published or reproduced in whole or in part or disclosed by recipients to
any other person.
Any information or opinions in this material are not intended for distribution to, or use by, any person in any jurisdiction or country where such
distribution or use would be unlawful. It is intended purely for the consumption of professional investors.
Cuemacro Ltd. does not warrant or represent that the document is accurate, complete, reliable, fit for any particular purpose or merchantable and does
not accept liability for any act (or decision not to act) resulting from use of this document and related data. To the maximum extent permissible all
warranties and other assurances by Cuemacro Ltd. are hereby excluded and Cuemacro Ltd. shall have no liability for the use, misuse, or distribution of
this information. Past investment performance is no indication of future investment performance.
Cuemacro Ltd., Level39, One Canada Square, Canary Wharf, London E14 5AB, UK
Tel +44 20 3290 9624, e-mail [email protected]
web http://www.cuemacro.com
Cuemacro Ltd. is registered as a company in UK with company no. 10195390
Copyright © 2018 Cuemacro Ltd. All rights reserved