using infrared to monitor chinook salmon and other species in turbid waters
TRANSCRIPT

Ryan Cuthbert (FISHBIO)
Contributing Scientists: Stephen Zipper, Gabriel Kopp,
and Doug Demko
Going Beyond Visible Light: Using Infrared to Monitor Chinook Salmon and Other Species in Turbid Waters
• Vaki Riverwatcher Overview How does it work… What are the benefits…
• Salinas River Case Study Adult steelhead migration monitoring
• Stanislaus River Case Study Adult steelhead migration monitoring
Outline

• Uses and Advantages• Passive • Adaptable• Cost Effective• Effective in Extremely Turbid Conditions• Accurate• Remote Monitoring
Vaki Riverwatcher Overview
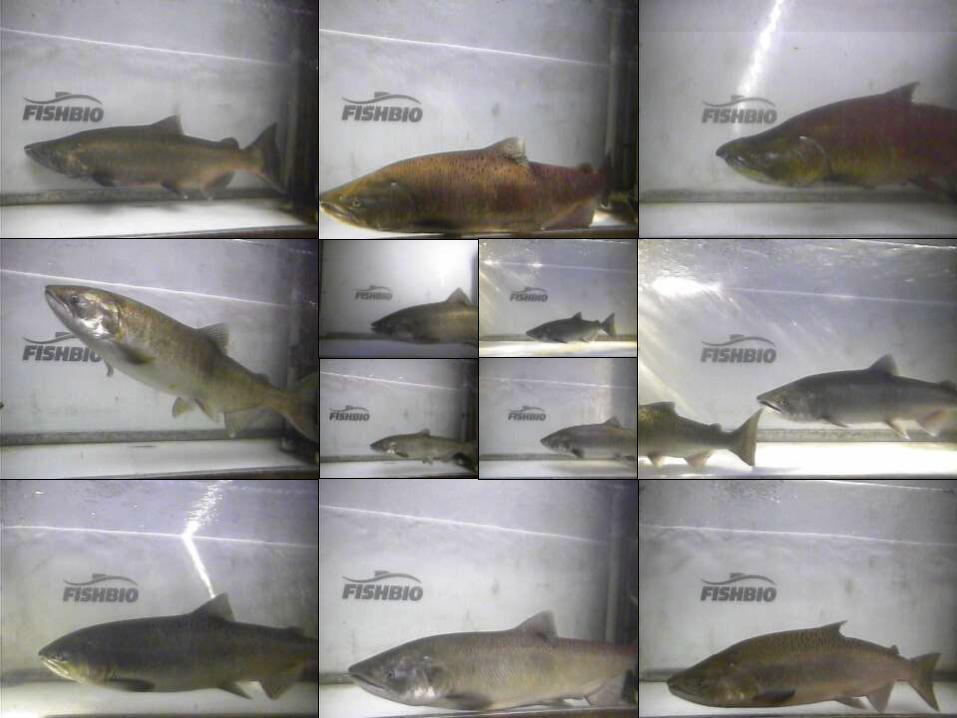
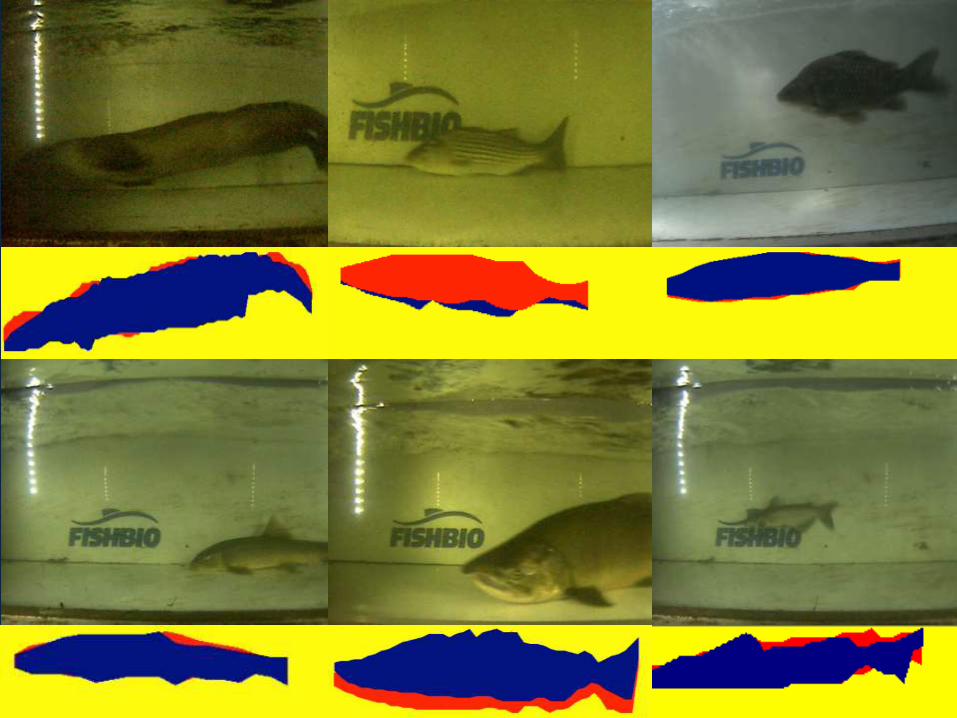
• Standard Riverwatcher• Estimates Length• Records Passage Date and Time• Determines Passage Direction• Silhouette Images• Records Speed and Position• Streamline Species ID
• Camera Riverwatcher• Video Clips
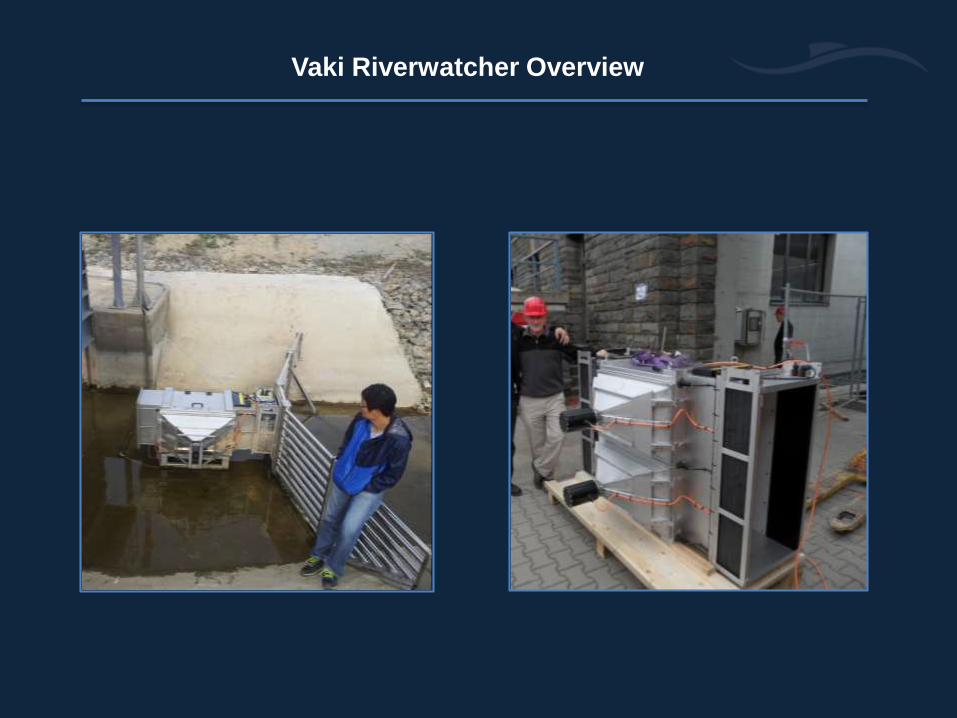
Vaki Riverwatcher Overview
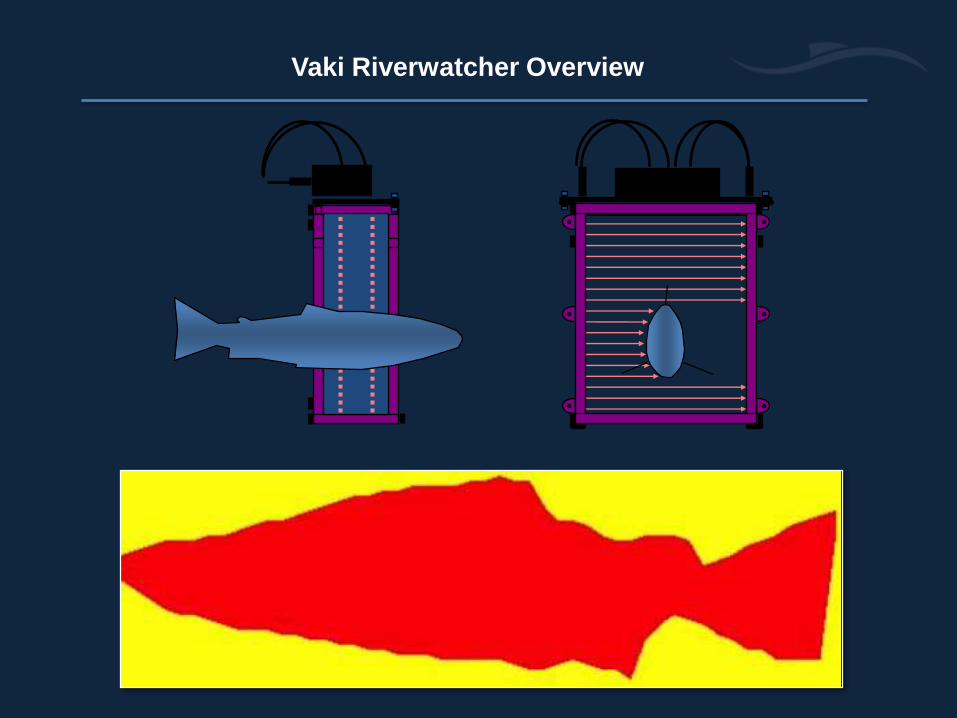
Vaki Riverwatcher Overview
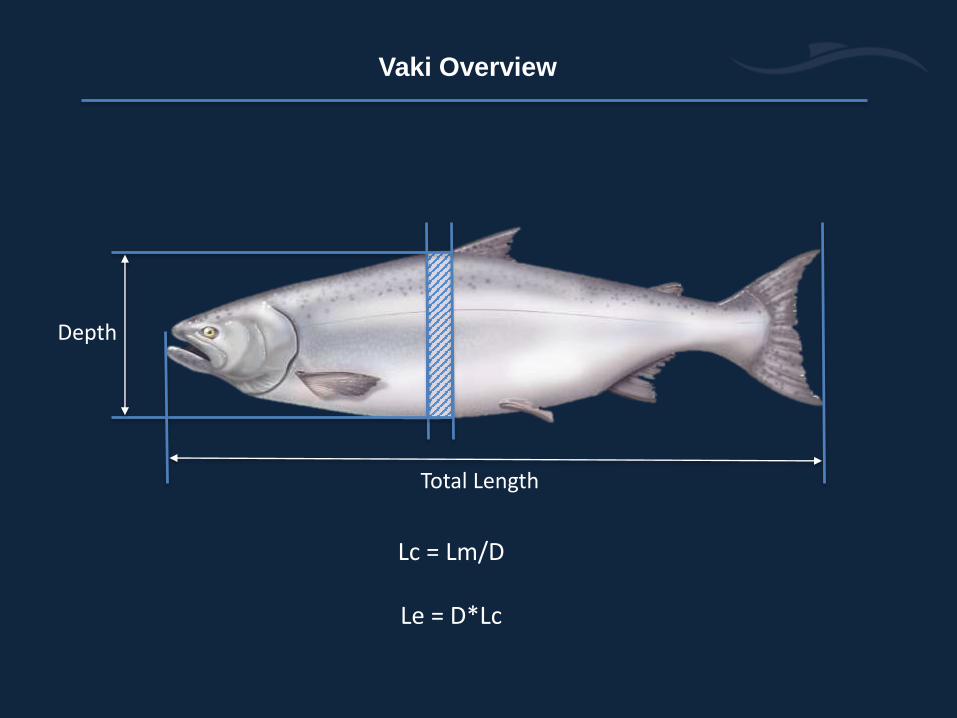
Vaki Overview
Total Length
Depth
Lc = Lm/D
Le = D*Lc

Vaki Riverwatcher Overview
Male Female
vs.
Adipose No Ad
vs.

Vaki Riverwatcher Overview
`Study Objectives
`Study Area
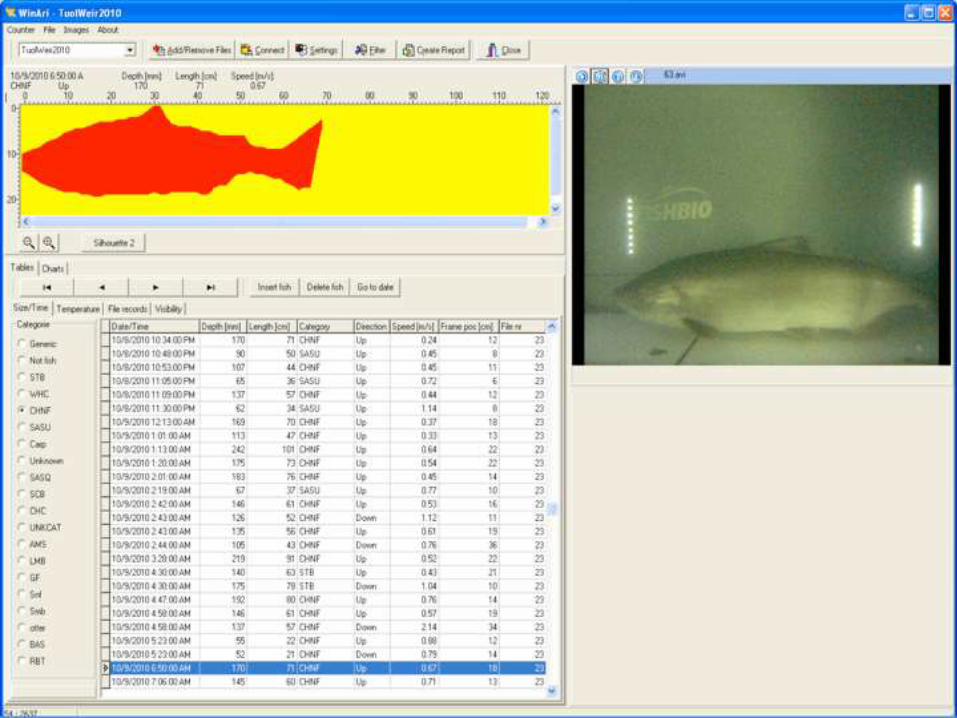
Winari Database
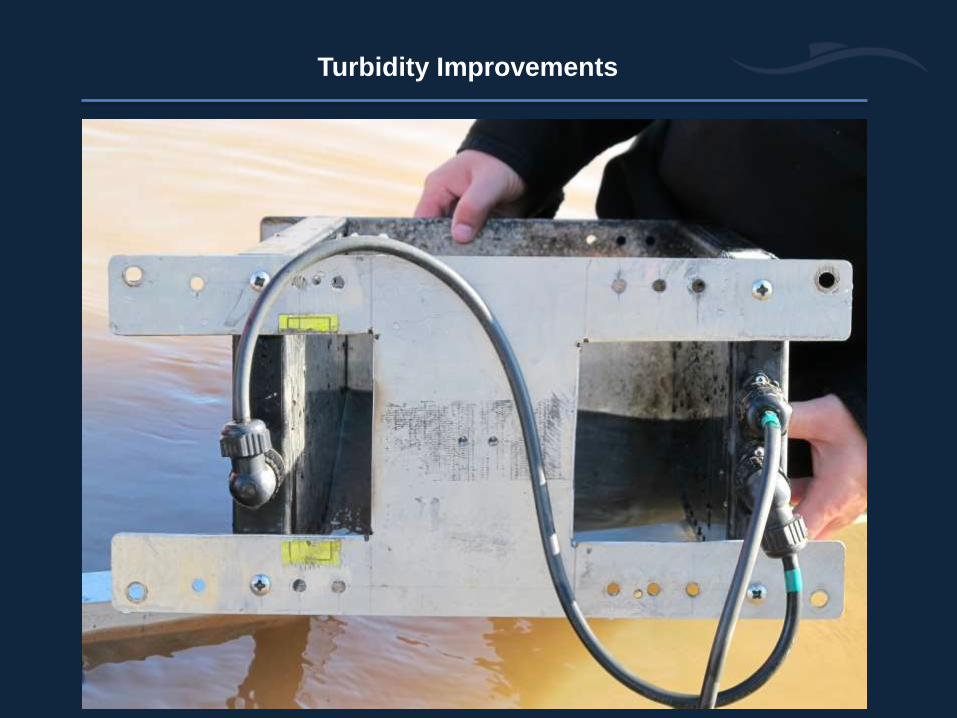
Turbidity Improvements

Turbidity Improvements
Passage tunnel with camera
and lights
Passage tunnel with air filled
chamber

`Case Studies
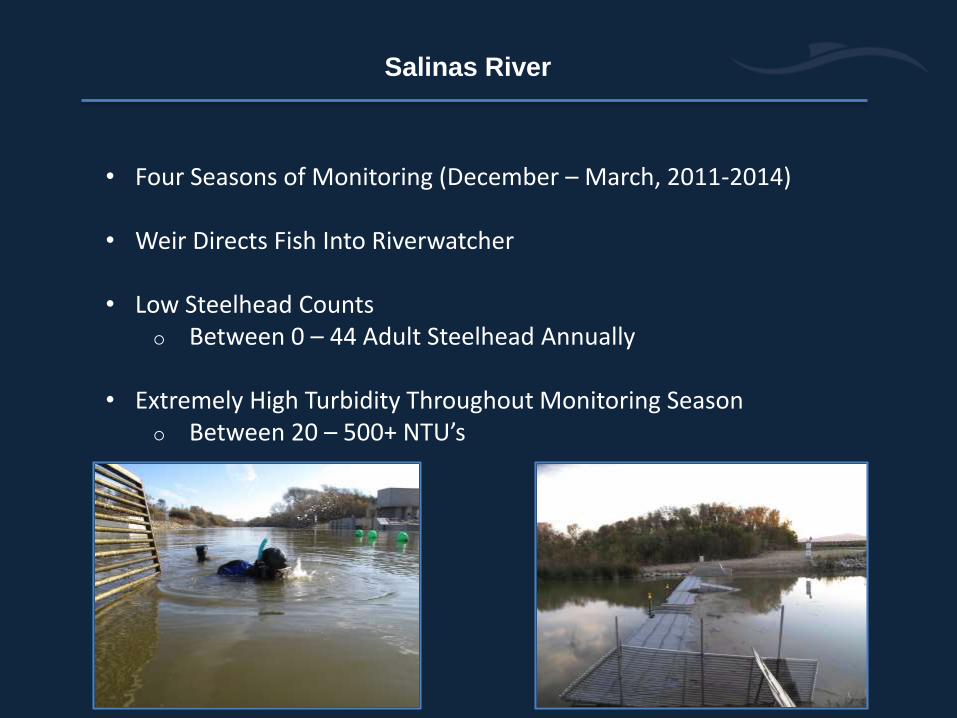
• Four Seasons of Monitoring (December – March, 2011-2014)
• Weir Directs Fish Into Riverwatcher
• Low Steelhead Counts Between 0 – 44 Adult Steelhead Annually
• Extremely High Turbidity Throughout Monitoring Season Between 20 – 500+ NTU’s
Salinas River

`Salinas River
Steelhead w/o AFC
Sac. Sucker w/ AFCSac. Sucker w/o AFC
Steelhead w/ AFC

Steelhead Passage and Flow 2010-11
N=13 Monitoring Initiated Weir Collapsed
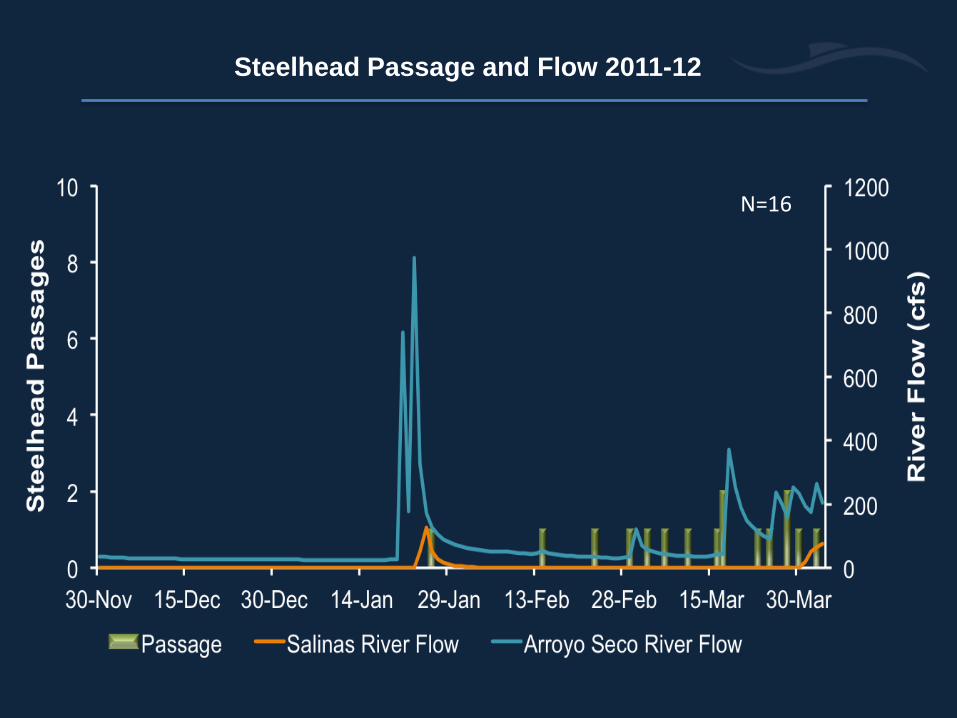
Steelhead Passage and Flow 2011-12
N=16
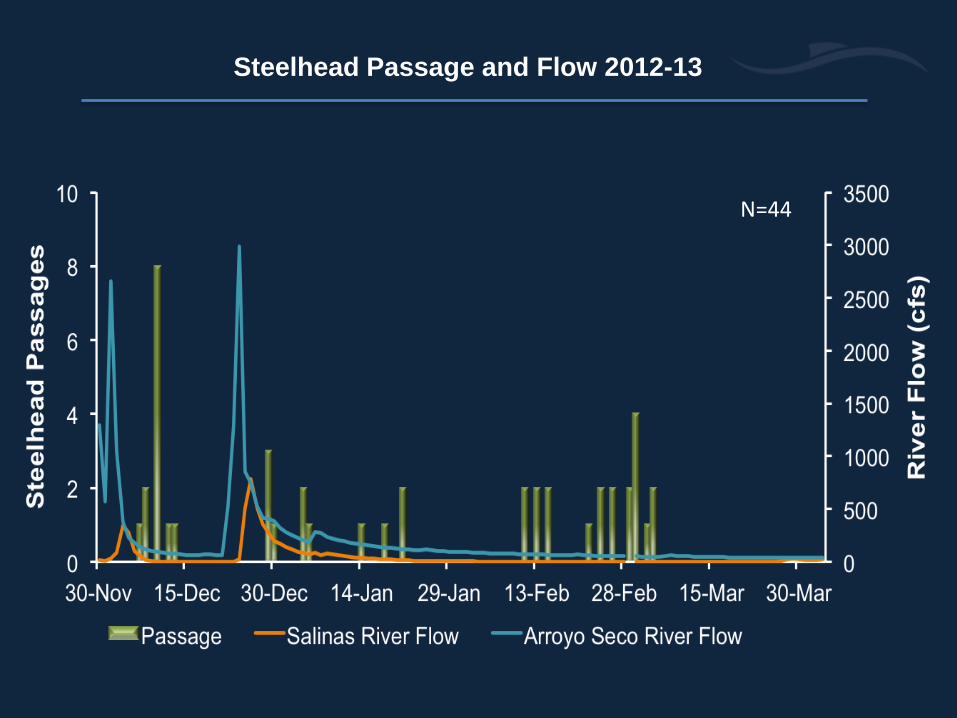
Steelhead Passage and Flow 2012-13
N=44
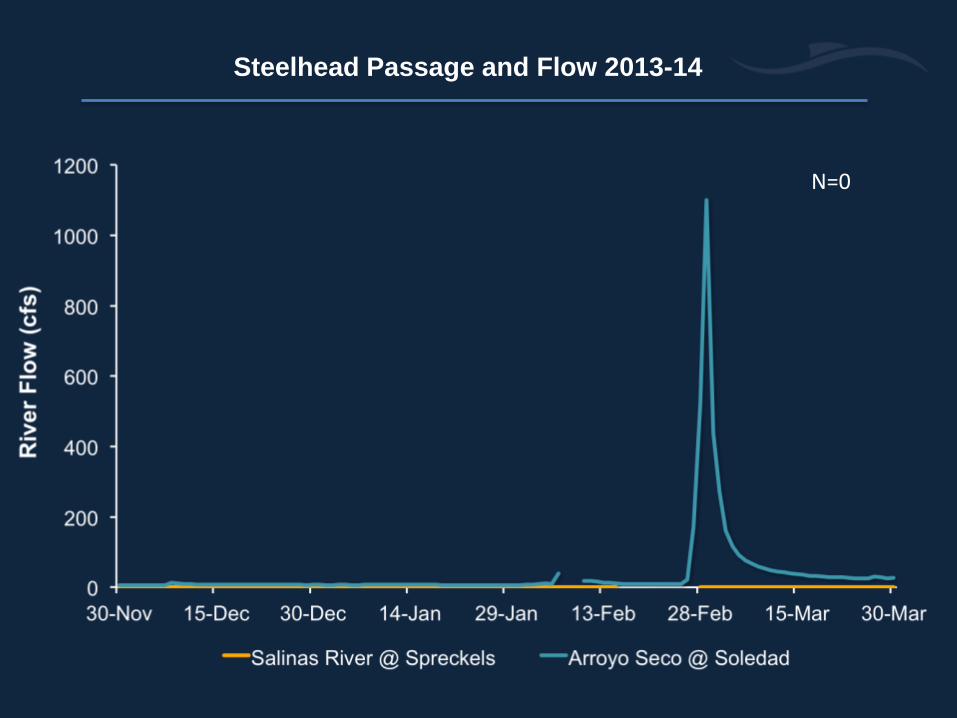
Steelhead Passage and Flow 2013-14
N=0
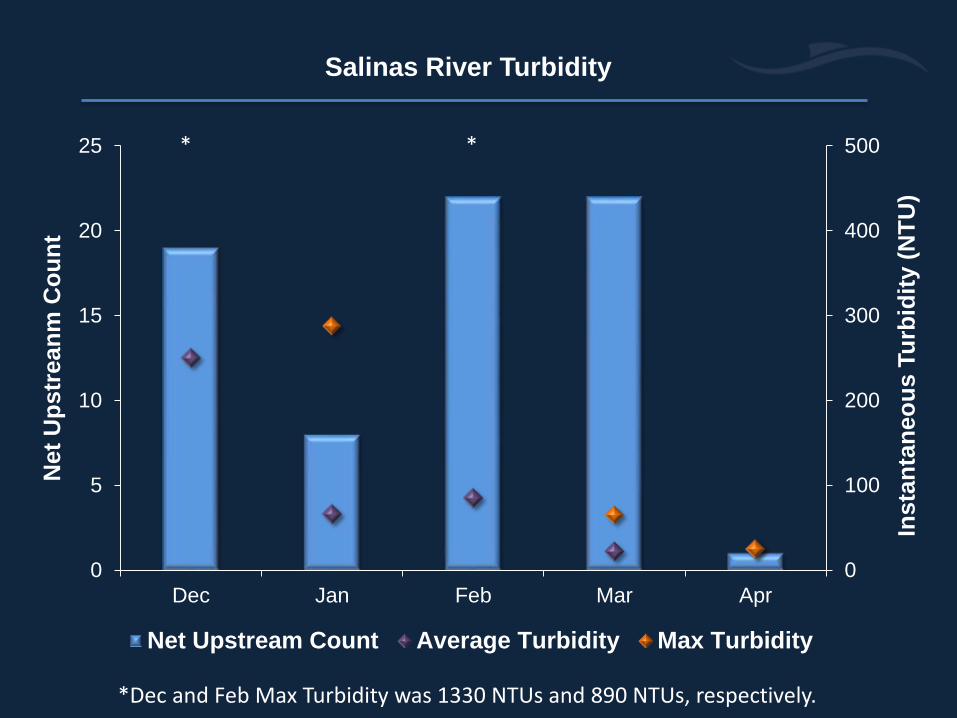
Salinas River Turbidity
0
100
200
300
400
500
0
5
10
15
20
25
Dec Jan Feb Mar Apr
Insta
nta
neo
us
Tu
rbid
ity (
NT
U)
Net
Up
str
ean
m C
ou
nt
Net Upstream Count Average Turbidity Max Turbidity
*Dec and Feb Max Turbidity was 1330 NTUs and 890 NTUs, respectively.
* *

• Eleven Years of Monitoring (2005-2015)
• Weir Directs Fish Into Riverwatcher
• Low Steelhead Counts 63 Total Steelhead
• High Turbidity During Steelhead Migration Periods
Stanislaus River
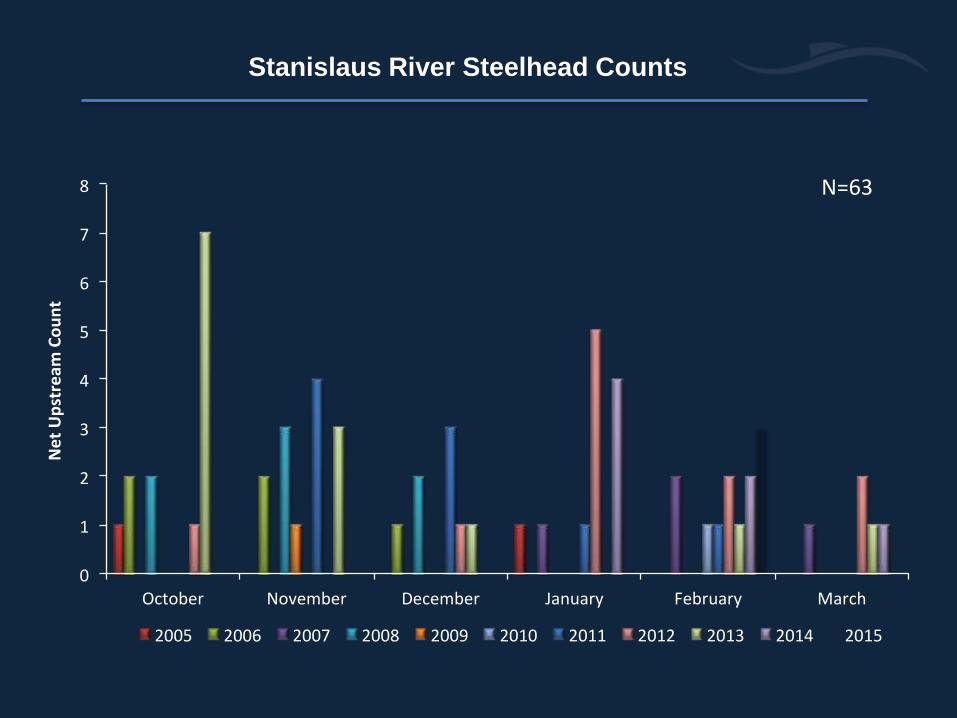
Stanislaus River Steelhead Counts
0
1
2
3
4
5
6
7
8
October November December January February March
NetUpstream
Count
2005 2006 2007 2008 2009 2010 2011 2012 2013 2014 2015
N=63
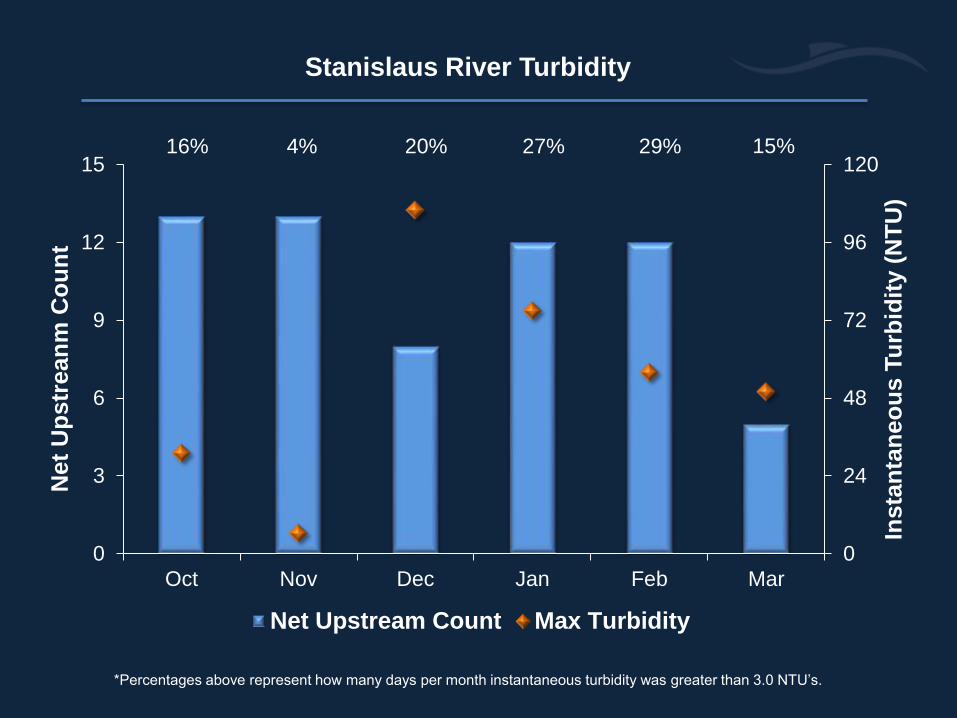
Stanislaus River Turbidity
0
24
48
72
96
120
0
3
6
9
12
15
Oct Nov Dec Jan Feb Mar
Insta
nta
neo
us T
urb
idit
y (
NT
U)
Net
Up
str
ean
m C
ou
nt
Net Upstream Count Max Turbidity
*Percentages above represent how many days per month instantaneous turbidity was greater than 3.0 NTU’s.
16% 4% 20% 27% 29% 15%
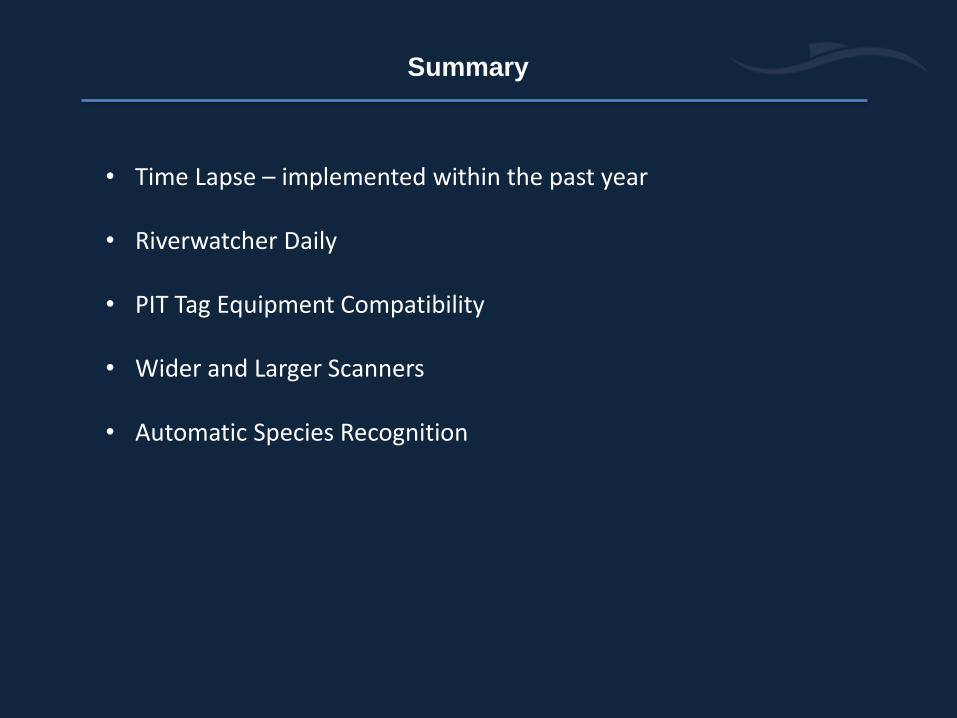
Summary
• Time Lapse – implemented within the past year
• Riverwatcher Daily
• PIT Tag Equipment Compatibility
• Wider and Larger Scanners
• Automatic Species Recognition

Thank You!