using google search trends to estimate global patterns in
TRANSCRIPT
Using Google Search Trends toEstimate Global Patterns in Learning
Serhat Arslan, Mo Tiwari, Chris PiechStanford University, Computer Science
[email protected], [email protected], [email protected]
ABSTRACTThe use of the Internet for learning provides a unique andgrowing opportunity to revisit the task of quantifying whatpeople learn about a given subject in different regions aroundthe world. Google alone receives over 5 billion searches a day,and its publicly available data provides insight into the learn-ing process that is otherwise unobservable on a global scale.In this paper, we introduce the Computer Science Literacy-proxy Index via Search (CSLI-s), a measure that utilizes onlinesearch data to estimate trends in computer science education.This measure uses statistical signal processing techniques toaggregate search volumes from a spectrum of topics into a co-herent score. We intentionally explore and mitigate the biasesof search data and, in the process, develop CSLI-s scores thatcorrelate with traditional, more expensive metrics of learning.Furthermore, we use search trend data to measure patterns insubject literacy across countries and over time. To the best ofour knowledge, this is the first measure of topical literacy viaInternet search trends. The Internet is becoming a growing toolfor learners and, as such, we anticipate search trend data willhave growing relevance to the learning science community.
Author KeywordsGoogle Search Trends, measuring quality education, Informaleducation, curricula patterns
1. INTRODUCTIONImproving education is an implicit objective of scientific com-munities like Learning at Scale, as well as other internationalinstitutions such as the United Nations. The United NationsSustainable Development Goal (SDG) 4 is to "Ensure inclusiveand equitable quality education and promote lifelong learn-ing opportunities for all." Quantifying progress towards thisgoal, however, has remained a difficult task – especially withregards to the quality of learning.
The problem of measuring education quality becomes espe-cially challenging when we consider rapidly changing topics
Permission to make digital or hard copies of all or part of this work for personal orclassroom use is granted without fee provided that copies are not made or distributedfor profit or commercial advantage and that copies bear this notice and the full citationon the first page. Copyrights for components of this work owned by others than theauthor(s) must be honored. Abstracting with credit is permitted. To copy otherwise, orrepublish, to post on servers or to redistribute to lists, requires prior specific permissionand/or a fee. Request permissions from [email protected]@S ’20, August 12–14, 2020, Virtual Event, USA.© 2020 Association for Computing Machinery.ACM ISBN 978-1-4503-7951-9/20/08 ...$15.00.http://dx.doi.org/10.1145/3386527.3405913
such as computer science and climate change. Computer sci-ence is more popular every year and is reaching an increasinglydiverse set of students [11]. Similarly, the rapidly-evolvingclimate crisis demands frequent revision of climate changecurricula.
Progress on SDG 4 has proven to so difficult to quantify thatthe United Nations has revisited whether it was an appropriateSDG at all [17]. Systematic reviews to understand how curric-ula are taught, and to whom, have been conducted [27, 4, 20].However, these reviews are expensive to administer aroundthe world, slow to respond to new curricula, and only includeclassroom education (thereby neglecting informal learning).Though often overlooked, informal learning is a crucial part ofthe overall fabric of education [8]. Furthermore, the numberof informal learners and their progress are not decisively avail-able, in contrast to class occupancy and examination scores informal institutions. As a result, global exams such as PISA areunsatisfactory measures of learning. Such exams are adminis-tered in a small handful of countries, only test core conceptslike literacy and numeracy in high school students, and areunable to answer questions about educational topics in thepopulation as a whole.
In contrast with the methods described above, Internet searchdata provides a unique opportunity to understand global ed-ucation. Google receives over 5 billion search queries a day,which is roughly 1 search per person per day globally. Theoverall search trend data is public and free. As the most pop-ular search engine, it presents an opportunity to learn abouttendencies and quantity of questions people have in differentregions. In the field of disease modelling, Google searchesare successfully used to track the spread of influenza, whichis a loose indication that search data might prove useful fortracking the spread of education [12].
As a motivating example, consider a user searching "How todetermine k in k-means clustering?" This user, by conductingthis search, signals curiosity which is largely unique to whenone is learning, teaching, or practicing artificial intelligence(AI). When this search is executed, the search data then con-tains a signal that this particular user is “AI-literate" or gainingAI-literacy. This single search tells us even more: we can ob-serve if the search was during school session and its temporalrelationship to other AI-related queries from the user.
One search from an individual, taken alone, may not paint avery convincing picture of CS literacy worldwide. However,

0
20
40
60
80
100
2 5 2 1 02 1 52 2 02 2 52
Summer BreakThanksgiving
020406080
100
01/01/2015 01/01/2016 01/01/2017 01/01/2018 01/01/2019 01/01/20202015 2016 2017 2018 2019 2020Rel
Vol
ume
Greenhouse Gas - USA
Greenhouse Gas Null Pointer
Winter BreakApr
28t
h
Bayes’ Theorem
Peak Search
50100
10
Volume
Summer BreakThanksgiving
020406080
100
01/01/2015 01/01/2016 01/01/2017 01/01/2018 01/01/2019 01/01/20202015 2016 2017 2018 2019 2020Rel
Vol
ume
Greenhouse Gas - USA
Greenhouse Gas Null Pointer
Winter BreakApr
28t
h
Bayes’ Theorem
Peak Search
50100
10
Volume
Summer BreakThanksgiving
020406080
100
01/01/2015 01/01/2016 01/01/2017 01/01/2018 01/01/2019 01/01/20202015 2016 2017 2018 2019 2020Rel
Vol
ume
Greenhouse Gas - USA
Greenhouse Gas Null Pointer
Winter BreakApr
28t
h
Bayes’ Theorem
Peak Search
50100
10
Volume
Summer BreakThanksgiving
020406080
100
01/01/2015 01/01/2016 01/01/2017 01/01/2018 01/01/2019 01/01/20202015 2016 2017 2018 2019 2020Rel
Vol
ume
Greenhouse Gas - USA
Greenhouse Gas Null Pointer
Winter BreakApr
28t
h
Bayes’ Theorem
Peak Search
50100
10
Volume
Bayes’ Theorem - USASummer Break
Winter Break
COVID-19Pandemic shutdown
2016 2017 2018 2019 2020
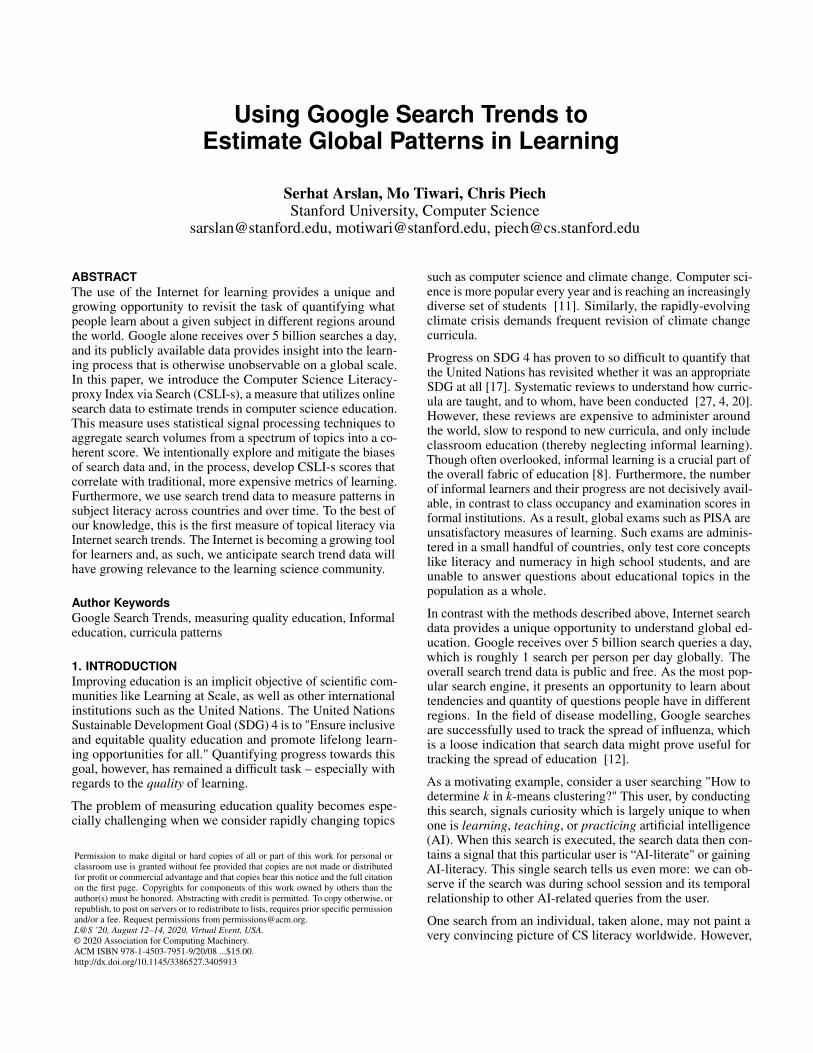
Figure 1. Visualization of data from Google search trends. Top Row: Cities with highest relative search volume for different topics, normalized.Greenhouse Gas, Bayes’ Theorem, and Null Pointers are keywords related to climate change, artificial intelligence, and computer science, respectively.Bottom Row: Temporal patterns for a search topic volume over 5 years in the USA, overlaid with school holidays and breaks.
when aggregated over millions of searches relating to artificialintelligence, consistent trends emerge that tell a broader storyof learning in a given population. Figure 1 visualizes the po-tential; there are clear patterns in the geography and timing ofGoogle searches. For example, there are seasonal patterns forthe keyword "Bayes’ Theorem": there are substantial dips insearch frequency when school is not in session (including inthe summer, when work in industry continues). We further ob-serve that the dip in searches during the COVID-19 pandemiccorresponds to the shutdown of schools that took place acrossthe United States. Though this dip is uncharacteristically largefor the season, interest in Bayes’ Theorem seems to quicklyresurge as students begin to learn from home.
Additional examples of search term frequencies are demon-strated in Figure 2. Each of the three plots shows the relativepopularity of a computer science topic over five years in theUnited States, overlaid with school holidays (orange). Thefirst topic, "Random Variables", is largely learned only duringthe school year. As such, it demonstrates a large decrease insearch frequency during the summer, winter, and Thanksgivingbreaks. The second example, "Markov Chain", demonstrates asimilar seasonal pattern, but the ratio of searches in the schoolyear to searches during the summer is smaller. The last exam-ple, "Machine Learning", demonstrates dips only during thewinter (i.e. Christmas) holiday. This suggests that "MachineLearning" is a concept which is searched for largely outsideof school, potentially in the workforce.
This observation of seasonal patterns in learning-related searchdata suggests the existence of signal in search trend data thatcaptures the utility of the search term both in formal schoolenvironments and informal environments outside of school[8]. Indeed, this observation provided significant motivationfor our work. We believe that, individually, no single searchterm measures literacy of computer science. As such, weinvestigate the composition of signals for a variety of searchterms to understand subject literacy.
More concretely, we propose the following research challenge:how can we use Internet search trends to measure the lit-eracy of a population with respect to a certain subject? Inthis paper, our main contributions are to:
Figure 2. Search terms exhibit strong, consistent seasonal patterns butto different degrees. Each graph is relative search volume over time inthe United States.
1. Pose the challenge of measuring depth of literacy via In-ternet search data and articulate the relevant biases of suchdata,
2. Identify strong seasonal patterns in education related searchtrend data that suggest the data is correlated with literacy,
3. Introduce a new measure, Computer Science Literacy-proxyIndex bu Search (CSLI-s), for extracting a measure of com-puter science literacy from raw search statistics, whichshows notable correlation with more expensive proxies,
4. Show corollary results including (i) uncovering trendsacross time and between countries and (ii) uncovering cur-ricula patterns amongst countries,
5. Open-source our code at: compedu.stanford.edu/
googleTrends.
Our results indicate that understanding subject literacy fromGoogle search data is a fast and free method to gain insightinto global education, especially for domains that require acomputer like computer science, and for geographical regionswhere there are no other known measures.

We add an important cautionary note: though this data is largein quantity, it is not the case that "big data" is a panacea forchallenges in estimating literacy [25]. In our analysis in Sec-tion 2, we provide a theoretical framework for articulating andaddressing the several confounding variables including, but notlimited to, the sampling bias in search data. It is hard, but notimpossible, to understand and work around these challenges.We discuss the limitations of measuring subject literacy fromsearch, but observe that despite the known challenges, it allowsinsight into previously unseen trends.
The analysis we provide is a proof of concept which couldbe used to analyze more fine-grained educational topics (suchas human-computer interaction learning or AI learning) andevaluating learning for other curricula, especially for domainsthat require a computer. We also hope that insights in thiswork provide inspiration measures of learning that distinguishformal and informal learning. Above all, we believe this re-search is a first step in new research directions for quantifyingglobal learning on a per-topic and per-region basis over time.
1.1. Related Work1.1.1. Measuring LearningMeasuring learning has been commonly studied in formal ed-ucation [9, 31, 41] and for informal learning [19, 45]. Inthe domain of informal learning, the resources an individualstudent uses is referred to as their Personal Learning Envi-ronments (PLE) [7]. While PLEs promote learning, theymake informal learning harder to measure due to limitationson access to private user data. Noting the dominance of onlineplatforms over PLEs, [1] provided detailed theory on onlinelearning. Several studies developed in response to the riseof massive open-access online courses (MOOC). The firstMOOCs were given by the CS departments of research univer-sities such as Stanford, MIT, Harvard, and Berkeley. In 2012,millions of students signed up for online courses on Coursera,EdX, and Udacity; with relatively little cost to entry or exit,MOOCs attracted learners with a wide range of backgrounds,intentions, or personal constraints to participation [35]. TheNew York Times declared 2012 the "Year of the MOOC" [35]and researchers sought to classify and quantify the informallearners who were choosing these platforms [24, 22]. Since2012, specialized platforms in CS which are open-access toformal and informal learners have developed such as Code.org,CodeAcademy, and KhanAcademy. The ways in which infor-mal learners use these platforms has become a large area ofresearch [36, 30, 38, 23].
1.1.2. Search Data for ScienceData from search engines has inspired researchers mostly toestimate or forecast economic indicators [5, 29, 10, 3, 18,14], e.g. unemployment or inflation rates. [39] uses real timesearch data to estimate political tendencies of voters in a re-gion, and show correlations with election statistics. Similarly,[37] and [12] predict the spread of influenza by using searchdata from Yahoo and Google, respectively. Also, [13] suggestusing online user data to monitor public health. These studiescommonly use the search data in regression models where datafrom official sources are also used as target variables. Themodel is then trained to fit the official sources and analyzed
for the significance of the search data. This requires a labeledtraining set, e.g. actual unemployment rates. Labeled data,however, is not available for informal learning. Consequently,the method proposed in our work does not train a supervisedmodel but rather uses statistical estimation tools to consolidatedifferent search trends and directly compare regions1 for agiven time interval.
1.2. OrganizationThe rest of this paper is structured as follows: In Section 2, wemathematically describe the challenge of estimating subjectliteracy from search data. In Section 3, we describe the dataavailable from Google Trends and, in Section 4, we present ourmethodology for measuring subject literacy from this data. InSection 5, we show that our measure has a strong correlationwith other traditional and more expensive measures. Further-more, in Section 6, we find that our metric reveals additionalinformation about the geographical patterns in computer sci-ence curricula. In Section 7, we discuss best practices for ourmethods and how they could be applied to subjects other thancomputer science. We conclude in Section 8 with implicationsof our work for future research.
2. THEORY OF ESTIMATING LITERACY FROM SEARCHIn this section, we provide a mathematical formalization ofour goal to estimate literacy from publicly available searchdata. Our formalization will provide a precise language forunderstanding our claims, assumptions, and the limitations ofassessing subject literacy from search data.
Literacy Index: A meaningful subject literacy index for aregion r should be a number, Θr, which captures the depth ofhow much the average person in a region knows about a givensubject at a given point in time. The computation of Θr couldassume that each individual i has their own literacy score, θi,where the literacy index for a region r is the average of theseindividual literacies, Θr = Ei∈r[θi]. Ideally, the measurementfor such a literacy index would require (1) a consortium ofwell-represented world experts design a test on a given subjectand (2) have the test administered to a representative subsetof people from each region. The value of Θr would be theaverage of such test scores. This test would be repeated foreach region r at regular time intervals, e.g. annually. Indeed,this is the methodology used to compute Financial LiteracyIndex [33] maintained by the Organisation for Economic Co-operation and Development (OECD) in the Group of Twenty(G20) countries. Unfortunately, it would be a prohibitivelyexpensive to run this ideal measurement for all topics and allcountries. As such, we attempt to find a proxy measure toapproximate Θr using readily available Internet search data.In order for a literacy index to be useful, we require that themeasure correlates with proficiency in the topic, as measuredby other methods such as standardized exams.
In the development of our proposed index, we assume thatvalues θi are non-negative and that Θr = 0 indicates that region1Google Trends defines regions which usually correspond to coun-tries. Some districts, however, are presented separately from thepolitical entity on which they depend. We have also calculated CSLI-s for regions instead of countries.

r has no literacy of a subject. Note that a subject literacy index,taken alone, would be a single summary statistic of a regionbut does not describe the distribution of θi completely.
Search-Based Proxy: In this work, we propose a subjectliteracy index computed from Internet search data. However,Internet data has several confounds, including a samplingbias. Instead of measuring learning from a random sample ofindividuals, we propose measuring learning from those whoare using a search engine while learning. Based on a fewassumptions, described in detail below, we claim that Θr canbe measured as:
Θr ≈ Pr(ar) · E[θi|ar] (1)
and that this measurement is unbiased for the subject of com-puter science. In Equation 1, Θr is the literacy index of regionr, Pr(ar) is the probability that a user in region r has access toInternet search, and E[θi|ar] is the average amount of searchfrequency and keyword diversity in a subject for users in rwho have access to search. In the following subsections, wepresent motivation for Equation 1. Understanding the motiva-tion illuminates both why measuring literacy from search is apromising opportunity and the ways in which we mitigate theeffects of biases present in Internet search data.
Motivation for Equation 1: Using the law of total expecta-tion, we can decompose the literacy score calculation into twoterms, one for those who have access to search while learningand a term for those who do not:
Θr = E[θr] = E[θi|ar] ·Pr(ar)+E[θi|not ar] ·Pr(not ar) (2)
Assumption 1 (Literacy without access to search): Internetsearch is increasingly becoming part of learning, especiallyfor disciplines that require a computer such as computer sci-ence and graphic design [32, 6]. As such, we assume thatE[θi|not ar] ·Pr(not ar), the term that represents the subjectliteracy of people who do not have access to search, is closeto zero. Mathematically, this is true if either or both of thecomponents is near zero and the other is not unreasonablylarge. In particular, if access to Internet search is universalthen Pr(not ai) is zero. On the other hand, if it is unlikelythat a user who does not have access to search is literate inthe given subject then E[θi|not si] is also close to zero. At thetime of the writing of this work, the latter claim is especiallybelievable for domains that require computers, such as com-puter science. Furthermore, while access to Internet searchmay not be universal, it has only increased in the last 20 years,especially in education [32, 6]. Given these assumptions,we take the second term in Equation 2 as negligible. Thisassumption should be re-evaluated before being applied tonon-computer-based disciplines.
Assumption 2: Search Depth as a Proxy for Literacy: Thesecond assumption we make is that search frequency andtopical breadth is a reasonable proxy for subject literacy. Pre-vious research [40] suggests that this assumption is reason-able for engineering disciplines, as information-seeking hasbeen shown to be a substantial part of problem-solving inthose fields [40]. Mathematically, we therefore claim thatE[θi|ar] ≈ E[θi|ar], where E[θi|ar] is the estimate of literacy
based on Internet search data. Whether this holds, dependslargely on the methodology used to compose raw search datainto a measure of literacy, i.e. the exact computation of E[θi|ar](see Section 5). We note that, in many other fields, information-seeking is not an indication of literacy, but rather an indicationthat a user is learning for the first time. To acknowledge thisassumption, we consider our index a “literacy-proxy" and nota standard subject literacy measure.
The result of these assumptions is a simple formula:
Θr = E[θr|ar] ·Pr(ar)+E[θr|not ar] ·Pr(not ar) (Equation 2)≈ E[θr|ar] ·Pr(ar) (Assump. 1)
≈ E[θr|ar] ·Pr(ar) (Assump. 2)
This theory provides a groundwork for future researchers toargue for better proxy measurements of literacy. While theseassumptions are significant, we believe that they are appropri-ate for measuring computer science literacy. Furthermore, wesuggest that proposed measures and their assumptions can bevalidated by measuring their correlation with standard, moreexpensive tests of subject literacy. Moreover, we note that theassumptions presented herein are testable and the extent towhich they are violated may be quantifiable. We leave meth-ods to use such knowledge to mitigate known biases to futurework.
3. GOOGLE TRENDS DATAIn this work, we use data from the Google search engine,which releases its search data publicly via Google Trends [15].Google Trends presents a time series of Google search statis-tics for countries and sub-regions around the world. Trendsautomatically categorizes searches by topics and combinessearches across different languages (e.g. "Artificial Intelli-gence" and "Kecerdasan Buatan", the Malay translation, aregrouped together in the same topic). Google Trends does notexpose the precise number of searches for a topic over a timeframe in a given region. Instead it provides several secondarystatistics, described below.
3.1. Interest by RegionFor a single keyword k, Google Trends provides the ratio ofqueries for k to the number of total queries in each region,normalized to 100 divided by the maximum of this ratio overall regions. This data allows comparing different regions’relative interest in the same keyword. More concretely, if thereare sk(r, t) queries for keyword k in region r in timeframe tand S(r, t) total queries in region r for timeframe t, GoogleTrends exposes the following value for region r in time t:
Vk(r, t) =sk(r, t)S(r, t)
×M where M =100
maxisk(i,t)S(i,t)
For example, we can observe that in 2019:
VBayes Theorem(Seoul,2019) = 100
VBayes Theorem(Mexico City,2019) = 59
VBayes Theorem(Bengaluru,2019) = 52
This means that the percentage of Google searches from Mex-ico City for "Bayes Theorem" is 59% of the correspondingpercentage of searches in Seoul for the same topic. GoogleTrends also marks regions with low volume of search, ie.Madagascar. Such regions have either limited access to theInternet or an unusually low market share for Google. GoogleTrends data from these regions does not precisely representthe population in general and, as such, we omit the data fromlow search volume regions in all of our analyses.
3.2. Comparative Interest by RegionAdditionally, Google Trends exposes the relative popularitybetween two topics. This value is the fraction of queries fora topic A over the sum of queries for topic A and B. Moreprecisely, region r over time t is assigned a value of
V(A,B)(r, t) =sA(r, t)
sA(r, t)+ sB(r, t)
scaled to 100 in total for comparison of keywords A and B.This data allows comparing different keywords relative fre-quencies’ in a given region.
3.3. Comparative Interest by Time:Finally, Google Trends also exposes keywords’ relative in-terest over time. For a given timeframe and region, GoogleTrends exposes a value which reflects how the popularity ofthat term has changed, on a weekly basis, over the timeframe.We denote this value by TA(r, ti), which represents the compar-ative interest in topic A in region r over week ti:
TA(r, ti) =sA(r, ti)S(r, t)
· k where k =100
max jsA(r,t j)
S(r,t)
We also note certain caveats for the different values describedin Sections 3.1, 3.2, and 3.3. Only 80.1% of Internet searchtraffic is on Google and there are notable differences betweencountries. For example, market share for Google Search is97% in India, 95% in Brasil, 81% in the USA. Two notable ex-ceptions to the high market share are Russia (49%) and China(6%) [42]. As such, we expect results from these countries tobe less trustworthy.
4. MEASURING CS LITERACY-PROXY FROM GOOGLESEARCHWhile we hope to be able to measure literacy of a variety ofsubjects, computer science is a natural first subject to inves-tigate since it (mostly) requires a computer to learn. Thereare many traces of online behavior that may correlate withinformal CS learning (Google Search queries, Code.org par-ticipation, GitHub commit activity, Stack Exchange browsing,etc.), but we do not have a well-defined way to use these proxycorrelations to paint a picture of CS exposure for differentcountries.
In this section we describe our proposed metric, ComputerScience Literacy-proxy Index by search (CSLI-s), as a countrylevel score which quantifies the per-capita quality of computerscience education based on Google Trends data.
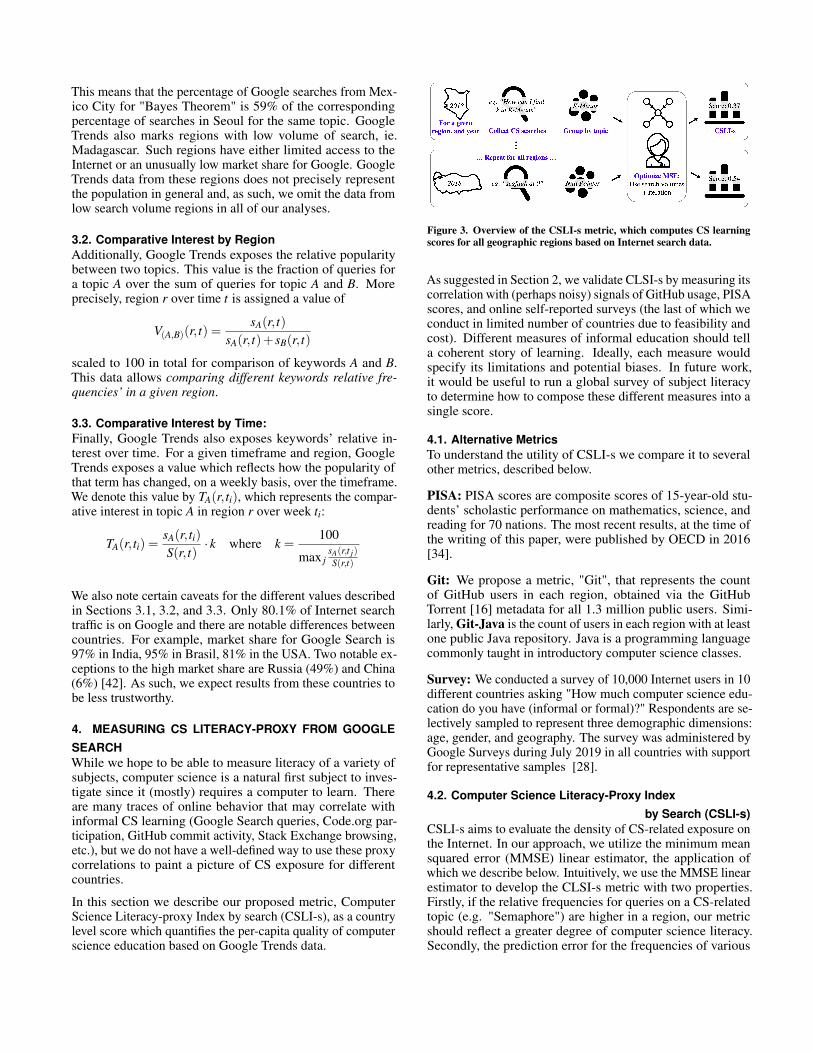
Figure 3. Overview of the CSLI-s metric, which computes CS learningscores for all geographic regions based on Internet search data.
As suggested in Section 2, we validate CLSI-s by measuring itscorrelation with (perhaps noisy) signals of GitHub usage, PISAscores, and online self-reported surveys (the last of which weconduct in limited number of countries due to feasibility andcost). Different measures of informal education should tella coherent story of learning. Ideally, each measure wouldspecify its limitations and potential biases. In future work,it would be useful to run a global survey of subject literacyto determine how to compose these different measures into asingle score.
4.1. Alternative MetricsTo understand the utility of CSLI-s we compare it to severalother metrics, described below.
PISA: PISA scores are composite scores of 15-year-old stu-dents’ scholastic performance on mathematics, science, andreading for 70 nations. The most recent results, at the time ofthe writing of this paper, were published by OECD in 2016[34].
Git: We propose a metric, "Git", that represents the countof GitHub users in each region, obtained via the GitHubTorrent [16] metadata for all 1.3 million public users. Simi-larly, Git-Java is the count of users in each region with at leastone public Java repository. Java is a programming languagecommonly taught in introductory computer science classes.
Survey: We conducted a survey of 10,000 Internet users in 10different countries asking "How much computer science edu-cation do you have (informal or formal)?" Respondents are se-lectively sampled to represent three demographic dimensions:age, gender, and geography. The survey was administered byGoogle Surveys during July 2019 in all countries with supportfor representative samples [28].
4.2. Computer Science Literacy-Proxy Indexby Search (CSLI-s)
CSLI-s aims to evaluate the density of CS-related exposure onthe Internet. In our approach, we utilize the minimum meansquared error (MMSE) linear estimator, the application ofwhich we describe below. Intuitively, we use the MMSE linearestimator to develop the CLSI-s metric with two properties.Firstly, if the relative frequencies for queries on a CS-relatedtopic (e.g. "Semaphore") are higher in a region, our metricshould reflect a greater degree of computer science literacy.Secondly, the prediction error for the frequencies of various

topical search terms should be minimized, which would sug-gest that our metric is a useful proxy for CS literacy.
4.3. Background: The MMSE Linear EstimatorIntuitively, we model the underlying structure of our systemwith a single scalar latent variable for each region, represent-ing its average subject literacy, and a single vector of observedvariables, representing the keyword search frequencies. Theinput of the system is θr, which represents the extent of com-puter science learning for a random person in region r. Theoutput of the system is the vector W r ∈ IRM , which representsthe relative popularity for the keywords in region r.
A naive estimator would calculate E[Θr|W r], the expectedvalue of computer science literacy conditioned on the relativekeyword popularity. However, the conditional distribution ofcomputer science literacy, conditioned on the search data isunknown. Therefore, we use the Minimum Mean Square ErrorLinear Estimator to estimate Θr.
The MMSE linear estimator [26] assumes that the input-outputrelationship is affine, as shown in Equation 32 :
Θr = ΣTWΘΣ
−1W W r (3)
where ΣW is the covariance matrix for the keyword frequenciesand ΣT
WΘ= [σW1Θ, . . . ,σWMΘ] denotes the covariance vector for
the relationship between keywords frequencies and computerscience literacy. As its name suggests, the MMSE linearestimator minimizes the expected mean squared error betweenΘr and our estimate Θr amongst all models that are linearbetween Θr and the observed W r. The use of these values forthe calculation of CSLI-s is provided in Section 4.4.
We can also estimate the average error for the MMSE. Themean square error of the MMSE Linear Estimator is:
MSEMMSE =Var(Θ)−ΣTWΘΣ
−1W ΣWΘ (4)
where Var(Θ) is the variance of the calculated estimations. Weuse MSEMMSE to iteratively determine the correlation betweenthe keyword search frequencies, Wi, and CS literacy Θ.
4.4. Estimation DataOur data matrix of Google Trends values has N = 65 rows,each corresponding to a region of high search volume3, andM = 26 columns, each corresponding to the popularity ofa specific keywords selected for the calculation of CSLI-scolumns. We originally generated a list of 67 keywords rel-evant to CS via a survey administered to faculty of Stanford2For simplicity, we can assume E[W r] = E[Θr] = 0 without loss ofgenerality, since an additive shift of these values would not affect therankings of different regions.3The following regions that lack data on CS-related keywords, al-though not officially listed as low search volume regions by Google,are excluded in the CSLI-s calculations: Costa Rica, Venezuela,Lithuania, Guatemala, Ethiopia, Uzbekistan, and Cameroon. Chinais also excluded because of the ban on Google and limited use ofGoogle in the country.
University Computer Science department in 2019. Facultylisted all terms that they thought were indicative of literacyin computer science. Terms without sufficient data for everyregion are excluded. Figure 4 shows the standard deviationin the count of queries for each keyword, sorted by keywordpopularity4. As the popularity of the keywords decreases, thestandard deviation of their frequencies (and hence the amountof information provided by the frequency of correspondingqueries) across regions decreases as well. The distribution offrequencies appears Zipfian and suggests that the most popularkeywords are the most informative. The data becomes highlysparse after the shaded border and the standard deviations dropsharply; thus, keywords to the right of the shaded border areexcluded in the CSLI-s calculations.
Creation of the data matrix begins with the interest by regiondata (as defined in Section 3.1) for the most popular key-word in our list, VJava(r, t), in the first column. The followingcolumns are filled with the comparative interest by regiondata (as defined in Section 3.2), normalized by the previouscolumns’ entries. More precisely, our data matrix D ∈ RNxM
is defined by:
Di j(t) =
{VJava(i, t) j = 1
Vj−1(i, t)×V( j, j−1)(i,t)V( j−1, j)(i,t)
j > 1
where we have abused notation and simultaneously used j torespond to the jth most popular keyword ( j = 1 correspondsto "Java") and its index.
4.5. Calculation of CSLI-sThe computation of CSLI-s requires generating covariancevectors and matrices for each region and substituting theirvalues into Equation 3. The steps for generating those vectorsand matrices are described below.
ΣW (t) is the covariance amongst the columns of the data matrixD(t). It intentionally depends explicitly on year, because theexplanatory power of a given keyword frequency, given theother keywords’ frequencies, may change over time.
Each entry of ΣTWΘ
= [σW1Θ, . . . ,σWMΘ] is the covariance be-tween a keyword and computer science learning. Note thatthe following relationship holds: σWiΘ = ρWiΘσWiσΘ, whereσWi and σΘ are the standard deviations of their respective ran-dom variables and ρWiΘσWi is the correlation between Wi, thepopularity of searches for i, and Θ. σWi is calculated similarlyto ΣW above. In our iterative procedure, we calculate σΘ asthe standard deviation among the estimated Θ values and it-eratively adjust ρWiΘ values to ensure the observed standarddeviations are consistent, where the MSE is minimized.
Each ρWiΘ determines the significance of keyword i to themeasurement of computer science literacy. A higher ρWiΘ
implies greater weight for the corresponding keyword in the4Google Trends allows analyzing keywords as a search term or asa topic. A search term shows the data for all queries that had theexact term in the query text. A topic includes all queries related to thekeyword in all languages with characters in the Latin alphabet. Werestrict our analysis to topics to mitigate language issues in differentregions.

Figure 4. Standard deviations of keyword search data of 2018. The shaded border marks the beginning of excluded keywords.
- 0.28 (0.03)
0.25 (0.04)
0.38 (0.18)
0.26 (0.07)
0.28 (0.03) - - 0.09
(0.80)0.55
(<.01)
0.38 (0.18)
0.09 (0.80)
0.09 (0.80) - -0.13
(0.32)
0.26 (0.07)
0.55 (<.01)
0.58 (<.01)
-0.13 (0.32) -
CSLI-sGitHub
GitHubJava
Survey
PISA
CSLI-s
GitHub
Survey
PISA
(a) (b) (c)
High Corr.0.28(0.03)
correlation(p-value)Key: is
0.25
0.30
0.35
0.40
0.45
2013 2014 2015 2016 2017 2018
Aver
age
CS
Lite
racy
Sco
re
Time (Years)
0.00
0.20
0.40
0.60
0.80
Aver
age
CS
Lite
racy
Sco
re
2014 2015 2016 2017 2018
AsiaAfrica Europe
Middle EastN. America
OceaniaS. America
Figure 5. (a) CSLI-s over time, (b) CSLI-s by continental regions, (c) correlation between measures. Crucially, CLSI-s demonstrates correlation withother measures of CS literacy in (c).
computation of CSLI-s. Our iterative process converges tovalues of ρ that minimize the absolute value of the error in themodel in estimating Θ, where the weights of keywords best fitthe data. The convergence of our algorithm, and the uniqunessof the values that minimize the error, is guaranteed by thestrict convexity of Equation 4 in ρWiΘ, for each i. We notethat, when comparing different time periods of data, the samevalues of ρ should be used for comparison so that keywordshave consistant significance in the computation of CSLI-s.
Θr is then calculated using the values derived above and Equa-tion 3. Θr reflects how much Google users in region r are learn-ing about computer science. Because Θr is only computedusing the data from users with Internet access, we also scaleΘr by the percentage of individuals (as shown in Equation5) using Internet (U r(t)), published by International Telecom-munication Union (ITU) [21]. As described in Section 2, weassume that members of each region that do not have Internetaccess have limited CS literacy.
CSLI-sr(t) = (Θr(t)−miniΘi(t))×U r(t) (5)
In the results presented below, we normalize the resultingvalues to the maximum score for easier comparison amongyears. A CLSI-s score of 1 in a given time period correspondsto the most literate region and 0 corresponds to the least literateregion.
4.6. CSLI-s scoresTable 1 shows the normalized CSLI-s scores of the most andleast literate regions for the last 5 years. The complete list ofCSLI-s scores for all regions can be found in [2].
Region 2014 2015 2016 2017 2018
Australia 1.00 1.00 1.00 1.00 1.00South Korea 0.88 0.94 0.88 0.86 0.88
Israel 0.88 0.81 0.96 0.81 0.78...
Pakistan 0.09 0.10 0.09 0.09 0.14Bangladesh 0.05 0.07 0.06 0.05 0.21Indonesia 0.08 0.01 0.01 0.04 0.07
Table 1. CSLI-s scores for selected regions.
The average CSLI-s scores from 2014 to 2018 are 0.33, 0.32,0.34, 0.34, and 0.40, respectively. The increasing CSLI-sscores suggest that the global quality and quantity of computerscience learning is increasing over time.
Figure 5 shows general trends of CSLI-s scores both globallyand per continent. The positive slope of the trend line in (a)indicates a 1.5% increase per year in overall computer sciencelearning around the world. The continental breakdown of thescores in (b) indicates that the increase in CSLI-s scores islargely due to Asian regions. These statistics may inform thecomputer science education community in ways that enable

policymakers to strengthen global upward trends, and wherein the world best to do so.
5. EVALUATION OF RESULTSIt is difficult to understand the accuracy of CSLI-s without a"ground truth" measure of regions’ per-capita computer sci-ence literacy. However, we compare CSLI-s to several alterna-tive metrics, as suggested in Section 2. Our results, in general,indicate that CSLI-s generates scores consistent with thosemetrics. In particular, CSLI-s and the Human DevelopmentIndex (HDI) [43] are strongly positively correlated (r = 0.54)on average. This is not surprising, as we might expect moredeveloped countries to have higher levels of computer scienceeducation.
We also note that CSLI-s has a large (>0.25) positive Spearmancorrelation with all other measures tested: GitHub, Git-Java,and PISA, where the aggregate claim has p-value < 0.001.See Figure 5-(a) for the correlations and p-values for eachindividual measure. CSLI-s scores also demonstrate a highcorrelation with our user survey, though we note that due toa small sample size tested in only 10 countries, these resultsmay have been due to chance (p = 0.18).
PISA was highly correlated with Github and Git-Java, but noneof these correlated with the user survey. Finally, we note thatboth PISA, GitHub and CSLI-s are negatively correlated withpopulation (correlations of -0.26, -0.29 and -0.33 respectively),suggesting relatively better computer science literacy for lesspopulated nations.
6. PATTERNS IN CURRICULAIn addition to the regional, aggregate measures of literacy in-troduced in Section 4 and the temporal patterns we observed inSection 1, it is also possible to understand geographical trendsin curricula using unsupervised machine learning techniques.
Figure 6 shows a clustering of countries by the popularityof computer science search terms between 2014 and 2018.Figure 6 is generated using t-SNE [44], whereby each regionis represented as a point and distances between regions isinversely proportional to the similarity between their searchterms’ popularities. The figure suggests that geographicallyclose regions are inclined to have similar types of computerscience curricula; for example, the US is close to Canadaand Austria is close to Germany. Perhaps the most strikingcluster of countries in the embedding is the cluster contain-ing Argentina, Brazil, Chile, Thailand, Indonesia, and Turkey(top right). Upon deeper inspection, we notice these countriestend to have a stronger emphasis on systems (such as Inter-net algorithms) and less emphasis on artificial intelligencethan other countries. Another cluster contains Australia andNew Zealand; this cluster is represents high search frequen-cies for terms related to data structures and algorithms, suchas "Heap" and "Semaphore". This group also demonstrateslow search frequencies for more theoretical topics like "FiniteState Machines." The existence of clusters presents an inter-esting opportunity for future work, as Google Trends data mayreveal novel insights into these subtle differences in countries’curricula.
Thailand
Argentina Brazil
Indonesia
SingaporeS. Korea
Israel
Kenya
Nigeria
EcuadorPeru
Mexico
Norway
SwedenCzech
Australia
New Zealand
DenmarkCanada
United StatesIreland
Hong KongTaiwan
SwitzerlandAustria
Japan Germany
Sri Lanka
Bangladesh
BelarusTunisia
Ukraine
RomaniaPoland
Vietnam
MoroccoGreece
Netherlands
Turkey
Italy
T-SNE dimension 1
T-SN
E di
men
sion
2
Chile
Figure 6. t-SNE embeddings of the search popularity between differentclusters. Countries which are close to one another have similar computerscience search patterns. The cluster with Thailand and Indonesia is themost distinct, and focuses more on systems for the Internet.
7. DISCUSSION
7.1. Best PracticesWe note that while the process for calculating an index appliesgenerally to many different fields, CSLI-s is made specificto computer science through the use of keywords related tocomputer science learning. To better understand how differentkeywords might affect our results, we performed the sameanalysis as in Section 4, but with the 40 most popular keywordsfrom Figure 4. However, here is no significant difference inthe results, which suggests that spanning specific subfieldsof computer science with the minimum amount of popularkeywords is enough to calculate a meaningful CSLI-s score.We invite the community to develop a standard set of keywordsand topics so that a consistent way to compute the CSLI-s forcomputer science subfields can be developed.
More generally, our computation of an index in computerscience such as CSLI-s applies to other fields, e.g. history,where global literacy may be estimated with a selection ofrelevant keywords. We anticipate that an analogous index forother fields will not be heavily dependent on the exact setof keywords used, though we leave a quantitative analysisof this assertion to future work. We remind readers that oursource code is available, and that the assumptions described inSection 2 should be studied carefully before using this indexfor decision-making extending our analysis to other fields.We present an example adaptation to the subject of climatechange below, in Section 7.2. We encourage others to proposealternative measures of subject literacy from search data andto surface, examine, and mitigate sources of bias. We considerthis a new research direction and encourage substantial cautionbefore using the measure for large policy decisions.
We further note that CSLI-s provides a measure of computerscience literacy on average for the entire population in a region.Regions with strongly developed computer science literacymay still get relatively low scores if computer science knowl-edge is unequally distributed amongst its populace. In light of

this observation, one strategy for increasing the CSLI-s scorewould be to provide equitable computer science educationfor the entire population. This is consistent with the UnitedNations’ Sustainable Development Goal of education for all.Nonetheless, measuring formal and informal computer scienceliteracy globally is an important problem. CSLI-s is a first stepin what we hope is a rich and useful research direction.
7.2. Application to Climate ChangeIn the preceding sections, we built a case study around the useof Internet search data to measure a proxy of computer scienceliteracy. In this subsection, we use the same methodology on adifferent topic: climate change. As for computer science, wenoticed that there were substantial seasonal effects on searchterms’ frequencies; see Figure 7.
Figure 7. Search terms exhibit strong, consistent seasonal patterns. How-ever, they exhibit them to different degrees. The changes in "ClimateChange" are less drastic between Summer and School than "Green-house Effect".
Interestingly, searches for climate change-related topics in theUnited States are lowest in the summer, when temperaturesare highest. Rather, the frequency of climate change-relatedsearches appears to be strongly linked to the school calendar.These seasonal trends suggest that a similar analysis mightbe applicable to climate change, though it is not clear if theassumptions described in Section 2 are applicable. In partic-ular, Assumption 2 likely does not hold, which would implythat search behavior does not reflect subject “literacy." Assuch, we do not propose an analogous Climate Change Index.However, our initial experiments reveal that climate changeconcepts have more substantial search volume for countries inthe Southern Hemisphere. See Figure 1, for a visualization ofthis geographic pattern. While less people search for climatechange topics in the Northern Hemisphere, those searches tendto be during the school year suggest that climate change isprimarily learned through formal education.
7.3. Curricula TimingAdditionally, we observe that Internet search trends reveal thecurricula timing of concepts in different countries. For searchterms which are more commonly searched during the schoolyear, temporal search patterns indicate the time within the
school year that concepts are being taught. For example, inthe U.S., search volume for "Global Warming" consistentlypeaks around the 105th day of the year (April 16th), "FossilFuel" consistently peaks around the 111th day of the year(April 22nd), and "Ocean Accidification" peaks on average onthe 118th day of the year (April 29th). These dates seem toagree with the order of topics presented in a typical class onclimate change. These results suggest that the seasonal trendswe observe likely reflect which concepts are being learned inschool.
Table 2. Days into the year when different concepts have their peakpopularity in the United States.
Concept Peak Search Day
Global Warming 105Fossil Fuel 111
Sea Level Rise 111Greenhouse Effect 114
Ocean Acidification 118
8. CONCLUSIONAssessing the quality of learning worldwide in a regionally spe-cific, continuous, and inexpensive way remains an importantproblem towards achieving the United Nations’ SustainableDevelopment Goal 4 to "ensure inclusive and equitable qualityeducation and promote lifelong learning opportunities for all."In this paper, we demonstrated that Google Trends data can beused as a meaningful proxy for measuring worldwide progresson this goal. To the best of our knowledge, this is the firstpaper to analyze Google Trends data to understand learning.This is likely because, until now, it has been conceptuallyoverlooked to derive meaningful information from the datathat Google publicly releases.
Using Google Trends data, we presented several methodolo-gies to (1) calculate country-level per capita statistics of ed-ucational quality, (2) measure the extent to which topics arelearned in school, and (3) find curriculum-level patterns acrossgeographically regions.
More specifically, we introduced a new metric to assess educa-tional quality, the Computer Science Literacy-proxy Index bySearch (CSLI-s), using these methodologies and show that thisstatistic is correlated with several other validation measures.
Using this metric, we quantified that computer science liter-acy is growing around 1.5% per year around the world andobserved that Oceania was well ahead of the world in percapita computer science literacy. We observed that climatechange topics tend to be much more searched in the SouthernHemisphere. While fewer people search for climate changetopics in the Northern Hemisphere, those searches tend to beduring the school year.
As Internet accessibility rates continue to increase globally, weanticipate that digital traces of user behavior will continue topresent a wealth of information from which we can learn abouthuman behavior. We hope that the methods presented in thispaper will allow researchers, educators, and policymakers totackle a difficult problem: an assessment of informal learningquality around the world.

REFERENCES[1] ANDERSON, T. The Theory and Practice of Online
Learning, 2nd ed. AU Press, Canada, 2009.
[2] ARSLAN, S., TIWARI, M., AND PIECH, C. Global csfluency ranking. https://github.com/serhatarslan-hub/global_cs_fluency_ranking, 2020.
[3] ASKITAS, N., AND ZIMMERMANN, K. F. GoogleEconometrics and Unemployment Forecasting. IZADiscussion Papers 4201, Institute of Labor Economics(IZA), June 2009.
[4] ASTRACHAN, O., MORELLI, R., CHAPMAN, G., ANDGRAY, J. Scaling high school computer science:Exploring computer science and computer scienceprinciples. In Proceedings of the 46th ACM TechnicalSymposium on Computer Science Education (New York,NY, USA, 2015), SIGCSE ’15, ACM, pp. 593–594.
[5] CHOI, H., AND VARIAN, H. Predicting the present withgoogle trends. Economic Record 88, s1 (2012), 2–9.
[6] CODE.ORG, 2019. https://code.org.
[7] CONDE, M. A., GARCIA-PENALVO, F. J., AND ALIER,M. Interoperability scenarios to measure informallearning carried out in ples. In 2011 Third InternationalConference on Intelligent Networking and CollaborativeSystems (Fukuoka, Japan, Nov 2011), IEEE,pp. 801–806.
[8] DOWNES, S., ET AL. New technology supportinginformal learning. Journal of emerging technologies inweb intelligence 2, 1 (2010), 27–33.
[9] EPSTEIN, J. L., AND MCPARTLAND, J. M. The conceptand measurement of the quality of school life. AmericanEducational Research Journal 13, 1 (1976), 15–30.
[10] ETTREDGE, M., GERDES, J., AND KARUGA, G. Usingweb-based search data to predict macroeconomicstatistics. Commun. ACM 48, 11 (Nov. 2005), 87–92.
[11] FRENKEL, K. A. Cs enrollments rise at the expense ofthe humanities? Commun. ACM 56, 12 (Dec. 2013),19–21.
[12] GINSBERG, J., MOHEBBI, M. H., PATEL, R. S.,BRAMMER, L., SMOLINSKI, M. S., AND BRILLIANT,L. Detecting influenza epidemics using search enginequery data. Nature 457 (Nov 2008), 1012 EP –.
[13] GITTELMAN, S., LANGE, V.,A. GOTWAY CRAWFORD, C., OKORO, C., LIEB, E.,DHINGRA, S., AND TRIMARCHI, E. A new source ofdata for public health surveillance: Facebook likes.Journal of medical Internet research 17 (04 2015), e98.
[14] GOEL, S., HOFMAN, J. M., LAHAIE, S., PENNOCK,D. M., AND WATTS, D. J. Predicting consumerbehavior with web search. Proceedings of the NationalAcademy of Sciences 107, 41 (2010), 17486–17490.
[15] GOOGLE. Trends, 2019. https://www.google.com/trends.
[16] GOUSIOS, G. The ghtorrent dataset and tool suite. InProceedings of the 10th Working Conference on MiningSoftware Repositories (Piscataway, NJ, USA, 2013),MSR ’13, IEEE Press, pp. 233–236.
[17] GOVE, A., AND BLACK, M. M. Measurement of earlychildhood development and learning under thesustainable development goals. Journal of HumanDevelopment and Capabilities 17, 4 (2016), 599–605.
[18] GUZMAN, G. Internet search behavior as an economicforecasting tool: The case of inflation expectations.Journal of Economic and Social Measurement 36 (112011), 119–167.
[19] HALLIDAY-WYNES, S., AND BEDDIE, F. Informallearning. at a glance. Tech. rep., National Centre forVocational Education Research (NCVER), Adelaide,Australia, 05 2009.
[20] HERTZ, M. What do "cs1" and "cs2" mean?:Investigating differences in the early courses. InProceedings of the 41st ACM Technical Symposium onComputer Science Education (New York, NY, USA,2010), SIGCSE ’10, ACM, pp. 199–203.
[21] INTERNATIONAL TELECOMMUNICATION UNION.Individuals using internet, 2019.
[22] JORDAN, K. Initial trends in enrolment and completionof massive open online courses. The InternationalReview of Research in Open and Distributed Learning15, 1 (Jan. 2014).
[23] KALELIOGLU, F. A new way of teaching programmingskills to k-12 students: Code. org. Computers in HumanBehavior 52 (2015), 200–210.
[24] KIZILCEC, R. F., PIECH, C., AND SCHNEIDER, E.Deconstructing disengagement: Analyzing learnersubpopulations in massive open online courses. InProceedings of the Third International Conference onLearning Analytics and Knowledge (New York, NY,USA, 2013), LAK ’13, ACM, pp. 170–179.
[25] LAZER, D., KENNEDY, R., KING, G., ANDVESPIGNANI, A. The parable of google flu: traps in bigdata analysis. Science 343, 6176 (2014), 1203–1205.
[26] LEON-GARCIA, A. Probability, Statistics, and RandomProcesses for Electrical Engineering. Pearson/PrenticeHall, Upper Saddle River, NJ, USA, 2008.
[27] MARGULIEUX, L., KETENCI, T. A., AND DECKER, A.Review of measurements used in computing educationresearch and suggestions for increasing standardization.Computer Science Education 29, 1 (2019), 49–78.
[28] MCDONALD, P., MOHEBBI, M., AND SLATKIN, B.Comparing google consumer surveys to existingprobability and non-probability based internet surveys,2012.
[29] MCLAREN, N., AND SHANBHOGUE, R. Using internetsearch data as economic indicators. Bank of EnglandQuarterly Bulletin 51, 2 (2011), 134–140.

[30] MORRISON, B. B., AND DISALVO, B. Khan academygamifies computer science. In Proceedings of the 45thACM Technical Symposium on Computer ScienceEducation (New York, NY, USA, 2014), SIGCSE ’14,ACM, pp. 39–44.
[31] MULLER, C. Measuring education and skill. TheANNALS of the American Academy of Political andSocial Science 657, 1 (2015), 136–148. PMID:25983334.
[32] NATIONAL SCIENCE BOARD. Instructional technologyand digital learning, 2018.
[33] OECD. Infe report on adult financial literacy in g20countries, 2017.
[34] OECD. Programme for international studentassessment, 2018. http://www.oecd.org/pisa/.
[35] PAPPANO, L. The year of the mooc. The New YorkTimes 2, 12 (2012), 2012.
[36] PIECH, C., SAHAMI, M., HUANG, J., AND GUIBAS, L.Autonomously generating hints by inferring problemsolving policies. In Proceedings of the Second (2015)ACM Conference on Learning @ Scale (New York, NY,USA, 2015), L@S ’15, ACM, pp. 195–204.
[37] POLGREEN, P. M., CHEN, Y., PENNOCK, D. M.,NELSON, F. D., AND WEINSTEIN, R. A. UsingInternet Searches for Influenza Surveillance. ClinicalInfectious Diseases 47, 11 (12 2008), 1443–1448.
[38] PRITCHARD, D., AND VASIGA, T. Cs circles: Anin-browser python course for beginners. In Proceedingof the 44th ACM Technical Symposium on ComputerScience Education (New York, NY, USA, 2013),SIGCSE ’13, ACM, pp. 591–596.
[39] REILLY, S., RICHEY, S., AND TAYLOR, J. B. Usinggoogle search data for state politics research: Anempirical validity test using roll-off data. State Politics& Policy Quarterly 12, 2 (2012), 146–159.
[40] ROBINSON, M. A. An empirical analysis of engineers’information behaviors. Journal of the American Societyfor information Science and technology 61, 4 (2010),640–658.
[41] SMITH, T. Some aspects of measuring education. SocialScience Research 24, 3 (1995), 215 – 242.
[42] STATCOUNTER GLOBALSTATS. Search engine marketshare worldwide, 2019.
[43] UNITED NATIONS DEVELOPMENT PROGRAMME.Human development index (hdi), 2019.http://hdr.undp.org/en/content/human-development-index-hdi.
[44] VAN DER MAATEN, L., AND HINTON, G. Visualizingdata using t-sne. Journal of Machine Learning Research9 (2008), 2579–2605.
[45] WATKINS, K. E., AND MARSICK, V. J. Towards atheory of informal and incidental learning inorganizations. International Journal of LifelongEducation 11, 4 (1992), 287–300.