using goofit with python - indico · himadri pandey 1 . setup pip install scikit-build cmake pip...
TRANSCRIPT

Using Goofit with Python
Himadri Pandey
1

Setup
pip install scikit-build cmake pip install -v goofit
Features● Simple installation like any Python module● Easy setup - takes around 10-15 minutes in building files
2

Python Bindings with PyBind11
Python Bindings
Bind C++ PDFs in Python using PyBind 11
PyBind11
“A lightweight header-only library that exposes C++ types in Python and vice versa, mainly to create Python bindings of existing C++ code.”
3
Using Goofit in Python Examples
from goofit import *
4

Addition.py - Example for Adding Two PDFs
# Importsfrom goofit import *import numpy as npimport matplotlib.pyplot as plt
# Print GooFit and computer infoprint_goofit_info()
# GooFit DataSetxvar = Observable("xvar", -5, 5)data = UnbinnedDataSet(xvar)
# Make a dataset from 90% gauss + 10% flatdat = np.random.normal(0.2,1.1,100000)dat[:10000] = np.random.uniform(-5,5,10000)data.from_matrix([dat], filter=True)
5

Addition.py
# GooFit PDFs and fitting variablesxmean = Variable("xmean", 0, 1, -10, 10)xsigm = Variable("xsigm", 1, 0.5, 1.5)signal = GaussianPdf("signal", xvar, xmean, xsigm)
constant = Variable("constant", 1.0)backgr = PolynomialPdf("backgr", xvar, [constant])
sigfrac = Variable("sigFrac", 0.9, 0.75, 1.00)total = AddPdf("total", [sigfrac], [signal, backgr])
# Do the fittotal.fitTo(data)
6

Addition.Py - Plotting Available in GooFit 2.1.1
# Plot dataplt.hist(dat, bins='auto', label='data', normed=True)
# Make grid and evaluate on itgrid = total.makeGrid()total.setData(grid)main, gauss, flat = total.getCompProbsAtDataPoints()xvals = grid.to_matrix().flatten()
# Plotting componentsplt.plot(xvals, main, label='total')plt.plot(xvals, np.array(gauss)*sigfrac.value, label='signal')plt.plot(xvals, np.array(flat)*(1-sigfrac.value), label='background')
# Show the plotplt.legend()plt.show()
7
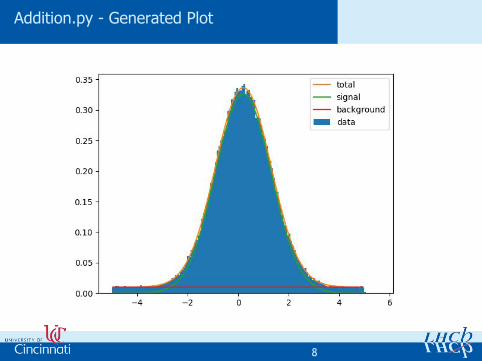
Addition.py - Generated Plot
8

Result
9

Result
10
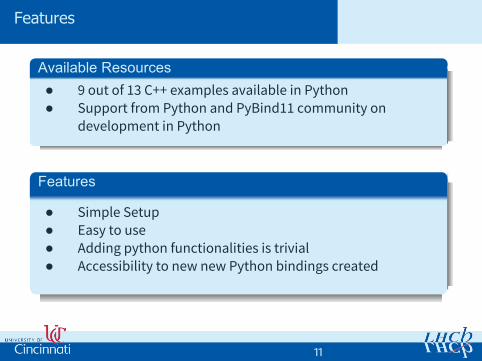
Features
Available Resources● 9 out of 13 C++ examples available in Python● Support from Python and PyBind11 community on
development in Python
Features
● Simple Setup● Easy to use● Adding python functionalities is trivial● Accessibility to new new Python bindings created
11

Run Goofit Now on Your Own Computer
Setuppip install scikit-build cmake pip install -v goofit
Use it in your python code
from goofit import *
12

Questions?
Continued development on GooFit is supported by the U.S. National Science Foundation under grant number 1414736 and was developed under grant number 1005530. Any opinions, findings, and conclusions or recommendations expressed in this material are those of the developers and do not necessarily reflect the views of the National Science Foundation. In addition, we thank the nVidia GPU Grant Program for donating hardware used in developing this framework.
13