using goals to model strategy map for business it alignment
TRANSCRIPT
Using Goals to Model Strategy Map for Business IT Alignment
Abdul Babar1, Didar Zowghi1, and Eng Chew1,
1 Faculty of Engineering and Information Technology, University of Technology Sydney, Australia
{Abdul.Babar, Didar.Zowghi, Eng.chew}@uts.edu.au
Abstract. Strategy Map (SM) is one of the widely used methods to create business aligned IT strategy map providing valuable insights to business executives. However, problem with strategy map method is that it is not easy to use which can lend itself to various interpretations. This is because linkages between the strategic objectives in the four strategy map perspectives are not explicit which makes SM ambiguous. Goal modelling approaches from Requirements Engineering (RE) have proven rigorous in elicitation and representation of information system requirements. In an attempt to make explicit the causal relationships of SM linkages meaningful this research proposes the use of goal modelling approach i*.
Keywords: Business IT alignment, strategy map, goal modelling, i*
1 Introduction
Business aligned IT strategy has been the top ranking concern of business executives in the last two decades [1]. Due to strategic misalignment, firms often fail to accrue the full business value from their IT investment [2]. To address the alignment issue, researchers and practitioners from Management Information Systems (MIS) have proposed many types of methods for business executives providing insights about different aspects of strategic alignment. Some methods focus on social aspect of strategic alignment [3] in which the resulting causal model of resources (such as knowledge sharing, trust and successful IT history as pre-requisite to communication between business and IT executives and connection between business and IT planning) to achieve alignment are presented. Others highlight the importance of informal organisational structure for strategic alignment [4]. Several other models describe alignment as planning process [5]. There are also methods that identify holistic view of alignment process such as Strategic Alignment Model (SAM) [6] and strategy map (SM) [7] in which several aspects of alignment process and relationships among them are identified.
Strategy map which evolved from balanced scorecard has been regarded as the most widely used alignment method and more than 300 organisations have used to create maps for their business aligned IT strategies [8]. Strategy map defines four perspective map (Financial, Customer, Internal and Learning & Growth (L&G)) of an
M. Petit, G. Gal, A. Castiaux, J. Ralyté, and P. Plebani (Eds.):CAiSE 2010 Workshop BUSITAL’10, Hammamet, Tunisia, pp. 16-30, 2010.

organisation’s value creating strategy. It provides textual concepts that executives can use to discuss the directions and priorities of their enterprise. Strategy map identifies the cause-and-effect relationships among the objectives in the four perspectives of an organisation’s strategy in which the desired outcomes are defined in terms of objectives in financial and customer perspectives. Internal perspective identifies the critical internal processes that an organisation must excel in so as to deliver the strategic outcomes. L&G perspective identifies the human and organisational capitals along with technology assets necessary to support the value-creating internal processes. Visual representation of the causal relationships in the four perspectives provides greater insight to executives as to how the firm’s tangible and intangible resources must be aligned to create value for the customers and the firm.
However, researchers found that the SM method is not easy to use and the created strategy map lends itself to various interpretations [9, 10]. The major reason for these problems is that the linkages created among objectives in four perspectives are not explicit as shown in Figure 1. The lack of an explicit model of relationships contributes to the difficulties in evaluating the relative importance of performance objectives in SM [11]. According to [12] an adequate causal model should help members of organisations to understand how objectives can be achieved. However, a recent study reported that the vagueness of SM guidelines results in three different types of interpretations of the SM created by a firm [9, 10]. The problem of implicit model of relationships exists in most of business IT alignment models.
Goal modelling approaches from RE have been considered rigorous and structured in elicitation and representation of requirements [13]. Many goal modelling approaches have been proposed and compared in terms of their requirements modelling capabilities [14]. Among them, i* appeared semantically richer and that it provides greater requirements analysis support than other modelling approaches [15]. Therefore, we consider exploiting the constructs of i* approach to overcome the above-mentioned weaknesses and make strategy map more structured.
Thus, we set a research question to address the problem of strategy map: How can we use i* to make strategy map more structured and unambiguous for
business executives? In this regard we use Consumer Bank exemplar (a case study conducted by [7] and
its created strategy map is shown in Figure 1). Application of i* to the textual description of Consumer Bank enables us to create an i* model of SM which we call SMi* model. Using the knowledge of Consumer Bank exemplar to develop SMi* model is advantageous in a way that we can effectively compare SMi* model with conventional strategy map in terms of explicitness in linkages. The rest of the paper is structured as follows. Section 2 compares and contrasts strategy map constructs with i* constructs in a tabular form. Development process of SMi* model has been presented in section 3. Section 4 presents lessons learned from the development process of SMi* model. Conclusion and future work direction are presented in section 5.
Using Goals to Model Strategy Map for Business IT Alignment 17

Fig. 1. Conventional strategy map model of Consumer Bank [7]
2 Suitability Analysis of i* Constructs for Strategy Map
Before we develop SMi* model we need to evaluate whether the constructs offered by i* are suitable and adequate to conceptualise and represent SM constructs. In this regard, we carefully analyse textual description of the exemplar and SM method used to create strategy map from [7] and identify constructs needed to be represented. Similarly, we also evaluate i* constructs in an attempt to match them against strategy map constructs. Evaluation of SM and i* constructs is described in Table 1.
Table 1. Analysis of strategy map constructs and suitable i* constructs
Modelling requirements (strategy map) i*constructs Perspective refers to a firm’s strategic view in terms of conceptual elements (e.g. goals and resources) pertinent to a particular domain of concern. Strategy map consisting of four perspectives describes value creating strategy in terms of objectives which provides basis for executives to discuss the directions and priorities of their enterprise.
i* does not offer any suitable construct to represent the concept of perspective of SM.
Contents of financial perspective present i* offers graphical notation Goal to
18 A. Babar, D. Zowghi and E. Chew

how an enterprise intends to create sustainable growth in shareholder value. Primarily in the financial perspective Firm’s financial targets are established which are precise in nature.
represent objectives/targets which are precise in nature. According to a definition goal is a condition or a state of affairs to be achieved [15]. Given that the objectives in financial perspective are precise in nature we use goal construct (as shown below) to represent financial objectives.
Contents of customer perspective is used to describe customer value proposition (CVP) which can be understood in terms of customer benefits being offered by the Firm’s products and services. Customer satisfaction which is the mission and purpose of every business can be achieved through clear identification of value proposition offered by the firms to please customers.
These value propositions have qualitative and quantitative values as shown in the Table.
CVP Measuring approach
Suitable construct
Price Value for money
Goal
Quality SLA Goal Integrated offerings
Number of services
Goal
Credibility of service
Satisfaction
Soft goal
Help in planning & implementing financial plans
Always be there
Soft goal
CVPs can be classified into precise/hard and qualitative/soft objectives. Goal construct is suitable to represent precise CVPs however we use soft goal construct to represent qualitative targets. Soft goal means it does not have clear-cut satisfaction criteria [15]. Soft goal is used to represent qualitative target in terms of satisfied sufficiently. Thus, goal and soft goal constructs conceptually qualify to represent quantitative and qualitative types of requirements potentially across SM four perspectives.
Contents of internal perspective comprise of three value creating core process types (operations, customer and innovation management core processes). A firm typically defines the critical few (clusters of) strategic processes known as strategic themes that have the greatest impact on delivering the espoused CVPs. A core process comprise of many sub-processes. These sub-processes are executed to achieve CVPs. A strategic theme has clear performance targets (aligned with the CVPs) which must be supported by learning & growth perspective.
i* need to represent three types of elements here for internal perspective – (1) three clusters of core processes, (2) core processes which are known as strategic themes and (3) sub-processes executed to achieve strategic themes. i* does not offers any suitable construct to represent three clusters of strategic themes. Strategic themes have been described in terms of precise value. Therefore goal construct qualifies to represent strategic themes. To represent sub-processes we use Task construct. According to a definition task is a course of action that is carried out in a particular way typically to achieve
Using Goals to Model Strategy Map for Business IT Alignment 19

some goal. For simplicity this concept Of task can be used as an approximation to equate the concept of sub-process
Contents of learning & growth perspective comprise of three capitals: (1) human capital, (2) Information Capital (IC) and (3) organisational capital (known as intangible assets) each defined with precise objectives and performance targets to support the strategic themes. Human capital refers to specialist roles required to execute activities in internal perspective, organisational capital refers to interaction among stakeholders and IC refers to value creating computer technologies necessary to support activities in the strategic theme of internal perspective. Technology infrastructure used to support activities has been regarded as asset/resource in the MIS literature [16]. Therefore, we need to represent technology as asset/resource, people as stakeholders for all four perspectives and organisational issues as relationships among the stakeholders.
Actor is an entity that carries out actions to achieve goal by exercising its know-how. In addition an actor can be classified into specialised roles as shown below. The concept of actor is suitable and adequate to represent human capital potentially across all four perspectives. Fundamentally i* is an approach that is used to express complex social and organisational relationships through dependency relationships among actor [15]. i*’s inherent structure supports representation of human and organisational aspects. Thus for simplicity, in this study we present the human and organisational resources in conjunction with related concepts in the appropriate perspectives where they make sense. This means the L&G perspective only needs to represent IT resources which support the sub-processes of the strategic themes. According to [15] Resource is a provision of some entity either physical or informational to achieve some goals or to perform some tasks. This concept of resource is equivalent to the concept of IT resource which is used to execute sub-processes of strategic themes.
actor
20 A. Babar, D. Zowghi and E. Chew

Classification of objectives. The exemplar describes objectives for all four perspectives. However these objectives are of different types of. For example Consumer Bank describes shareholder value as mission/aspiration and to achieve the mission the bank establishes many productivity and growth targets. In this case the firm’s strategic aspiration is its strategic intent and productivity and growth targets are objectives defined to achieve the strategic intent. So, we classify targets provided for all four perspectives into intents and objectives categories. Cause-and-effect relationships are established among four perspectives by showing that IT supports internal processes which supports customer perspective and which supports financial perspective (for example, see Figure 1). Establishing relationships among perspectives mean to facilitate discussion among executives in terms of linkages between objectives.
In i* intentionality is described in terms of desires and wants of an actor from another actor in Strategic Dependency (SD) model [15]. To deliver a strategic intent an actor establishes some targets which are defined in Strategic Rationale (SR) model of i*. To make distinction between the variety of objectives and their strategic intents i* uses the concept of a boundary as shown below. This construct defines boundary of objectives in terms of goals, tasks and resources. i* describes it as workability analysis which fits well to represent that how well-integrated objectives support achieving strategic intents which are represented out side the boundary. Responsible actor to achieve strategic intent through targets inside the boundary appears an equivalent concept to SM concept on strategic intent and associated objectives.
Strategic Dependency (SD) relationship concept allows representing cause-and-effect relationships of SM through actor dependency relationship as the construct is shown below. With SR model SM will be able to represent explicit relationships among objectives as well as actors and dependency relationships among them for strategic intents for all four perspectives.
Relationship strengths, objectives in each perspective which drive to achieve strategic intent have various types of relationships and these relationships have various degrees of strengths. For example, the exemplar at many stages in [7] shows that the two sub-objectives/sub-processes support to achieve an objective that means sub-objectives/sub-processes have AND relationships, at some stage the exemplar describes one sub-objective is sufficient to achieve an objective then the relationship should be shown with Means-Ends link. At another stage one objective supports another objective but the relationship strength in unknown for which
The use of following relationship constructs can bring clarity to the relationships among the objectives of SM four perspectives. AND/OR construct is used to indicate that satisfying a goal can be accomplished by satisfying all its sub-goals.
Means -Ends is used to show if a sole goal is contributor to another goal.
+ construct represents that one goal positively influences the other goal. It is
Using Goals to Model Strategy Map for Business IT Alignment 21

we use Plus contribution link. used where strength is not sure.
DECOMPOSITION construct represents decomposition of a task into more than one sub-tasks.
2.1 Extension to i*
i* approach appears to be suitable representing most of the SM constructs however, it lacks representing the concept of four different types of perspectives and three types of clusters of core processes for internal perspective. Therefore we propose new constructs presented in Table 2. We do not present theoretical background of these new constructs in this article due to the space constraint however in selecting appropriate visual constructs we take insights from [17]. Visual constructs are more effective in understanding and solving problems than their contents [17]. Visual representation in software engineering is pervasive but little attention is paid to perceptual aspect when a visual construct is selected. Two important principles should be addressed in selecting visual constructs: (1) symbols could be discriminated accurately from each other. Symbols are different from each other. The greater the visual distance between symbols the faster and more accurately they will be recognised and (2) appearance of constructs should suggest their meanings which means that the symbols are required to provide clues to their meanings. Such representation provides accurate and speed up recognition of constructs.
Table 2. New constructs to represent SM constructs
Perspective
Financial perspective
Customer perspective
Internal perspective
IT (Learning and growth perspective)
Cluster of three core processes (operation, customer and innovation management processes)
We use three colours to represent three clusters of core processes. Red colour to represent operations, green colour to represent customer and yellow colour to represent innovation clusters.
$$
22 A. Babar, D. Zowghi and E. Chew

Suitability analysis of i* constructs (Table 1) and extension to i* constructs (Table 2) for representing SM constructs led us to believe that we can faithfully capture all the “structural constructs” of SM in a fully integrated SMi* model which unambiguously shows the inter-relationships of “structural constructs”.
3 Development Steps
In the development of SMi* model we use two-step approach of i*. First we develop Strategic Dependency (SD) model in the context of Consumer Bank exemplar. SD model helps us to capture dependency relationships among stakeholders for strategic intents in the four perspectives of SM. Strategic intents can be captured in the form of goals to be achieved, tasks to be performed and resources to be furnished. Second based on detailed level of knowledge provided in the exemplar we identify rationale behind those strategic intents in the form of goals, tasks and resources that each stakeholder facilitate to achieve strategic intents. This is called Strategic Rationale (SR) model which basically expands on SD model by showing internal arrangement of an actor to achieve strategic intents. So, we term it as SMi* model comprises of SD and SR models.
3.1 Strategic Rationale (SR) Model
This section presents detailed information about Consumer Bank exemplar for four SM perspectives and how this information is used to develop SMi* model. We ensure that the development of SMi* model is entirely based on the knowledge provided in the exemplar. Financial perspective, Exemplar describes that the overarching shareholder objective for Consumer Bank was to dramatically increase earning per share. This statement presents two stakeholders1 – shareholder and Consumer Bank and one strategic objective – increase earning per share. By using i* approach we can conceptualise stakeholders and the objective by saying that shareholder depends on Consumer Bank which we consider from now on as Financial Service Provider (FSP) to increase earning per share. We use i* construct actor to represent these stakeholders and the goal to represent the quantitative strategic objective of earning per share be increased. Exemplar also describes that the target be achievable for increase in earning per share which we consider a qualitative aspect of the target of earning per share be increased. So, we use soft goal construct to represent target be achievable for shareholder. The following information provided in the exemplar is used as rationale to achieve shareholder objective. FSP sets a stretched target of net income - $100 million on which the strategic intent depends. Net income is a precise objective and is represented by using goal construct as shown in Figure 2. This stretched target can help to calculate earning per share for shareholders precisely that’s why we represented strategic intent with goal construct.
1 stakeholder: human, departments, organizations
Using Goals to Model Strategy Map for Business IT Alignment 23

FSP sets two sub-objectives – increase productivity and profitable revenue growth. FSP considers them as two high level and main objectives to achieve $100 million net income target (p.374) [7]. Therefore, we use AND decomposition link to show that the achievement of productivity and growth objectives means achievement of the stretched target of $100 million. We use goal construct to represent productivity be increased and growth be achieved as both objectives can be measured quantitatively based on the targets which are discussed in the next paragraph. In addition, FSP expects 11% annual revenue growth which also refers to a clear-cut growth objective.
According to the textual description of the exemplar FSP defines two growth related sub-objectives – increase revenue per customer from $200 to $300 and increase the number of high value customers from 200,000 to 600,000. These are two quantitative sub-objectives to achieve a precise growth objective. Once again we use goal construct to represent these objectives and AND decomposition link to show that the achievement of both sub-objectives means achievement of growth objective.
FSP defines one productivity related sub-objective reduce annual customer cost from $100 to $75 [7]. This is another clear-cut financial objective and we use goal construct to represent the objective. This objective can help to measure productivity objective therefore we use goal construct to represent the productivity objective. Since cost per customer be reduced is a sole objective to increase productivity we use means-ends link to show that it is strong enough to achieve the productivity objective. In this way we capture rationale behind the financial strategic intents as shown in Figure 2 which is entirely based on textual description of the Consumer Bank exemplar. Customer perspective, FSP pursues relationship based customer strategy instead of old transaction based customers strategy (p.377) [7]. In relationship context, FSP wants four strategic intents to be achieved in order to realise financial objectives:
(1) Products/services be provided, FSP defines precise target in terms of products and service so we represent it with goal construct.
(2) Relationships with customers be developed is a qualitative objective which is not measureable so, we represent it as a soft goal.
(3) One stop shopping is a precise goal in which FSP provides all the financial related needs to its customer.
(4) Trusted financial advice is related to the provision of information which is represented with resource construct.
To deliver these strategic intents, FSP hires a financial advisor2 who is specialist in this domain. So, FSP depends on financial advisor for these four strategic intents. Rationale behind these four strategic intents is described below.
With respect to the rationale, exemplar describes that strategic intent – trusted financial advice depends on the goal of helping customers develop and implement financial plans. Trusted financial advice is a resource and it is based on product knowledge which we represent with resource construct, however, helping customers
2 We acknowledge that there can be other customer interfaces such as customer service agents,
bank tellers however Consumer Bank created new strategic role to shift customers from transaction based to relationship based customers. Therefore we used financial advisor as responsible role to deliver four strategic intents for customer perspective.
24 A. Babar, D. Zowghi and E. Chew

Shareholder
High-value customers be added and retained
Revenue per customer be increased
Increase in net income be set
Trusted financial advice
Relationships with cust. be developed
++
Financial service provider
Productivity be increased
Growth be achieved
Products/services be provided
Help customers to develop and implement their
financial plans
Integrated offerings
Services be credible & effective
Low price
Quality manager
Call centre
representative
+
Consumer marketer
Telemarketer
Communicate
Segment market
Clarify CVP
Cost-effective approach
Acquire prospect list
Telemarketing campaign
Financial planner
Broader range of services
One stop shopping
Joint Venture mnger
Direct mail support program
Customers analyse their own plan
Cust portfolio self mgmt system
Customer profitability system
Problem tracking system
Customer self-help
Project mgmt system
Service quality analysis
Customer survey
Efficient service
Calculate new product revenue
Calculate customer profitability
Calculate customer profitManage lead
& order
Customer feedback system
Web-architecture
CRM
Earning per share be increased
IT organisation
Minimize problems
Develop new products
Understand customer segments
Provide rapid response
Shift to appropriate channel
Cross-sell product line
High quality
Target be achievable
$$
Financial advisor
Effectively
Useful [response] Products be
inexpensive
Products be innovative
Reduce incident and cost of errors
Fulfill requests
Seek partner
s
Serve customers
Cost per customer be reduced
Fig 2. SMi* model of Consumer Bank
Using Goals to Model Strategy Map for Business IT Alignment 25

to develop and implement their financial plans is a qualitative goal as it can not be clearly measured. In addition, One stop shopping which means to provide all financial solutions under one roof depends on helping customer in developing their products.
Strategic intent relationship based customer supports financial target revenue per customer be increased, according to the exemplar it depends on integrated offering. Integrated offering is a quantitative goal as financial advisor can easily figure out how many products/services a customer has been using.
Strategic intent – products and services that helps to achieve cost per customer be reduced depends on CVP Services be credible and effective. Textual description presents price and quality of products and services as key CVPs to support products/services to be credible and effective and hence helps to reduce cost per customer for productivity objective, so we use positive contribution link showing that the CVPs price and quality positively support the soft goal of products/services to be credible and effective as shown in Figure 2.
As price (value for money) is a known value it is represented with goal construct. Firms use Service Level Agreement (SLA) to achieve quantitative goals in term of quality of their services, so quality level can be identified precisely and is represented with goal construct3. So, we can show through linkages that how strategic intents depend on CVPs to support financial targets. One of the advantages of using i* is that it helps to differentiate strategic intents from supporting objectives. Internal perspective, Exemplar describes six critical processes in three clusters – operation, customer and innovation that must be executed to achieve four strategic intents of customer perspective. Six core processes – minimize problems, provide rapid response, cross-sell product line, develop new products, shift to appropriate channels and understand customer segment are described as six themes. Exemplar identifies six specialist roles to achieve targets set for six strategic themes. Therefore by using i*, we capture dependency relationships between financial advisor and six specialist roles for six strategic themes (along with some soft targets perceived from the textual description) as shown in Figure 2. We introduce six strategic themes in the context of three clusters below:
The exemplar describes two operation management related themes which are important to satisfy existing customers and delivering desired productivity objective.
(1) Minimize problems is a strategic theme in which quality manager is given the target of 0.1% reduction in incidents and cost of errors to achieve low price CVP. Reducing the number of incidents and the cost of errors is the task that quality manager performs to achieve 0.1% target and achieve it effectively. In i* terms financial advisor depends on quality manager to achieve this strategic theme and to achieve the strategic theme quality manager performs the task of reducing the number of incidents and cost of errors.
(2) Provide rapid response, means 24/7 service with fulfilment time. The exemplar describes call centre representatives as responsible people to achieve this service objective and task for them is to fulfil request. The response must be useful for
3 In some cases quality could include the level of customer experience in using the services
offered by Consumer Bank. In these cases, quality is not measureable entity and will be represented as a soft goal.
26 A. Babar, D. Zowghi and E. Chew
customers. Same i* principle is used here and onward to represent relationship between financial advisor and roles associated to rest of the four strategic themes.
The exemplar described four more strategic themes in customer management & innovation clusters which can help to achieve revenue growth and increase in high value customers objectives. Based on the textual description we find that two themes cross-sell the product line and develop new products are more supportive to achieve relationship based customers and hence increase in revenue per customer. However, two other core processes – shift to appropriate channel and understand customer segment are more supportive to achieve increase in high value customers.
(1) Cross-sell the product For this strategic theme, financial planner is considered an ideal role who is given
the target of 2.5 products per customer to be achieved. To achieve this target financial planner is responsible to perform the task of providing broader range of products and service.
(2) Develop new products In this theme, joint venture manager is given the target of increase in revenue per
customer by 50%. To achieve this target joint venture manager performs the task of seeking more partners in order to create additional products and services.
(3) Shift to appropriate channel This theme requires telemarketing program in which 40% shift in channel mix is
the target for telemarketers. To achieve this target, three types of tasks are suggested in the exemplar – (1) telemarketing campaign, (2) the acquisition of prospect list and (3) direct mail support program which are associated with the task through decomposition link.
(4) Understand customer segment Consumer marketer is the responsible person to achieve the target of 30% segment
share for this theme. To achieve this target responsible person has the major task of serving customer which is divided into three sub-tasks - clarification of CVP, segmenting the market and communicating the message with potential customers. Achievement of the targets for these six themes through value creating tasks means achievement of overarching net income target of $100 million. IT (L&G perspective). This perspective focuses on three aspects – human, organisational and IT. As we have described in Table 1 that i* inherently supports expressing organisational and human aspects of information systems through dependency relationships among actors for goals to be achieved, tasks to performed and resources to be furnished [18]. Therefore, we do not need to model human and organisational aspect separately in L&G perspective however, we must represent IT aspect for L&G perspective.
For information capital, exemplar presents that the IT organisation is responsible of installing and maintaining several of the applications and integrate these applications to the bank’s overall web infrastructure. Sub-processes supporting six strategic themes encompass IT domain of L&G perspective. Six specialist roles depend on the IT organization (actor) for the support of sub-processes associated to their domains. Exemplar describes eight sub-processes that an IT organisation needs to support in order to realise six strategic themes. IT organisation as an actor for IC capital furnish applications and infrastructures which are considered as resources [16] IT organisation furnishes these resources to support six strategic themes.
Using Goals to Model Strategy Map for Business IT Alignment 27

To achieve strategic theme minimize problems IT organisation installs problem tracking system who’s main purpose is to perform service quality analysis in which it helps to reduce operational errors. Thus according to i* quality manager responsible to achieve strategic theme minimize problems depends on IT organisation to perform the task of service quality analysis for which IT organisation furnish resource – problem tracking system. Similarly five other roles responsible of strategic themes depend on IT organisation to furnish resources for particular tasks which are described below.
To support the process of provide rapid response, IT organisation install customer self help system. This system provides efficient and 24/7 services through web-systems. For cross-sell theme IT organisation installs two applications – customer portfolio self management system and customer profitability system. Former system helps customers to develop their financial plans and this system is supported by web-architecture providing customers 24/7 services. Later system provides facility for financial planners to calculate profitability of customers. Strategic theme develop new product requires project management system which helps project manager to product based revenue.
Shift to appropriate channel is another vital theme for which a complete suite of Customer Relation Management system (CRM) including lead management system, order management system and sales forces automation is used. CRM supports tasks related to this strategic theme effectively. Customer profitability is partly useful for the understand customer segments theme. Customer feedback system is also needed to understand customer needs and it helps to segment customers. Customer feedback system is supported (to some degree) by web-architecture providing the bank a cost effective and efficient way of conducting surveys.
With i*, relationships among objectives across four perspectives are explicit and in one example (see Figure 2) we have shown traceability for a strategic theme – minimize problems upwards for CVPs and financial objectives and downward support from sub-processes and hence IT resources.
4 Lessons Learned from Using i* to Represent Strategy Map
1. Development of goal structure using AND alternatives. i* has effectively shown clarity in relationships among different types of objectives for four SM perspectives. Linkages present relationship types among objectives. Representation of different types of objectives with different types of i* constructs such as goals, tasks and resources can also be observed in SMi* model. It is also observed that the explicit representation of elements and their relationships has enhanced readability of SM and thus executives should be able to view SMi* model as an explicit model of relationships.
2. i* has facilitated more than just enhancing clarity in linkages. i* has captured roles/actors related to each perspective (contrary to conventional SM in which roles are identified only in L&G perspective for strategic themes) and provided a network of dependency relationships among actors. Through this dependency approach i* actually addresses issues related to organisational and human capitals
28 A. Babar, D. Zowghi and E. Chew
which are highlighted in L&G perspective for conventional SM. Therefore, only IT is captured for L&G perspective in SMi* model. SMi* is ideal to communicate with executives explicitly showing them strategic intent and their responsible roles and what measures these roles take to achieve their strategic intents.
3. We do not represent clusters of core processes into groups as shown in conventional SMs. The major reason is the representation of explicit relationships making difficult to group the core processes. So, in SMi* model we use three distinct colours (red for operations, green for customer and yellow for innovation processes) to represent three groups of core processes. In this way we maintain clarity in relationships among objectives.
4. Regulatory and social processes is the fourth cluster of core processes, required for regulatory and environmental sustainability compliance purposes, which is not being represented in this SMi* model for two reasons: (1) we do not find sufficient information on this cluster in consumer bank exemplar and (2) representation of this core process is debatable as the MIS literature mainly discusses three core processes to achieve customer and financial targets which we have represented in SMi* model.
5. SMi* model shows the complete linkages explicitly across the four perspectives of SM. SMi* model, in one example clearly shows that the core process minimize problems helps to achieve CVP low price and hence achieve productivity target while having support from problem tracking system from IT organisation.
6. SM identifies aspects of strategic alignment in term of four perspectives. In this regard new constructs are identified in Table 2. These constructs help to reduce complexity of alignment process and enhances readability of SM.
7. In i* context, SMi* model is dependency heavy. The basic reason is that the exemplar provides limited knowledge for four perspectives of SM process and it is particularly visible for internal perspective. However, we have provided a model – SMi* model which is further explore-able. Provision of such integrated model of explicit linkages was our study objective which we have achieved through this exercise.
5 Conclusion and Future Work
Application of i* has introduced structuredness and explicit traceability to SM that was weak in the conventional SM. i* approach has provided meaningful visual constructs to represent different types of targets and relationships among them for four SM perspectives. Integrated network of relationships provides excellent traceability across four perspectives. It is our conjecture that this kind of structuredness and traceability can make SM easy to use as we have not yet validated this in the field the SMi* model produced and the method used to develop it. Given that the researchers from MIS have identified ambiguity in relationships among SM objectives is the problem we believe that with the use of i* constructs relationships among SM objectives now become explicit. Development of SMi* model is the first step in this line of research. In the next step we intend to conduct interviews with IT
Using Goals to Model Strategy Map for Business IT Alignment 29

strategists to evaluate whether SMi* model has better structure and traceability than conventional strategy map. In the final step we will evaluate the method used to develop SMi* model through a field case study.
References
1. Luftman, J., Key Issues for IT Executives 2004. MIS quarterly Executive, 2005. 4(2): p. 269 -285.
2. Tallon, P.P., L.K. Kraemer, and V. Gurbaxani, Executives Perceptions of the Business Value of Information Technology: A Process-Oriented Approach Journal of Management Information Systems, 2000. 16(4): p. 145-173.
3. Reich, B. and I. Benbasat, Factors that Influence the Social Dimension of Alignment Bteween Business and Information Technology Objectives. MIS quarterly, 2000. 24(1): p. 81-113.
4. Chan, Y., Why We Have Not Mastered Alignment. MIS quarterly Executive, 2002. 1(2): p. 97-112.
5. Cassidy, A., A Practical Guide to Information Systems Strategic Planning 2nd ed. 2006, FL: Auerbach Publications Taylor & Francis Group.
6. Henderson, J.C. and N. Venkatraman, Strategic Alignment: Leveraging Information Technology for Transforming Organisations. IBM Systems Journal 1993. 38(2 & 3): p. 472 - 484.
7. Kaplan, R.S. and D.P. Norton, Strategy Maps: Converting Intangible Assets into Tangible Outcomes. 2004 ed. 2004: Harvard Business School Publishing Corporation.
8. Rigby, D., Management Tools and Techniques: A Survey California Management review, 2001. 43(2): p. 13960.
9. Braam, G. and E. Nijssen, Performance Effects of Using The Balanced Scorecard: A Note on the Dutch Experience. Long Range Planning 2004. 37(4): p. 335-349.
10. Marr, B., Business Performance Measurement: An Overview of the Current State of Use in The USA. Measuring Business Excellence 2005. 9(3): p. 56-62.
11. Kunc, M., Using Systems Thinking to Enhance Strategy Maps. Management Decision, 2008. 46(5): p. 761-778.
12. Kaplan, R.S. and D.P. Norton, The Balanced Scorecard: Translating Strategy into Action. 1996, Boston, MA: Harverd Business School Press.
13. Yu, E. and J. Mylopoulos. Why Goal-Oriented Requirements Engineering. in Proceedings of 4th International Workshop on Requirements Engineering. 1998. Pisa, Italy.
14. Kavakli, E. and P. Loucopoulos. Goal Driven Requirements Engineering: Evaluation of Current Methods. in Proceedings of 8th CAiSE/IFIP. 2003. Nicosia, Cyprus.
15. Yu, E., Modelling Strategic Relationships for Process Engineering. 1995, University of Toronto, Computer Science Department: Toronto. p. 124.
16. Oh, W. and A. Pinsonneault, On the Assessment of the Strategic Value of Information Technologies: Conceptual and Analytical Approaches. MIS quarterly 2007. 31(2): p. 239-265.
17. Moody, D. The Physics of Notations: A Scientific Approach to Design Visual Notations for Requirements Engineering. in 17th International Conference on Requirements Engineering. 2009. Atlanta, Georgia, USA.
18. Yu, E., Social Modeling and i*, in LNCS. 2009, Springer Berlin / Heidelberg. p. 99-121.
30 A. Babar, D. Zowghi and E. Chew

Jessica Li <[email protected]>
BUSITAL'10 notificationdidar <[email protected]> Wed, Mar 16, 2011 at 1:53 PMTo: Jessica Li <[email protected]>
> ---------------------------- Original Message ----------------------------> Subject: BUSITAL'10 notification> From: "BUSITAL'10" <[email protected]>> Date: Tue, April 13, 2010 6:03 pm> To: [email protected]> -------------------------------------------------------------------------->> Dear Author,>> I have the pleasure to inform you that your paper was accepted for> inclusion in the BUSITAL 2010 proceedings and for presentation at the> workshop on June 7th 2010 in Hammamet.>> Please find attached the reviews. Please take the comments into account in> order to improve your paper. Please also double check the format of your> paper by following the formating instructions as previously mentioned on> the workshop webpage:> http://www.info.fundp.ac.be/BUSITAL2010/>> The final version must be received by next Monday April 19th. Please> inform us ASAP of any difficulty to meet this deadline.>> Looking forward to see you in Hammamet,> Michaël Petit>>>> --------------------------------------------->> Paper: 9> Title: Using i* to Represent Linkages in Strategy Map>>> ---------------------------- REVIEW 1 --------------------------> PAPER: 9> TITLE: Using i* to Represent Linkages in Strategy Map>> OVERALL RATING: 2 (accept)> REVIEWER'S CONFIDENCE: 4 (expert)>> The paper is well written.>> The problem statement is cleary set.>> The research work developed, which partial results are presented here,> aims to conciliate the strenghts of two well known models: i* from the> requirement engineering (for software engineering) domain and Strategic> Maps (Kaplan) for business analysis.>> The results presented in this paper are encouraging for the research (i)
Gmail - BUSITAL'10 notification https://mail.google.com/mail/?ui=2&ik=b225d1b422&view=pt&search...
1 of 2 17/03/2011 5:07 PM

> on information systems engineering as well as (ii) on the Business-IS> alignment.>>> => The use of colours is nice and powerful for stakeholders' understanding> during modeling. But it is dangerous for paper evaluation and even for the> proceedings. Don't forget that no coulours will be used in proceedings (if> the workshop has any paper proceedings in the following)>> => the use of a computer as a symbol for representing the learning and> growth perpective is particulary awkward. Put at least an actor (or better> a group of actors) in front of the computer !>> => What is IC in the paragraph related to the second lesson learned ?>>>> ---------------------------- REVIEW 2 --------------------------> PAPER: 9> TITLE: Using i* to Represent Linkages in Strategy Map>> OVERALL RATING: 2 (accept)> REVIEWER'S CONFIDENCE: 3 (high)>> This is an interesting interpretation of Strategy Maps in terms of i*. The> paper starts with a concept by concept analysis of SM to see how each can> be expressed using i*, or not. Then some extensions are offered. The> extended version called SMi* is then illustrated with the Consumer Bank> exemplar. The big question is whether executives will find the more> specific details useful or not, or easier to use. I agree that SMi*> provides a more specific semantics than SM, and can provide some> disambiguation. I also like the fact that actors are introduced> explicitly.>> This is a timely contribution as BSC and Strategy Maps are being> incorporated into IS/IT modeling by several approaches. This is the only> one that I've seen that refines the semantics of SM.>>>
Gmail - BUSITAL'10 notification https://mail.google.com/mail/?ui=2&ik=b225d1b422&view=pt&search...
2 of 2 17/03/2011 5:07 PM

5th International Workshop on Business/IT Alignment and Interoperability
BUSITAL 2010
Hammamet, Tunisia, 7 June 2010
In conjunction with the CAISE’10 22nd International Conference on Advanced Information Systems Engineering
Workshop Proceedings
Editors
BUSITAL 2010 Chairs Michaël Petit University of Namur (FUNDP), Belgium
Graham Gal Isenberg School of Management, University of Massachusetts Amherst, MA, USA
Annick Castiaux University of Namur (FUNDP), Belgium
CAiSE’10 Workshop Chairs Jolita Ralyté University of Geneva, Switzerland
Pierluigi Plebani Politecnico di Milano, Itally

CAiSE 2010 Workshop BUSITAL Proceedings
This volume contains the original articles presented at the 5th International Workshop on Business/IT Alignment and Interoperability – BUSITAL’10. The workshop was held in conjunction with the 22nd International Conference on Advanced Information Systems Engineering, in Hammamet, Tunisia, June 7, 2010. Copyright © 2010 for the individual papers by the papers’ authors. Copying permitted only for private and academic purposes. This volume is published and copyrighted by its editors. CEUR Workshop Proceedings, CEUR-WS.org, ISSN 1613-0073.

I
Preface
The BUSITAL'10 workshop is the 5th edition of the BUSITAL workshop dedicated to business/IT alignment, and interoperability of information systems. Previous editions occurred in Luxembourg, Trondheim, Montpellier and Amsterdam.
Scope and Purpose
Organizations are today becoming more and more dependent on their information systems and IT-based support systems to realize their business strategies, building value networks with partners, and managing their resources effectively. But ensuring that their IT investments are well aligned is not easy. Such alignment is a critical “early stage” activity to understand how information systems contribute to business strategy and to set directions for the development and maintenance processes that follow. Its requires a good understanding and solving of issues at all levels ranging from information technology issues, through organizational issues up to business and strategic issues, and the ability to rapidly, smoothly and consistently adapt all these.
A number of frameworks and methods have been designed to help managers in aligning business and IT. Recently, novel methods and techniques based on conceptual and enterprise modeling have been proposed to support mutual alignment between business needs and IT solutions.
The overall objective of the workshop is to bring together a large community (both Information Systems and Information Management) contributing to exploring the benefits, challenges and solutions of business and IT alignment.
Topics
BUSITAL 2010 topics are well connected to the CAiSE 2010 ones since enterprise models (including strategy and process models), enterprise architecture, and methodological aspects may play a central role in alignment. BUSITAL concentrates on topics related to the business strategy and to the methods and tools for ensuring alignment, including:
• Frameworks, techniques and methods for capturing, understanding and representing business strategy and its impact on information systems landscapes;
• Systems methodologies and frameworks for guiding information system design using relevant information in business strategy models/definitions, including traceability issues;
• Models, methods, and tools for indicating, analyzing, and measuring alignment;

II
• Solutions for guiding information systems evolution and adaptation using relevant information in business strategy models/definitions, including IT governance;
• Case studies and empirical reports on the benefits and costs of alignment; • Business/IT alignment in organizational networks, including co-creation of
value through global networks; • Alignment issues in Service-Oriented analysis and design.
The presented papers have been grouped in three sessions:
• Motivations and quality-based approaches for Business-IT Alignment; • IT governance, Business-IT Alignment management and evaluation; • Business ontologies and models for Business-IT Alignment.
We would like to thank the authors and the members of the Program Committee for their effort in making this 5th edition a success.
May 2010
Annick Castiaux Graham Gal
Michaël Petit

III
BUSITAL’10 Organization Committee
Workshop Chairs
A. Castiaux, University of Namur, Belgium G. Gal, University of Massachusetts, USA M. Petit, University of Namur, Belgium
Program Committee
E. Dubois, Public Research Centre Henri Tudor, Luxembourg J. Gordijn, Vrije Universiteit, The Netherlands P. Hruby, Microsoft, Denmark P. Johannesson, KTH Stockholm, Sweden J. Krogstie, NTNU, Trondheim, Norway K. Lyytinen, Case Western Reserve University, USA S. Nurcan, Université Paris 1 Panthéon-Sorbonne, France Y. Pigneur, University of Lausanne, Switzerland W.J. van den Heuvel, Tilburg University, The Netherland A. Wegmann, EPFL, Switzerland H. Weigand, Tilburg University, The Netherlands H. Werthner, TU Wien, Austria R.J. Wieringa, University of Twente, Enschede, The Netherlands C. Woo, University of British Columbia, Vancouver, Canada E. Yu, University of Toronto, Canada
Communication Chair
A. Heni, University of Namur, Belgium
IV
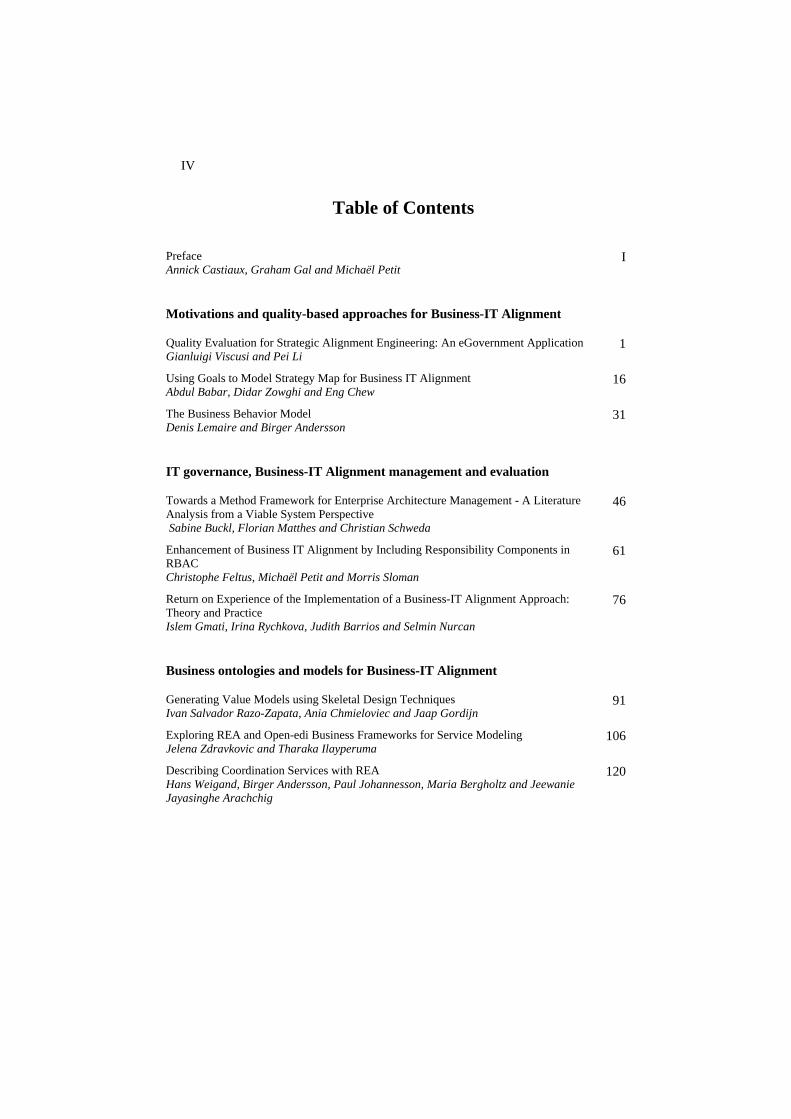
Table of Contents
Preface Annick Castiaux, Graham Gal and Michaël Petit
I
Motivations and quality-based approaches for Business-IT Alignment
Quality Evaluation for Strategic Alignment Engineering: An eGovernment Application Gianluigi Viscusi and Pei Li
1
Using Goals to Model Strategy Map for Business IT Alignment Abdul Babar, Didar Zowghi and Eng Chew
16
The Business Behavior Model Denis Lemaire and Birger Andersson
31
IT governance, Business-IT Alignment management and evaluation
Towards a Method Framework for Enterprise Architecture Management - A Literature Analysis from a Viable System Perspective Sabine Buckl, Florian Matthes and Christian Schweda
46
Enhancement of Business IT Alignment by Including Responsibility Components in RBAC Christophe Feltus, Michaël Petit and Morris Sloman
61
Return on Experience of the Implementation of a Business-IT Alignment Approach: Theory and Practice Islem Gmati, Irina Rychkova, Judith Barrios and Selmin Nurcan
76
Business ontologies and models for Business-IT Alignment
Generating Value Models using Skeletal Design Techniques Ivan Salvador Razo-Zapata, Ania Chmieloviec and Jaap Gordijn
91
Exploring REA and Open-edi Business Frameworks for Service Modeling Jelena Zdravkovic and Tharaka Ilayperuma
106
Describing Coordination Services with REA Hans Weigand, Birger Andersson, Paul Johannesson, Maria Bergholtz and Jeewanie Jayasinghe Arachchig
120