using enzymes to link soil structure and microbial ... · using enzymes to link soil structure and...
TRANSCRIPT
USING ENZYMES TO LINK SOIL STRUCTURE AND MICROBIAL COMMUNITY
FUNCTION IN A PRAIRIE CHRONOSEQUENCE
By
SARAH J. FANSLER
A thesis submitted in partial fulfillment of
the requirements for the degree of
MASTER OF SCIENCE IN SOIL SCIENCE
WASHINGTON STATE UNIVERSITY Department of Crop and Soil Sciences
AUGUST 2004

ii
To the Faculty of Washington State University:
The members of the Committee appointed to examine the thesis of SARAH J.
FANSLER find it satisfactory and recommend that it be accepted.
_______________________________ Chair
_______________________________
_______________________________
_______________________________

iii
ACKNOWLEDGEMENT
I would like to thank the guidance, support and constructive criticism of my committee
member, Vanessa Bailey and my chair Jeff Smith. I also want to thank committee
members Harvey Bolton, Jr. and Dave Bezdicek for their suggestions on improving my
thesis. I thank the Department of Energy for funding the Carbon Sequestration in
Terrestrial Ecosystems project that sponsored my research. My thanks also extend to my
many coworkers whose consultation, experience, and support I found extremely valuable
through out my program.
My family has been an infinite source of support and love during the length of my
program. I can not even begin to thank them enough. A special thanks to my husband
Paul, for putting up with my absence during the time I had to spend in Pullman and who I
missed terribly when I was away.

iv
USING ENZYMES TO LINK SOIL STRUCTURE AND MICROBIAL COMMUNITY
FUNCTION IN A PRAIRIE CHRONOSEQUENCE
Abstract
by Sarah J. Fansler, MS Washington State University
August 2004
Chair: Jeffery L. Smith
Recently attention has focused on the potential of using soil as a sink for atmospheric
CO2. The objective of this study was to use soil enzymes and classical methods of soil
aggregate fractionation to explore the relationship between microbial community
function and soil structure of a tallgrass prairie chronosequence. The soils within the
chronosequence were: (1) remnant native prairie, (2) agricultural soil, and (3, 4) tallgrass
prairies restored from agriculture in 1979 and 1993. β-glucosidase (E.C. 3.2.1.21) and N-
acetyl-β-glucosaminidase (NAGase, EC 3.2.1.30) assays were conducted on four
different aggregate size fractions (>2 mm, 1 -2 mm, 250µm-1 mm, and 2 - 250 µm) from
each soil. Specific activities for both enzymes (µg PNP g-1 soil h-1) were greatest in the
microaggregate (2 µm -250 µm) fractions across the chronosequence; however, this size
fraction makes up only a small proportion of the whole soil. Therefore, it is the larger
macroaggregate-derived enzyme activities that have the greatest impact on the activity of

v
the whole soil. Analyzing both enzymes and the physical structure, a reversion from an
agricultural soil through the restored to more like the prairie soil, was not detected. It
appears that the function of these microbial community systems in the native tallgrass
prairie and agricultural soils of the chronosequence are in equilibria while the lands
restored to tallgrass prairie are in an ongoing state of recovery.

vi
TABLE OF CONTENTS
ACKNOWLEDGEMENT................................................................................................. iii
ABSTRACT....................................................................................................................... iv
LIST OF TABLES............................................................................................................ vii
LIST OF FIGURES ......................................................................................................... viii
CHAPTER ONE................................................................................................................. 1
1. INTRODUCTION .................................................................................................. 1
2. MATERIALS AND METHODS............................................................................ 4
3. RESULTS ............................................................................................................... 9
4. DISCUSSION....................................................................................................... 12
5. CONCLUSIONS................................................................................................... 16
BIBLIOGRAPHY............................................................................................................. 18
APPENDIX
A. SELECTION OF ENZYMES FOR STUDY........................................................ 31
B. THE INFLUENCE OF MICROBIAL ACTIVITY IN PED DEVELOPMENT.. 52
C. DEVELOPMENT OF A DNA MICROARRAY TO DETECT β-
GLUCOSIDASE AND N-ACETYL-GLUCOSAMINIDASE ............................ 62
vii
LIST OF TABLES
1. Soil characteristics………………………………………………………………..22
2. Carbon and Nitrogen content of each aggregate size fraction……………………23

viii
LIST OF FIGURES
1. Aggregate size distribution of each plot in the soil chronosequence…….………24
2. (a) Glucosidase specific activity of each aggregate size fraction within each soil
of the chronosequence. (b) Glucosidase specific activity of each aggregate size
fraction between each soil of the chronosequence…………………………….…25
3. Enzyme activity of each aggregate size fraction compared to the C and N content
within each aggregate size fraction in each plot of the chronosequence………...26
4. β-glucosidase aggregate-derived enzyme activity……………………………… 27
5. (a) N-acetyl-β-glucosaminidase specific activity of each aggregate size fraction
within each soil of the chronosequence. (b) N-acetyl-β-glucosaminidase specific
activity of each aggregate size fraction between each soil of the
chronosequence…………………………………………………………………..28
6. Enzyme activity of each aggregate size fraction compared to the C and N content
within each aggregate size fraction in each plot of the chronosequence………...29
7. N-acetyl-β-glucosaminidase aggregate-derived enzyme activity………………..30

1
CHAPTER ONE
Introduction
Investigations of carbon sequestration are necessary to discover potential ways to reduce
the rising levels of greenhouse gases. Soils are a source and sink of greenhouse gases
including N2O, CH4 and CO2. However, recent attention has focused on soils as a
potential sink for atmospheric CO2 until new sources of CO2-free power are developed or
CO2 released to the atmosphere is reduced. It is hypothesized that through management
of soils, such as no-tillage in agricultural systems, an increase in soil C can occur until a
carrying capacity is reached (Smith 1994). An important consequence of increasing soil
C is the concurrent increase in soil aggregation, which affects many physical and
chemical parameters that relate to soil quality (Doran and Parkin 1994). Thus the ability
to develop management systems that increase soil C will offset greenhouse gas emissions
through C storage and also increase soil quality.
Management of arable lands will affect soil aggregation by changing the microbial
community structure and function. In turn, the microbial community composition affects
the carbon (C) dynamics in a soil system. Thus, it is this complex link between
aggregation and microbial composition that will affect soil C storage in soils. In native
systems, plant debris decomposes slowly on the surface, allowing for the accumulation of
soil organic matter (SOM) and the development of fungi that result in the formation of
soil aggregates (Gupta and Germida 1988). In contrast, agricultural systems often
involve tillage of the plant debris into the surface soil, which results in little fungal
development due to the shearing action from tillage that which can result in less new

2
aggregate formation. In addition, rapid microbial oxidation of the plant residue decreases
the C that could have been stored as soil organic matter (SOM).
Soil aggregates consist of a hierarchy of decaying SOM and soil mineral particles made
of clay, sand, and silt. The most simple soil aggregates, called microaggregates, contain
small pieces of recalcitrant SOM, which are physically protected from decomposition by
mineral soil particles that accumulate on and around the surface of the SOM
(Cambardella and Elliott 1994). Particulate organic matter (POM) C may account for
about 40% of the total soil organic C, most of which occurs in the macroaggregate size
fractions (Cambardella and Elliott 1994). Microbial exudates, fungal hyphae, and POM
combine to form a glue that holds microaggregates into larger macroaggregate structures
(Jastrow and Miller 1998; Tisdall and Oades 1982).
Macroaggregates are beneficial in C storage due to the physical protection of the SOM
within the aggregate. The rate of C turnover in macroaggregates is faster than
microaggregates as indicated by the greater amount of freshly added C incorporated into
macroaggregates than into microaggregates (Jastrow 1996; Six et al. 2001). In addition,
C accumulation can be the result of slow decomposition of SOM, no priming of native C
with continuous OM addition, or a slow turnover rate of macroaggregates (Six et al.
2001). A slow turnover rate in the macroaggregate size fraction is a physical process that
results in a subsequent decrease in the rate of biological SOM decomposition due to the
physical protection of the SOM.

3
Enzymes produced by microorganisms or microbial communities are potentially sensitive
indicators of change in the biochemical component of the SOM, or of C content in the
soil (Bandick and Dick 1999; Deng and Tabatabai 1996; Dick 1997; Ekenler and
Tabatabai 2003). Changes in SOM, particularly microbial biomass C and potentially
mineralizable substrate, should be evident in enzyme activity before changes in the SOM
pool are measurable (Deng and Tabatabai 1996). β-glucosidase (EC 3.2.1.21) is a well
studied enzyme from the Glycosidase enzyme family and is important in C cycling . The
C content of a soil is significantly correlated to glycosidase enzyme activity, since the
enzyme is instrumental in the breakdown of cellulose and is produced by both bacteria
and fungi (Deng and Tabatabai 1996). Fungi are a major source of chitin as it is the main
constituent of fungal cell walls. Chitin, upon hydrolysis by N-acetyl glucosaminidase
(NAGase, EC 3.2.1.52) yields glucosamine as a product, making NAGase an important
enzyme in C cycling (Guggenberger et al. 1999). Miller et al. (Miller et al. 1998)
compared the activity of a diverse group of fungi to that of chitinolytic bacteria and
actinomycetes and determined that only the fungi displayed constitutive NAGase activity.
Enzyme activities in different aggregate size fractions may provide insights to the
mechanisms of SOM dynamics in whole soils and possibly, how C is sequestered in soil
systems. The objectives of this study were to investigate the relationship between
microbial community function and soil aggregate structure by assessing the enzyme
activity for the aggregate fractions across a chronosequence of similar soil types and
vegetation at different stages of ecosystem development. Based on these objectives three
hypotheses were formulated:

4
1) Soil macroaggregates will be a greater component of the soil fabric as the soil
chronosequence ages because the largest size fraction will not be physically disrupted by
tillage. Instead, the determining factors of aggregate size will be natural processes.
2) There will be more enzyme activity in the largest size fraction because the
labile SOM dominates this fraction. The presence of labile SOM binds microaggregates
into macroaggregates and encourages the growth of the microbial biomass within
aggregate structures. As the microbial community gets larger, the amount of enzymes
secreted from the biomass also increases.
3) Enzyme activity within each aggregate fraction will increase with the
increasing age of the soil chronosequence due to the increased physical protection of the
SOM provided by the aggregate structures.
By identifying physical locations within the soil structure that display the greatest amount
of biochemical activity across a carbon aggrading chronosequence we can understand
how aggregate protection and C sequestration are related. This relationship can be used
to enhance C sequestration.
Materials and Methods
Soil sampling
The tallgrass prairie restoration chronosequence at Fermi National Laboratory (N41.8º
and W 88.3º, Batavia, IL, USA) was sampled during the spring of 2003. The soils
(located within a 1.5 mile radius) collected were from remnant native prairie (Prairie),
agricultural land that was restored to prairie grassland in 1979 and 1993 (R79 and R93

5
respectively), and agricultural land (Ag) that continues to be in a long-term rotation of
row crops (Zea mays and Phaseolus vulgaris). The soil in the Drummer series classified
as a fine-silty, mixed, superactive, mesic Typic Endoaquoll (Table 1). The mean
precipitation was 92 cm and the mean temperature was 11ºC (Jastrow 1987; Soil Survey
Staff 2004). Soil from each plot was sampled to a depth of 0-5 cm, passed through a 4-
mm sieve, visible plant debris was removed by hand, and the soil was stored at 4ºC until
analysis.
Wet sieving
The wet sieving method for aggregate distribution was used in our experiment(s) and
adapted from those of Jastrow (2003) and Angers and Mehuys (1993). The sieve sizes
were 2 mm, 1 mm, 250 µm, and 53 µm, therefore the size fractions collected were: >2
mm, 1-2 mm, 250 µm-1 mm, and 2-250 µm The sieves were nested with the largest
mesh on top and placed into a large basin. Distilled water was added to the basin until
the water level reached 1 cm below the wire mesh of the 2-mm sieve. The soil (100g dry
wt) was spread evenly over the surface of the 2-mm mesh and the water level was raised
just until the soil could be wet by capillarity. The soil was allowed to moisten for ten
minutes, and then the water level was raised to 1.5 cm above the mesh of the top sieve.
Sieving consisted of raising and lowering the nest of sieves 4 cm at a rate of 50 times per
min for 2 min.
After sieving, the soil remained in the basin undisturbed for 5 minutes to allow fine
particles to settle. Floating organic matter was aspirated into a vacuum flask and rinsed

6
onto a 20-µm nylon filter. The nest of sieves was slowly removed from the basin and
placed onto a catch pan to collect any remaining water. The sieves were separated and
placed into a 27°C forced air oven and air dried until the aggregates could easily be
removed from the sieve. The aggregates were air dried to -0.33 MPa water content
(pressure plate method) (Klute 1986).
Water from the basin and catch pan were combined and centrifuged in a Beckman J2-21
centrifuge at 14500×g (9500 rpm) for 30 min to collect particles greater than 2 µm that
were not retained on the 250-µm sieve (the 2 mm-250 µm fraction). Stoke’s law was
used to determine the force and time required for the particles to be removed from the
solution. After centrifuging, the soil particles from this fraction were combined in a
preweighed container and allowed to dry to -0.33 MPa water content in a forced air oven
at 27°C. Three macroaggregate size fractions were collected (>2 mm, 2-1 mm, 250 µm -
2 mm) and one microaggregate fraction was collected (250-2 µm).
All of the soil fractions were incubated at the -0.33 MPa water content for three days
before further analyses to minimize skewing of metabolic activity caused by handling the
soil.
Enzyme assays
β-glucosidase (EC 3.2.1.21) and N-acetyl-β-glucosaminidase (NAGase, EC 3.2.1.30)
assays were performed on whole soil and all aggregate size fractions from the four soils
of the chronosequence. The protocol for the N-acetyl-β-glucosaminidase assay was

7
derived from (Parham and Deng 2000), and β-Glucosidase was assayed as described by
(Eivazi and Tabatabai 1988).
For the β-Glucosidase activity assay, soil (1 g OD at -0.33 MPa water content) was
placed into a plastic tube and treated with 4 mL of modified universal buffer (MUB, pH
6) and 1 mL of 0.5 M p-nitrophenyl-β-D-glucopyranoside substrate solution. The
solution was mixed thoroughly and allowed to incubate in the dark for 1 hour at 37°C.
After incubation, the reaction product was stopped and the yellow color from the p-
nitrophenol was developed by the addition of 1 mL 0.5 M calcium chloride and 4 mL of
Tris buffer (pH 10). The solution was mixed and filtered through a 0.45 µm syringe tip
filter. Controls were performed for both field moist and all wet aggregate size fractions
by adding the substrate after the reaction was stopped. The p-nitrophenol was measured
by absorption on a spectrophotometer at a wavelength of 405 nm and quantified by
comparison with a standard curve.
For the N-acetyl-β-glucosaminidase assay 1 g (OD equivalent) soil was weighed into a
plastic tube and 4 mL of 100 mM acetate buffer (pH 5.5) and 1 mL of 10 mM p-
nitrophenyl-N-acetyl-β-D-glucosaminide (Sigma, St. Louis, MO) substrate solution were
added. The solution was thoroughly mixed and allowed to incubate for 1 hour in the dark
at 37°C. After 1 h the reaction was stopped by adding 1 mL of 0.5 M calcium chloride
and 4 mL of 0.5 M sodium hydroxide. This also promotes the development of the yellow
p-nitrophenol color that is the basis of the enzyme product colorimetric assay of activity
(Ekenler and Tabatabai 2002). The solution was mixed and filtered through a 0.45 µm

8
syringe tip filter. Controls were performed for both field moist and all wet aggregate size
fractions by adding the substrate after the reaction was stopped. The p-nitrophenol
intensity was measured by absorption on a spectrophotometer at a wavelength of 405 nm
and the absorption quantified by comparison to a standard curve.
Standard Curve
Solutions of 0-5 µg p-nitrophenol (15 mM p-nitrophenol in MUB, pH 6) were made to
develop a standard curve for β-glucosidase and NAGase assays (Tabatabai and Bremner
1969). The solutions were incubated for 1 hour at 37ºC. After incubation, the yellow p-
nitrophenol color was developed by adding 1 mL of 0.5 M CaCl2 and 4 mL of Tris buffer
(pH 10). The standard solutions were measured by absorption on a spectrophotometer at
a wavelength of 405 nm and a standard curve developed by plotting absorption vs
concentration.
Statistical Analysis
The data were analyzed using Systat 10 (SPSS Inc, Chicago Illinois). For all multiple
comparisons, Bonferroni’s pairwise comparison test was used following a one-way
ANOVA to detect significant differences at P<0.05. The enzyme activity data were
grouped and analyzed by 1) comparing the activity of an enzyme in the different size
fractions of each soil and by 2) comparing the activity of an enzyme in one size fraction
across all four soils.

9
Results
Aggregates
The Prairie and Ag soils had a similar aggregate size distribution (Fig. 1). However, in
the Ag soil there were about twice the amount of microaggregates 2µm-250µm in size
and 25% fewer macroaggregates (>2 mm and 1-2 mm) than the Prairie soil. The R93
plot had about 66% more mass in large macroaggregates (>2 mm) than both the Prairie
and Ag plots, accompanied by a small proportion of 1-2 mm, 250µm-1 mm, and 2-250
µm macroaggregates and microaggregates. In the R79 plot more of the mass is
distributed into the 1-2 mm and 250 µm-1 mm macroaggregate and >2 mm large
macroaggregate size fractions compared to the R93 plot. The R79 plot had the smallest
microaggregate size fraction of the plots in the soil chronosequence with the
microaggregate size fraction making up less than 4% of the total mass distribution for
that plot.
β-Glucosidase
Enzyme activities across a soil chronosequence of native prairie, restored prairie, and
continuous row crop agriculture were compared in this study. The age of each of the
members of the chronosequence affected the amount of β-glucosidase activity that was
present in each of the aggregate size fractions. β-Glucosidase specific activity (Eq. 1)
was significantly greater in the smallest size fraction (2µm-250µm) for all the
chronosequence soils, except in the Ag soil (Fig. 2a).

10
(g)fraction size in the aggregates of mass
PNP) g(activity activity enzyme Specific µ= [Eq. 1]
The trend exhibited by the Ag soil showed decreased specific activity across all fractions
compared to the activities detected in the other soils and aggregate fractions in the
chronosequence (Fig. 2b). After restoration back to grassland prairie (R79 and R93), β-
glucosidase specific activity generally increased over that of the Ag fraction.
In the >2 mm size fraction, the β-glucosidase specific activity of the Ag plot was lower
and significantly different from the R93 plot, but not the R79 and Prairie plots (Fig. 2b).
In the 250 µm -2 µm microaggregate size fraction the Prairie and R79 plots were
significantly different from the Ag and R93 plots of the chronosequence.
β-glucosidase enzyme activity in the smallest size fraction of all the chronosequence soils
was sensitive to the C and N content of each soil aggregate size fraction, in that the
enzyme activity increased as the amount of C and N associated with that size fraction
increased (Table 2 and Fig. 3a,b).
When the distribution of β-glucosidase activity was weighted to the size of the aggregate
fractions in each soil (Aggregate-derived activity; Eq. 2), the Prairie (macroaggregate
size fractions dominate) and the Ag soil had approximately similar activity distributions
within each aggregate size fraction, though the Ag activities were consistently lower (Fig.
4).
soil) (g/100gfraction in aggregates of proportion)h soil g PNP g(activity enzyme specificactivity derived-Aggregate
-1-1µ= [Eq. 2]

11
Both restored plots exhibited larger amounts of β-glucosidase aggregate-derived activity
in the >2 mm macroaggregate size fraction than that of the Prairie or Ag plots.
N-acetyl-β-glucosaminidase
In the Ag soil N-acetyl-β-glucosaminidase (NAGase) activity among all of the size
fractions within the soil is smaller than the aggregate size fractions in the remaining soils
of the chronosequence (Fig. 5a). The smallest size fraction in each soil had the highest
specific activity of all the aggregate size fractions in that soil, except in the Ag soil which
had no significant differences between the aggregate size fractions within that soil.
NAGase specific activities were greatest in the smallest (2 µm -250 µm) microaggregate
size fractions across the chronosequence (Fig. 5b).
The NAGase enzyme aggregate-derived activity values in the small microaggregate size
fraction increased as the amount of C and N associated with those fractions increased
(Table 2 and Fig. 6a, b).
Most of the NAGase aggregate-derived activity in the Prairie soil was located in the 1-2
mm and 250 µm-1 mm aggregate size fractions (Fig. 7). The Ag soil had a uniform
distribution of aggregate-derived NAGase activity, such that all four aggregate size
fractions contributed approximately equally to the soil activity (Fig. 7). In the R93 soil,
the >2 mm size fraction had the greatest aggregate-derived activity. In the R79 soil, the
specific activity was mainly derived from the 2-250 µm size fraction. However, the
aggregate-derived enzyme activity of the R79 soil was found to be divided approximately

12
equally among the three macroaggregate size fractions (>2 mm, 1-2 mm, and 250µm-1
mm).
Discussion
Analysis of the aggregate size distribution within each soil of the chronosequence
revealed an increase in the amount of large macroaggregates that contribute to the
structure of the whole soil compared to the contribution the aggregates make in the Ag
soil. This supports the hypothesis that soil macroaggregates will be a greater component
of the soil fabric as the soil chronosequence ages, which also agrees with the previously
proposed aggregate hierarchy models (Jastrow and Miller 1998; Six et al. 1999; Tisdall
and Oades 1982). These hierarchy models propose that surface litter deposition
contributes to the formation of more stable soil aggregates by binding together
microaggregates to make macroaggregates. The binding agents are organic matter and
microbial byproducts of litter decomposition (hyphae, other biomass, and exudates).
The specific activity of the enzymes in each of the four aggregate size fractions of the
chronosequence did not provide evidence to support the hypothesis that the enzyme
activity would be the greatest in the largest aggregate size fraction. Instead, the specific
activity of both enzymes revealed that the largest amount of activity was associated with
the microaggregate size fraction in all of the chronosequence soils (Figs. 2, 5). The
specific enzyme activity did, however, support the hypothesis that enzyme activity within
each aggregate size fraction will increase with the increasing age of the soil
chronosequence (Figs. 2, 5). This could be due to the observation that enzyme activity in

13
a particular size fraction tended to increase as the chronosequence ages. However, when
the proportion that each aggregate fraction contributes to the whole soil is considered,
i.e., aggregate-derived activity, the microaggregate size fraction actually contributes a
small amount to the activity of the whole soil.
For both β-Glucosidase and NAGase, the enzyme activity derived from each aggregate
size fraction suggests a change in microbial functions across the soil chronosequence
(Fig. 2). The Prairie and Ag soils had a similar distribution of aggregate-derived enzyme
activity among the aggregate size fractions however, the magnitude of the activities
differed. The Ag soil had less aggregate-derived activity in each fraction than the
corresponding fraction in the Prairie soil; for both enzymes, the enzyme activity in the
whole Ag soil was only about a quarter of that in the Prairie whole soil (data not shown).
Both the Prairie and Ag soils have been under the influence of their respective
management regimes for an extended amount of time, allowing each soil to reach some
type of steady state. It is likely that enzyme activity exhibited in the Ag soil would have
been different from what we measured if measured following the early cultivation of the
native prairie sod, however, the enzyme activity measurements were made on the Ag soil
after approximately 150 years of row crop cultivation. This long history of consistent
management may have fostered a new, steady state of biochemical dynamics. The
similar distribution of aggregate-derived activity in the Prairie and Ag soils may also
occur due to the complex nature of the trophic levels in the Prairie soil that may not be
present in the Ag soil, i.e., arthropod variability and plant species diversity (Berkelmans

14
et al. 2003). In that case, the similar distributions would be mere coincidences, artifacts
of the different soil conditions.
The distribution of aggregate-derived activities across the aggregate size fractions of the
restored prairie soils differed from the Ag and Prairie soils (Fig. 4, 7). In the R93 soil,
the β-glucosidase aggregate-derived activity was higher in the large macroaggregate (>2
mm) size fraction than in the smaller fractions (Fig. 4). Similar changes in the β-
glucosidase activity distribution of the R93 soil were seen in the R79 soil but lower in
magnitude (Fig. 7). An increase in the aggregate-derived β-glucosidase activity of the >2
mm, 1-2 mm, and 250 µm-1 mm macroaggregate size fractions of the R93 and R79 soils
compared to the Ag and Prairie soils, showed that the microbial community was adapting
to the changes caused by the restoration. It is possible that the microbial community was
responding to an increase in organic matter deposition on the soil surface due to the
reduction in tillage and reversion back to a natural grassland system (Beare et al. 1992).
This agrees with other researchers (Gupta and Germida 1988; Miller and Dick 1995),
who likewise concluded that macroaggregate structures provide habitat for microbial
biomass, the enzyme activity of which is probably stabilized by the physical protection
offered by the macroaggregate structure. Alternatively, the function of the microbial
community as seen via enzyme activity, could be responding to a change in the fungal
portion of the microbial community due to proliferation of fungi after cessation of tillage.
Macroaggregate (>2 mm, 1-2 mm, 250 µm-1 mm)-derived NAGase activity (Fig .7) was
also suggestive of microbial function shifts across the soil chronosequence. In the R93

15
soil, the activity was highest in the large macroaggregate size fraction (> 2 mm) (Fig. 7).
The increase in enzyme activity relative to the Ag soil indicates that the function i.e.,
NAGase activity, that the microbial community was expressing had changed, perhaps in
response to the addition of organic matter to the surface of the soil (Beare et al. 1992).
The R79 plot suggests other community shifts, seen as the reduction of aggregate-derived
activity in the large (> 2 mm) macroaggregate size fraction and the subsequent increase in
activity of the 1-2 mm and 250 µm -1 mm macroaggregate size fractions. This may be
due to aggregate turnover as the microbial decomposition of the organic matter binding
the macroaggregates breaks the large >2 mm aggregates into new microaggregates, which
then re-form into macroaggregates > 250 µm in size (Six et al. 1999).
The microaggregate fraction did not contribute much to the enzyme activities of the
whole soils, in spite of its large specific activity for both enzymes, because this fraction is
a very small component (4-11%) of the whole soil from each plot (Fig. 1). It is possible
that residual enzyme activity was protected in these microaggregates by having been once
incorporated into a larger macroaggregate structure. Evidence for this conclusion is
supported by δ13C data collected by Jastrow et al. (Jastrow et al. 1996; Jastrow and Miller
1998) in which the age of C3 and C4 derived C in aggregate size fractions of pasture and
corn soils was compared. The large macroaggregates were found to have a greater
proportion of recently deposited C and thus a more rapid apparent turnover rate (74
years) than that of the microaggregate structures. The C associated with microaggregate
structures had a turnover time of approximately 412 years (Jastrow et al. 1996). This
reflects the age and degree of protection of the C and possibly the associated microbial

16
enzymes within each aggregate size fraction. Aggregate turnover may keep the newly
formed and newly released microaggregates supplied with fresh secretions of enzyme
from microorganisms residing within macroaggregates; these enzymes may be sorbed to
and protected by clay minerals in the soil (Burns 1986).
It is important to consider the possible source of the enzyme activity in the aggregate size
fractions of the soil chronosequence. The β-glucosidase enzyme activity is associated
with the both bacterial and fungal processes; as a result, the contribution that each
individual microbial group makes to the activity of the aggregate size fractions of the
soils in the chronosequence is unclear. Miller et al. (Miller et al. 1998) found NAGase
activity to be highly correlated with fungally-dominated systems. The NAGase data
presented here reflects the activity of the microbial biomass as the biomass population
changes from a bacterially-dominated active community in the Ag soil (as indicated by a
F:B ratios of whole soils in Table 1) to a fungally dominated active community in the
Prairie and Restored Prairie (R93 and R79) soils (Bailey et al. 2002).
Conclusions
The microbial systems in the native tallgrass prairie and agricultural soils of the
chronosequence are in equilibrium while the lands restored to tallgrass prairie are in an
ongoing state of recovery. The native prairie system developed over thousands of years
under conditions that are different from today. Similarly, the agricultural plots have been
so managed for about 150 years. A new steady state may eventually be reached in the
restored systems; this new equilibrium will reflect human influences and changes in

17
climate under which the systems re-stabilize. We are still unable to predict the time to a
new equilibrium, nor if will it be similar to the native prairie.

18
Bibliography
Bailey VL, Smith JL, Bolton HJ (2002) Fungal-to-bacterial ratios in soils investigated for
enhanced C sequestration. Soil Biology and Biochemistry 34: 997-1007
Bandick AK, Dick RP (1999) Field management effects on soil enzyme activities. Soil
Biol Biochem 31: 1471-1479
Beare MH, Parmelee RW, Hendrix PF, Cheng W, Coleman DC, Crossley J, D.A. (1992)
Microbial and faunal interactions and effects on litter nitrogen and decomposition in
agroecosystems. Ecol Monogr 62: 569-591
Berkelmans R, Ferris H, Tenuta M, van Bruggen AHC (2003) Effects of long-term crop
management on nematode trophic levels other than plant feeders disappear after 1 year of
disruptive soil management. Appl Soil Ecol 23: 223-235
Burns RG (1986) Interaction of enzymes with soil mineral and organic colloids. In:
Huang, PM, Schnitzer, M (Ed) Interactions of soil minerals with natural organics and
microbes. Soil Science Society of America, Madison, WI, pp 429-451
Cambardella CA, Elliott ET (1994) Carbon and nitrogen dynamics of soil organic matter
fractions from coltivated grassland soils. Soil Sci Soc Am J 58: 123-130

19
Deng SP, Tabatabai MA (1996) Effect of tillage and residue management on enzyme
activity in soils. II. Glycosidases. Biol Fertil Soils 22: 208-213
Dick RP (1997) Soil enzyme activities as integrative indicators of soil health. In:
Pankhurst, CE, Doube, BM, Gupta, VVSR (Ed) Biological Indicators of Soil Health.
CAB International, New York, pp 121-156
Doran JW, Parkin TB (1994) Defining and assessing soil quality. In: Doran, JW,
Coleman, DC, Bezdicek, D, Stewart, BA (Ed) Defining soil quality for a sustainable
environment. Soil Science Society of America, Inc., Madison, pp 3-21
Eivazi F, Tabatabai MA (1988) Glucosidases and galactosidases in soils. Soil Biol
Biochem 601-606
Ekenler M, Tabatabai MA (2002) ß-glucosaminidase activity of soils: effect of cropping
systems and its relationship to nitrogen mineralization. Biol Fertil Soils 36: 367-376
Ekenler M, Tabatabai MA (2003) Tillage and residue management effects on ß-
glucosaminidase activity in soils. Soil Biol Biochem 35: 871-874
Guggenberger G, Frey SD, Six J, Paustian K, Elliott ET (1999) Bacterial and fungal cell-
wall residues in conventional and no-tillage agroecosystems. Soil Sci Soc Am J 63: 1199-
1988

20
Gupta VVSR, Germida JJ (1988) Distribution of microbial biomass and its activity in
different soil aggregate size classes as affected by cultivation. Soil Biol Biochem 20: 777-
786
Jastrow JD (1996) Soil aggregate formation and the accrual of particulate and mineral-
associated organic matter. Soil Biol Biochem 665-676
Jastrow JD, Boutton TW, Miller RM (1996) Carbon dynamics of aggregate-associated
organic matter estimated by carbon-13 natural abundance. Soil Sci Soc Am J 60: 801-807
Jastrow JD, Miller RM (1998) Soil aggregate stabilization and carbon sequestration:
feedbacks through organomineral associations. In: Lal, R, Kimble, JM, Follett, RF,
Stewart, BA (Ed) Soil processes and the carbon cycle. CRC Press, New York, pp 207-
223
Miller M, Dick RP (1995) Thermal stability and activities of soil enzymes as influenced
by crop rotations. Soil Biol Biochem 27: 1161-1166
Miller M, Palojarvi A, Rangger A, Reeslev M, Kjoller A (1998) The use of fluorogenic
substrates to measure fungal presence and activity in soil. Appl Environ Microbiol 64:
613-617
Parham JA, Deng SP (2000) Detection, quantification, and characterization of B-
glucosaminidase activity in soil. Soil Biol Biochem 21: 1183-1190

21
Six J, Carpentier A, van Kessel C, Merckx R, Harris D, Horwath WR, Luscher A (2001a)
Impact of elevated CO2 on soil organic matter dynamics as related to changes in
aggregate turnover and residue quality. Plant Soil 234: 27-36
Six J, Elliott ET, Paustian K (1999) Aggregate and soil organic matter dynamics under
conventional and no-tillage systems. Soil Sci Soc Am J 63: 1350-1358
Six J, Guggenberger G, Paustian K, Haumaier L, Elliott ET, Zech W (2001b) Sources
and composition of soil organic matter fractions between and within soil aggregates. Eur
J Soil Sci 52: 607-618
Smith JL (1994) Cycling of nitrogen through microbial activity. In: Hatfield, JL, Stewart,
BA (Ed) Soil Biology: Effects on soil quality. CRC Press, Boca Raton, Fl, pp 91-120
Soil Survey Staff, Natural Resources Conservation Service, United States Department of
Agriculture. Official Soil Series Descriptions [Online WWW]. Available URL:
"http://soils.usda.gov/soils/technical/classification/osd/index.html" [Accessed 1 July
2004].
Tabatabai MA, Bremner JM (1969) Use of p-nitrophenyl phosphate for assay of soil
phosphatase activity. Soil Biol Biochem 1: 301-307
Tisdall JM, Oades JM (1982) Organic matter and water-stable aggregates in soils. J Soil
Sci 141-163

22
Table 1. Soil characteristics.
Plot pH C
(mg g-1 soil)
N
(mg g-1 soil)
F:B Texture
Currently farmed (Ag) 5.6 41 3.1 0.85 Clay Loam
Restored prairie 1993 (R93) 6.6 59 5.6 10.7 Clay Loam
Restored prairie 1979 (R79) 7.3 60 5.1 13.5 Silt Loam
Native prairie (Prairie) 7.5 118 8.9 ND Silt Loam
ND = not determined

23
Table 2. Carbon and Nitrogen content of each aggregate size fraction across the soils of
the chronosequence.
Soil Aggregate
size fraction
mg C g-1 soil in
each aggregate size
fraction
mg C g-1
whole soil
mg N g-1 soil in
each aggregate size
fraction
mg N g-1
whole soil
Ag >2 mm 10.36 0.77
1-2 mm 12.14 0.91
250µm-1 mm 14.44 1.07
2-250 µm 4.14 0.30
total 41.08 41.16 3.06 3.06
Restored prairie
1993 (R93) >2 mm 40.38
2.85
1-2 mm 7.71 0.56
250µm-1 mm 4.59 0.32
2-250 µm 2.90 0.21
total 55.57 58.82 3.94 5.55
Restored prairie
1979 (R79) >2 mm 30.83
2.45
1-2 mm 16.40 1.28
250µm-1 mm 11.16 0.85
2-250 µm 1.85 0.14
total 60.24 60.43 4.72 5.09
Native Prairie >2 mm 24.49 1.86
1-2 mm 39.40 3.14
250µm-1 mm 43.53 3.48
2-250 µm 5.87 0.48
total 113.29 118.40 8.97 8.90


APPENDIX A: SELECTION OF ENZYMES FOR STUDY

30
Six enzymes assays were surveyed to select those that met the following criteria:
1. Is the enzyme activity robust to water saturation resulting from the wet sieving
procedure?
2. Does the enzyme activity vary across the chronosequence?
3. Are published gene sequences available for the enzyme?
These criteria were queried on the 6 enzymes that are presented in this appendix using the
following basic procedure. To address question 1, soils were saturated on the nest of
sieves by the method described in chapter one, without sieving the soil. These enzyme
activities were compared to those in soils that had been analyzed in their field moist state
following conditioning that consisted of bringing the water content of each soil to -0.33
Mpa. Only the R93 soil was used for this test due to limited quantities of the other three
soils from the prairie chronosequence. A t-test was used to compare samples and a P-
value less than 0.05 was considered a significant difference.
To address question 2, all six enzyme assays were surveyed on all four field moist soils
of the prairie chronosequence (except the cellulose assay in which only R79, R93, and Ag
soils were used) at -0.33 Mpa water content. For all multiple comparisons, Bonferroni’s
pairwise comparison test was used following a one-way ANOVA to detect significant
differences at P<0.05.

31
Arylsulphatase
Function
Sulphatases catalyze the hydrolysis of organic sulphate esters. Arylsulphatase catalyses
the irreversible reaction:
ROSO3- + H2O = ROH + H+ + (SO4)2-
which has been detected in soil microorganisms. The activity of arylsulphatase is also
correlated with soil organic carbon, nitrogen, and cation exchange capacity. In this assay
system, p-nitrophenyl sulphate is hydrolyzed to produce p-nitrophenol, which can be
measured spectrophotometrically at 405 nm (Alef and Nannipieri 1995a).
Method
Soils were conditioned with a water content of -0.33 MPa prior to assay.
In a test tube, 1 g (dry weight) of soil and add 0.25 mL of toluene, 4 mL acetate buffer
(0.5M, pH 5.8), and 1 mL of p-nitrophenyl sulphate (25 mM in acetate buffer, store at
4ºC) were combined. The tube was capped, the contents mixed thoroughly, and
incubated for one hour at 37ºC. After the incubation 1 mL of CaCl2 (0.5 M) and 4 mL of
NaOH (0.5 M) were added to each tube, (for the controls p-nitrophenyl sulphate substrate
was added before adding the CaCl2 and NaOH) and the tube was then gently mixed. The
suspension was filtered through a 0.45 µm filter and the abundance of p-nitrophenol was
measured colorimetrically on a spectrophotometer at 405 nm.

32
Calibration curve
One milliliter of standard (PNP) was diluted in 100 mL H20 to create the PNP stock
solution. The calibration standards were made by pipetting stock and water in the
following ratios into Erlenmeyer flasks:
standard
µg PNP PNP (mL) H2O (mL)
0 0 5
2 1 4
4 2 3
6 3 2
8 4 1
10 5 0
Calibration standards were incubated and analyzed with the rest of the samples according
to the procedure above.
Calculation
tsVClNitropheno
××
=− )hdwt g g( 1-1-µρ
C = measured concentration of p-nitrophenol (µg/mL)
s = dry weight of soil used (g)
V = total volume of soil suspension (mL)
t = incubation time (h)

33
Results
1. Is the activity of arylsulphatase robust to the water saturation that will result from wet
sieving?
5657585960
6162636465
wet field
µg P
NP
g-1 s
oil h
-1
The t-test was used and a P value of 0.004 was generated, therefore wetting the soil
significantly increased the activity of arylsulphatase.
2. Does arylsulphatase activity vary across the chronosequence?
d
c
b
a
0
20
40
60
80
100
120
140
160
180
Prairie Ag R79 R93
µg P
NP
g-1 so
il h-1
34
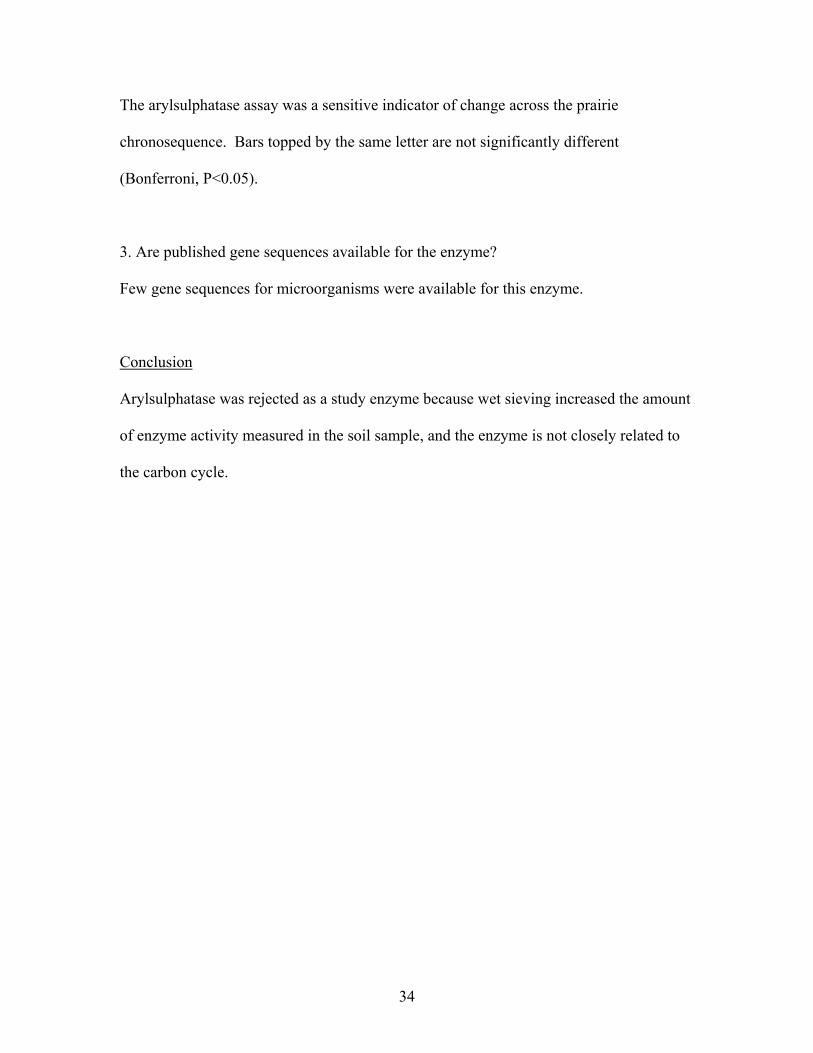
The arylsulphatase assay was a sensitive indicator of change across the prairie
chronosequence. Bars topped by the same letter are not significantly different
(Bonferroni, P<0.05).
3. Are published gene sequences available for the enzyme?
Few gene sequences for microorganisms were available for this enzyme.
Conclusion
Arylsulphatase was rejected as a study enzyme because wet sieving increased the amount
of enzyme activity measured in the soil sample, and the enzyme is not closely related to
the carbon cycle.

35
β-glucosidase and N-acetyl-glucosaminidase
Function
The functions of these enzymes are detailed in chapter one.
Method
The methods for assaying these enzymes are detailed in chapter one.
Results
1. Is the activity of β-glucosidase robust to the water saturation that will result from wet
sieving?
0
40
80
120
160
200
wet field
µg P
NP
g-1 s
oil h
-1
β-glucosidase
The t-test was used and a p value of 0.031 was generated, therefore wetting the soil
significantly increased the activity of β-glucosidase.

36
0
10
20
30
40
wet field
µg P
NP
g-1 s
oil h
-1NAGase
The t-test was used and a p value of 0.015 was generated, therefore wetting the soil
significantly decreased the activity of β-glucosidase.
2. Does arylsulphatase activity vary across the chronosequence?
aaa
b
0
40
80
120
160
Prairie Ag R79 R93
µg P
NP
g-1 s
oil h
-1
β-glucosidase
The β-glucosidase activity was a sensitive indicator of change across the prairie
chronosequence. Bars topped by the same letter are not significantly different
(Bonferroni, P<0.05).

37
a
ba
b
0
20
40
60
80
Prairie Ag R79 R93
µg P
NP
g-1 s
oil h
-1NAGase
The NAGase activity was a sensitive indicator of change across the prairie
chronosequence. Bars topped by the same letter are not significantly different
(Bonferroni, P<0.05).
3. Are published gene sequences available for the enzyme?
Yes, abundant gene sequences for microorganisms are available for these enzymes.
Conclusion
The β-glucosidase and NAGase assays were studied further because the assays were
sensitive indicators of change across the prairie chronosequence soils.

38
Cellulase
Function
The cellulase assay measures the hydrolysis of cellulose to b-glucose by measuring the
release of reducing sugars such as the glucose monohydrate that is used to calibrate the
assay (Alef and Nannipieri 1995b).
Method
The following reagents are needed for the assay:
Acetate buffer:
2 M, pH 5.5
CMC solution:
0.7% (w/v) in acetate buffer.
Reagent A:
16 g of anhydrous sodium carbonate and 0.9 g of potassium cyanide in 1 L water.
Reagent B:
0.5 g of potassium ferric hexacyanide in H2O, in 1 L water. Store in a brown (light
shielded) bottle.
Reagent C:
1.5 g of ferric ammonium sulphate , 1 g sodium dodecyl sulphate, and 4.2 mL of
concentreated sulphuric acid in 1 L H2O (at 50°C).

39
Day one:
Five grams (OD) of field-moist (-0.33 MPa water content) soil were placed in a test tube
and 7.5 mL of acetate buffer and 7.5 mL CMC solution were added. The tube was
capped tightly and incubated at 50ºC for 24 hours.
Day two:
The CMC solution was added to the control samples (without the CMC substrate on day
one). All soil suspension samples were filtered through a 0.45 µm filter. A 0.5 mL
aliquot of filtrate from each sample was placed into a fresh test tube and 10 mL of H2O
added. A 1 mL aliquot of this diluted solution was removed into a fresh glass tube. To
the diluted solution, 1 mL of reagent A and 1 mL of reagent B were added. The tubes
were closed tightly and the solutions were mixed well. The samples were then placed
into a boiling in water bath at 100ºC for 15 minutes. After cooling for 5 minutes at 20 ºC,
5 mL of reagent C were added to each sample. The solutions were mixed and allowed to
stand for one hour at 20ºC. The reduced sugar content of the samples was measured on a
spectrophotometer at 690 nm.
40
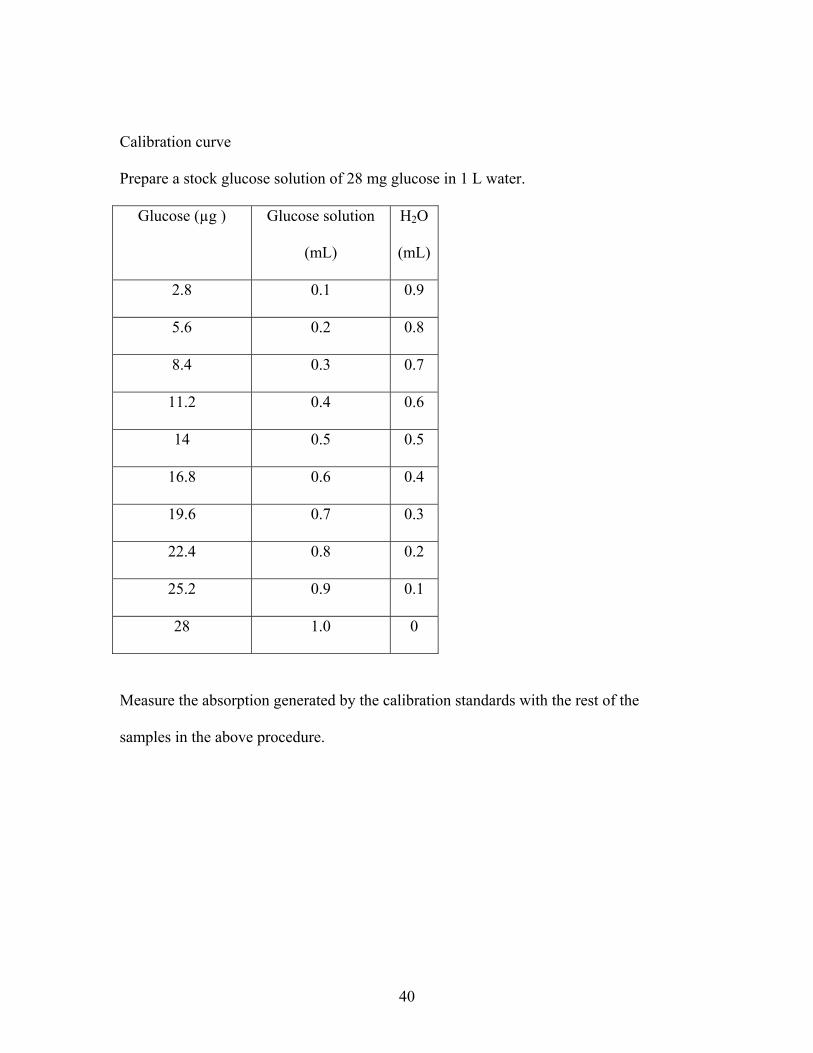
Calibration curve
Prepare a stock glucose solution of 28 mg glucose in 1 L water.
Glucose (µg )
Glucose solution
(mL)
H2O
(mL)
2.8 0.1 0.9
5.6 0.2 0.8
8.4 0.3 0.7
11.2 0.4 0.6
14 0.5 0.5
16.8 0.6 0.4
19.6 0.7 0.3
22.4 0.8 0.2
25.2 0.9 0.1
28 1.0 0
Measure the absorption generated by the calibration standards with the rest of the
samples in the above procedure.

41
Calculation
Glucose equivalent (ug/g dry weight soil/24 hours) = C*v*f/s
tsFVC)day soil dry weightg g( equivalent Glucose 11
×××
=−−µ
C = measured glucose concentration (µg ml-1)
V = volume of suspension (30 mL)
F = dilution factor (20 for ag)
s = dry weight of soil used (g)
Results
1. Is the activity of cellulase robust to the water saturation that will result from wet
sieving?
0
40
80
120
wet field
µg g
luco
se g
-1 s
oil h
-1
The t-test was used and a p value of 0.02 was generated, therefore wetting the soil
significantly decreased the activity of cellulase.

42
2. Does cellulase activity vary across the chronosequence?
0
20
40
60
80
100
R79 R93 Ag
µg g
luco
se g
-1 s
oil h
-1
There was no significant differences in cellulase activity among the chronosequence soils
(P=0.078). The cellulase assay was not sensitive indicator of change across the prairie
chronosequence.
3. Are published gene sequences available for the enzyme?
Yes, many gene sequences are available for microbial sources of this enzyme.
Conclusion
The cellulase assay was removed from further analysis due to its lack of discrimination
among the soils in the prairie chronosequence.

43
Chitinase activity
Function
(Alef and Nannipieri 1995c)
Method
Stock solution of 4-(dimethyl amino)benzo aldehyde (DMBA)
10 g DMBA dissolved in 87.5 mL concentrated acetic acid and 12.5 mL concentrated
hydrochloric acid, store at 4C.
DMBA working solution
Mix one volume stock with four volumes of concentrated acetic acid. This solution must
be prepared fresh daily.
Day one:
One gram of soil, 5 mL of phosphate buffer (0.12 M, pH 6.0) and 5 mL chitin suspension
(5% w/v chitin in 0.2g/L sodium azide) were added to a test tube. The tube was capped
tightly, mixed, and incubated at 37ºC for 16 hours.
Day two:
The chitin suspension was added to the controls, after which 10 mL of potassium chloride
(2 M) were added to each sample. The samples were placed on a shaker at room
temperature for 30 min. The soil suspensions were filtered using 0.45 µm filter. Next,
0.5 mL of the filtrate of each sample was placed into a fresh tube and 1.5 mL of H2O and
0.4 mL borate buffer (0.8 M, pH 9.1) were added. The samples were boiled for three
minutes and cooled to room temperature. Once the samples were cool, 5 mL of DMBA

44
working solution was added. The samples were mixed and incubated at 35ºC for 30
minutes. Color development was measured on a spectrophotometer at 405 nm.
Calibration Curve
Calibration
Concentration
(µg mL-1))
N-Acetyl
glucosamin
e (45 mM)
(mL)
Phosphate
buffer
(mL)
KCL
(mL)
H2O
(mL)
0 0 12.5 25 12.5
50 0.5 12.5 25 12
100 1.0 12.5 25 11
150 1.5 12.5 25 10.5
200 2.0 12.5 25 10
250 2.5 12.5 25 9.5
Calculation.
tdwtVC*
)hourdwt g g( eglucosamin AcetylN 11- ×=− −µ
C= measured N-Acetyl glucosamine concentration (µg/mL)
V = final volume of assay (20 mL)
dwt = dry weight of 1 g moist soil (g)
t = incubation time (h)

45
Results
1. Is the activity of chitinase robust to the water saturation that will result from wet
sieving?
0.00
0.10
0.20
0.30
0.40
wet field
µg N
-Ace
tyl g
luco
sam
ine
g-1
soil
h-1
The t-test was used and a P value of 0.09 was generated, therefore wetting the soil did not
significantly change activity of chitinase.
2. Does chitinase activity vary across the chronosequence?
0.00
0.10
0.20
0.30
0.40
Prairie Ag R79 R93
µg N
-Ace
tyl g
luco
sam
ine
g-1 so
il h-1

46
The chitinase assay had a P value of 0.768, therefore there were no differences in
chitinase activity among the soils of the chronosequence.
3. Are gene sequences published for the enzyme?
Yes, abundant gene sequences are available for this enzyme in microorganisms.
Conclusion
The chitinase assay was not pursued further because of the assay’s inability to
differentiate between the different soils of the prairie chronosequence.

47
Dehydrogenase activity
Function
The oxidative activity of dehydrogenase in a cell is used as a measure of microbial
activity in soil. Dehydrogenase is a respiratory enzyme that removes electrons from its
respective substrate and moves the electrons along through NAD+ and ubiquinone.
Eventually the electrons will be dumped into the cytochrome system, in which the final
electron acceptor is O2. This method utilizes triphenyltetrazolium chloride (TTC) as an
electron acceptor. TTC is reduced by the addition of electrons to triphenyl formazan
(TPF). The reduction rate of TTC to TPF is measured colorimetrically at a wavelength of
546 nm (Alef).
Method
The following solutions were prepared ahead of time.
TTC solution
0.8 g of TTC dissolved in 100 mL Tris buffer (100 mM).
TPF calibration solution
Dissolve 50 mg of TPF in 100 mL acetone.
Day one:
In a test tube combine and mix 5 g of soil and 5 mL of TTC solution. The control
samples contained only soil and Tris buffer (10 mM). The samples were incubated for 24
hours at 30ºC.

48
Day two:
Each tube received 40 mL of acetone. The samples were mixed thoroughly and
incubated for 2 hours at room temperature with shaking every 30 minutes. The soil
suspensions were filtered, and the TPF concentration was measured at 546 nm.
Calibration Curve
Prepare the following solutions in flasks.
Standard
concentration
(µg TPF/mL)
TPF
(mL)
Tris
(mL)
Acetone
(mL)
0 0 8.3 41.7
5 0.5 8.3 41.2
10 1.0 8.3 40.7
20 2.0 8.3 39.7
30 3.0 8.3 38.7
40 4.0 8.3 37.7
Calculation
ssvdry ×
=)mL g( TPFsoil weight g g TPFith activity w aseDehydrogen
-1 1- µµ
s = dry weight of soil used (g)
sv = volume of solution added to the sample (ml)

49
Results
1. Is the activity of dehydrogenase robust to the water saturation that will result from
wet sieving?
0.0
0.5
1.0
1.5
2.0
wet field
ug T
PF
g-1
soil
h-1
The t-test was used and a P value of 0.435 was generated, therefore wetting the soil did
not significantly change the activity of dehydrogenase.
2. Does dehydrogenase activity vary across the chronosequence?
c
abb
ab
0
1
2
3
4
Prairie Ag R79 R93
ug T
PF
g-1
soil
h-1
The activity does vary among the soils of the chronosequence; bars topped by the same
letter are not significantly different (Bonferroni, P<0.05).

50
3. Are gene sequences published for the enzyme?
Gene sequences are available for this enzyme; however, the sequences available for this
enzyme are very generic.
Conclusion
Dehydrogenase activity was rejected as a study enzyme because it is a very generic,
ubiquitous soil process that is not exclusively related to the carbon cycle. Identifying
individual gene sequences specific to the relevant dehydrogenases for use in future
microarray work would be a challenge beyond the scope of this project.

51
Bibliography
Alef K Dehydrogenase activity. In: Alef, K, Nannipieri, P (Ed) Methods in applied soil
microbiology and biochemistry. Academic Press, Inc., San Diego, CA, pp 228-230
Alef K, Nannipieri P (1995a) Arylsulphatase activity. In: Alef, K, Nannipieri, P (Ed)
Methods in applied soil microbiology and biochemistry. Academic Press, Inc., San
Diego, CA, pp 364-365
Alef K, Nannipieri P (1995b) Cellulase activity. In: Alef, K, Nannipieri, P (Ed) Methods
in applied soil microbiology and biochemistry. Academic Press, Inc., San Diego, CA, pp
345-347
Alef K, Nannipieri P (1995c) Chitinase avtivity. In: Alef, K, Nannipieri, P (Ed) Methods
in applied soil microbiology and biochemistry. Academic Press Limited, San Diego, pp

APPENDIX B: THE INFLUENCE OF MICROBIAL ACTIVITY IN PED
DEVELOPMENT

53
Introduction
Some of the processes of pedogenesis are additions, subtractions, transformations, and
translocations of soil mineral and organic material. The factors that drive these processes
are time, parent material, climate, topography, and organisms. The pedogenic structure
that evolves over time is a result of the combination and intensity of the pedogenic
processes. Pedogenic soil structure is important for:
1. Vertical and lateral water movement through a soil profile
2. Crop nutrient uptake/root penetrability
3. Nutrient cycling
4. Erosion control.
In order to contribute to our understanding of how a soil develops, my objective was to
focus on a single part of the pedogenic system, specifically, the biochemical
transformations mediated by soil microorganisms.
Microbial enzyme activity can by an indicator of carbon and nitrogen transformations in
soil (Ekenler and Tabatabai 2002). The enzyme activity of a soils’ microbial population
is sensitive to soil perturbations (Dick 1997). I have selected two extracellular enzymes
β-glucosidase and N-acetyl-β-glucosaminidase as indicators of soil microbe populations.
N-acetyl-β-glucosaminidase (E.C. 3.2.1.52) breaks down chitobiose (chitin dimers)
molecules to produce N-acetyl-D-glucosamine units. The enzyme is predominately
produced by fungi (Waldrop et al. 2000). In this study, it is assumed that the
glucosaminidase activity detected is fungal in origin.

54
Figure 1. N-acetyl-D-glucosaminidase hydrolyzing chitobiose units (GlcNAc), yielding
water and two N-acetyl-D-glucosamine (coo140) molecules.
β-glucosidase (E.C. 3.2.1.21) hydrolyzes the non-reducing β-D-glucose residues releasing
β-D-glucose units. This enzyme activity is predominately bacterial in orgin (Waldrop et
al. 2000). In this study all β-glucosidase activity is assumed to be from bacteria.
Figure 2. β-D-Glucopyranosyl-4-D-glucopyranose (c00185) units are hydrolyzed by β-
glucosidase yielding water and two β-D-glucose monomers.
N-acetyl-β-glucosaminidase activity is more strongly correlated to fungal expression and
less linked to bacterial expression (Tisdall and Oades 1982). Fungi have been linked to

55
aggregate stability (Miller et al. 1998). Microbial activity is favored by the aerobic
conditions at ped surfaces (exterior 5 mm). I hypothesize that greater activities of β-
glucosidase and N-acetyl-β-glucosaminidase will be measured in the soil samples from
the outer 5 mm of a ped than its interior.
Materials and Methods
Soil Sampling
Soil was sampled from a pre-dug pit during the fall of 2003. The soil is a Palouse series,
fine-silty, mixed, superactive, mesic Pachic Ultic Haploxerolls. Currently the land is
farmed with a conservation tillage and direct seed program. Samples were taken from
the northeast corner of the pit using a soil knife. Intact peds were removed from the pit
from the Ap, Bt1, Bt2, and Bt3 horizons. The horizons span a vertical distance of 0-150
cm. Once sampled the soil peds were kept at 4ºC until use.
The exterior and interior of each ped was separated in a sterile laminar flow hood using a
sterile metal scalpel. The exterior 5 mm of each ped surface was removed, passed
through a 2 mm sieve, and homogenized. The interior of each ped was also passed
through a 2 mm sieve and homogenized.
The water content of each both the interior and exterior of each ped was determined by
drying in a forced air oven at 105ºC for 48 hours. The samples were conditioned at
approximately -0.03 Mpa water content (~37%) for five days before further analysis.

56
Enzyme assays
N-acetyl-β-glucosaminidase (NAGase, EC 3.2.1.30) and β-glucosidase (EC 3.2.1.21)
assays were completed on all samples. The protocol for the glucosaminidase assay was
derived from (Parham and Deng 2000). β-Glucosidase method was derived from (Eivazi
and Tabatabai 1988).
Briefly, for Glucosaminidase; 1 g OD equivalent soil was weighed into a plastic tube.
Then 4 mL of 100 mM acetate buffer (pH 5.5) and 1 mL of 10 mM p-nitrophenyl-N-
acetyl-β-D-glucosaminide (Sigma) substrate solution were added. The assay was
thoroughly mixed and allowed to incubate for 1 hour in the dark at 37°C. Post incubation
1 mL of 0.5 M calcium chloride and 4 mL of 0.5 M sodium hydroxide were added to the
assay to stop the reaction and promote the development of the yellow p-Nitrophenol color
(Ekenler and Tabatabai 2002). Controls were assayed by adding substrate after the
reaction was stopped with the addition of NaOH. The assay was mixed and filtered
through a 0.45 µm syringe tip filter. Controls were carried out for both the exterior and
interior of the peds. p-Nitrophenol was measured on a spectrophotometer at a
wavelength of 405 nm.
β-Glucosidase activity was measured based on the method developed by (Eivazi and
Tabatabai 1988). Soil (1 g OD) was placed into a plastic tube and treated with 4 mL of
modified universal buffer (MUB) and 1 mL of 0.5 M p-nitrophenyl-β-D-
glucopyranoside substrate (Sigma). The solution was mixed thoroughly and allowed to
incubate in the dark for 1 hour at 37°C. For controls substrate was added after the

57
reaction was terminated. After incubation the reaction was stopped and the yellow color
from the p-Nitrophenol developed from the addition of 1 mL 0.5 M calcium chloride and
4 mL of Tris buffer (pH 10). The assay solution was mixed and filtered through a 0.45
µm syringe tip filter. P-Nitrophenol was measured on a spectrophotometer at a
wavelength of 405 nm.
All enzyme assays were conducted in replicates of three. Significant differences in
enzyme activities among soil samples were detected using a one-way ANOVA, and the
means were compared using the Bonferroni test at P<0.05. Statistical analyses were
conducted in SYSTAT v.10 (SPSS Inc, Chicago IL)."
Results
N-acetyl-β-glucosaminidase activity was greater in the exterior ped faces of the A and Bt
1 horizons. The variability of N-acetyl-β-glucosaminidase activity between the exterior
ped face and the interior of the ped equilibrates as depth increases.
β-glucosidase activity was greater in the exterior ped faces of the lower horizons Bt 2 and
Bt3. There was no variability β-glucosidase enzyme activity between exterior ped face
and the interior ped in the upper most A and Bt1 horizons.

58
Fig. 3. Bars topped by the same letter are not significantly different
(Bonferroni, P<0.05).
Fig. 4. Bars topped by the same letter are not significantly different
(Bonferroni, P<0.05).
Discussion
The data provides evidence suggesting the possibility that N-acetyl-β-glucosaminidase
activity may play a part in the development of soil structural characteristics. Aggregate
stability is linked to pedogenic structure. A small amount of residual enzyme activity
remains in the profile that could possibly serve to sustain aggregate and thus pedogenic
structure.
N-acetyl-β-Glucosaminidase
bbbb
a
c
a
b
0
40
80
120
A A ext Bt 1 Bt1 ext Bt 2 Bt 2 ext Bt 3 Bt 3 ext
µg P
NP
g-1
soil
h-1
β-Glucosidase
bbbbd
abcadaab
0
40
80
120
A A ext Bt 1 Bt1 ext Bt 2 Bt 2 ext Bt 3 Bt 3 ext
µg P
NP
g-1
soil
h-1

59
Due to the amount of clay accumulated on ped surfaces, future research regarding
extracellular enzymes and their attachment to clays will be an important link in
understanding what effect microbial activity has on ped structure. Variability in clay
content in the different horizons could affect the availability of the enzymes for substrate
degradation. Extracellular enzymes can sorb to the edges of clay minerals, preventing the
enzymes’ active site from binding substrate. As clay content increases the amount of
enzyme bound to the edges could increase. This could lead to a reduction in the
efficiency of the microorganisms to break down available substrate while protecting the
enzyme from degradation itself. The existence of microbial enzyme activity deep with in
a soil profile may thus be greater then initially observed.
Conclusion and Interpretation
N-acetyl-β-glucosaminidase activity was the only enzyme of the two studied that was
differently expressed between the exterior and interior of the ped. As this enzyme is
dominantly associated with fungal activity, the formation of the mollic epipedon of the
soil may therefore be partly attributable to fungal biomass and the persistent residues of
fungal activity. Stable aggregate formation is a precursor to the structural development of
a soil and is the building block of a dynamic soil system.

60
Acknowledgements
The author gratefully acknowledges Dr. V.L. Bailey at PNNL who helped conduct the
statical analysis. The students of Advanced Pedology 551 for their contribution to class
discussions and to Tabitha Brown for providing detailed ped descriptions from
Cunningham farm.

61
Bibliography
Dick RP (1997) Soil enzyme activities as integrative indicators of soil health. In:
Pankhurst, CE, Doube, BM, Gupta, VVSR (Ed) Biological Indicators of Soil Health.
CAB International, New York, pp 121-156
Eivazi F, Tabatabai MA (1988) Glucosidases and galactosidases in soils. Soil Biol
Biochem 601-606
Ekenler M, Tabatabai MA (2002) ß-glucosaminidase activity of soils: effect of cropping
systems and its relationship to nitrogen mineralization. Biol Fertil Soils 36: 367-376
Miller M, Palojarvi A, Rangger A, Reeslev M, Kjoller A (1998) The use of fluorogenic
substrates to measure fungal presence and activity in soil. Appl Environ Microbiol 64:
613-617
Parham JA, Deng SP (2000) Detection, quantification, and characterization of B-
glucosaminidase activity in soil. Soil Biol Biochem 21: 1183-1190
Tisdall JM, Oades JM (1982) Organic matter and water-stable aggregates in soils. J Soil
Sci 141-163
Waldrop MP, Balser TC, Firestone MK (2000) Linking microbial community
composition to function in a tropical soil. Soil Biol Biochem 32: 1837-1846

APPENDIX C: DEVELOPMENT OF A DNA MICROARRAY TO DETECT
β-GLUCOSIDASE AND N-ACETYL-GLUCOSAMINIDASE

63
A microarray was designed to analyze the possible microbes in the microbial community
that could be contributing to the enzyme (β-glucosidase and N-acetyl-β-D-
glucosaminidase) activity measured in the prairie soil chronosequence. The optimization
of microarray conditions is currently ongoing and is the focus of the follow-up research
to this thesis.
1. Probe Design
DNA probes for genes sequences for these enzymes were obtained by searching the
NCBI database with the E.C. number for each enzyme (β-glucosidase E.C. 3.2.1.21;
NAGase E.C. 3.2.1.30). The sequences selected for further study were of both bacterial
and fungal origin. Pathogenic microorganism gene sequences were excluded.
Selected sequences were aligned using Clustal X software (http://www-igbmc.u-
strasbg.fr/BioInfo/ClustalX/Top.html). After alignment, the sequences were imported
into BoxShade (http://www.ch.embnet.org/software/BOX_form.html) to identify areas of
homology. Sequence areas (70 nucleotides long) of interest for probe design were
located in non-homologous regions of the sequences. After 70-base (70-mer) non-
homologous regions were identified in each sequence, the possible probe sequences were
submitted to the Blast function of the NCBI alignment software
(http://www.ncbi.nlm.nih.gov/BLAST/) to confirm the uniqueness of these sequences.

64
Result
Table 1. Organisms and DNA sequences for a microarray designed to interrogate the
possible microbial origins of β-glucosidase and NAGase activities.

65
2. Microarray Hybridization and Signal Detection
Genomic DNA from soil samples was isolated using a method that was modified from
Zhou et al. and Gabor et al. (Gabor et al. 2003; Zhou et al. 1996). Briefly, 1 g soil and 1
mL of lysis buffer were added to a 2.0 mL capacity conical tube (BioPlas, Inc. San
Rafael, CA). The lysis buffer consisted of 100 mM Tris pH 8, 100 mM sodium EDTA
pH 8, 100 mM NaH2PO4 pH 8, 1.5 M NaCl, 1% CTAB (CAS#57-09-0), and 5%
polyvinylpolyprilidone. After the sample was vortexed for one minute at maximum
speed, 10 µL proteinase K (10 mg/mL), 40 µL lysozyme (10 mg/mL), and 0.5 g silica-
zirconia beads (0.1 mm, BioSpec, Bartlesville, OK) were added. The sample was mixed
and incubated at 37ºC for 30 min. After the incubation 200 µL 20% SDS was added, the
sample mixed and allowed to incubate for 2 hours at 65ºC. The samples were then placed
in a bead-beater and homogenized for two minutes. Following bead beating, the samples
were centrifuged at 16000× g for 10 minutes; the supernatant was removed and placed
into a clean DNAase-free tube. The pellet was extracted once more with lysis buffer,
vortexed for 1 minute, incubated for 10 minutes at 65ºC, centrifuged and the supernatant
removed and pooled with the previous sample.
The DNA in the supernatant was purified by the addition of an equal volume of
chloroform-isoamyl alcohol. The samples were centrifuged and the aqueous phase was
removed. The DNA was precipitated from the aqueous phase, the pellet washed, and the
DNA resuspended in water.

66
A biotin-labeled nucleotide (dATP) was incorporated into genomic DNA per
manufacturers’ instructions (BioNick DNA Labeling System, Invitrogen, Carlsbad, CA).
Target hybridization occurred for 16 hours at room temperature. Trymide signal
amplification (TSA) was used to maximize the detection of hybridized target to probe
sequences (TSA Biotin System, Perkin-Elmer, Boston, MA). Slides were washed by
rinsing with fresh TNT buffer, followed by a four-minute agitation in TNT buffer. After
completion of the TSA procedure an Alexa Fluor 546 streptavidin conjugate (2 µg ml-1
1x SSC 5x Denhardt’s) was added to the slide (Call et al. 2003). Fluor attachment was
followed by a final wash and rinse in 0.6x SSC. The slides were dried and imaged on a
ScanArray Express HT (Perkin-Elmer, Boston, MA) imager.

67
Results
TSA experiment
Figure 1. The TSA +/- experiment. a) Array map. b) Microarray images of the TSA +
and c) TSA- experiment. Slide “a” followed the procedure above. Slide “b” did not
undergo TSA amplification, only Alexa Fluor 546-streptavidin attachment.
a4 3C 3C 3C 3C B B B B CY3 CY3 CY3 CY3 B B B B3 3A 3A 3A 3A B B B B 3B 3B 3B 3B B B B B2 2B 2B 2B 2B B B B B 2C 2C 2C 2C B B B B1 1 1 1 1 B B B B 2A 2A 2A 2A B B B B
1 2 3 4 5 6 7 8 9 10 11 12 13 14 15 16
1 Biotin labeled primer 3A nicked B. subtilis 10 ng/uL2A nicked PUC19 10 ng/uL 3B nicked B. subtilis 100 ng/uL2B nicked PUC19 100 ng/uL 3C nicked B. subtilis 250 ng/uL2C nicked PUC19 250 ng/uL CY3
b
c

68
Figure 2. a) TSA+
slide signal pixel
intensity. b) TSA-
slide signal pixel
intensity. c) The
TSA+/TSA- pixel
intensity ratio. TSA
amplification increased
pixel signal intensity
>75 times.
0
25
50
75
100
Biotinprimer
buffer cy3 nicked B.subtilis 10
ng/uL
nicked B.subtilis
100 ng/uL
nicked B.subtilis
250 ng/uL
nickedPUC19 10
ng/uL
nickedPUC19
100 ng/uL
nickedPUC19
250 ng/uL
TSA +
0
10000
20000
30000
40000
50000
60000
70000
Biotin primer buffer cy3 nicked B.subtilis 10
ng/uL
nicked B.subt ilis 100
ng/uL
nicked B.subtilis 250
ng/uL
nicked PUC1910 ng/uL
nicked PUC19100 ng/uL
nicked PUC19250 ng/uL
TSA-
0
10000
20000
30000
40000
50000
60000
70000
Biot in primer buffer cy3 nicked B.subt ilis 10
ng/uL
nicked B.subt ilis 100
ng/uL
nicked B.subtilis 250
ng/uL
nicked PUC1910 ng/uL
nicked PUC19100 ng/uL
nicked PUC19250 ng/uL
a
b
c

69
Formamide concentration experiment
9 C.albicans 1888-1959 Buffer P. shrysogenum 303-373 Buffer PUC19 CY38 Arthrobacter 2676-2751 Buffer C.violaceum 186-255 Buffer L.lactis 244-332 Buffer7 R.solanacearum 371-438 Buffer C.fimi 1874-1946 Buffer S.olivaceoviridis 440-509 Buffer6 R.leguminosarum 168-240 Buffer A.tumefaciens 2245-2311 Buffer N.europaea 33-92 Buffer5 T.emersonii 1537-1606 Buffer C.wickerhamii1 798-867 Buffer C.stercorarium 146-215 Buffer4 C.violaceum 825-894 Buffer B.subtilis 440-511 Buffer E.herbicola 574-643 Buffer3 S.reticuli 15-84 Buffer B.circulans 601-669 Buffer Streptomyces 802-870 Buffer2 B.fuckeliana 3147-3216 Buffer M.bispora 361-430 Buffer T.maritima 696-765 Buffer1 P.capsulata 235-303 Buffer S.lycopersici 1100-1168 Buffer T.reesei 1449-1617 Buffer
1 2 3 4 5 6 7 8 9 10 11 12
Figure 3. Array map for the formamide experiment.

70
Figure 4. Array images from the formamide
hybridization experiment. Top wells contained
soil 500 ng DNA extract, 10 ng PUC19 plasmid
DNA and 100 ng B. subtilis DNA in the
hybridization.
Bottom wells contained only 100 ng B. subtilis
DNA and 10 ng PUC19 DNA in the
hybridization;
a) Hybridization buffer contained 0% formamide
b) Hybridization buffer contained 25 %
formamide
c) Hybridization buffer contained 50 %
formamide
a
b
c

71
Summary
Including formamide in the hybridization step of the microarray improves hybridization
specificity of the target DNA to the probe. Using 25% formamide in the hybridization
buffer allowed for less inhibition of target to probe binding as exhibited by the amount of
PUC19 plasmid DNA that bound to the appropriate probe. When 0% and 50%
formamide was used during hybridization, PUC19 DNA and B. subtilis binding to its
respective probe was inhibited in the non-soil DNA extract slides.

72
Bibliography
Call DR, Borucki MK, Loge FJ (2003) Detection of bacterial pathogens in
environmental samples using DNA microarrays. Journal of Microbiological Methods 53:
235-243
Gabor EM, de Vries EJ, Janssen DB (2003) Efficient recovery of environmental DNA for
expression cloning by indirect extraction methods. FEMS Microbiology Ecology 44:
153-163
Zhou J, Burns MA, Tiedje JM (1996) DNA recovery from soils of diverse composition.
Appl Environ Microbiol 62: 316-322