using elemental geochemistry to improve sandstone reservoir
TRANSCRIPT

SPWLA 51st Annual Logging Symposium, June 19-23, 2010
1
USING ELEMENTAL GEOCHEMISTRY TO IMPROVE SANDSTONE
RESERVOIR CHARACTERIZATION: A CASE STUDY FROM THE UNAYZAH A INTERVAL OF SAUDI ARABIA
Robin MacDonald, Douglas Hardman, Ronald Sprague, Yacine Meridji,
Witjaksono Mudjiono, Saudi Aramco; James Galford, Marvin Rourke, Halliburton; Michael Dix, Chemostrat; Michael Kelton, Core Laboratories
Copyright 2010, held jointly by the Society of Petrophysicists and Well Log Analysts (SPWLA) and the submitting authors.
This paper was prepared for presentation at the SPWLA 51 st Annual Logging Symposium held Perth, Australia, June 19-23, 2010.
ABSTRACT The sandstones of the Permian Unayzah A reservoir in Saudi Arabia are an active target for natural gas exploration and development. These sandstones were deposited mainly in eolian dune complexes and sand sheets, as well as in playas and ephemeral streams in interdune areas. The detrital mineralogy is, in most cases, relatively simple. Grains are dominated by quartz, with minor feldspars, lesser lithic fragments, and little primary clay. Diagenetic components, however, can make the bulk-rock mineralogy and reservoir quality much more variable; pore-filling cements can include quartz, carbonates, anhydrite, and illite. Anhydrite nodules can impart significant heterogeneity in mineralogy and porosity. Because of these factors, determination of fundamental reservoir-quality parameters using the typical triple - or quad-combo wireline log suites can be challenging. Measurements of rock matrix elemental concentrations performed on drill cuttings or obtained from wireline logs provide additional information related to the mineralogical composition of the formation that can improve log-derived determinations of reservoir parameters. Whole-rock elemental concentrations are a powerful data set for characterizing and correlating sandstone reservoirs, especially fluvial-eolian sequences such as the Unayzah A that are devoid of fossils and have few shaley zones. For this study, a detailed mineralogical analysis was conducted on a 60-ft section of core, composited from 1-ft intervals of slabbed material. X-ray diffraction analysis for mineralogy, inductively-coupled plasma spectroscopy and X-ray fluorescence spectroscopy were used to determine elemental composition for 55 elements. This data validated elemental concentration logs obtained by a new-generation wireline neutron-induced capture gamma-
ray spectroscopy tool, (GEM™), capable of measuring ten formation elements run over the same interval. Log examples and core results are used to illustrate how Unayzah A sandstone mineralogy can be predicted from elemental data using error-minimization modeling and theoretical forward modeling. In addition to sophisticated predictive models, we show how a series of simple binary and ternary plots based on major-element concentrations or ratios can be constructed to give precise information about mineralogy, lithology, reservoir quality, and even depositional facies. These techniques are a valuable aid to selection of the mineral assemblage that will be used to perform petrophysical interpretations of logs. Although the data and examples presented in the paper are unique to the Unayzah A reservoir interval, the concepts demonstrated in the paper can be applied to other complex reservoirs. GEOLOGICAL BACKGROUND The Unayzah Formation in the Arabian Peninsula (Figure 1a and 1b) is an assemblage of mid-Carboniferous to Early Permian continental clastics deposited on the widespread “Hercynian” unconformity surface. The Unayzah is in turn unconformably overlain by the transgressive clastics and thick carbonates of the Late Permian to Early Triassic Khuff formation, which is a prolific gas reservoir throughout the region. The internal stratigraphy of the Unayzah Formation is quite complex, with rapid lateral facies changes prevalent throughout the section, and ranges from glacio-fluvial sandstones and glacio-lacustrine siltstones in the Lower Unayzah. The upper Unayzah is characterized by fluvio-eolian and sabkkha/wet interdune sandstones and siltstones with several significant intraformational unconformities documented (Melvin and Sprague, 2006; Ortensi, et al., 2008; Price, et al., 2008). Despite the stratigraphic complications, a traditional and workable three-fold subdivision of the Unayzah formation can still be employed for exploration and production activities (McGillivray and Husseini, 1992;
SPWLA 51st Annual Logging Symposium, June 19-23, 2010
2
Wender, et al., 1998; Al-Husseini, 2004). This scheme divides the Unayzah into broad stratigraphic units, termed C, B, and A from oldest to youngest. The Unayzah A reservoir, the subject of this paper, is the youngest of these and is entirely of Early Permian age. This unit is composed of sandstones, with minor siltstones and mudstones, that were deposited in eolian dune complexes, sand sheets, and various sabkha/wet interdune environments. Ephemeral fluvial (wadi) and lacustrine sediments are also present, and are generally associated with the interdune environments (Raba’a and Heine, 2006). In recent years, the Unayzah formation has become the focus of increased activity for exploration and development. It is critical to the success of these efforts that the reservoir be characterized accurately and in detail early in the delineation phase of drilling. In addition, the knowledge derived from early charac-terization must be a robust guide to understanding variations encountered in the geology and petrophysics of the reservoir as the development program moves forward. This is particularly important for optimal exploitation of the reservoir when horizontal wells are drilled during field development. This paper presents a case study of an integrated core and log characterization aimed at providing a mineralogical and elemental compositional baseline for the Unayzah A reservoir. DATA ACQUISITION The well was drilled with a 12-in. bit and a high-salinity, 10.8-lbm/gal potassium chloride polymer mud. The logs were corrected for the influences of these and other logging environment parameters before performing the formation mineral and fluids calculations. Corrections for borehole size, mud density, and borehole potassium content were applied to the natural gamma ray spectroscopy logs; the neutron porosity log was corrected to nominal logging conditions by applying corrections for borehole size, tool standoff, mud density, borehole salinity, and formation temperature and pressure influences. A 60-foot section of core was recovered from the Unayzah A reservoir, and a complete suite of wireline logs was obtained over the cored interval. The core-based analytical program discussed in this study consisted of: • Physical description and sedimentological
interpretation of the slabbed core. This was performed internally by the Aramco Geological Technical Services Division (Tourqui, 2009).
• Routine core analysis. Porosity, permeability, and
grain density data were measured on two-inch diameter core plugs.
• Quantitative mineralogy by X-ray diffraction
(XRD). Sample material for XRD consisted of 60, one-foot composites sliced from the edge of thin veneer slabs (5-10 mm thick) that were cut parallel to the face of the slabbed core. The edge slices were crushed and homogenized, and a randomly selected 25-gram split of the sample was separated. Approximately eight grams of this material was used for XRD analysis. The veneer approach was employed because combined with XRD results it could be more directly comparable to wireline log data as both have approximately the same vertical resolution. Both coarse-fraction and fine fraction separations were scanned during the XRD analysis, allowing high-confidence quantification of clay minerals.
• Whole-rock elemental analysis by inductively
coupled plasma (ICP). This analysis was performed on a second split (approximately two grams) of materia l from the homogenized veneer sample. Both optical emission spectroscopy (ICP-OES) and mass spectrometry (ICP-MS) were employed to obtain high-quality data for 50 elements. This served as the baseline to which wireline log elemental data GEM, and wellsite elemental data from cuttings (LaserStrat® ED-XRF) could be compared.
• Whole-rock elemental analysis by energy-dispersive
X-ray fluorescence (ED -XRF). This was performed on a third split (about six grams) of homogenized veneer sample. Good-quality data for 30-35 elements were obtained by this portable device, which is also used to perform elemental analyses on cuttings at wellsite using (LaserStrat® ED-XRF).
Following coring, wireline quad-combo, geochemical, and fluid sampling logs were recorded over the cored interval. RESULTS The cored Unayzah section consists of two distinctive sedimentary facies (Tourqui, 2009), which further study has shown to have distinctly different reservoir properties (Figure 2). Eolian dune facies – The lower 37 feet of core comprises medium- to coarse-grained sandstones with
SPWLA 51st Annual Logging Symposium, June 19-23, 2010
3
ubiquitous inclined planar laminations (up to 30°). Horizontal planar laminations are present near the top of the interval, but then account for less than four feet of the section. Sand grains are rounded and well-sorted (bimodal) throughout. This section of core is interpreted to represent eolian dune deposits with thin interbedded sand sheets near the top. The dune sandstones are compositionally simple, consisting almost entirely of quartz grains and minor quartz overgrowth cement (72-98 wt%), with variable amounts of nodular anhydrite cement (0-31 wt%). Only trace amounts of feldspars and lithic fragments were detected. The presence of euhedral, pore -filling kaolinite (1-4 wt%) in virtually all samples is good evidence that small amounts of feldspar and possibly mica were originally present in the sandstones. These detrital grains were dissolved during diagenesis, with liberated Si and Al reprecipitating as kaolinite, and traces of Ti reprecipitating as anatase. Trace amounts of diagenetic illite are also present in every sample, and may have played some role in retarding quartz cementation, thus preserving reservoir quality through burial. Spheroidal anhydrite nodules up to 15 cm in diameter are a prominent feature of the dune facies, particularly in the lowest 10 feet of the core. Grain-packing relationships within the nodules indicates the sandstones had undergone significant mechanical compaction and porosity loss prior to cementation by anhydrite. The precipitation of anhydrite was therefore a relatively late diagenetic event, and completely filled the remaining porosity within the nodules. The zone of anhydrite nodules should act, at least to a minor extent, as a baffle to fluid flow. Dark-colored bitumen is present in the dune sandstones from approximately 295.5 to 300.5 feet, and partially occludes pore throats over that interval. Despite the presence of the anhydrite nodules and the bitumen, the dune facies comprises the better reservoir facies in the cored section. Outside of the nodules , the sandstones are only slightly cemented by quartz overgrowths, with core analysis porosities ranging from 5 to 18%, and horizontal permeabilities ranging from 50 to 200 mD. Galena was detected by XRD (< 1 wt%) in one sample near the base of the cored section (299 feet). This occurrence was confirmed by ICP elemental analysis, which als o showed 5326 ppm of Pb to be present in the sample, several orders of magnitude above the 1-12 ppm background levels observed in all other samples. This suggests a late “hydrothermal” fluid event
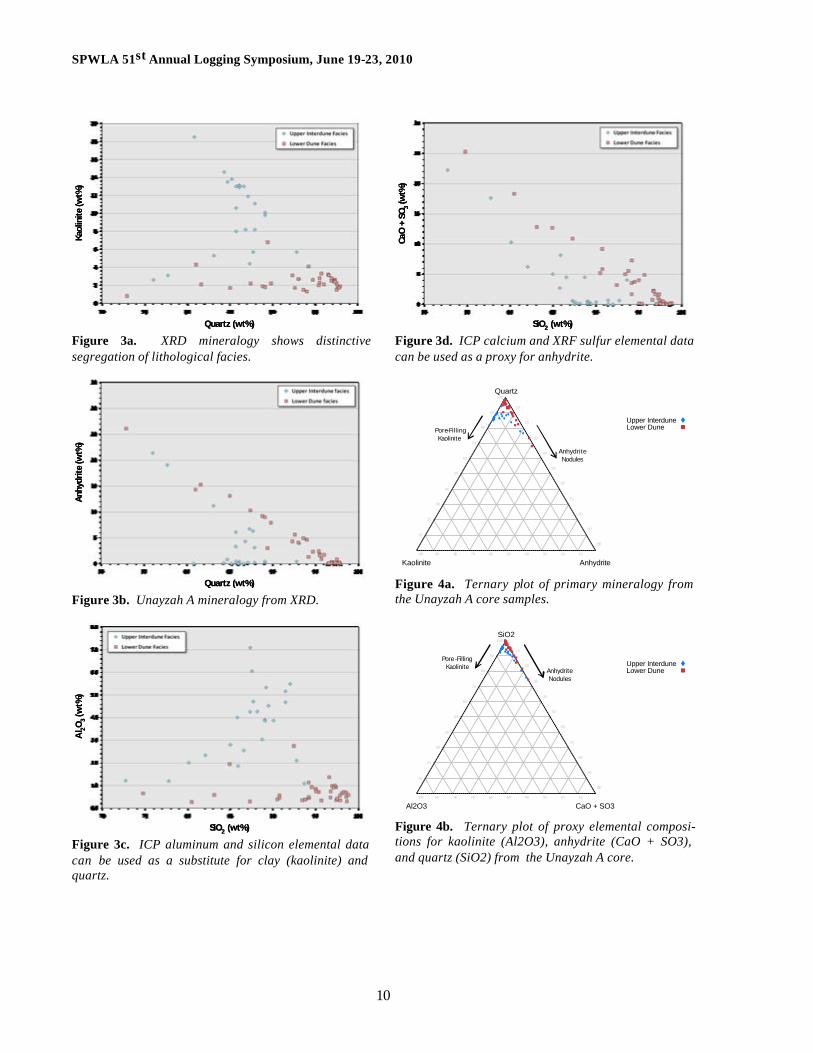
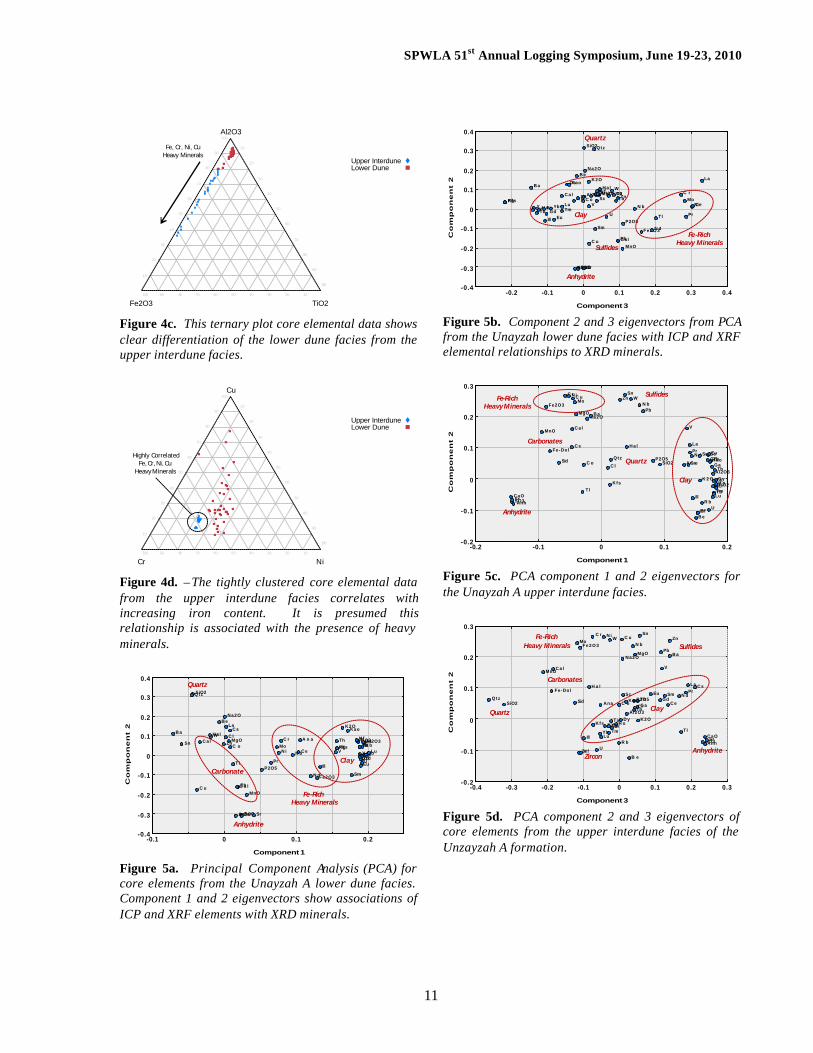
occurred in the reservoir, which may possibly have played a part in the generation of the bitumen previously noted. Eolian interdune and sandsheet facies – The upper 23 feet of the core is composed of very fine- to fined-grained sandstone and siltstone with horizontal planar and wavy laminations. Some ripple forms are present that suggest deposition from small ephemeral streams. This interval in the cored section is interpreted to represent eolian sand sheet and wet interdune deposits. As in the underlying dune facies, the composition of the interdune sandstones and siltstones is dominated by quartz grains and minor cement, present in amounts ranging from 76-94 wt%. Diagenetic kaolinite, however, is exceptionally abundant (2-19 wt%), and anhydrite occurs in variable amounts (0-22 wt%) as nodules and disseminated cement. Feldspars and lithic fragments are present in trace amounts, with illite, carbonate cement, and anatase each present in amounts of less than 1 wt%. Porosity in this segment is somewhat lower compared to the lower portion of the core except for a medium- to coarse-grained sandstone at the top of the core. Elemental relationships and mineralogy – Elemental analyses conducted for this study were in accord with XRD and log-derived mineralogy determinations. In addition, the elemental data was able to elucidate some subtle but important points that could not have been inferred from XRD and log data alone. XRD analyses indicates that the three primary mineralogical components predominate in both of the cored Unayzah A facies. These are quartz (grains with minor cement), kaolinite (as diagenetic pore-fillings), and anhydrite (as late nodular burial cement). Figures 3a and 3b show binary plots of mineralogy that document the variation observed in the core samples that is driven by these dominant minerals. Elemental data alone can be used as a proxy for the mineralogical relationships, as is shown in Figures 3c and 3d. The same is illustrated in a more efficient form in the ternary plots in Figure 4a and 4 b. Elemental data was also able to detect the presence of a major provenance change at the dune / interdune boundary. While this geochemical change may in part be facies-related, it is quite pronounced and unexpected in the context of the Unayzah A eolian depositional system. The kaolinite-rich sandstones of the upper interdune facies all contain minor but significant amounts of Fe2O3 (1-3 wt%), yet no Fe-dominant minerals were detected by XRD. More remarkably,
SPWLA 51st Annual Logging Symposium, June 19-23, 2010
4
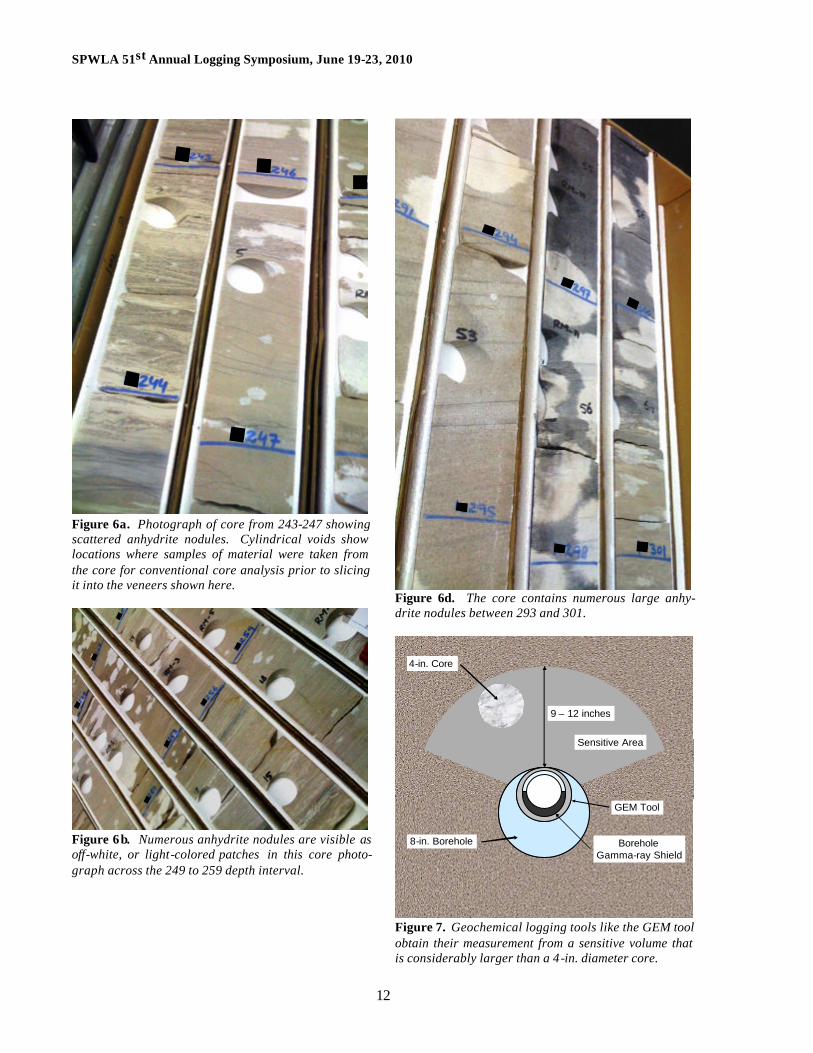
values for the trace metals Cr, Ni, and Cu are extremely high (Figure 4c), as are values of Zr. Fe2O3, Cr, Ni, and Cu are also seen to strongly co-vary (Figure 4d), and they have no significant relationship to clay content. This is difficult to explain unless heavy minerals of ultramafic affinity (e.g., chromite, chromian spinel, pyroxene) are present in the interdune samples. The nearest ultramafic provenance area for these minerals is quite likely from the west. The overall affinities and relationships of the elements to the minerals in both the dune and interdune facies is illustrated in the Principal Components Analysis plots shown in Figure 5. Within the three-dimensional space defined by eigenvectors (components) E1, E2, and E3, the proximity of elements and minerals indicates the strength of their relationship. Quartz, clay, and anhydrite, along with minor Fe-rich heavy minerals, carbonates, and sulfides, show logical relationships with their component elements. DISCUSSION Heterogeneity - The core veneer photographs presented in Figure 6 show randomly distributed anhydrite nodules throughout the cored interval that appear as light-colored, off-white patches. These nodules make it difficult to compare formation properties such as porosity, mineral composition, and elemental concentrations obtained from analysis of core material with values obtained from logging measurements purely on a quantitative basis. Logging measurements tend to homogenize formation properties because of their inherent volume -averaging responses. For example, outputs from geochemical logging tools like the new GEM tool (Galford, et al., 2009) are derived from a substantial formation volume as illustrated by the cartoon shown in Figure 7. The tool includes a borehole gamma ray shield designed to reduce undesirable signals from borehole materials. This borehole shield causes the tool to obtain the majority of its formation signal from a “fan-shaped” sensitive area (light brown shaded region in Figure 7) on the formation-facing side of the tool. As shown in the cross-sectional view, the tool’s sensitive area is several times greater than the cross-sectional area of a 4-in. diameter core. Results at a given depth are derived from data collected spanning approximately 4 feet of borehole length because of statistical filtering and tool movement at normal logging speeds of 15 ft/min. Thus, outputs from a logging tool like this represent a volume average several times larger than the entire amount of material usually recovered by coring.
In contrast, core analyses are normally carried out on localized, discrete volumes of formation material like the plugs that were cut from the core shown in Figure 6. In this study, 1ft veneers were taken, crushed, homogenized and measured to minimize the uncertainty of heterogeneity. Sampling of core material in this way cannot completely represent the formation on a larger scale comparable to volume of material sampled by certain logging instruments in heterogeneous rocks and care must be taken when comparing core- and log-derived formation properties in formations like the Unayzah A sandstone. That does not mean core analyses are without value in these conditions; to the contrary, they provide important information about the reservoir that can be valuable to deriving formation parameters from wireline logs. Alternative core material sampling procedures can be used to counteract the influences of heterogeneity in core-log comparisons. Visual examination techniques have been developed to quantify heterogeneity in terms of a length scale parameter, which can be used to suggest appropriate material sampling procedures (MacDonald, et al., 2009). In some instances, increased sampling of core plugs may be sufficient; in more extreme cases, homogenized material from core veneers is required. Wireline logs – Natural gamma ray and neutron-induced gamma ray spectroscopy logs were run in the well in addition to the standard quad-combo logging suite. Figure 8 displays the logs across the Unayzah A formation with a log-derived formation mineralogy and fluids analysis. Track I includes total gamma ray and gamma -ray equivalent of the radio activity from thorium and potassium. Both gamma ray curves are derived from a natural gamma -ray spectroscopy tool. Individual thorium, uranium and potassium concentra-tions from the natural gamma -ray spectroscopy tool are shown in Tracks II and III. Selected resistivity curves from the resistivity array tool are presented in Track IV. Presented in Track V is a photoelectric curve. Formation density and neutron porosity logs are displayed in Tracks V and VI. Dry rock elemental weight fractions from the GEM tool are shown in Track VII. Lithology and facies identifications from the cored interval are indicated in Tracks IX and X. A probabilistic error minimization approach was used to derive a mineral and fluids evaluation from the wireline density, neutron, resistivity, and geochemical logs. Various embodiments of probabilistic error minimization log interpretation programs have been available for several years from the service companies (Sibbit, 1980; Alberty, 1984; Quirein, 1986) and several of third-party software vendors. Theoretical log

SPWLA 51st Annual Logging Symposium, June 19-23, 2010
5
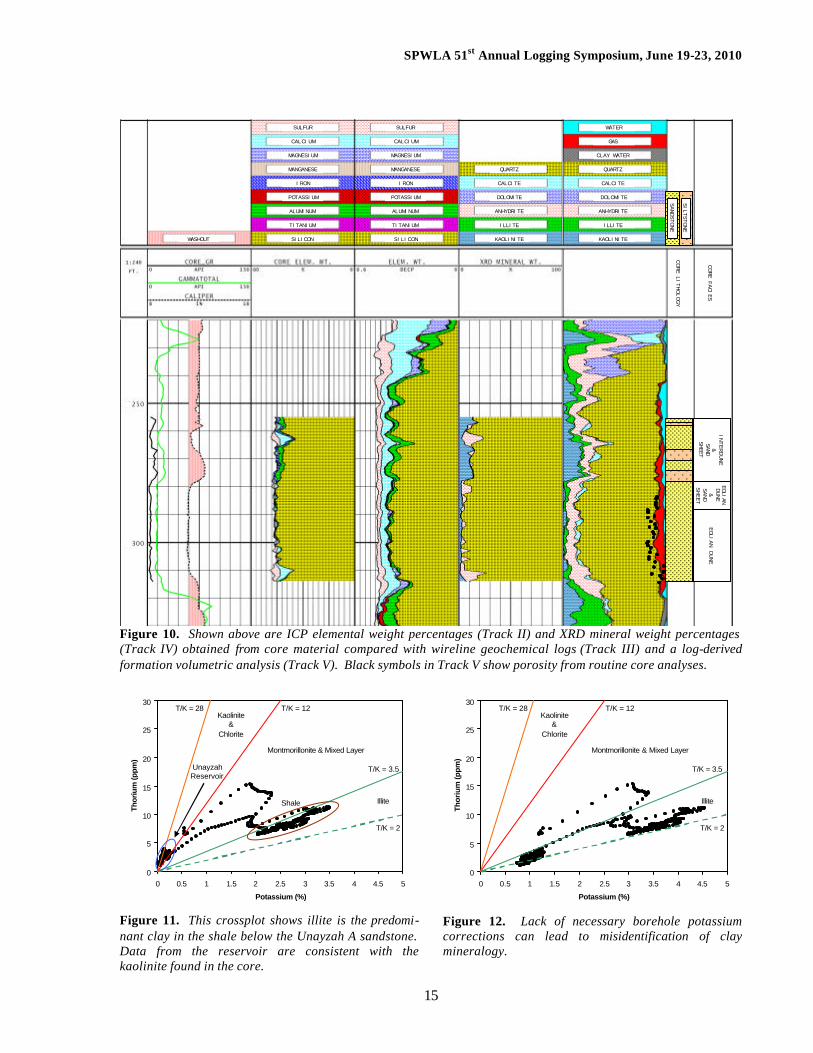
response equations are required for each sensor used to carry out the calculations in this technique. For this study, response equations were constructed in terms of formation mineral and fluid volumes and the response parameters for each constituent. Linear mixing laws were followed for most sensors but some, such as neutron and resistivity, involved more complicated non-linear functions. The idea was to solve the system of simultaneous theoretical tool response equations for the mineral and fluid volumes that gave the best match to the logs. Track VIII of Figure 8 shows log-derived formation mineral and fluid volumes. Quartz, calcite, anhydrite, kaolinite and illite minerals were included in the theoretical tool response equations for the Unayzah A reservoir based on the core XRD results. Clay-bound water, effective-porosity water and gas fluid volumes were also included in the response equations. Formation water resistivity for the resistivity response equation was chosen from an apparent water resistivity (Rwa) calculation done in a lower member of the Unayzah sandstone sequence; the Rwa value agreed closely with values calculated from chemical analyses performed on water samples that were recovered with a fluid sampling tool. The probabilistic error minimization process outputs reconstructed logs for each sensor that was used to obtain the solution. These diagnostic outputs are a useful aid to assess actual log quality and to validate the formation model. Figure 9 displays logs that were used to determine the mineralogy; actual logs are displayed as black curves and reconstructed logs are shown as red traces. Good agreement between the actual and reconstructed logs confirms the selected mineral suite accounts for the major minerals present in the reservoir. Figure 10 provides a side-by-side comparison of core and log-derived elemental concentrations as well as core and log-derived mineralogy and porosity. Elemental weight percentages from XRF measurements performed on core material and wireline geochemical logs appear in Tracks II and III, respectively. Mineral weight percentages from XRD analyses of core material are displayed in Track IV next to the log-derived formation mineral and fluid volume results. Porosity from routine core analyses appears as solid black symbols in Track V. Results from the wireline logs clearly identify a kaolinite-rich zone starting at the base of the interdune-sand sheet facies interval that was identified from the core. This zone is correlates with larger amounts of aluminum observed in the core elemental concentra-tions and larger occurrences of kaolinite in the XRD
mineral weight percentages. The log-derived interpre-tation also shows minor amounts of clay consisting of varying amounts of kaolinite and illite in the eolian dune facies which correspond to low clay content from the XRD analysis. Throughout the reservoir, results from the logs exhibit greater consistency in the amount of sulfur, calcium and anhydrite compared to values obtained from core analyses. The log-derived results reflect the large scale, or average, composition of the formation in this highly heterogeneous formation because they sample a larger volume of the rock. This influence is also apparent between the routine core analysis porosity values compared to the log-derived porosity. In most cases, core porosity values were obtained from plugs that were drilled in regions that avoided anhydrite nodules, therefore those results would be expected to give optimistic porosity values for the reservoir on average. The calculated effective-water volume (blue shaded region in Track V of Figure 10) increases abruptly at the bottom of the interdune-sand sheet facies and generally increases from that point upward to the top of the reservoir. This would normally indicate a greater potential for water production. Increased amounts of fine-grained material were observed in the upper portion of the core that could support increased irreducible water saturation in this interval. This hypothesis is supported by results from a drill stem test that confirmed the entire reservoir is at irreducible water saturation. It is believed that pore-lining kaolinte could also contribute to greater water retention in this zone. In this study, we were able to utilize the mineralogy information from the core XRD measurements to choose the suite of minerals used to interpret the logs. A review of elemental logs can be a valuable aid to selecting minerals for petrophysical interpretations in unknown situations or when core data is not available. Figure 11 shows a thorium-potassium crossplot from the Unayzah A interval. The data separate into two distinct clusters. Data from the reservoir has a thorium-to-potassium ratio ranging from 12 to 28 which is normally associated with kaolinite and chlorite clay minerals. A second cluster from the shale below the reservoir falls in the region normally linked to illite; a few points fall in the mixed layer region. Proper application of environmental corrections is important to using the thorium-potassium crossplot to identify clay minerals. A completely different interpre-tation of the clay mineralogy would be made as seen in Figure 12 if the correction for the 1.25% potassium concentration in the mud was not applied. Without the correction, data from the reservoir would be pushed

SPWLA 51st Annual Logging Symposium, June 19-23, 2010
6
into the illite region of the crossplot because of bias from the borehole potassium signal. Ternary plots of elemental concentrations also provide insight into mineralogy. The examples below confirm observations from the core data and illustrate how ternary plots can be used for mineral identification. Calcium, silicon and aluminum data from the GEM tool, displayed in Figure 13, show a well-defined trend along the aluminum axis and indicate the zone is predominantly comprised of quartz and clay minerals; a dense cluster near silicon fraction of 0.9 and calcium fraction of 0.1 is consistent with the quartz and anhydrite mixture visually observed in core material. While the data in Figure 13 is consistent with the observed anhydrite in the core, the plot isn’t definitive. Figure 14 is a plot of sulfur with silicon + aluminum, and calcium + magnesium that is designed to segregate clastics from carbonates and anhydrite. Clean and shaley sandstones will concentrate at the apex of this plot, calcite and dolomite formations will group near the lower left corner, and pure anhydrite will be found midway along the lower edge. The clear trend in the data from the clastic point in the direction of the anhydrite point makes an unambiguous case for the presence of anhydrite. A plot of potassium + iron, silicon, and aluminum exploits contrasts among clay mineral chemistry to give an independent identification of clays in sand-shale sequences. In Figure 15, the reservoir rock plots along the aluminum axis to indicate varying mixtures involving quartz and kaolinite, a separate grouping above the 0.9 silicon fraction line establishes illite as the dominant clay mineral in the shale. SUMMARY Core-to-log comparisons in heterogeneous formations can be challenging and the results can be dependent on the core material sampling protocol. It is necessary to resort to sampling methods aimed at placing core-derived elemental concentrations and mineralogy on a scale comparable to logs. An effort was made to homogenize the core material for this study. Given the random distribution of anhydrite nodules in the core, a larger portion of the core veneer may have given results that were more representative of the rock on average. Even so, logs will tend to provide a better representation of the reservoir when large scale heterogeneity exists such as in the Unayzah A forma-tion.
Proper application of environmental corrections is an important step in the workflow to obtain the best formation mineral evaluation from logs. For example, potassium is an important differentiator of mineralogy and bias from not applying corrections for borehole potassium can have a detrimental effect on results. Similarly, environmental effects on neutron logs can have an impact on porosity and mineralogy. Ternary plots of elemental data can be a used to identify or confirm the presence of various minerals. These plots can be especially useful in cases where XRD data from core samples are not available to help the log analyst in decide what minerals are important to petrophysical interpretations of logs. REFERENCES Afifi, A. M., 2005, “Ghawar: The Anatomy of the World’s Largest Oilfield,” American Association of Petroleum Geologists, Search and Discovery Article 20026, 25 January, 26. Al-Anazi, B. D., 2007, “What you know about the Ghawar Oil Field, Saudi Arabia?” CSEG Recorder, (April), 40-43. Alberty, M. and Hashmy, K., 1984, “Application of ULTRA to Log Analysis,” paper Z presented at the 25th Annual SPWLA Logging Symposium, New Orleans, LA, 10-13 June. Al-Husseini, M.I., 2004, “Pre-Unayzah Unconformity, Saudi Arabia,” GeoArabia Special Publication 3, Gulf PetroLink, Bahrain, 15-59. Galford, James, et al., 2009, “A New Neutron-Induced Gamma Ray Spectroscopy Tool for Geochemical Logging,” paper X presented at the 50th Annual SPWLA Logging Symposium, Houston, Texas, 21-24 June. MacDonald, Robin M., et al., 2009, “Effect of Carbonate Heterogeneity on Core – Log Integration,” paper 127290 presented at the Kuwait International Petroleum Conference and Exhibition, Kuwait City, Kuwait, 14-16 December. Mayer, C. and Sibbit, A., 1980, “GLOBAL A New Approach to Computer-Processed Log Interpretation,” paper 9341 presented at the 55th Annual Fall Meeting of Society of Petroleum Engineers of AIME, Dallas, TX, 21-24 September.
SPWLA 51st Annual Logging Symposium, June 19-23, 2010
7
McGillivray, J.G., and Husseini, M.I., 1992, “The Paleozoic Petroleum Geology of Central Arabia”, American Association of Petroleum Geologists Bulletin, 76, 1473-1490. Melvin, J. and Sprague, R., 2006, “Advances in Arabian Stratigraphy: Origin and Stratigraphic Architecture of Glaciogenic Sediments in Permian-Carboniferous Lower Unayzah Sandstones, Eastern Saudi Arabia,” GeoArabia, 11, 105-152. Ortensi, A., et al., 2008, “Sedimentology and Petrographic Study of the Upper Carboniferous-Lower Permian Unayzah Formation, Block C, Rub’ Al-Khali, Saudi Arabia”, paper 118400 presented at the 8th Middle East Geosciences Conference and Exhibition, Bahrain, 3-5 March. Price, R., et al., 2008, “Saudi Aramco Permian-Carboniferous (Unayzah) Stratigraphic Nomenclature of Saudi Arabia,” paper 118714 presented at the 8th Middle East Geosciences Conference and Exhibition, Bahrain, 3-5 March. Quirein, J., et al., 1986, “A Coherent Framework for Developing and Applying Multiple Formation Evaluation Models,” paper DD presented at the 27th Annual SPWLA Logging Symposium, Houston, Texas, 9-13, June. Raba’a, A., and Heine, C., 2006, “A Facies-Based Approach to Distribution of Petrophysical Properties in and Aeolian Sandstone Reservoir, Unayzah Formation, Saudi Arabia,” paper 102568 presented at the SPE Annual Technical Conference and Exhibition, San Antonio, TX, 24-27 September. Tourqui, H., 2009, “Sedimentology of SRYN-1 Core1,” Geological Technical Services Memorandum No. 352, Saudi Aramco, 28 April. Wender, J. N. J., et al., 1998, “Paleozoic (Pre -Khuff) Hydrocarbon Geology of the Ghawar Area, Eastern Saudi Arabia,” GeoArabia, 11, 273-302. ABOUT THE AUTHORS Robin MacDonald is a senior Petrophysicist and member of the Saudi Aramco’s Petrophysical Special Studies Group where he develops new and updates petrophysical models using the most current and technically advanced logging data techniques available. He graduated in 1979 from Dalhousie University with a Bachelor of Science degree in Engineering and then from the Technical University of Nova Scotia in 1982
with a degree in Mechanical Engineering. Prior to his 13-year career with Saudi Aramco, he worked for Schlumberger for 15 years in various assignments including Canada, Spain, the Netherlands, the United Kingdom, and Saudi Arabia. He was involved in the application and field test of the first generation gamma ray spectroscopy tools, GST, during the early 1980s in Canada. Douglas Hardman is a senior Petrophysicist with Saudi Arabian Oil Company. He is a licensed Professional Engineer and Geophysicist in the province of Alberta. He graduated from Lakehead University in Thunder Bay, Ontario in 1984 with a degree in Mechanical Engineering. He spent several years with Schlumberger Oilfield Services, having held various positions including, open and cased hole wireline engineer, technical staff engineer, sales engineer and district manager. He then spent 10 years at Petro-Canada Oil & Gas with responsibilities in formation evaluation in tight gas, conventional oil and tar sands in North America, Artic and Alaska regions. He has experience in mature basin development as well as exploration prospect generation and evaluation. He received the Vice President Award from the Canadian Well Logging Society (CWLS) for his presentation on “Enhanced Petrophysical Interpretation Utilizing Digital Sonic Shear and Stonely Wave Data” in 2005. He is a past Vice President of the CWLS and has been involved in APEGGA, SPWLA, CWLS and CSPG in numerous capacities. He is currently a petrophysical specialist for the Exploration Department of Saudi Aramco, supporting exploration prospect generation and integrated formation evaluation on operational exploration plays. Ronald Sprague is a geological specialist who for the last 7 years has been on Aramco’s Reservoir Characterization Gas Fields Special Studies Team, which characterizes the Pre-Khuff Paleozoic Unayzah and Jauf clastics gas reservoirs. He previously spent 11 years in oil and gas exploration and development geology, operations, and 3-D seismic interpretation in the Gulf of Mexico, onshore and offshore Texas and Louisiana, offshore Alaska, and the continental US for Phillips Petroleum in Houston. He later joined Sonat Exploration and Blue Dolphin Energy, then worked the deepwater Gulf of Mexico subsalt turbidite trend for Enterprise Oil and Shell, before joining Aramco in November 2002. Early in his career, Ron was a consulting geologist in the West Texas Pennsylvanian deltaic trend, and also acquired a background in 2-D and 3-D seismic data processing at Western Geophysical. Ron’s career interests are: biostratigraphy; sequence and seismic stratigraphy; core description, image log facies and seismic interpretation/integration;

SPWLA 51st Annual Logging Symposium, June 19-23, 2010
8
geologic modeling; and the influence of “sub-seismic” faulting on hydrocarbon reservoirs. He obtained a Biology degree with a double major in Geology from Rice University in Houston, a Geology degree from the University of Texas at Austin, and did graduate work in stable is otope geochemistry, foraminiferal and nannofossil paleontology applied to glacial meltwater studies at Texas A&M University. Ron is a member of AAPG and the Dhahran Geoscience Society. Yacine Meridji is a Petroleum Engineer in the Exploration Petrophysical Unit of Saudi Aramco. He currently oversees petrophysical formation evaluation of exploration wells. Before joining Aramco in 2008 he was a General Field Engineer with Baker Atlas Wireline Services in the Gulf Of Mexico. He holds an electrical engineering degree from the National Institute Of Electricity and Electronics Algeria. Witjaksono Mudjionomulyo is a Senior Petroleum Engineer with Saudi Aramco in the Reservoir Description Division in Dhahran, Saudi Arabia. He graduated from the Institute Technology of Bandung, Indonesia with a BSc degree in civil engineering in 1980. He joined Saudi Aramco in 2007, where he specializes in wireline and logging while drilling open hole log interpretation, applications, and logging operations. Previously he worked for Schlumberger in various field operations, technical support, and formation evaluation interpretation assignments. During his 26 year tenure with Schlumberger, he worked in a number of international locations. James Galford is a Chief Scientific Advisor in the LWD & WL Sensor Physics group at Halliburton. Previously, he worked on nuclear magnetic resonance (NMR) petrophysical applications and interpretation. He holds a BS degree in physics from West Virginia University. He has written several technical papers on various logging applications for conventional nuclear and magnetic resonance imaging logs. In addition, he has contributed to a number of patents related to conventional nuclear logging methods and NMR logging applications. He is a member of the Society of Petrophysicists and Well Log Analysts and the Society of Petroleum Engineers. Marvin Rourke is a Senior Technical Manager with Halliburton Wireline in Saudi Arabia. Marvin received a BSc degree in cybernetics from Reading University, UK in 1988 and joined Halliburton (formerly Gearhart International) as a logging engineer. He has held various operational and technical positions within Halliburton and currently provides technical support for wireline services in Saudi Arabia. As a member of the Society of Petrophysicists and Well Log Analysts and
the Society of Petroleum Engineers, Marvin has authored numerous technical papers with both societies. Michael Dix received a BS degree in geology from the University of Dayton (USA) and has over 25 years of experience working in clastic petrology, reservoir geology, fracture analysis, and elemental geochemistry. He worked for Core Laboratories, the University of Houston, Westport Technology Center, and Halliburton before joining Chemostrat International Ltd. in 2009. Mike first became interested in using elemental data in the early 1990s as a tool for improving provenance studies. For the last 10 years, he has focused on applying chemostratigraphy and elemental FE to better understand sandstone, carbonate, and now shale reservoir sequences. At Chemostrat, Mike is primarily responsible for Middle East studies, European gas shale studies, and new shale applications for elemental data. Michael Kelton is a Senior Staff Geologist and XRD Mineralogist with Core Laboratories’ Advanced Technology Center in Houston, Texas. Since joining Core Laboratories in 2000, he has been responsible for XRD laboratory operations in Houston as well as training and support for other XRD facilities in North America and overseas. Previously he was a Senior Research Geologist with ARCO Research (Plano, Texas), and a Research Associate with Getty Oil Research Center (Houston). He holds a BS in Geology from Ohio University (1981) and was certified in Geotechnical/Environmental Applications by Brook-haven College in 1993. He has published papers in the fields of clastic petrology/diagenesis, quantitative X-ray mineral analysis, and applications of clay mineralogy to petrophysics and well log interpretations.

SPWLA 51st Annual Logging Symposium, June 19-23, 2010
9
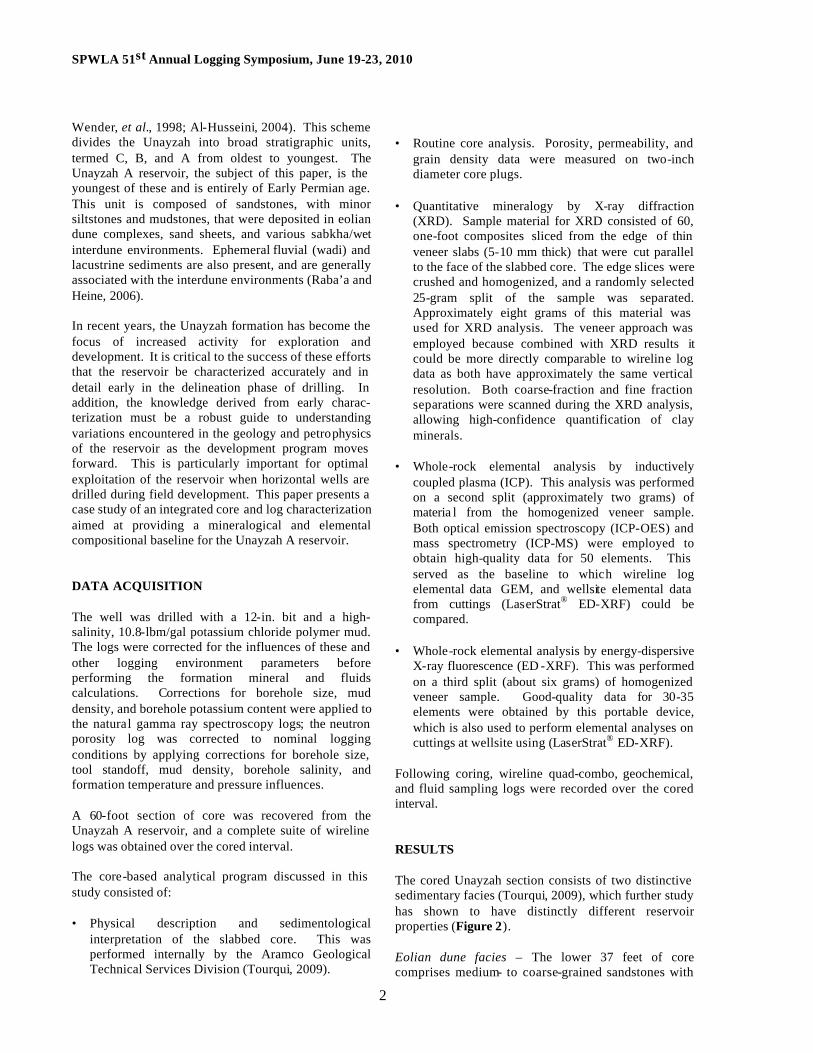
Figure 1a. Paleozoic stratigraphic column and Wheeler diagram (after Afifi, 2005).
ArabianShield
Dominant wind direction Dunefields
Oman
Yemen
Saudi Arabia
Qatar
Gulf of Oman
Gulf of Aden
Red Sea
Erosion or
nondeposition
Arabian-Persian
Gulf
N
ArabianShield
Dominant wind direction Dunefields
Oman
Yemen
Saudi Arabia
Qatar
Gulf of Oman
Gulf of Aden
Red Sea
Erosion or
nondeposition
Arabian-Persian
Gulf
Arabian-Persian
Gulf
N
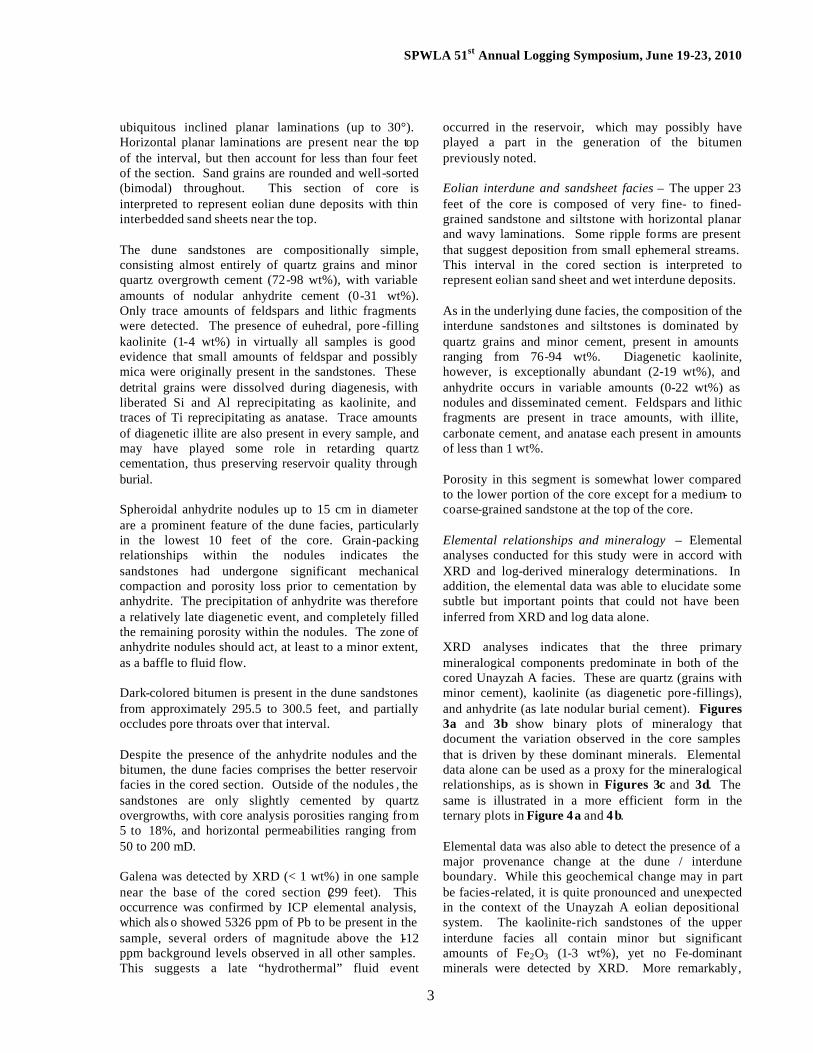
Figure 1b. The yellow area shows the location of known Unayzah A dune fields; modified after Al-Anazi, 2007
Interdune
Eolian dune
Sand sheet&
Eolian dune
Interdune&
Sand sheet
Grain Size /SedimentaryStructures Li
thol
ogy
DepositionalEnvironment
Interdune
Eolian dune
Sand sheet&
Eolian dune
Interdune&
Sand sheet
Grain Size /SedimentaryStructures Li
thol
ogy
DepositionalEnvironment
Interdune
Eolian dune
Sand sheet&
Eolian dune
Interdune&
Sand sheet
Grain Size /SedimentaryStructures Li
thol
ogy
DepositionalEnvironment
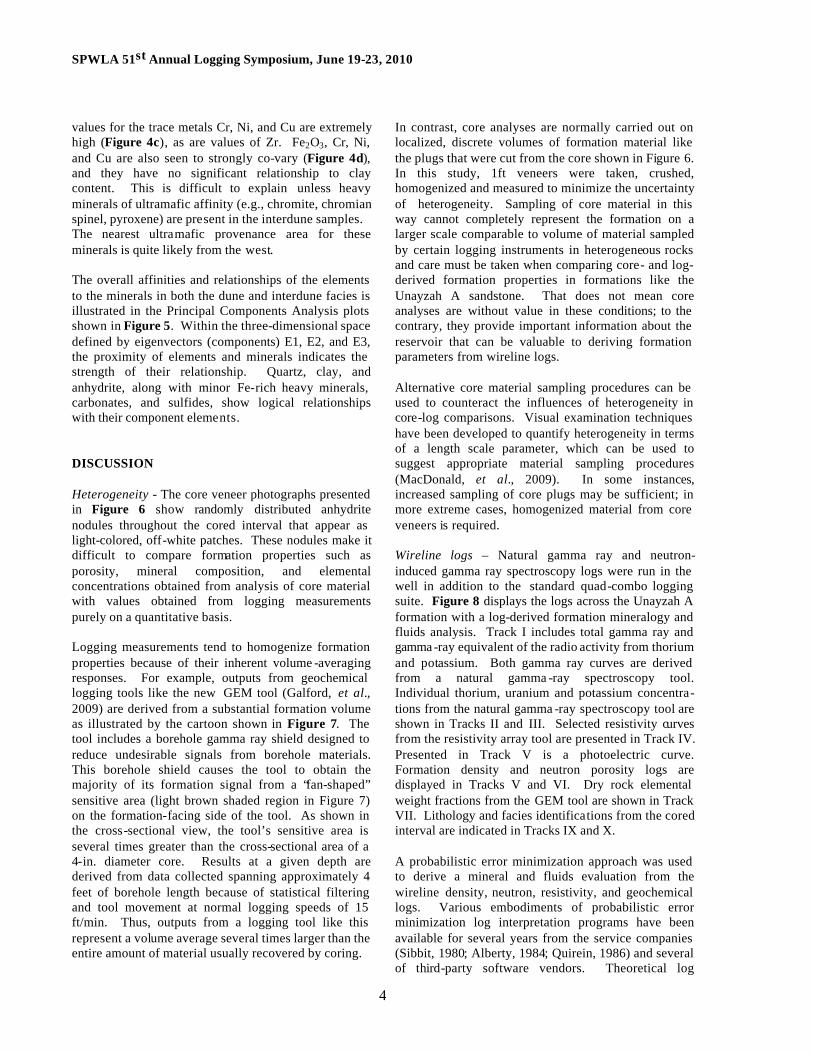
Figure 2. Unayzah facies and sedimentary description from the cored interval. Core photographs show bedding features associated with the eolian dune and interdune depositional environments.
WEST EAST
SPWLA 51st Annual Logging Symposium, June 19-23, 2010
10
Quartz (wt%)
Kaol
inite
(wt%
)
Quartz (wt%)
Kaol
inite
(wt%
)
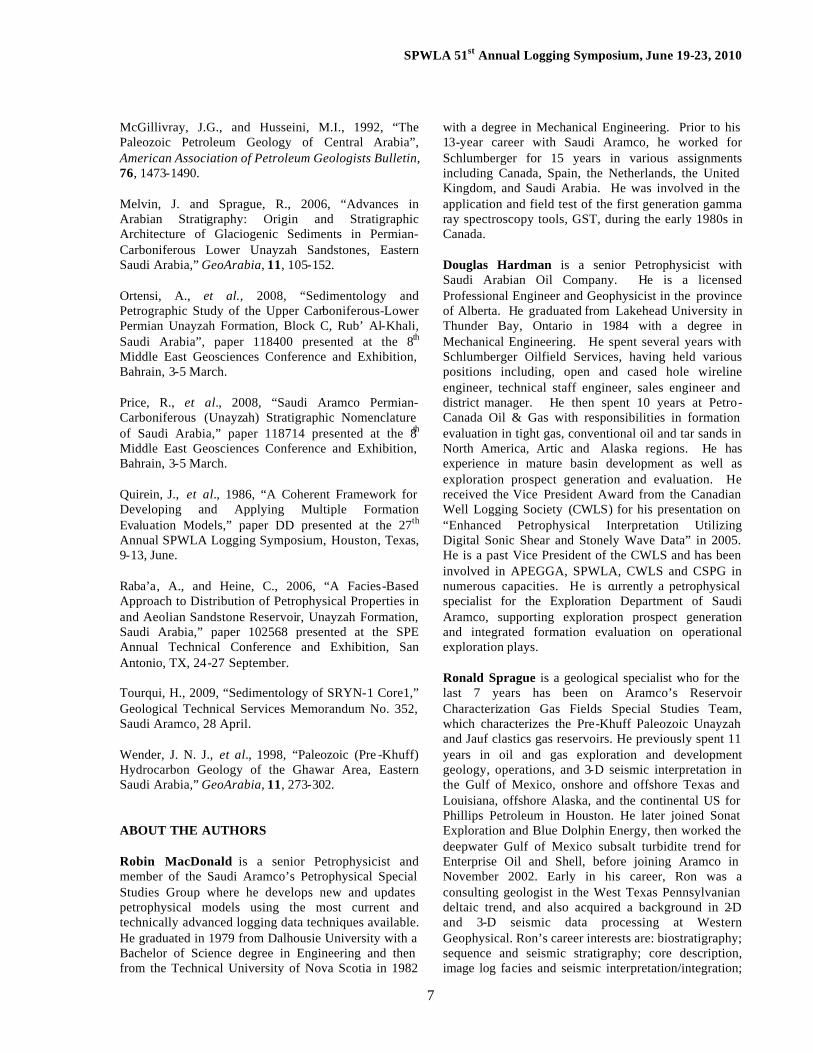
Figure 3a. XRD mineralogy shows distinctive segregation of lithological facies.
Quartz (wt%)
Anhy
drite
(wt%
)
Quartz (wt%)
Anhy
drite
(wt%
)
Figure 3b. Unayzah A mineralogy from XRD.
SiO2 (wt%)
Al 2O
3(w
t%)
SiO2 (wt%)
Al 2O
3(w
t%)
Figure 3c. ICP aluminum and silicon elemental data can be used as a substitute for clay (kaolinite) and quartz.
SiO2 (wt%)
CaO
+ S
O 3(w
t%)
SiO2 (wt%)
CaO
+ S
O 3(w
t%)
Figure 3d. ICP calcium and XRF sulfur elemental data can be used as a proxy for anhydrite.
100
90
80
70
60
50
40
30
20
10
100
90
80
70
60
50
40
30
20
10
100 90 80 70 60 50 40 30 20 10
Quartz
Kaolinite Anhydrite
tt
t
tt
t
t
tt
t
ttt tttttttttt
tn
n
nnnn
nnn nnnnnnn
nnnnnn
n
nn
nn
n
nn
n
n
n
nn
n
Upper Interdune tLower Dune n
AnhydriteNodules
Pore-FillingKaolinite
100
90
80
70
60
50
40
30
20
10
100
90
80
70
60
50
40
30
20
10
100 90 80 70 60 50 40 30 20 10
Quartz
Kaolinite Anhydrite
tt
t
tt
t
t
tt
t
ttt tttttttttt
tn
n
nnnn
nnn nnnnnnn
nnnnnn
n
nn
nn
n
nn
n
n
n
nn
n
Upper Interdune tLower Dune n
AnhydriteNodules
Pore-FillingKaolinite
Figure 4a. Ternary plot of primary mineralogy from the Unayzah A core samples.
100
90
80
70
60
50
40
30
20
10
100
90
80
70
60
50
40
30
20
10
100 90 80 70 60 50 40 30 20 10
SiO2
Al2O3 CaO + SO3
ttt tt
t
t
t
t
t
ttt tttttttttt tn
n
nnnn
nnnn
nnnnnn
nnnnnn
n
nn
nn
n
n
n
n
n
n
nn
n
Upper Interdune tLower Dune nAnhydrite
Nodules
Pore -FillingKaolinite
100
90
80
70
60
50
40
30
20
10
100
90
80
70
60
50
40
30
20
10
100 90 80 70 60 50 40 30 20 10
SiO2
Al2O3 CaO + SO3
ttt tt
t
t
t
t
t
ttt tttttttttt tn
n
nnnn
nnnn
nnnnnn
nnnnnn
n
nn
nn
n
n
n
n
n
n
nn
n
Upper Interdune tLower Dune nAnhydrite
Nodules
Pore -FillingKaolinite
Figure 4b. Ternary plot of proxy elemental composi-tions for kaolinite (Al2O3), anhydrite (CaO + SO3), and quartz (SiO2) from the Unayzah A core.
SPWLA 51st Annual Logging Symposium, June 19-23, 2010
11
100
90
80
70
60
50
40
30
20
10
100
90
80
70
60
50
40
30
20
10
100 90 80 70 60 50 40 30 20 10
Al2O3
Fe2O3 TiO2
t
t
t
tt
t
tt
t
tt
t
t
t
t
tt
t
t
tt
t
t
t
nn
nnnnnnn
n
nnnnnnnnnnnnnnnnnnnnnn
n n
nn
Upper Interdune tLower Dune n
Fe, Cr, Ni, CuHeavy Minerals
100
90
80
70
60
50
40
30
20
10
100
90
80
70
60
50
40
30
20
10
100 90 80 70 60 50 40 30 20 10
Al2O3
Fe2O3 TiO2
t
t
t
tt
t
tt
t
tt
t
t
t
t
tt
t
t
tt
t
t
t
nn
nnnnnnn
n
nnnnnnnnnnnnnnnnnnnnnn
n n
nn
Upper Interdune tLower Dune n
Fe, Cr, Ni, CuHeavy Minerals
Figure 4c. This ternary plot core elemental data shows clear differentiation of the lower dune facies from the upper interdune facies.
100
90
80
70
60
50
40
30
20
10
100
90
80
70
60
50
40
30
20
10
100 90 80 70 60 50 40 30 20 10
Cu
Cr Ni
tttttttttttttttttttt
tttt
nn
n
n
n
n
n
nn
n
n
n
n
n
n
n
n
n
nnn
n
n
n
nn
n
n
nn
n
n
n
n
n
n
Upper Interdune tLower Dune n
Highly CorrelatedFe, Cr, Ni, Cu
Heavy Minerals
100
90
80
70
60
50
40
30
20
10
100
90
80
70
60
50
40
30
20
10
100 90 80 70 60 50 40 30 20 10
Cu
Cr Ni
tttttttttttttttttttt
tttt
nn
n
n
n
n
n
nn
n
n
n
n
n
n
n
n
n
nnn
n
n
n
nn
n
n
nn
n
n
n
n
n
n
Upper Interdune tLower Dune n
Highly CorrelatedFe, Cr, Ni, Cu
Heavy Minerals
Figure 4d. –The tightly clustered core elemental data from the upper interdune facies correlates with increasing iron content. It is presumed this relationship is associated with the presence of heavy minerals.
-0.4
-0.3
-0.2
-0.1
0
0.1
0.2
0.3
0.4
-0.1 0 0.1 0.2
SiO2
TiO2 Al2O3
Fe2O3
MnO
MgO
C a O
Na2O
K 2 O
P2O5
SO3
C l
B e
Sc V
C r
C o N i
C u
Zn Ga R b
Sr
Y
Zr
N b
Mo Sn
C s B a
La
C e
Pr
N d Sm
Eu Gd Tb
D y H o Er Tm Yb Lu
H f
Ta
W
Tl
Pb
Th
U
Qtz
Plg K fs
Ill
Kao
C a l
Anh
G a l
H a l A n a
Principal Components Analysis
Component 1
Co
mp
on
en
t 2
Anhydrite
Quartz
ClayCarbonate
Fe-RichHeavy Minerals
Figure 5a. Principal Component Analysis (PCA) for core elements from the Unayzah A lower dune facies. Component 1 and 2 eigenvectors show associations of ICP and XRF elements with XRD minerals.
-0.4
-0.3
-0.2
-0.1
0
0.1
0.2
0.3
0.4
-0.2 -0.1 0 0.1 0.2 0.3 0.4
SiO2
TiO2 Al2O3
F e 2 O 3
MnO
MgO
C a O
Na2O
K 2 O
P2O5
SO3
C l
B e
Sc V
C r
C o N i
C u
Zn Ga R b
Sr
Y
Zr
N b
Mo Sn
C s B a
La
C e
Pr
N d Sm
Eu Gd Tb
D y H o Er Tm Yb Lu
H f
Ta
W
Tl
Pb
Th
U
Qtz
Plg K fs
Ill
Kao
C a l
Anh
Ga l
H a l Ana
Principal Components Analysis
Component 3
Co
mp
on
en
t 2
Anhydrite
Quartz
Clay
Sulfides
Fe-RichHeavy Minerals
Figure 5b. Component 2 and 3 eigenvectors from PCA from the Unayzah lower dune facies with ICP and XRF elemental relationships to XRD minerals.
-0.2
-0.1
0
0.1
0.2
0.3
-0.2 -0.1 0 0.1 0.2
SiO2
TiO2
Al2O3
Fe2O3
MnO
MgO
C a O
Na2O
K 2 O
P2O5
SO3
C l
B e
Sc
V
C r
C o
N i C u Zn
Ga
R b Sr
Y
Zr
N b Mo
Sn
C s
B a
La
C e
Pr N d Sm Eu
Gd
Tb
D y H o Er
Tm Yb Lu
H f
Ta
W
Tl
Pb
Th
U
Qtz
K fs
Ill
Kao
C a l
Fe-Dol
Sid
Anh
H a l
Ana
Principal Components Analysis
Component 1
Co
mp
on
en
t 2
Anhydrite
Quartz
Clay
Fe-RichHeavy Minerals
Sulfides
Carbonates
Figure 5c. PCA component 1 and 2 eigenvectors for the Unayzah A upper interdune facies.
-0.2
-0.1
0
0.1
0.2
0.3
-0.4 -0.3 -0.2 -0.1 0 0.1 0.2 0.3
SiO2
TiO2
Al2O3
F e 2 O 3
MnO
MgO
C a O
Na2O
K 2 O
P2O5
SO3
C l
B e
Sc
V
C r
C o
N i C u Zn
Ga
R b Sr
Y
Zr
N b Mo
Sn
C s
B a
La
C e
Pr N d Sm Eu
Gd
Tb
D y H o
Er Tm Yb
Lu
H f
Ta
W
Tl
Pb
Th
U
Qtz
K fs
Ill
K a o
C a l
Fe-Dol
Sid
Anh
H a l
Ana
Principal Components Analysis
Component 3
Co
mp
on
en
t 2
Anhydrite
Quartz Clay
Fe-RichHeavy Minerals
Carbonates
Zircon
Sulfides
Figure 5d. PCA component 2 and 3 eigenvectors of core elements from the upper interdune facies of the Unzayzah A formation.
SPWLA 51st Annual Logging Symposium, June 19-23, 2010
12
Figure 6a. Photograph of core from 243-247 showing scattered anhydrite nodules. Cylindrical voids show locations where samples of material were taken from the core for conventional core analysis prior to slicing it into the veneers shown here.
Figure 6b. Numerous anhydrite nodules are visible as off-white, or light-colored patches in this core photo-graph across the 249 to 259 depth interval.
Figure 6d. The core contains numerous large anhy-drite nodules between 293 and 301.
4-in. Core
GEM Tool
8-in. Borehole
9 – 12 inches
Sensitive Area
BoreholeGamma-ray Shield
4-in. Core
GEM Tool
8-in. Borehole
9 – 12 inches
Sensitive Area
BoreholeGamma-ray Shield
Figure 7. Geochemical logging tools like the GEM tool obtain their measurement from a sensitive volume that is considerably larger than a 4-in. diameter core.

SPWLA 51st Annual Logging Symposium, June 19-23, 2010
13
WASHOUT SILICON
TITANIUM
ALUMINUM
POTASSIUM
IRON
MANGANESE
MAGNESIUM
CALCIUM
SULFUR
SANDSTONE
SILTSTONE
KAOLINITE
CORE LITHOLOGY
CORE FACIES
ILLITE
ANHYDRITE
DOLOMITE
CALCITE
QUARTZ
CLAY WATER
GAS
WATER
EOLIAN DUNE
EOLIANDUNE
&SAND
SHEET
INTERDUNE
&SANDSHEET
WASHOUTWASHOUT SILICON
TITANIUM
ALUMINUM
POTASSIUM
IRON
MANGANESE
MAGNESIUM
CALCIUM
SULFUR
SILICON
TITANIUM
ALUMINUM
POTASSIUM
IRON
MANGANESE
MAGNESIUM
CALCIUM
SULFUR
SANDSTONE
SILTSTONE
KAOLINITE
CORE LITHOLOGY
CORE FACIES
ILLITE
ANHYDRITE
DOLOMITE
CALCITE
QUARTZ
CLAY WATER
GAS
WATER
EOLIAN DUNE
EOLIANDUNE
&SAND
SHEET
INTERDUNE
&SANDSHEET
SANDSTONE
SILTSTONE
SANDSTONE
SILTSTONE
KAOLINITE
CORE LITHOLOGY
CORE FACIES
ILLITE
ANHYDRITE
DOLOMITE
CALCITE
QUARTZ
CLAY WATER
GAS
WATER
EOLIAN DUNE
EOLIANDUNE
&SAND
SHEET
INTERDUNE
&SANDSHEET
EOLIAN DUNE
EOLIANDUNE
&SAND
SHEET
INTERDUNE
&SANDSHEET
EOLIAN DUNE
EOLIANDUNE
&SAND
SHEET
INTERDUNE
&SANDSHEET
Figure 8. Wireline triple combo and natural gamma ray spectroscopy logs from the Unayzah A formation are shown in Tracks I – VI. Elemental concentrations from neutron-induced gamma ray spectroscopy are displayed in Track VII. Presented in Track VIII are the mineral and fluids volumetric results obtained from an error minimization interpretation. Lithology and facies identifications from the cored interval are presented in the far right-hand tracks.

SPWLA 51st Annual Logging Symposium, June 19-23, 2010
14
Figure 9. Good agreement between theoretical logs output from the probabilistic error minimization procedure, shown in red, and actual logs used to determine the mineralogy, displayed as black curves, confirms the minerals selected for the interpretation account for the major minerals present in the reservoir.
SPWLA 51st Annual Logging Symposium, June 19-23, 2010
15
SILICON
TITANIUM
ALUMINUM
POTASSIUM
IRON
MANGANESE
MAGNESIUM
CALCIUM
SULFUR
KAOLINITE
ILLITE
ANHYDRITE
DOLOMITE
CALCITE
QUARTZ
SANDSTONE
SILTSTONE
KAOLINITE
CORE LITHOLOGY
CORE FACIES
ILLITE
ANHYDRITE
DOLOMITE
CALCITE
QUARTZ
CLAY WATER
GAS
WATER
EOLIAN DUNE
EOLIANDUNE&
SANDSHEET
INTERDUNE
&SANDSHEET
SILICON
TITANIUM
ALUMINUM
POTASSIUM
IRON
MANGANESE
MAGNESIUM
CALCIUM
SULFUR
WASHOUT SILICON
TITANIUM
ALUMINUM
POTASSIUM
IRON
MANGANESE
MAGNESIUM
CALCIUM
SULFUR
KAOLINITE
ILLITE
ANHYDRITE
DOLOMITE
CALCITE
QUARTZ
SANDSTONE
SILTSTONE
KAOLINITE
CORE LITHOLOGY
CORE FACIES
ILLITE
ANHYDRITE
DOLOMITE
CALCITE
QUARTZ
CLAY WATER
GAS
WATER
EOLIAN DUNE
EOLIANDUNE&
SANDSHEET
INTERDUNE
&SANDSHEET
SILICON
TITANIUM
ALUMINUM
POTASSIUM
IRON
MANGANESE
MAGNESIUM
CALCIUM
SULFUR
WASHOUT SILICON
TITANIUM
ALUMINUM
POTASSIUM
IRON
MANGANESE
MAGNESIUM
CALCIUM
SULFUR
SILICON
TITANIUM
ALUMINUM
POTASSIUM
IRON
MANGANESE
MAGNESIUM
CALCIUM
SULFUR
KAOLINITE
ILLITE
ANHYDRITE
DOLOMITE
CALCITE
QUARTZ
KAOLINITE
ILLITE
ANHYDRITE
DOLOMITE
CALCITE
QUARTZ
SANDSTONE
SILTSTONE
KAOLINITE
CORE LITHOLOGY
CORE FACIES
ILLITE
ANHYDRITE
DOLOMITE
CALCITE
QUARTZ
CLAY WATER
GAS
WATER
EOLIAN DUNE
EOLIANDUNE&
SANDSHEET
INTERDUNE
&SANDSHEET
SANDSTONE
SILTSTONE
SANDSTONE
SILTSTONE
KAOLINITE
CORE LITHOLOGY
CORE FACIES
ILLITE
ANHYDRITE
DOLOMITE
CALCITE
QUARTZ
CLAY WATER
GAS
WATER
EOLIAN DUNE
EOLIANDUNE&
SANDSHEET
INTERDUNE
&SANDSHEET
EOLIAN DUNE
EOLIANDUNE&
SANDSHEET
INTERDUNE
&SANDSHEET
EOLIAN DUNE
EOLIANDUNE&
SANDSHEET
INTERDUNE
&SANDSHEET
SILICON
TITANIUM
ALUMINUM
POTASSIUM
IRON
MANGANESE
MAGNESIUM
CALCIUM
SULFUR
WASHOUT SILICON
TITANIUM
ALUMINUM
POTASSIUM
IRON
MANGANESE
MAGNESIUM
CALCIUM
SULFUR
WASHOUT
Figure 10. Shown above are ICP elemental weight percentages (Track II) and XRD mineral weight percentages (Track IV) obtained from core material compared with wireline geochemical logs (Track III) and a log-derived formation volumetric analysis (Track V). Black symbols in Track V show porosity from routine core analyses.
0
5
10
15
20
25
30
0 0.5 1 1.5 2 2.5 3 3.5 4 4.5 5
Potassium (%)
Thor
ium
(ppm
)
T/K = 12
T/K = 3.5
T/K = 2
T/K = 28Kaolinite
&Chlorite
Montmorillonite & Mixed Layer
IlliteShale
UnayzahReservoir
Figure 11. This crossplot shows illite is the predomi-nant clay in the shale below the Unayzah A sandstone. Data from the reservoir are consistent with the kaolinite found in the core.
0
5
10
15
20
25
30
0 0.5 1 1.5 2 2.5 3 3.5 4 4.5 5
Potassium (%)
Th
ori
um
(pp
m)
T/K = 12
T/K = 3.5
T/K = 2
T/K = 28Kaolinite
&Chlorite
Montmorillonite & Mixed Layer
Illite
Figure 12. Lack of necessary borehole potassium corrections can lead to misidentification of clay mineralogy.

SPWLA 51st Annual Logging Symposium, June 19-23, 2010
16
0.9
1
0.8
0.7
0.6
0.5
0.4
0.3
0.2
0.1
0
0% 10% 20% 30% 40% 50% 60% 70% 80% 90% 100%
1
0.9
0.8
0.7
0.6
0.5
0.4
0.3
0.2
0.1
0
Chlorite
Montmorillonite
Illite
Kaolinite
Quartz
Carbonates & Anhydrite
Al
Ca
Si
Figure 13. A ternary plot of calcium, silicon and aluminum easily differentiates sandstones from carbon-ates and anhydrite.
0.9
1
0.8
0.7
0.6
0.5
0.4
0.3
0.2
0.1
0
0% 10% 20% 30% 40% 50% 60% 70% 80% 90% 100%
1
0.9
0.8
0.7
0.6
0.5
0.4
0.3
0.2
0.1
0
Mg Chlorite
Iron ChloriteIllite
Pyrite
Clastics
Carbonates Anhydrite
Ca +
Mg
S
Si + Al
Figure 14. A ternary plot of sulfur, silicon + aluminum, and calcium + magnesium improves the separation between clastics, carbonates and anhydrite.
0
0.1
0.2
0.3
0.4
0.5
0.6
0.7
0.8
1
0.9
100%90%80%70%60%50%40%30%20%10%0%0
0.1
0.2
0.3
0.4
0.5
0.6
0.7
0.8
0.9
1Quartz
K Feldspar
Kaolinite
Biotite
Illite
Muscovite
Chlorite
Al
K + Fe
Si
Shale
Unayzah Reservoir
Figure 15. The plot above provides an independent confirmation the dominant clay in the reservoir is kaolinite and illite is the predominant clay in the shale below the reservoir.