using direct and indirect measurements of leaf area index
TRANSCRIPT
Using direct and indirect measurements of leaf area index to
characterize the shrub canopy in an ombrotrophic peatland
O. Sonnentag a,*, J. Talbot b,1, J.M. Chen a,2, N.T. Roulet b,1
a University of Toronto, Department of Geography and Planning, St. George Campus, Sidney Smith Hall,
100 St. George St., Room 5047, Toronto, Ont. M5S 3G3, Canadab McGill University, Department of Geography, Burnside Hall, 805 Sherbrooke West, Room 705, Montreal, Que. H3A 2K6, Canada
Received 29 August 2006; received in revised form 10 January 2007; accepted 2 March 2007
Abstract
Leaf area index (LAI) is an important ecological parameter that characterizes the interface between a vegetation canopy and the
atmosphere. Indirect measurements of LAI using optical techniques such as the LAI-2000 plant canopy analyzer have been
routinely conducted for different vegetation canopies including forests and agricultural crops. However, little attention has been
paid to shrub canopies of peatlands, where microtopography presents an additional challenge in the optical measurement of shrub
LAI. Based on an established equation for boreal forest canopies to derive LAI from ‘‘effective’’ LAI obtained from the LAI-2000
instrument, we evaluated the overall performance of this indirect measurement technique by comparing it with destructive sampling
results for the shrub canopy of a precipitation-fed (ombrotrophic) peatland near Ottawa, Ontario, Canada. Under the assumption of
no foliage clumping in the shrub canopy, we demonstrate that the contribution of woody canopy elements to light interception has to
be taken into account. For this purpose, we determined species-specific woody-to-total area ratios for the five major shrub species.
Furthermore, we evaluated the combined effect of microtopographic position of the measurement location and multiple light
scattering within the shrub canopy on the measurements. Taking both the contribution of woody canopy elements to light
interception and the combined effect of microtopography and multiple light scattering into account, the agreement between direct
and indirect measurements of shrub LAI is good (R2 = 0.74), and intercept and slope of the linear correlation are not significantly
different from 0 ( p = 0.3575) and 1 ( p = 0.7489), respectively. The indirect approach refined through this study provides a reliable
method for quick measurements of shrub LAI in ombrotrophic peatlands.
# 2007 Elsevier B.V. All rights reserved.
Keywords: Leaf area index; Shrubs; Peatlands; Direct measurement; LAI-2000; Microtopography; Multiple light scattering
www.elsevier.com/locate/agrformet
Agricultural and Forest Meteorology 144 (2007) 200–212
1. Introduction
Peatlands are wetlands that accumulate partially
decayed plant matter in the form of peat, with bogs and
* Corresponding author. Tel.: +1 416 946 7715;
fax: +1 416 946 3886.
E-mail address: [email protected] (O. Sonnentag).1 Tel.: +1 514 398 4111; fax: +1 514 398 7437.2 Tel.: +1 416 946 7715; fax: +1 416 946 3886.
0168-1923/$ – see front matter # 2007 Elsevier B.V. All rights reserved.
doi:10.1016/j.agrformet.2007.03.001
fens as the most common types (Wheeler and Proctor,
2000). Bogs are precipitation-fed (ombrotrophic) and
generally lack any other hydrological inputs, resulting
in acidic and nutrient-poor conditions. Fens receive, in
addition to precipitation, hydrological inputs from their
surrounding mineral uplands in the form of surface and
subsurface flow (minerotrophic). As a result, fens,
commonly subdivided into poor and rich fens, are less
acidic and nutrient-rich peatlands. While peatlands
cover only 3% of the terrestrial land surface (Maltby
and Immirzi, 1993), they are an extensive component of

O. Sonnentag et al. / Agricultural and Forest Meteorology 144 (2007) 200–212 201
the boreal and subarctic ecozones. For example, in
Canada they cover about 14% of the terrestrial area
(Tarnocai et al., 2000).
A number of field carbon flux measurements,
paleoecological records, and model simulations have
demonstrated that peatlands are an active component of
the global carbon cycle (e.g., Lafleur et al., 2001;
Clymo, 1998; Frolking et al., 2002; Roulet et al., 2006).
The functional importance of peatlands in the global
carbon cycle is rooted in their capability to act as long-
term stores of carbon as peat. The accumulation of peat
is the result of net primary productivity (NPP), the net
gain of carbon through photosynthesis, persistently
exceeding the decomposition of organic matter. With an
average long-term apparent carbon accumulation rate of
15–30 g C m�2 yr�1, peatlands have been acting as
small but persistent carbon sinks since the beginning of
their development after the last deglaciation (Turunen
et al., 2002). As a result, peatlands store up to 450 Gt C
or one-third of the global soil carbon (Gorham, 1991;
Turunen et al., 2002).
Quantification of possible responses of peatland
carbon dynamics to likely climatic changes as predicted
by several General Circulation Models (GCM) still
remains a big challenge because of the complexity of
the interrelated physical, ecological, and biogeochem-
ical feedbacks involved (Moore et al., 1998). Process-
oriented ecosystem models of varying complexity such
as the Boreal Ecosystem Productivity Simulator (BEPS,
Liu et al., 1997) and the Peatland Carbon Simulator
(PCARS, Frolking et al., 2002) are considered as
promising tools to quantify the responses of peatland
carbon cycle dynamics to likely climatic changes.
An important parameter of most process-oriented
ecosystems models is the leaf area index (LAI). Some
models use LAI as an input parameter (e.g., BEPS),
while others generate LAI as a function of foliar
biomass (e.g., PCARS). LAI is a dimensionless value of
the amount of foliage area of a vegetation canopy and is
defined as one-half the total radiation intercepting leaf
area (all-sided) per unit ground horizontal surface area
(Chen and Black, 1992). LAI characterizes the canopy–
atmosphere interface of an ecosystem, and is thus
related to precipitation interception, canopy micro-
climate, radiation extinction, and water, carbon, and
energy exchange with the atmosphere, and also plays a
role in the interception of atmospheric nutrient
deposition. In the field, LAI can be determined with
direct and indirect measurements (Breda, 2003;
Jonckheere et al., 2004).
Direct measurements of LAI are considered to be the
most accurate and hence, play an important role in
validating indirect measurements (e.g., Chen et al.,
1997; Kußner and Mosandl, 2000). All direct measure-
ments have the disadvantage of being very time-
consuming; they are two-step processes consisting of
leaf collection by either harvesting (e.g., destructive
sampling) or non-harvesting (e.g., litter traps) methods,
and subsequent leaf area calculation based on either
planimetric (e.g., scanning planimeter LI-3000, LI-
COR, Lincoln, NE, USA) or gravimetric (e.g.,
predetermined green leaf area-to-dry weight-ratios)
methods (Jonckheere et al., 2004).
Indirect measurements of LAI are based on the
inference of leaf area from another, more easily and
faster measurable variable and are further subdivided
into contact (e.g., inclined point method for low
canopies or allometric techniques for forests) and
non-contact (e.g., optical techniques based on light
transmission through vegetation canopies using radia-
tive transfer theory) methods (Breda, 2003; Jonckheere
et al., 2004). A practical, effective, and, hence widely
applied optical technique to determine LAI that has
been successfully applied widely is the LAI-2000 (LI-
COR, Lincoln, NE, USA) plant canopy analyzer
(Norman and Welles, 1991).
The LAI-2000 instrument measures canopy gap
fraction at five zenith angles. The LAI estimate obtained
from the LAI-2000 instrument is an ‘‘effective’’ LAI
(LAIe) calculated from the light interception of all
canopy elements using a radiative transfer model,
assuming a random spatial distribution of all light
intercepting elements of the canopy (Chen et al., 1997).
To derive the LAI of a vegetation canopy from LAIe,
Chen (1996) and Chen et al. (1997) demonstrate for
boreal forest canopies that LAIe has to be corrected for
the contribution of woody canopy elements to light
interception and for foliage clumping (i.e. their non-
random spatial distribution) at three different spatial
scales (branches, whirls and tree crowns, and groups of
trees) for deciduous species and at four different spatial
scales (shoots, branches, whirls and tree crowns, and
groups of trees) for coniferous species. Several studies
have demonstrated that the LAI-2000 instrument tends
to underestimate LAIe due to multiple light scattering,
especially when the measurement was taken under non-
ideal light conditions (Chen, 1996; Chen et al., 1997,
2006; Leblanc and Chen, 2001). Thus, a further
correction of LAIe should be applied to account for
the effect of multiple light scattering within a canopy.
The multi-layer canopy of ombrotrophic peatlands is
often characterized by the abundance of evergreen, and
occasional deciduous shrubs and patches of open tree
canopies, underlain by a continuous surface cover of
O. Sonnentag et al. / Agricultural and Forest Meteorology 144 (2007) 200–212202
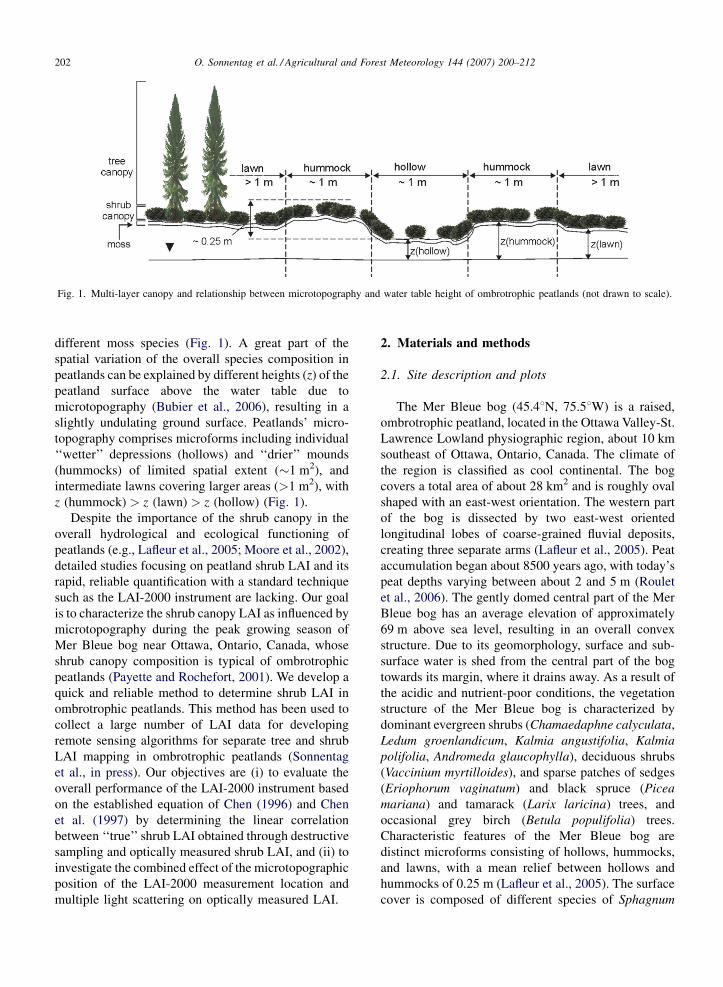
Fig. 1. Multi-layer canopy and relationship between microtopography and water table height of ombrotrophic peatlands (not drawn to scale).
different moss species (Fig. 1). A great part of the
spatial variation of the overall species composition in
peatlands can be explained by different heights (z) of the
peatland surface above the water table due to
microtopography (Bubier et al., 2006), resulting in a
slightly undulating ground surface. Peatlands’ micro-
topography comprises microforms including individual
‘‘wetter’’ depressions (hollows) and ‘‘drier’’ mounds
(hummocks) of limited spatial extent (�1 m2), and
intermediate lawns covering larger areas (>1 m2), with
z (hummock) > z (lawn) > z (hollow) (Fig. 1).
Despite the importance of the shrub canopy in the
overall hydrological and ecological functioning of
peatlands (e.g., Lafleur et al., 2005; Moore et al., 2002),
detailed studies focusing on peatland shrub LAI and its
rapid, reliable quantification with a standard technique
such as the LAI-2000 instrument are lacking. Our goal
is to characterize the shrub canopy LAI as influenced by
microtopography during the peak growing season of
Mer Bleue bog near Ottawa, Ontario, Canada, whose
shrub canopy composition is typical of ombrotrophic
peatlands (Payette and Rochefort, 2001). We develop a
quick and reliable method to determine shrub LAI in
ombrotrophic peatlands. This method has been used to
collect a large number of LAI data for developing
remote sensing algorithms for separate tree and shrub
LAI mapping in ombrotrophic peatlands (Sonnentag
et al., in press). Our objectives are (i) to evaluate the
overall performance of the LAI-2000 instrument based
on the established equation of Chen (1996) and Chen
et al. (1997) by determining the linear correlation
between ‘‘true’’ shrub LAI obtained through destructive
sampling and optically measured shrub LAI, and (ii) to
investigate the combined effect of the microtopographic
position of the LAI-2000 measurement location and
multiple light scattering on optically measured LAI.
2. Materials and methods
2.1. Site description and plots
The Mer Bleue bog (45.48N, 75.58W) is a raised,
ombrotrophic peatland, located in the Ottawa Valley-St.
Lawrence Lowland physiographic region, about 10 km
southeast of Ottawa, Ontario, Canada. The climate of
the region is classified as cool continental. The bog
covers a total area of about 28 km2 and is roughly oval
shaped with an east-west orientation. The western part
of the bog is dissected by two east-west oriented
longitudinal lobes of coarse-grained fluvial deposits,
creating three separate arms (Lafleur et al., 2005). Peat
accumulation began about 8500 years ago, with today’s
peat depths varying between about 2 and 5 m (Roulet
et al., 2006). The gently domed central part of the Mer
Bleue bog has an average elevation of approximately
69 m above sea level, resulting in an overall convex
structure. Due to its geomorphology, surface and sub-
surface water is shed from the central part of the bog
towards its margin, where it drains away. As a result of
the acidic and nutrient-poor conditions, the vegetation
structure of the Mer Bleue bog is characterized by
dominant evergreen shrubs (Chamaedaphne calyculata,
Ledum groenlandicum, Kalmia angustifolia, Kalmia
polifolia, Andromeda glaucophylla), deciduous shrubs
(Vaccinium myrtilloides), and sparse patches of sedges
(Eriophorum vaginatum) and black spruce (Picea
mariana) and tamarack (Larix laricina) trees, and
occasional grey birch (Betula populifolia) trees.
Characteristic features of the Mer Bleue bog are
distinct microforms consisting of hollows, hummocks,
and lawns, with a mean relief between hollows and
hummocks of 0.25 m (Lafleur et al., 2005). The surface
cover is composed of different species of Sphagnum
O. Sonnentag et al. / Agricultural and Forest Meteorology 144 (2007) 200–212 203
Table 1
Summary of species composition, percent cover, and mean shrub height of the 33 plots considered in this study
Microform # Mean cover [%] (standard deviation, %) Mean shrub height [cm]
(standard deviation, cm)Evergreen shrubs Deciduous shrubs Sedges Total
Hollow 9 30.0 (16.4) 1.7 (3.5) 8.9 (16.4) 40.6 (18.8) 15.3 (3.4)
Evergreen hummock 9 86.7 (6.1) 2.8 (2.6) 1.1 (2.2) 90.6 (8.1) 19.3 (3.8)
Deciduous hummock 6 27.5 (12.9) 51.7 (13.7) 1.7 (4.1) 88.8 (16.6) 29.7 (8.4)
Lawn 9 60.6 (14.9) 2.8 (6.7) 2.8 (2.6) 66.1 (15.2) 14.8 (2.6)
moss (Sphagnum angustifolium, Sphagnum capillifo-
lium, Sphagnum magellanicum, and Sphagnum fus-
cum).
We measured shrub LAI directly and indirectly in 33
plots of 0.5 m � 0.5 m at different microtopographic
locations on the western, upslope side of a drainage
ditch that dissects the eastern part of the bog. We
distinguish, based on the dominant shrub type, among
evergreen hollows, evergreen hummocks, deciduous
hummocks, and evergreen lawns. The plots were
delimited and inventoried at the beginning of summer
2005 and randomly located but evenly distributed for
each microform at a distance of 30, 60, and 200 m away
from the drainage ditch along a perpendicular transect.
At a distance of 200 m from the drainage ditch, no
deciduous hummock was present so only hollows,
evergreen hummocks, and lawns were represented,
resulting in 33 plots in total. Species composition,
percent cover, and mean height of each species were
estimated prior to clipping (summarized in Table 1).
Trees were absent in all 33 plots.
The area containing the plots is influenced by the
drainage ditch and is generally characterized by
increasing water table depths with decreasing distance
to the ditch. Peatland plant biomass increases with
increasing water table depth (Bubier et al., 2006). Since
the plots were located along a water table gradient, a
greater range of shrub LAI values could be sampled.
2.2. Direct LAI measurements
Shrub LAI of all 33 plots was measured directly and
indirectly in August 2005. The plots were clipped
during the last week of August 2005 and vascular plants
collected and separated by species. Standing dead
biomass was also collected, but dead biomass lying on
the ground (litter) was discarded. With the exception of
one plot with 50% sedge cover, the contribution of
sedges to the total plot percent cover, and therefore to
total leaf area, was minimal (Table 1). Due to the
methodological difficulties in directly measuring sedge
LAI, the contribution of sedges to total LAI was
neglected and the above plot with 50% sedge cover was
not considered in the subsequent analysis.
The leaf area of each plot was calculated planime-
trically. One randomly selected subsample of leaves
was scanned (300 dpi) for each shrub species of each
plot, using a standard desktop scanner (CanoScan LIDE
30, Canon USA Inc., Lake Success, New York, USA).
Shrub species with flat leaves (V. myrtilloides, K.
angustifolia, C. calyculata) were scanned pressed, and
shadow around the leaf margins created by the scanning
process was removed after posterizing the scan with the
Corel Photo-Paint (v10) raster graphics software (Corel
Corp., Ottawa, Ontario, Canada). Posterization converts
a RGB image into a limited number of distinct colours
that can be separately processed. For our purposes,
posterizing the scans into four distinct colours allowed
extraction of the shadow around the leaves. Species
with non-flat leaves (L. groenlandicum, K. polifolia, A.
glaucophylla) were first scanned ‘‘un-pressed’’ and then
pressed, followed by shadow removal through poster-
ization. Subsequently, leaf area for all scans was
determined using the WinSeedle (v2003a) image
analysis software (Regent Instruments Inc., Quebec
City, Quebec, Canada). To comply with the definition of
LAI by Chen and Black (1992) as one-half the total
radiation intercepting leaf area per unit ground
horizontal surface area, leaf area of shrub species with
non-flat leaves was taken as the arithmetic mean of the
leaf area obtained from ‘‘un-pressed’’ and the pressed
scans.
Total leaf and woody material was weighted
separately for each species. The ‘‘true’’ shrub LAI of
each plot (L) was calculated as:
L ¼XW tot
Aplot
�Ass
W ss
�(1)
where Wtot is the total weight of leaves per species of
each plot [g], Aplot the area of the plot [m2], Ass the
leaf area obtained for each species subsample [m2],
and Wss is the weight of leaves of each species
subsample [g].
O. Sonnentag et al. / Agricultural and Forest Meteorology 144 (2007) 200–212204
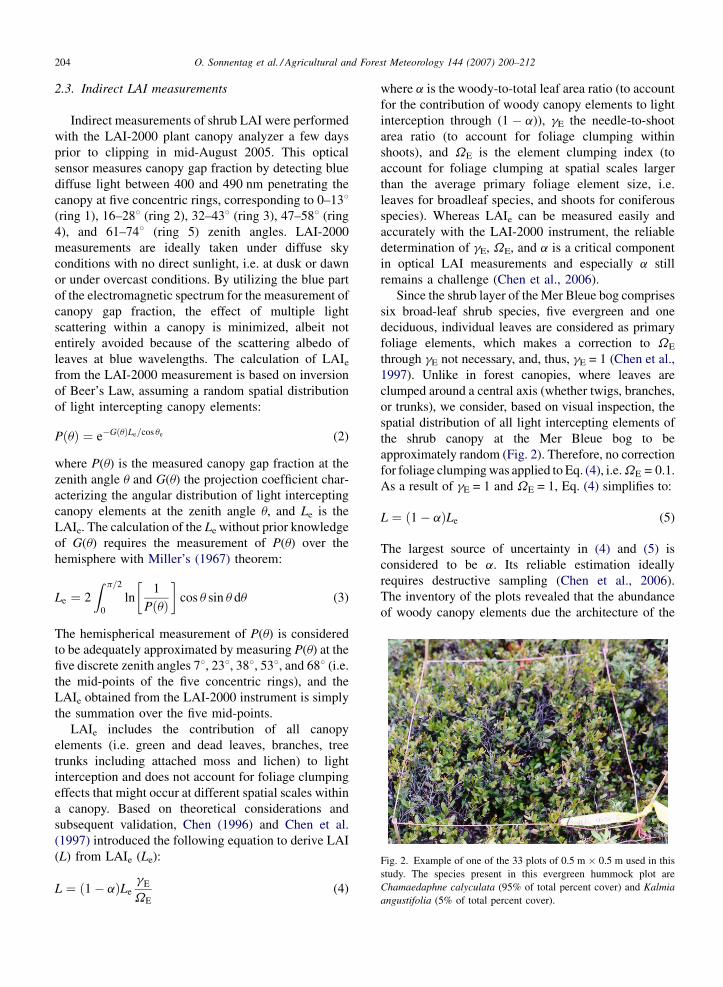
Fig. 2. Example of one of the 33 plots of 0.5 m � 0.5 m used in this
study. The species present in this evergreen hummock plot are
Chamaedaphne calyculata (95% of total percent cover) and Kalmia
angustifolia (5% of total percent cover).
2.3. Indirect LAI measurements
Indirect measurements of shrub LAI were performed
with the LAI-2000 plant canopy analyzer a few days
prior to clipping in mid-August 2005. This optical
sensor measures canopy gap fraction by detecting blue
diffuse light between 400 and 490 nm penetrating the
canopy at five concentric rings, corresponding to 0–138(ring 1), 16–288 (ring 2), 32–438 (ring 3), 47–588 (ring
4), and 61–748 (ring 5) zenith angles. LAI-2000
measurements are ideally taken under diffuse sky
conditions with no direct sunlight, i.e. at dusk or dawn
or under overcast conditions. By utilizing the blue part
of the electromagnetic spectrum for the measurement of
canopy gap fraction, the effect of multiple light
scattering within a canopy is minimized, albeit not
entirely avoided because of the scattering albedo of
leaves at blue wavelengths. The calculation of LAIe
from the LAI-2000 measurement is based on inversion
of Beer’s Law, assuming a random spatial distribution
of light intercepting canopy elements:
PðuÞ ¼ e�GðuÞLe=cos ue (2)
where P(u) is the measured canopy gap fraction at the
zenith angle u and G(u) the projection coefficient char-
acterizing the angular distribution of light intercepting
canopy elements at the zenith angle u, and Le is the
LAIe. The calculation of the Le without prior knowledge
of G(u) requires the measurement of P(u) over the
hemisphere with Miller’s (1967) theorem:
Le ¼ 2
Z p=2
0
ln
�1
PðuÞ
�cos u sin u du (3)
The hemispherical measurement of P(u) is considered
to be adequately approximated by measuring P(u) at the
five discrete zenith angles 78, 238, 388, 538, and 688 (i.e.
the mid-points of the five concentric rings), and the
LAIe obtained from the LAI-2000 instrument is simply
the summation over the five mid-points.
LAIe includes the contribution of all canopy
elements (i.e. green and dead leaves, branches, tree
trunks including attached moss and lichen) to light
interception and does not account for foliage clumping
effects that might occur at different spatial scales within
a canopy. Based on theoretical considerations and
subsequent validation, Chen (1996) and Chen et al.
(1997) introduced the following equation to derive LAI
(L) from LAIe (Le):
L ¼ ð1� aÞLe
gE
VE
(4)
where a is the woody-to-total leaf area ratio (to account
for the contribution of woody canopy elements to light
interception through (1 � a)), gE the needle-to-shoot
area ratio (to account for foliage clumping within
shoots), and VE is the element clumping index (to
account for foliage clumping at spatial scales larger
than the average primary foliage element size, i.e.
leaves for broadleaf species, and shoots for coniferous
species). Whereas LAIe can be measured easily and
accurately with the LAI-2000 instrument, the reliable
determination of gE, VE, and a is a critical component
in optical LAI measurements and especially a still
remains a challenge (Chen et al., 2006).
Since the shrub layer of the Mer Bleue bog comprises
six broad-leaf shrub species, five evergreen and one
deciduous, individual leaves are considered as primary
foliage elements, which makes a correction to VE
through gE not necessary, and, thus, gE = 1 (Chen et al.,
1997). Unlike in forest canopies, where leaves are
clumped around a central axis (whether twigs, branches,
or trunks), we consider, based on visual inspection, the
spatial distribution of all light intercepting elements of
the shrub canopy at the Mer Bleue bog to be
approximately random (Fig. 2). Therefore, no correction
for foliage clumping was applied to Eq. (4), i.e. VE = 0.1.
As a result of gE = 1 and VE = 1, Eq. (4) simplifies to:
L ¼ ð1� aÞLe (5)
The largest source of uncertainty in (4) and (5) is
considered to be a. Its reliable estimation ideally
requires destructive sampling (Chen et al., 2006).
The inventory of the plots revealed that the abundance
of woody canopy elements due the architecture of the

O. Sonnentag et al. / Agricultural and Forest Meteorology 144 (2007) 200–212 205
shrub canopy (Fig. 2) might significantly affect the LAI-
2000 measurements. Optical approaches to determine a
such as the Multiband Vegetation Imager (MVI;
Kucharik et al., 1998) or the approach pursued by Barr
et al. (2004) based on non-growing and growing season
LAI-2000 measurements were both not feasible due to
the height and the architecture of the shrub canopy (for
MVI) and the evergreen nature of five of the six major
shrub species (for the LAI-2000 instrument-based
approach), respectively. We destructively determined a
for five of the six major shrub species of the Mer Bleue
bog (C. calyculata, L. groenlandicum, K. angustifolia, K.
polifolia, and V. myrtilloides). Since A. glaucophylla only
minimally contributed to the total plot percent cover of
just two plots (data not shown), a for this species was
taken as the mean of a of the major five shrub species. For
each shrub species measured, we took three subsamples
of woody material from different plots, separated them
into their basic elements (twigs, branches, and trunks),
and calculated their total woody areas (Aw-ss) based on
their morphological characteristics as truncated cones
(conical frustum: a frustum created by slicing the top of a
cone with the cut made parallel to the base), not including
the top and the base circles with:
Aw-ss ¼ p
�Xr1
þX
r2
� ffiffiffiffiffiffiffiffiffiffiffiffiffiffiffiffiffiffiffiffiffiffiffiffiffiffiffiffiffiffiffiffiffiffiffiffiffiffiffiffiffiffiffiffiffiffiffiffiffiffiffiffiffiffiffiffiffi�Xr1 �
Xr2
�2
þX
h2
s
(6)
where r1 and r2 are the top and the base radii [m] of each
basic woody element, and h the length [m] of each basic
woody element. The woody area index (Wspecies) of each
species per plot was calculated similar to Eq. (1) with:
W species ¼�
Aw-ssW tot
W ss
�1
Aplot
(7)
where Aw-ss is the total woody area obtained for each
subsample [m2] through Eq. (6), Wtot the total weight of
woody material of the species per plot [g], Wss the
weight of woody material of each species subsample
[g], and Aplot is the area of the plot [m2]. Finally, a was
calculated for each species as the average of three
subsamples using (Kucharik et al., 1998):
a ¼ W species
W species þ Lspecies
(8)
where Wspecies is the woody area index of each species per
plot calculated with Eq. (7), and Lspecies the leaf area index
for each species per plot calculated as part of Eq. (1).
LAI-2000 measurements were taken under subopti-
mal sky conditions during the day with partial direct
sunlight. Considering the small area of each plot we
emulated ideal sky conditions by creating enough
shadow to avoid direct illumination of the shrub canopy
and its vicinity. Therefore, it can be assumed that the
multiple light scattering within the shrub canopy due to
direct illumination was kept to a minimum. Shadowing
of the plots was accomplished by positioning the
operator of the LAI-2000 instrument and an additional
person between the plot and the instrument sensor, and
the sun. To avoid any effects of the two people on the
sensor of the LAI-2000 instrument, the 2708 view cap
provided by LI-COR was used for all measurements.
For each plot we measured diffuse radiation above
the shrub canopy for reference, followed by five
measurements below the shrub canopy, four taken
between the four corners and the center, and one taken
at the center of the LAI plot, followed by another
reference measurement above the shrub canopy. The
post-processing of the measurements was accomplished
using the LAI-2000 analysis software provided by LI-
COR (F2000.exe). For each of the five individual
below-canopy measurements per plot, an interpolated
above-canopy reference based on the ‘‘before’’ and
‘‘after’’ above-canopy reference measurement was
used. LAIe of each plot was calculated as the arithmetic
mean of the five measurements below the shrub canopy.
A common way to investigate the effect of multiple
scattering of blue light within a canopy on the LAI-2000
measurement is to ignore rings 4 and 5 in the post-
processing of the LAI-2000 data with F2000.exe (Chen
et al., 2006). Thereby, the largest zenith angles where
the effect of multiple light scattering is usually the
strongest are excluded from the LAIe calculation,
theoretically resulting in an increase of LAIe compared
to its calculation based on all five rings. The assumption
underlying this simple approach is random angular
distribution of light intercepting canopy elements (Chen
et al., 2006), i.e. G(u) = 0.5 in Eq. (2). The validity of
this assumption for the shrub canopy in the bog was
tested for each ring by calculating G(u) through
inversion of Eq. (2) using P(u) from the instrument
raw data, and LAIe of each ring calculated with
F2000.exe. However, it has to be noted at this point that
the interpretation of the impact of excluding rings 4 and
5 from the calculation of LAIe is still of ongoing
scientific dispute in the literature (Leblanc and Chen,
2001; Planchais and Pontailler, 1999). A recent
summary of this dispute is provided by Hyer and
Goetz (2004). For forest stands, Chen et al. (2006)
maintain that multiple light scattering at rings 4 and 5
O. Sonnentag et al. / Agricultural and Forest Meteorology 144 (2007) 200–212206
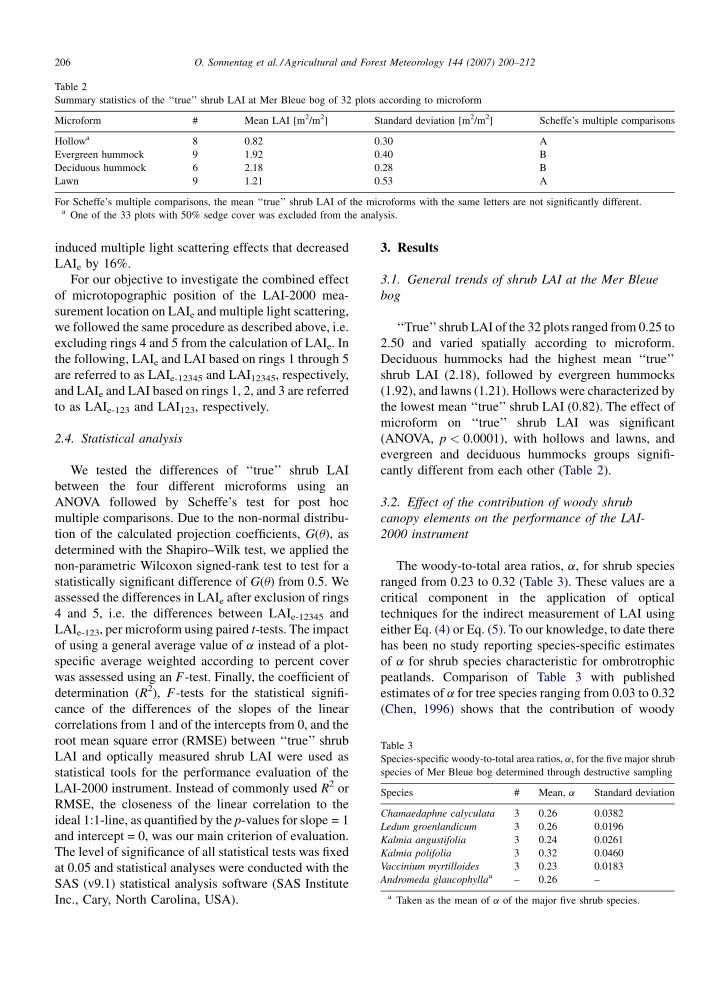
Table 2
Summary statistics of the ‘‘true’’ shrub LAI at Mer Bleue bog of 32 plots according to microform
Microform # Mean LAI [m2/m2] Standard deviation [m2/m2] Scheffe’s multiple comparisons
Hollowa 8 0.82 0.30 A
Evergreen hummock 9 1.92 0.40 B
Deciduous hummock 6 2.18 0.28 B
Lawn 9 1.21 0.53 A
For Scheffe’s multiple comparisons, the mean ‘‘true’’ shrub LAI of the microforms with the same letters are not significantly different.a One of the 33 plots with 50% sedge cover was excluded from the analysis.
Table 3
Species-specific woody-to-total area ratios, a, for the five major shrub
species of Mer Bleue bog determined through destructive sampling
Species # Mean, a Standard deviation
Chamaedaphne calyculata 3 0.26 0.0382
Ledum groenlandicum 3 0.26 0.0196
Kalmia angustifolia 3 0.24 0.0261
Kalmia polifolia 3 0.32 0.0460
Vaccinium myrtilloides 3 0.23 0.0183
Andromeda glaucophyllaa – 0.26 –
a Taken as the mean of a of the major five shrub species.
induced multiple light scattering effects that decreased
LAIe by 16%.
For our objective to investigate the combined effect
of microtopographic position of the LAI-2000 mea-
surement location on LAIe and multiple light scattering,
we followed the same procedure as described above, i.e.
excluding rings 4 and 5 from the calculation of LAIe. In
the following, LAIe and LAI based on rings 1 through 5
are referred to as LAIe-12345 and LAI12345, respectively,
and LAIe and LAI based on rings 1, 2, and 3 are referred
to as LAIe-123 and LAI123, respectively.
2.4. Statistical analysis
We tested the differences of ‘‘true’’ shrub LAI
between the four different microforms using an
ANOVA followed by Scheffe’s test for post hoc
multiple comparisons. Due to the non-normal distribu-
tion of the calculated projection coefficients, G(u), as
determined with the Shapiro–Wilk test, we applied the
non-parametric Wilcoxon signed-rank test to test for a
statistically significant difference of G(u) from 0.5. We
assessed the differences in LAIe after exclusion of rings
4 and 5, i.e. the differences between LAIe-12345 and
LAIe-123, per microform using paired t-tests. The impact
of using a general average value of a instead of a plot-
specific average weighted according to percent cover
was assessed using an F-test. Finally, the coefficient of
determination (R2), F-tests for the statistical signifi-
cance of the differences of the slopes of the linear
correlations from 1 and of the intercepts from 0, and the
root mean square error (RMSE) between ‘‘true’’ shrub
LAI and optically measured shrub LAI were used as
statistical tools for the performance evaluation of the
LAI-2000 instrument. Instead of commonly used R2 or
RMSE, the closeness of the linear correlation to the
ideal 1:1-line, as quantified by the p-values for slope = 1
and intercept = 0, was our main criterion of evaluation.
The level of significance of all statistical tests was fixed
at 0.05 and statistical analyses were conducted with the
SAS (v9.1) statistical analysis software (SAS Institute
Inc., Cary, North Carolina, USA).
3. Results
3.1. General trends of shrub LAI at the Mer Bleue
bog
‘‘True’’ shrub LAI of the 32 plots ranged from 0.25 to
2.50 and varied spatially according to microform.
Deciduous hummocks had the highest mean ‘‘true’’
shrub LAI (2.18), followed by evergreen hummocks
(1.92), and lawns (1.21). Hollows were characterized by
the lowest mean ‘‘true’’ shrub LAI (0.82). The effect of
microform on ‘‘true’’ shrub LAI was significant
(ANOVA, p < 0.0001), with hollows and lawns, and
evergreen and deciduous hummocks groups signifi-
cantly different from each other (Table 2).
3.2. Effect of the contribution of woody shrub
canopy elements on the performance of the LAI-
2000 instrument
The woody-to-total area ratios, a, for shrub species
ranged from 0.23 to 0.32 (Table 3). These values are a
critical component in the application of optical
techniques for the indirect measurement of LAI using
either Eq. (4) or Eq. (5). To our knowledge, to date there
has been no study reporting species-specific estimates
of a for shrub species characteristic for ombrotrophic
peatlands. Comparison of Table 3 with published
estimates of a for tree species ranging from 0.03 to 0.32
(Chen, 1996) shows that the contribution of woody

O. Sonnentag et al. / Agricultural and Forest Meteorology 144 (2007) 200–212 207
Fig. 3. Effect of correcting LAIe-12345 for the contribution of woody
canopy elements to light interception through species-specific woody-
to-total area ratios, a (Table 3), on the linear correlation between
‘‘true’’ shrub LAI and LAI12345.
canopy elements to light interception is quite consider-
able at the Mer Bleue bog.
LAIe-12345 was corrected for the contribution of
woody canopy elements resulting in LAI12345 based on
Eq. (5) using the species-specific estimates of a
provided in Table 3, weighted according to percent
cover of each species (data not shown). The linear
correlation between ‘‘true’’ shrub LAI and LAIe-12345
and LAI12345, respectively, for the 32 plots is good
(Fig. 3). R2 and RMSE are 0.74 and 0.60, respectively,
for LAIe-12345 and 0.69 and 0.38, respectively, for
LAI12345, indicating the general applicability and
usefulness of the LAI-2000 instrument to provide a
quick and reliable shrub LAI estimate after correcting
LAIe for a. We also corrected LAIe-12345 for the
contribution of woody canopy elements resulting in
LAI12345 based on Eq. (5) using an average value of a of
0.26 of the species-specific estimates provided in
Table 3. The linear correlations are not significantly
different ( p = 0.9097).
Table 4 summarizes the characteristics of the linear
correlations of Fig. 3, statistically demonstrating the
effects of correcting LAIe-12345 through a to obtain
Table 4
Summarized characteristics of the linear correlations of Figs. 3 and 6
Linear correlation Intercept Slope R2
‘‘True’’ shrub LAI vs. LAIe-12345 0.56 0.94 0.74
‘‘True’’ shrub LAI vs. LAI12345 0.26 0.76 0.69
‘‘True’’ shrub LAI vs. LAIe-123 0.23 1.28 0.75
‘‘True’’ shrub LAI vs. LAI123 0.16 0.97 0.74
LAI12345. R2 of LAI12345 is slightly reduced after the
correction through a compared to LAIe-12345. The
reduced RMSE of LAI12345 compared to LAIe-12345
indicates a decrease in error between ‘‘true’’ shrub LAI
and indirectly measured LAI. The correction through a
moves the intercept of the linear correlation closer to 0,
but decreases its slope, which after the correction is
significantly different from 1. However, it can be seen
that for both, LAIe-12345 and LAI12345, the slopes are
less than 1, meaning that the LAI-2000 instrument tends
to generally underestimate ‘‘true’’ shrub LAI in the
higher range, but to overestimate ‘‘true’’ shrub LAI in
the lower range. These tendencies are related to
microtopography and multiple light scattering, as will
be demonstrated in the following section.
3.3. Combined effect of microtopography and
multiple light scattering on the performance of the
LAI-2000 instrument
To allow for the reliable investigation of the combined
effect of the microtopographic position of the LAI-2000
measurement location and multiple light scattering based
on the simple approach of excluding rings 4 and 5, it is
mandatory for the underlying assumption of random
angular distribution of light intercepting canopy ele-
ments of the multiple light scattering component to be
generally valid (i.e. G(u) ffi 0.5). For each plot, projection
coefficients, G(u), were calculated through inversion of
Eq. (2) based on the measured gap fraction, P(u), and
LAIe-12345, separately derived from each ring of the LAI-
2000 instrument. Application of the non-parametric
Wilcoxon signed-rank test to the calculated projection
coefficients summarized in Table 5 revealed that there are
no statistically significant differences between G(u) = 0.5
and the calculated mean projection coefficients.
As a result, the angular distribution of light
intercepting canopy elements of the Mer Bleue bog
shrub canopy can be considered to be random and the
differences between LAIe-12345 and LAIe-123 were
interpreted as fully caused by the combined effect of
microtopographic position of the LAI-2000 measure-
ment location and multiple light scattering.
p (model) p (intercept = 0) p (slope = 1) RMSE
<0.0001 0.0020 0.5582 0.5990
<0.0001 0.0926 0.0163 0.3775
<0.0001 0.2944 0.0419 0.8325
<0.0001 0.3575 0.7489 0.3846
O. Sonnentag et al. / Agricultural and Forest Meteorology 144 (2007) 200–212208
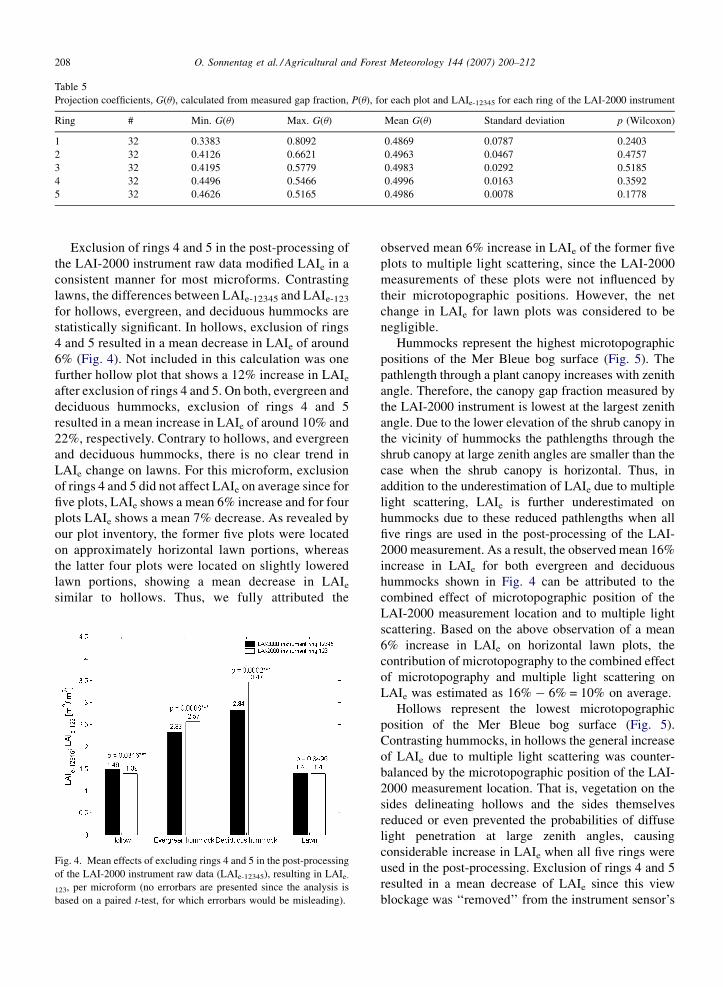
Table 5
Projection coefficients, G(u), calculated from measured gap fraction, P(u), for each plot and LAIe-12345 for each ring of the LAI-2000 instrument
Ring # Min. G(u) Max. G(u) Mean G(u) Standard deviation p (Wilcoxon)
1 32 0.3383 0.8092 0.4869 0.0787 0.2403
2 32 0.4126 0.6621 0.4963 0.0467 0.4757
3 32 0.4195 0.5779 0.4983 0.0292 0.5185
4 32 0.4496 0.5466 0.4996 0.0163 0.3592
5 32 0.4626 0.5165 0.4986 0.0078 0.1778
Exclusion of rings 4 and 5 in the post-processing of
the LAI-2000 instrument raw data modified LAIe in a
consistent manner for most microforms. Contrasting
lawns, the differences between LAIe-12345 and LAIe-123
for hollows, evergreen, and deciduous hummocks are
statistically significant. In hollows, exclusion of rings
4 and 5 resulted in a mean decrease in LAIe of around
6% (Fig. 4). Not included in this calculation was one
further hollow plot that shows a 12% increase in LAIe
after exclusion of rings 4 and 5. On both, evergreen and
deciduous hummocks, exclusion of rings 4 and 5
resulted in a mean increase in LAIe of around 10% and
22%, respectively. Contrary to hollows, and evergreen
and deciduous hummocks, there is no clear trend in
LAIe change on lawns. For this microform, exclusion
of rings 4 and 5 did not affect LAIe on average since for
five plots, LAIe shows a mean 6% increase and for four
plots LAIe shows a mean 7% decrease. As revealed by
our plot inventory, the former five plots were located
on approximately horizontal lawn portions, whereas
the latter four plots were located on slightly lowered
lawn portions, showing a mean decrease in LAIe
similar to hollows. Thus, we fully attributed the
Fig. 4. Mean effects of excluding rings 4 and 5 in the post-processing
of the LAI-2000 instrument raw data (LAIe-12345), resulting in LAIe-
123, per microform (no errorbars are presented since the analysis is
based on a paired t-test, for which errorbars would be misleading).
observed mean 6% increase in LAIe of the former five
plots to multiple light scattering, since the LAI-2000
measurements of these plots were not influenced by
their microtopographic positions. However, the net
change in LAIe for lawn plots was considered to be
negligible.
Hummocks represent the highest microtopographic
positions of the Mer Bleue bog surface (Fig. 5). The
pathlength through a plant canopy increases with zenith
angle. Therefore, the canopy gap fraction measured by
the LAI-2000 instrument is lowest at the largest zenith
angle. Due to the lower elevation of the shrub canopy in
the vicinity of hummocks the pathlengths through the
shrub canopy at large zenith angles are smaller than the
case when the shrub canopy is horizontal. Thus, in
addition to the underestimation of LAIe due to multiple
light scattering, LAIe is further underestimated on
hummocks due to these reduced pathlengths when all
five rings are used in the post-processing of the LAI-
2000 measurement. As a result, the observed mean 16%
increase in LAIe for both evergreen and deciduous
hummocks shown in Fig. 4 can be attributed to the
combined effect of microtopographic position of the
LAI-2000 measurement location and to multiple light
scattering. Based on the above observation of a mean
6% increase in LAIe on horizontal lawn plots, the
contribution of microtopography to the combined effect
of microtopography and multiple light scattering on
LAIe was estimated as 16% � 6% = 10% on average.
Hollows represent the lowest microtopographic
position of the Mer Bleue bog surface (Fig. 5).
Contrasting hummocks, in hollows the general increase
of LAIe due to multiple light scattering was counter-
balanced by the microtopographic position of the LAI-
2000 measurement location. That is, vegetation on the
sides delineating hollows and the sides themselves
reduced or even prevented the probabilities of diffuse
light penetration at large zenith angles, causing
considerable increase in LAIe when all five rings were
used in the post-processing. Exclusion of rings 4 and 5
resulted in a mean decrease of LAIe since this view
blockage was ‘‘removed’’ from the instrument sensor’s

O. Sonnentag et al. / Agricultural and Forest Meteorology 144 (2007) 200–212 209
Fig. 5. Effect of microtopography on the LAI-2000 measurement (not drawn to scale).
field of view. The clear increase in LAIe for one hollow
plot was most likely caused by the fact that this plot was
not clearly distinct from its immediate vicinity in terms
of relief, and, thus, exclusion of rings 4 and 5 simply
resulted in the combined effect of microtopography and
multiple light scattering as observed on hummocks. For
hollow and slightly lowered lawn plots, the contribution
of microtopography to the combined effect of micro-
topography and multiple light scattering on LAIe was
estimated as (�6%) � 6% = �12% on average, assum-
ing that the contribution of multiple light scattering to
the combined effect is also 6% on average.
Fig. 6. Overall effect of excluding rings 4 and 5 (i.e., LAIe-123) and
correcting for the woody canopy elements to light interception
through species-specific woody-to-total area ratios, a (Table 3), on
the linear correlation between ‘‘true’’ shrub LAI and LAI123.
3.4. Overall performance of the LAI-2000
instrument
Fig. 6 shows the linear correlations between ‘‘true’’
shrub LAI and LAIe-123, and between ‘‘true’’ shrub LAI
and LAI123, respectively, for the 32 plots. The overall
effect of excluding rings 4 and 5 and correcting for the
woody canopy elements through a on the characteristics
of the linear correlations shown in Fig. 6 are provided
with Table 4. As expected, the linear correlations are
good, with R2 = 0.75 and RMSE = 0.83 for LAIe-123,
and R2 = 0.74 and RMSE = 0.38 for LAI123, respec-
tively, and, thus, are in the same range as for LAIe-12345
and LAI12345. However, for the objectives of our
contribution, these two statistical measures are not fully
adequate to demonstrate the overall positive effect of
excluding rings 4 and 5 and correcting for the woody
canopy elements through a on the linear correlation of
Fig. 6. Once both factors are considered, both intercept
and slope of the linear correlation between ‘‘true’’ shrub
LAI and LAI123 are not significantly different from 0
and 1, respectively. Under the assumptions that the
combined effect of microtopography and multiple
scattering is more or less entirely removed through
excluding rings 4 and 5, and that the contribution of
woody canopy elements to light interception is
accounted for correctly through a, these results indicate
that VE for the shrub canopy has to be close to unity, i.e.
VE ffi 1.
The spatial variability of ‘‘true’’ shrub LAI according
to microform as outlined in 3.1 is captured for the most
part by LAI123, with the difference that lawns are

O. Sonnentag et al. / Agricultural and Forest Meteorology 144 (2007) 200–212210
Table 6
Summary statistics of LAI123 at the at Mer Bleue bog of 32 plots according to microform
Microform # Mean LAI [m2/m2] Standard deviation [m2/m2] Scheffe’s multiple comparisons
Hollowa 8 1.11 0.3119 A
Evergreen hummock 9 1.90 0.4221 B
Deciduous hummock 6 2.62 0.4848 C
Lawn 9 1.05 0.4826 A
For Scheffe’s multiple comparisons, the mean ‘‘true’’ shrub LAI of the microforms with the same letters are not significantly different.a One of the 33 plots with 50% sedge cover was excluded from the analysis.
characterized by the lowest mean LAI123 and not
hollows (Table 6). Similar to ‘‘true’’ shrub LAI, the
effect of microform on LAI123 is significant (ANOVA,
p < 0.0001), with LAI123 for the different microforms
significantly different from each other, with the
exception of hollows and lawns.
A possible explanation for the slight differences
between ‘‘true’’ shrub LAI and LAI123 as outlined in
Tables 2 and 6, respectively, is provided in Fig. 7,
presenting the linear correlation between ‘‘true’’ shrub
LAI and LAI123 of Fig. 6 with respect to the
microtopographic position of the individual plots.
Generally, shrub LAI obtained from the LAI-2000
instrument for hollow and deciduous hummock plots
was overestimated, whereas for evergreen hummock
and lawn plots it was underestimated. These tendencies
to over- and underestimate shrub LAI dependent on
microform are most likely related to the different nature
and architecture of the species prevalent in different
microforms as influenced by different heights of the
peatland surface above the water table (Fig. 1).
Contrasting lawns, and evergreen and deciduous
hummocks, we assume that in hollows, LAI123 based
on the LAI-2000 measurement was overestimated.
Besides having the lowest mean ‘‘true’’ shrub LAI, the
shrub canopy in this microform is very sparse, and, thus,
Fig. 7. Linear correlation of ‘‘true’’ shrub LAI and LAI123 with
respect to microtopographic position of the individual plots.
the assumption used in this study of no foliage clumping
effects (i.e., VE = 1 in Eq. (5)) might not be fully valid
anymore.
Another possible source for the observed over- and
underestimation in Figs. 6 and 7 might be related to our
methodology of shadow removal using posterization as
part of the calculation of ‘‘true’’ shrub LAI. Lawns and
evergreen hummocks, both overestimated by ‘‘true’’
shrub LAI, are dominated by C. calyculata, whereas
deciduous hummocks, underestimated by ‘‘true’’ shrub
LAI, are dominated by V. myrtilloides. C. calyculata are
generally characterized by relatively thick leaves
compared to V. myrtilloides. As a result, more shadow
was produced by C. calyculata leaves than by V.
myrtilloides leaves during the scanning process. It
cannot be guaranteed that with the pursued approach of
using posterization for shadow removal, the correct
amount of shadow was captured for both species,
probably resulting in underestimation ‘‘true’’ shrub LAI
for deciduous hummocks dominated by V. myrtilloides
and overestimation of ‘‘true’’ shrub LAI for hollow and
evergreen hummocks dominated by C. calyculata.
4. Conclusion
Two linked characteristic features of ombrotrophic
peatlands that play a fundamental role in their overall
functioning are microtopography and a more or less
continuous shrub canopy. The LAI of the shrub canopy
is studied by adapting an established equation devel-
oped for boreal forest canopies by Chen (1996) and
Chen et al. (1997). Key parameters in the equation are
evaluated for applications to shrubs underlain by
pronounced microtopography in an ombrotrophic
peatland using direct and indirect LAI measurement
techniques. Based on this research, we suggest the
following practice for the application of the LAI-2000
instrument to shrub canopies of ombrotrophic peatlands
(in order of importance):
(I) to
exclude rings 4 and 5 from the post-processingof the LAI-2000 instrument raw data as a means to

O. Sonnentag et al. / Agricultural and Forest Meteorology 144 (2007) 200–212 211
eliminate the combined effect of the microtopo-
graphic position of the LAI-2000 measurement
location and multiple light scattering;
(II) to
account for the contribution of woody canopyelements to light interception by using species-
specific woody-to-total area ratios as provided in
Table 3 (or, in case of shrub species composition
and percent cover similar to the Mer Bleue bog, an
average woody-to-total area ratio of 0.26);
(III) to
calculate shrub LAI from LAIe using Eq. (5)under the assumption of no foliage clumping
effects.
Acknowledgements
This work was supported by the Fluxnet Canada
Research Network funded by the Natural Science and
Engineering Research Council of Canada, the Canadian
Foundation for Climate and Atmospheric Sciences and
BIOCAP Canada. We gratefully acknowledge the help
of Philippe Samson-Toussaint, Nick Phelps, David
Brodkey, and Sam Price in the field. We thank Dr. Ian
Strachan from McGill University for providing us with
the LAI-2000 instrument and Ajit Govind from the
University of Toronto for the fruitful discussions during
the preparation of this manuscript. Dr. Tim Moore from
McGill University is thanked for insightful comments
and suggestions that improved the quality of this
manuscript. We also thank the two anonymous
reviewers for their careful reading and helpful com-
ments on an earlier draft of this manuscript.
References
Barr, A.G., Black, T.A., Hogg, E.H., Kljun, N., Morgenstern, K.,
Nesic, Z., 2004. Inter-annual variability of leaf area index of
boreal aspen-hazelnut forest in relation to net ecosystem produc-
tion. Agr. Forest Meteorol. 126, 237–255.
Breda, N.J.J., 2003. Ground-based measurements of leaf area index: a
review of methods, instruments and current controversies. J. Exp.
Bot. 54, 2403–2417.
Bubier, J.L., Moore, T.R., Crosby, G., 2006. Fine-scale vegetation
distribution in a cool temperature peatland. Can. J. Bot. 84, 910–
923.
Chen, J.M., Black, T.A., 1992. Defining leaf area index for non-flat
leaves. Plant Cell Environ. 15, 421–429.
Chen, J.M., 1996. Optically-based methods for measuring seasonal
variation of leaf area index in boreal conifer stands. Agr. Forest
Meteorol. 80, 153–163.
Chen, J.M., Rich, P.M., Gower, S.T., Norman, J.M., Plummer, S.,
1997. Leaf area index of boreal forests: theory, techniques, and
measurements. J. Geophys. Res. 102, 29429–29443.
Chen, J.M., Govind, A., Sonnentag, O., Zhang, Y., Barr, A., Amiro, B.,
2006. Leaf area index measurements at Fluxnet Canada forest
sites. Agr. Forest Meteorol. 140, 257–268.
Clymo, R.S., 1998. Carbon accumulation in peatland. Oikos 81, 368–
388.
Frolking, S., Roulet, N.T., Moore, T.R., Lafleur, P.M., Bubier, J.L.,
Crill, P.M., 2002. Modeling seasonal to annual carbon balance of
Mer Bleue bog, Ontario, Canada. Global Biogeochem. Cy. 16,
1030 doi:10.1029/2001GB001457.
Gorham, E., 1991. Northern peatlands: role in the carbon-cycle
and probable responses to climatic warming. Ecol. Appl. 1,
182–195.
Hyer, E.J., Goetz, S.J., 2004. Comparison and sensitivity analysis
of instruments and radiometric methods for LAI estimation:
assessments from a boreal forest site. Agr. Forest Meteorol.
122, 157–174.
Jonckheere, I., Fleck, S., Nackaerts, K., Muys, B., Coppin, P., Weiss,
M., Baret, F., 2004. Review of methods for in situ leaf area index
determination—Part I. Theories, sensors and hemispherical photo-
graphy. Agr. Forest Meteorol. 121, 19–35.
Kucharik, C.J., Norman, J.M., Gower, S.T., 1998. Measurements of
branch area and adjusting leaf area index indirect measurements.
Agr. Forest Meteorol. 91, 69–88.
Kußner, R., Mosandl, M., 2000. Comparison between direct and
indirect estimation of leaf area index in mature Norway spruce
stands of eastern Germany. Can. J. Forest Res. 30, 440–447.
Lafleur, P.M., Roulet, N.T., Admiral, S.W., 2001. Annual cycle of CO2
exchange at a bog peatland. J. Geophys. Res. 106, 3071–3081.
Lafleur, P.M., Hember, R.A., Admiral, S.W., Roulet, N.T., 2005.
Annual and seasonal variability in evapotranspiration and water
table at a shrub-covered bog in southern Ontario, Canada. Hydrol.
Process. 19, 3533–3550.
Leblanc, S.G., Chen, J.M., 2001. A practical scheme for correcting
multiple scattering effects on optical LAI measurements. Agr.
Forest Meteorol. 110, 125–139.
Liu, J., Chen, J.M., Cihlar, J., Park, W.M., 1997. A process-based
boreal ecosystem productivity simulator using remote sensing
inputs. Remote Sens. Environ. 62, 158–175.
Maltby, E., Immirzi, P., 1993. Carbon dynamics in peatlands and other
wetland soils regional and global perspectives. Chemosphere 27,
999–1023.
Miller, J.B., 1967. A formula for average foliage density. Aust. J. Bot.
15, 144–151.
Moore, T.R., Roulet, N.T., Waddington, J.M., 1998. Uncertainty in
predicting the effect of climatic change on the carbon cycling of
Canadian peatlands. Clim. Change 40, 229–245.
Moore, T.R., Bubier, J.L., Frolking, S.E., Lafleur, P.M., Roulet, N.T.,
2002. Plant biomass and production and CO2 exchange in an
ombrotrophic bog. J. Ecol. 90, 25–36.
Norman, J., Welles, J., 1991. Instruments for indirect measurements of
canopy architecture. Agron. J. 82, 818–825.
Payette, S., Rochefort, L., 2001. Ecologie des tourbieres du Quebec-
Labrador. Les Presses de l’Universite Laval, Sainte-Foy, Canada.
Planchais, I., Pontailler, J.-Y., 1999. Validity of leaf areas and angles
estimated in a beech forest from analysis of gap frequencies, using
hemispherical photographs and a plant canopy analyzer. Ann. For.
Sci. 56, 1–10.
Roulet, N.T., Lafleur, P., Richard, P.J.H., Moore, T.R., Humphreys, E.,
Bubier, J., 2006. Contemporary carbon balance and late Holocene
carbon accumulation in a northern peatland. Glob. Change Biol.
12, 1–15 doi:10.1111/j.1365-2486.2006.01292.x.
Sonnentag, O., Chen, J.M., Roberts, D., Talbot, J., Halligan, K.Q.,
Govind, A. Mapping tree and shrub leaf area indices in an
ombrotrophic peatland through multiple endmember spectral
unmixing. Remote Sens. Environ., in press.

O. Sonnentag et al. / Agricultural and Forest Meteorology 144 (2007) 200–212212
Tarnocai, C., Kettles, I.M., Lacelle, B., 2000. Peatlands of Canada
Map. Geological Survey of Canada, Open File 3834. Scale 1: 6
500 000. Natural Resources Canada, Ottawa.
Turunen, J., Tomppo, E., Tolonen, K., Reinikainen, A., 2002.
Estimating carbon accumulation rates of undrained mires in
Finland—application to boreal and subarctic regions. Holocene
12, 69–80.
Wheeler, B.D., Proctor, M.C.F., 2000. Ecological gradients, subdivi-
sions and terminology of north-west European mires. J. Ecol. 88,
187–203.