using data to reduce denials presented to aaham md january 17 2014 practical, innovative, medical...
TRANSCRIPT
Using Data to Reduce DenialsPresented to AAHAM MD
January 17 2014
Practical, Innovative, Medical Management Solutions
Changing Denials Landscape
The nature of denials has changed dramatically in the last 5 years
Unsustainable Medical cost increases
More denials From Government programs
Fewer overturns
Increasing cost to appeal
2
Likely Impact of The ACA
Increases in Medicaid eligibility to all individuals with income below 138% of FPL
New enrollees likely to access more care, which may initially result in more denials.
However hospitals will now get paid for portions of what used to be charity care.
Overall earnings impact for hospitals unpredictable.
3

Impact of RAC on Denials
The RAC programs saved CMS 488 Million Dollars net in 2011.
With this success we have seen expansion of additional programs by CMS.
Commercial carriers may take the same
retrospective approach.
End result will likely be more denials
4

Bottom line
Increasing denials will impact net revenue
Appealing denials no longer enough
Hospitals must develop additional strategies to reduce denials
In the form of • Root Cause denials Analysis• Empowering physicians reduce denials
5

Use data to reduce denials
Provide credible, statistically sound data
Identify root cause of denials
Obtain physician leadership Buy in
Engage physicians in groups
Work with physicians to produce solutions.
6
Data Sources
There are numerous different sources of data in the hospital setting
We recommend using denials data for the following reasons
• It is timely and addresses the issue at hand• Immediately available and easy to collect• A steady flow of data enables frequent re-
measurements• It is credible and reliable
7

Type of Data:
Both administrative and clinical Data
8

Data Analysis
We focus our data collection with two main goals in mind.
• Case Management Analysis Actionable data that allows us to better understand the denials
environment, efficiently allocate case management resources and optimally adjust our case management strategy to allow the greatest impact on denials reduction.
• Physician Drivers Understand the physician controlled drivers of denials at a level
that allows physician leaders to work closely with case management to implement sustainable changes that help reduce physician driven denials.
9
Case Management analysis
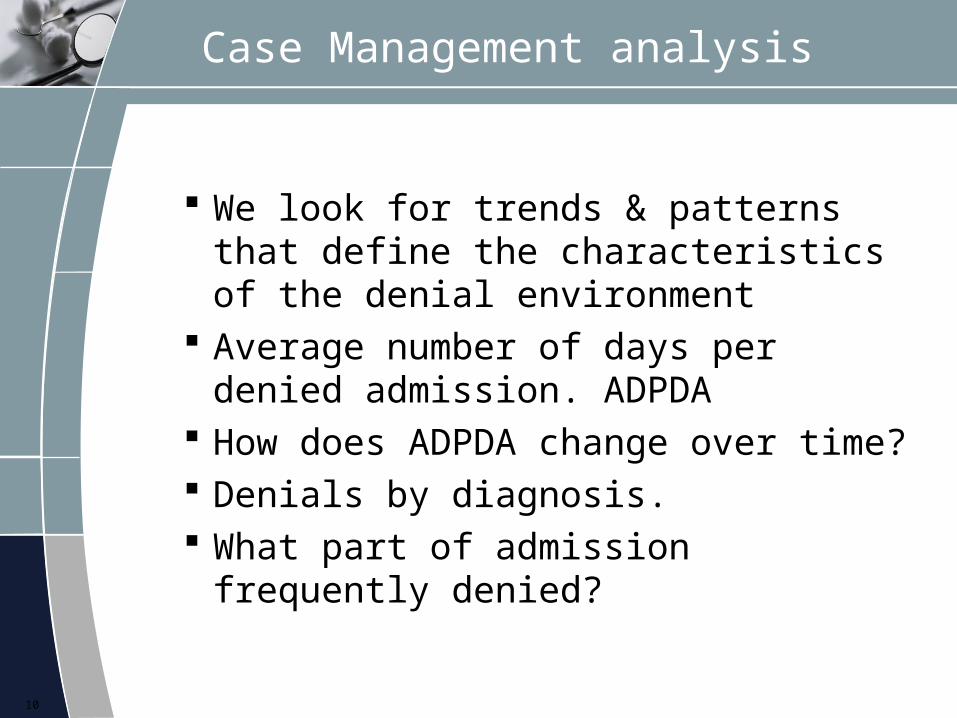
We look for trends & patterns that define the characteristics of the denial environment
Average number of days per denied admission. ADPDA
How does ADPDA change over time? Denials by diagnosis. What part of admission frequently denied?
10
ADPDA
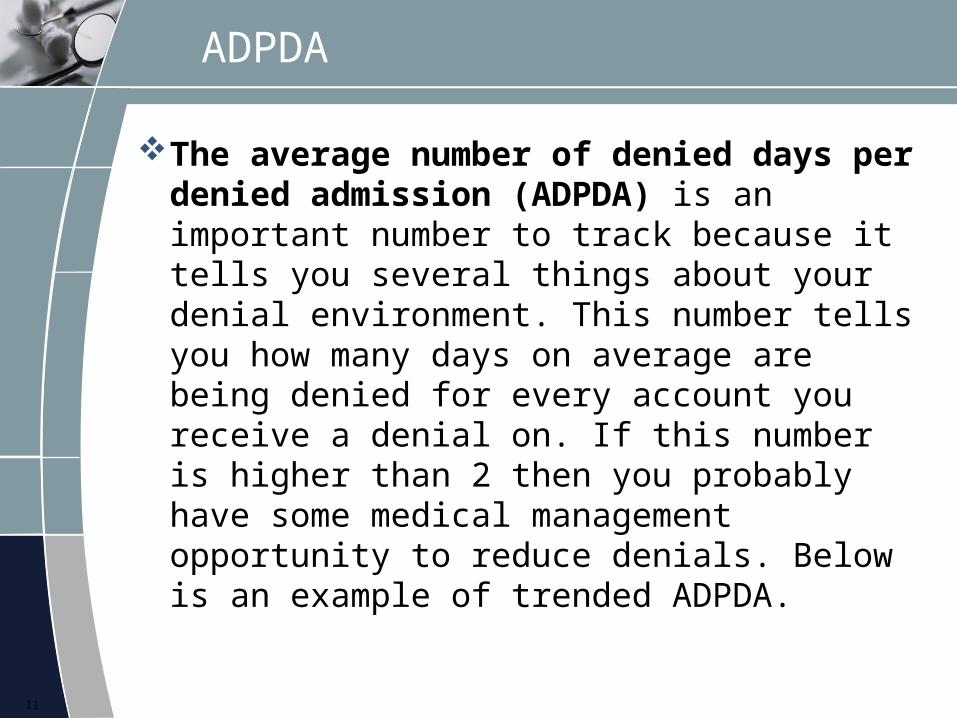
The average number of denied days per denied admission (ADPDA) is an important number to track because it tells you several things about your denial environment. This number tells you how many days on average are being denied for every account you receive a denial on. If this number is higher than 2 then you probably have some medical management opportunity to reduce denials. Below is an example of trended ADPDA.
11
ADPDA
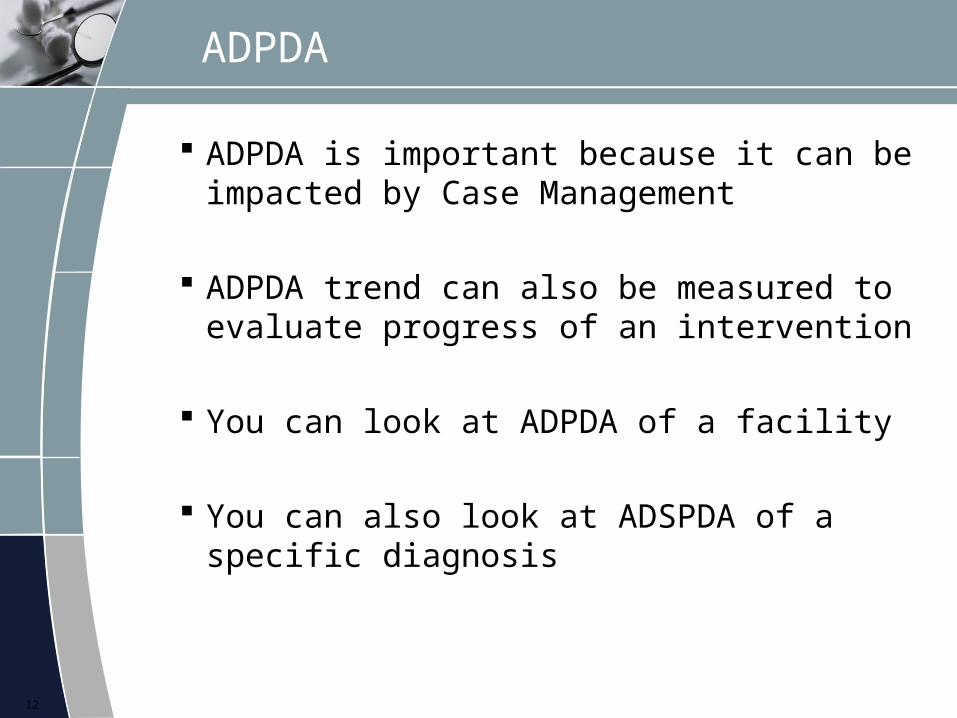
ADPDA is important because it can be impacted by Case Management
ADPDA trend can also be measured to evaluate progress of an intervention
You can look at ADPDA of a facility
You can also look at ADSPDA of a specific diagnosis
12
ADPDA Example
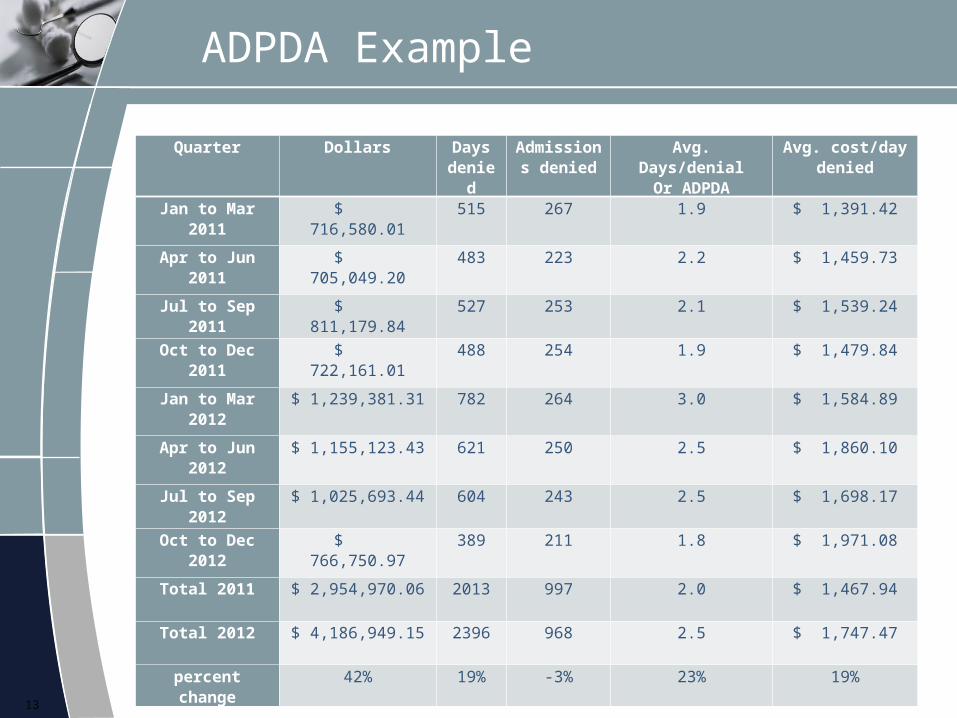
Quarter Dollars Days denie
d
Admissions denied
Avg. Days/denialOr ADPDA
Avg. cost/day denied
Jan to Mar 2011
$ 716,580.01 515 267 1.9 $ 1,391.42
Apr to Jun 2011
$ 705,049.20 483 223 2.2 $ 1,459.73
Jul to Sep 2011
$ 811,179.84 527 253 2.1 $ 1,539.24
Oct to Dec 2011
$ 722,161.01 488 254 1.9 $ 1,479.84
Jan to Mar 2012
$ 1,239,381.31 782 264 3.0 $ 1,584.89
Apr to Jun 2012
$ 1,155,123.43 621 250 2.5 $ 1,860.10
Jul to Sep 2012
$ 1,025,693.44 604 243 2.5 $ 1,698.17
Oct to Dec 2012
$ 766,750.97 389 211 1.8 $ 1,971.08
Total 2011 $ 2,954,970.06 2013 997 2.0 $ 1,467.94
Total 2012 $ 4,186,949.15 2396 968 2.5 $ 1,747.47
percent change
42% 19% -3% 23% 19%
13

ADPDA Example
14
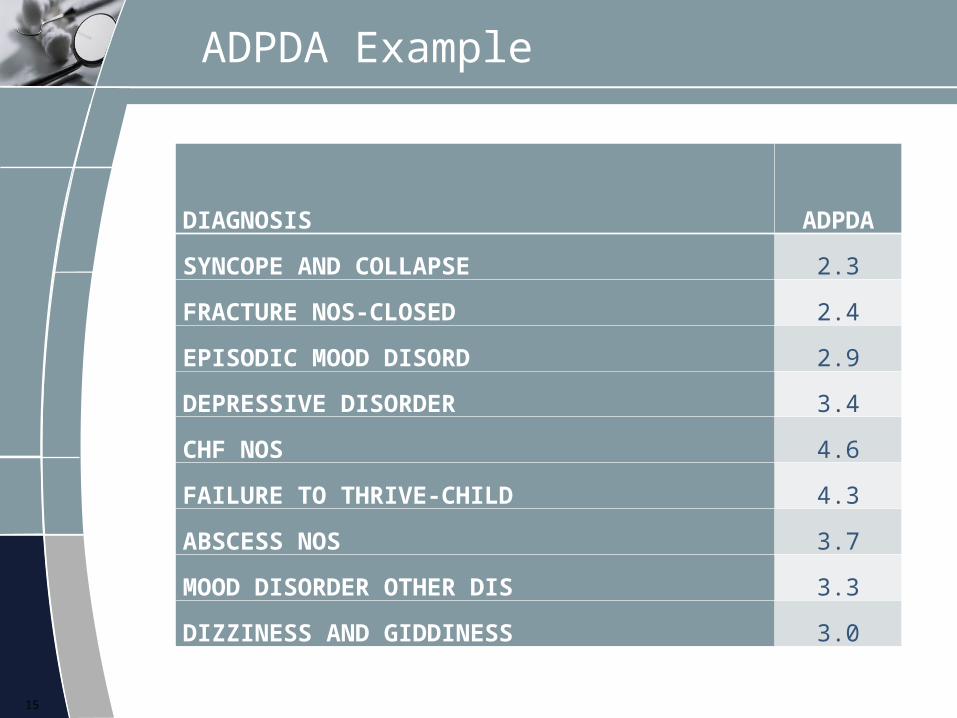
ADPDA Example
DIAGNOSIS ADPDA
SYNCOPE AND COLLAPSE 2.3
FRACTURE NOS-CLOSED 2.4
EPISODIC MOOD DISORD 2.9
DEPRESSIVE DISORDER 3.4
CHF NOS 4.6
FAILURE TO THRIVE-CHILD 4.3
ABSCESS NOS 3.7
MOOD DISORDER OTHER DIS 3.3
DIZZINESS AND GIDDINESS 3.0
15
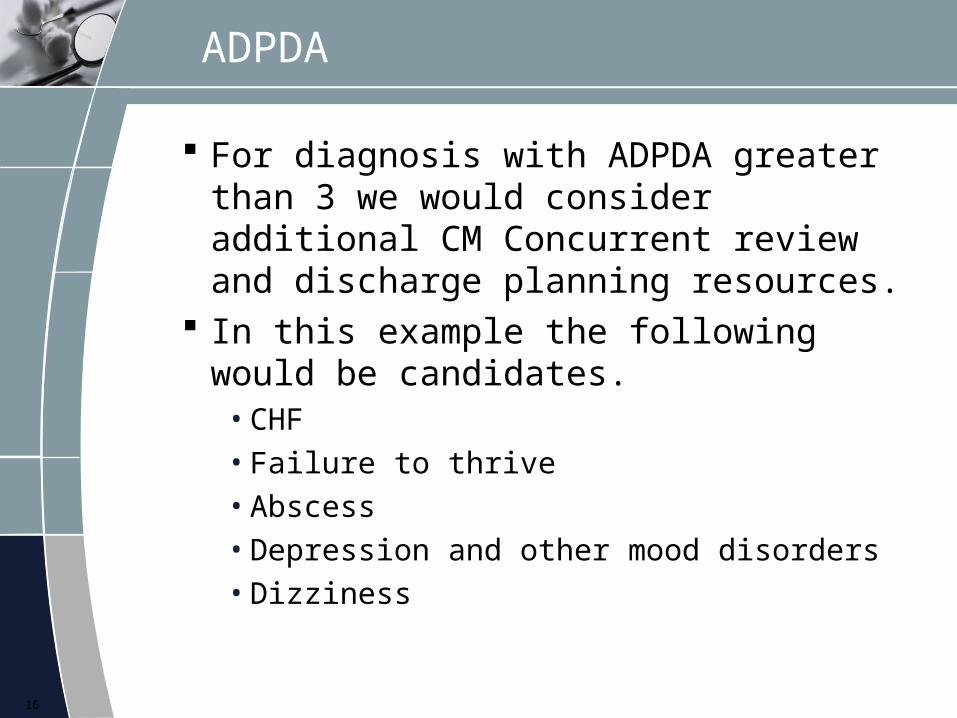
ADPDA
For diagnosis with ADPDA greater than 3 we would consider additional CM Concurrent review and discharge planning resources.
In this example the following would be candidates.
• CHF• Failure to thrive• Abscess• Depression and other mood disorders• Dizziness
16
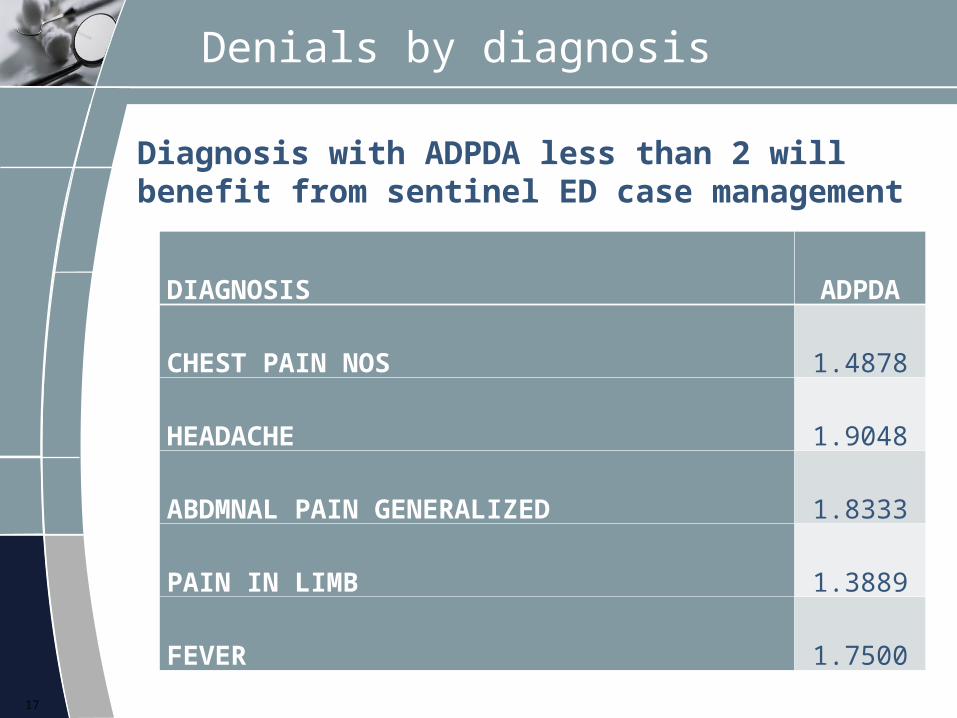
Denials by diagnosis
Diagnosis with ADPDA less than 2 will benefit from sentinel ED case management
17
DIAGNOSIS ADPDA
CHEST PAIN NOS 1.4878
HEADACHE 1.9048
ABDMNAL PAIN GENERALIZED 1.8333
PAIN IN LIMB 1.3889
FEVER 1.7500
Denials by service
1. Identify physician drivers of denials
2. Develop physician driven interventions
3. Track progress through re-measurements
4. Identify and institutionalize successful interventions
18
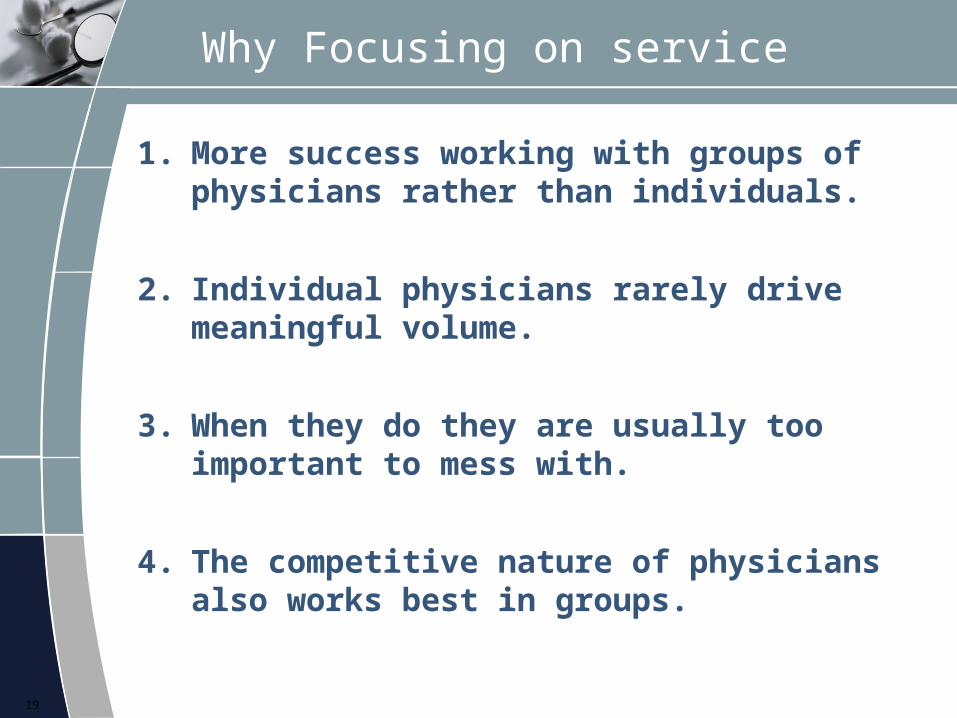
Why Focusing on service
1. More success working with groups of physicians rather than individuals.
2. Individual physicians rarely drive meaningful volume.
3. When they do they are usually too important to mess with.
4. The competitive nature of physicians also works best in groups.
19
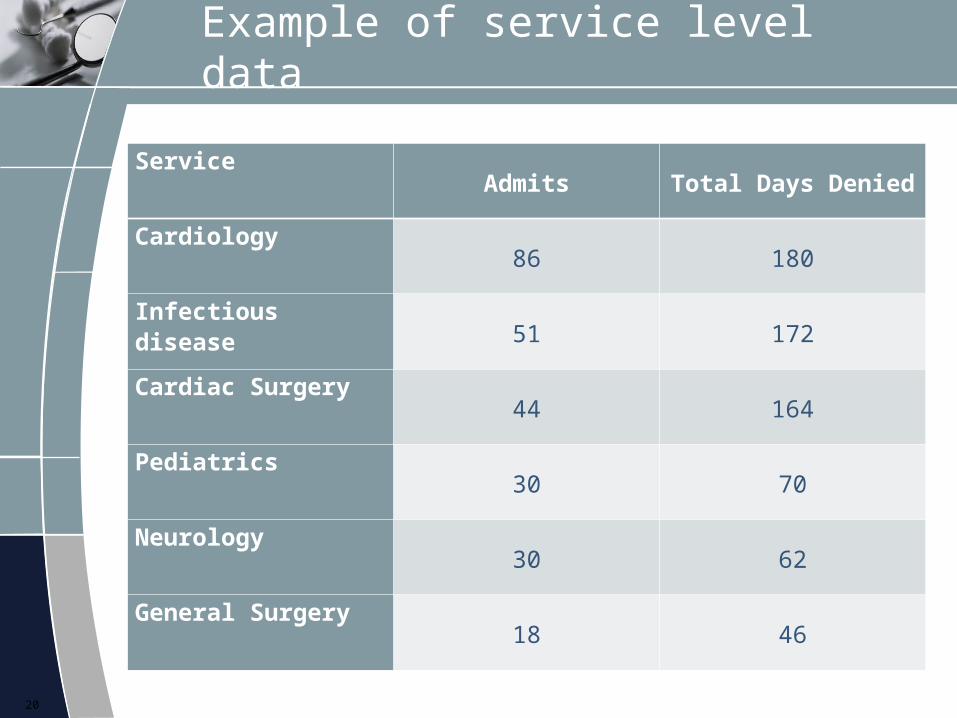
Example of service level data
ServiceAdmits Total Days Denied
Cardiology86 180
Infectious disease51 172
Cardiac Surgery44 164
Pediatrics30 70
Neurology30 62
General Surgery18 46
20

Service analysis
1. Select services with high denials
2. Examine diagnostic trends and LOS
3. Select individual records for review
4. Perform root cause analysis to identify denial drivers
5. Look for actionable solutions
21
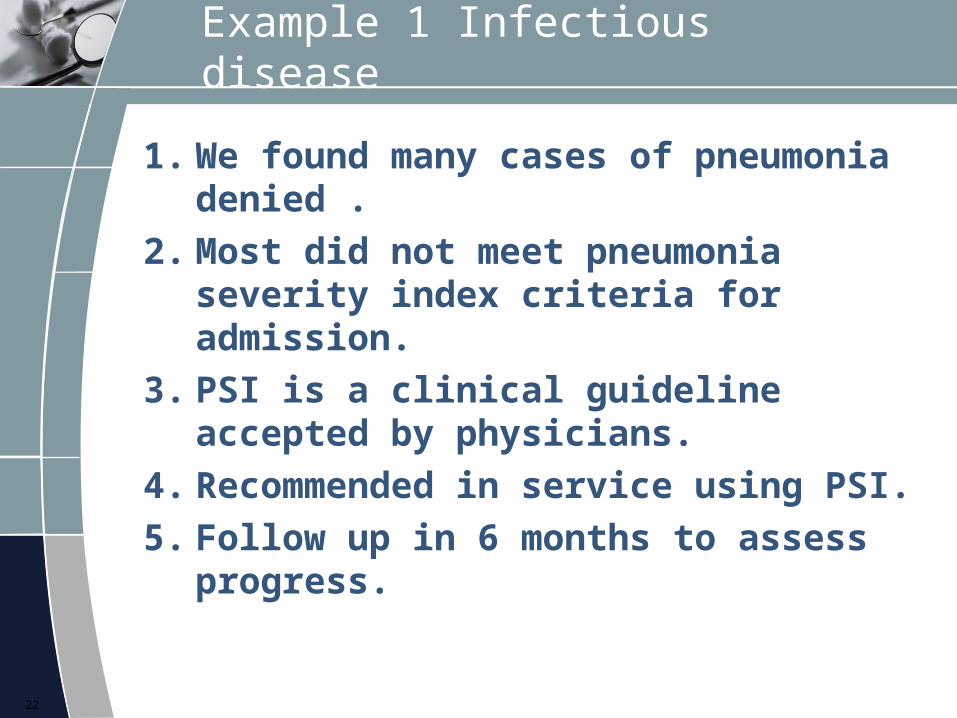
Example 1 Infectious disease
1. We found many cases of pneumonia denied .
2. Most did not meet pneumonia severity index criteria for admission.
3. PSI is a clinical guideline accepted by physicians.
4. Recommended in service using PSI.
5. Follow up in 6 months to assess progress.
22

Example 2 Cardiac surgery
1. We found no particular diagnostic patterns.
2. We did find that many cases were denied in the middle of stay.
3. These were mostly ED admissions not elective cases
4. We found many of the denials were for delay in procedure.
5. Recommended closed CM interaction with Physicians.
6. Follow up in 6 months to assess progress.
23

Example 3 pediatrics
1. We found many denials for constipation.
2. We found many admissions for severe constipation denied
3. No outpatient therapy had been tried
4. Recommended pre-admit screen to ensure OP therapy failed
5. Follow up in 6 months to assess progress
24

Summary
1. High ADPDA helps focus concurrent review
2. Low ADPDA helps focus ED sentinel CM
3. Service analysis help identify specific areas of opportunity
4. Develop interventions5. Re-measure
25

Thank You
We appreciate the Opportunity to present to all of you at the AAHAM Maryland Chapter today.
We realize that with the many changes in Heath care coming this year, Reducing and overturning Medical Necessity Denials is becoming an increasingly important source of revenue recovery.
If you have any questions please feel free to contact us for any reason.
26
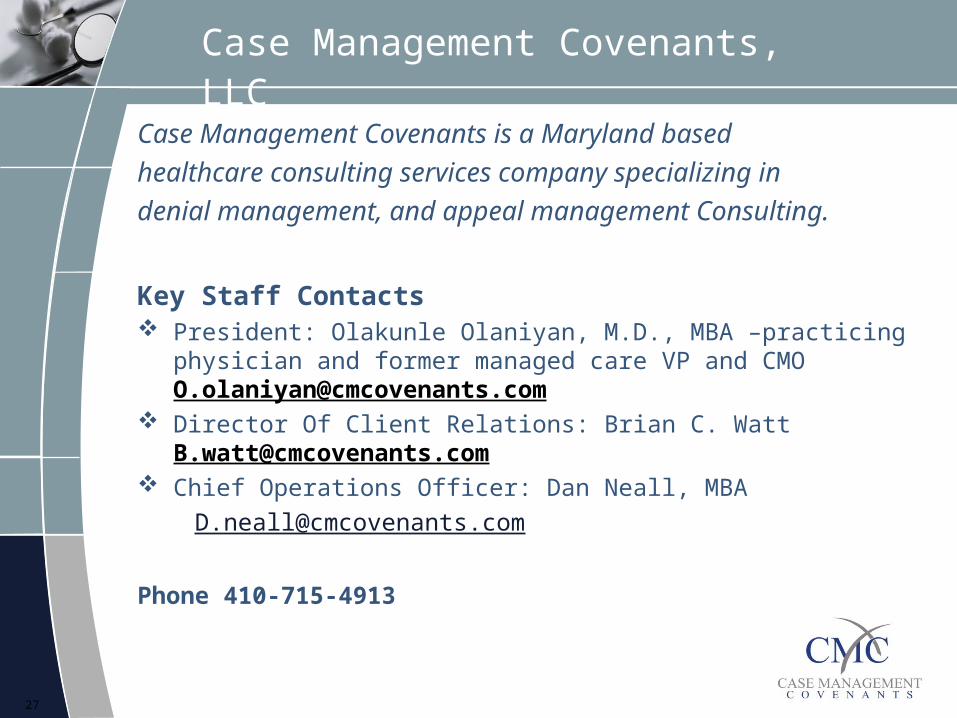
Case Management Covenants, LLC
Case Management Covenants is a Maryland basedhealthcare consulting services company specializing indenial management, and appeal management
Consulting.
Key Staff Contacts President: Olakunle Olaniyan, M.D., MBA –practicing
physician and former managed care VP and CMO [email protected]
Director Of Client Relations: Brian C. Watt [email protected]
Chief Operations Officer: Dan Neall, MBA [email protected]
Phone 410-715-4913
27