using computer simulations in a freshman mechanical
TRANSCRIPT
Paper ID #25113
Using Computer Simulations in a Freshman Mechanical Engineering Courseto Make Informed Design Decisions
Dr. Oziel Rios, University of Texas, Dallas
Dr. Oziel Rios earned his Ph.D. in mechanical engineering from the University of Texas at Austin in 2008where his research focused on design of robotic systems with an emphasis on kinematic and dynamicmodeling for analysis and control. Dr. Rios teaches the first-year and CAD courses in the MechanicalEngineering Department at the University of Texas at Dallas. Dr. Rios has also taught kinematics anddynamics of machines and graduate-level CAD courses. Dr. Rios’ research and teaching interests include:robotics, design, kinematics and dynamics of machines and engineering education.
Dr. Dani Fadda, University of Texas, Dallas
Dr. Fadda is Clinical Associate Professor of Mechanical Engineering. His background includes twodecades of professional engineering practice in the energy industry where he has held numerous positions.Dr. Fadda has worked in product research and developed patented products for chemical, petrochemical,and nuclear applications. He is a professional engineer and an ASME fellow.
c©American Society for Engineering Education, 2019
Using Computer Simulations in a Freshman Mechanical
Engineering Course to Make Informed Design Decisions
Abstract
In this complete evidence-based paper, it will be shown how computer simulations can be
introduced in a freshman mechanical engineering course and how students can use computer
simulations to make informed design decisions. Freshman-level engineering students may have
insights about the workings of mechanical systems even though they may not be versed in the
mathematical descriptions of such systems. The motivation for this work is three-fold: (1) allow
freshman students to apply and expand their insights into mechanical systems without the need
for mathematical descriptions which they may not yet be prepared to understand; (2) expose
students to computer simulations at an early stage of their curriculum to solve engineering
problems; and (3) offer opportunities for team work within the course on a large scale (200+
students) with reasonable resources. This paper shows how the course and computer simulation
activities are set-up and administered and it provides a description of the design activity. Some
samples of student work are provided. Student work is assessed based on their ability to: (1)
specify design goals, (2) describe the design alternatives, (3) list relevant assumptions and
constraints, (4) provide a procedure for using computer simulations to obtain data, and (5) use
simulation data to make design decisions. There are several benefits to the method described in
this paper including allowing instructors to cater to diverse student interests with limited
resources. Specifically, it allows students to expand on course topics easily and meaningfully,
allows students to apply existing knowledge and experience to create something new, motivates
students, and interests them as they prepare for their future engineering courses.
1. Introduction
Modern engineers can make important decisions about the design of complex systems using
computer simulations. When applied properly, simulation results can be leveraged to validate an
engineer's ideas, which can lead to new designs and improved systems. Creating, running, and
post processing basic simulations is possible using Computer-Aided Design (CAD) software, a
desktop computer, and relevant training.
Computer simulations are incorporated into a first-year introductory course in the mechanical
engineering curriculum at the University of Texas at Dallas. Many first-year engineering
students taking this course have insights about the workings of mechanical systems even though
they may not be versed in the mathematical descriptions of such systems. Computer simulations
can help these students make engineering decisions as they compare the numerical results based
on different designs they are considering. More importantly, analyzing simulation results and
errors generated during the simulation process ignites the student’s curiosity to learn engineering

concepts that are covered in an elementary form in this class and in more detail in upper-level
classes. Students are taught the basics of using computer simulations in this class in a team-based
design approach. Past work has shown that incorporating team-based design projects into first-
year engineering courses is beneficial since it increases motivation and improves retention [1-3].
In this work, a computer simulation is defined as a program that accepts inputs and performs
calculations based on a mathematical model of a system with the intent of understanding the
behavior of said system [4-5]. In our freshman-level course, students used SolidWorks three-
dimensional (3D) CAD software to simulate kinematic motion, structural integrity, fluid flow
and heat transfer processes (conduction and convection). These types of computer simulations
are often introduced in courses taken later in a typical mechanical engineering curriculum [6-7]
but we wanted to introduce students to these simulations at the freshman-level to motivate and
inform students in a meaningful way about future engineering courses. Research has also
indicated that computer simulations can be as effective at demonstrating concepts as experiments
since they highlight the important aspects being studied and omit those that are not [8-11]. An
added benefit for instructors is providing an opportunity for team-based work that can be
executed on a large scale (200+ students) with resources available in typical engineering
departments (i.e. a computer lab equipped with CAD software).
The work of Carruthers and Clingan [12] introduces first-year students to Computational Fluid
Dynamics (CFD) simulations to solve an open-ended design problem. They note that even
though students lack the necessary math background and fluid mechanics concepts, and have
never used CFD software before, their students were able to overcome these limitations by being
introduced to the concepts in a basic form and being exposed to guided examples to become
familiar with the CFD environment. In order to reduce the misuse of CFD software by their
students, they provided them a list of problem-solving tactics outlining when to use certain
constraints and when not to trust their CFD solutions. In our work, we follow a similar approach
in that our students are provided a foundational understanding of the concepts bridging their
knowledge from calculus-based physics and being provided guided examples illustrating how to
setup and run various types of simulations. We also minimize the potential misuse of the
simulations by having instructors and Graduate Teaching Assistants (GTAs) oversee the
student’s simulation setup if students express concern or directly ask for help. Additionally, basic
concepts in motion and power transmission, fluids, thermal and energy systems, forces in
structures, materials and stresses are discussed in an elementary level in the introductory book by
Wickert and Lewis [13] while Oakes and Leone [14] provides basic concepts in visualization and
graphics, statics and dynamics, and thermodynamics. Using resources such as these, can help
instructors facilitate the discussion of these concepts – some of which may be new to the first-
year student.

For our freshman course, the Course Learning Outcomes (CLOs) are written so that students
completing the course are able to do the following: (1) explain concepts in mechanical design,
forces and stresses, engineering materials, motion and power transmission, and thermal and
energy systems; (2) develop problem-solving and communication skills; (3) function as a team
on group projects; and (4) explain how continued education and knowledge of contemporary
issues is important for the long-term effective practice of engineering. Team-based, design
activities and projects making use of computer simulations have been important instruments to
assess these CLOs (see ‘Results’).
This paper includes a description of the class and how it is administered, a description of the
design project and its assessment, and samples of student work.
2. Methods
The class is typically taken during the second-semester (Spring), freshman year and focuses on
design-related activities relevant to the mechanical engineering profession including CAD,
forces on structures, thermal energy and fluid systems, and mechanical components [15]. The
class has a 50-minute, weekly lecture attended by all students (200+) and a 1-hour and 40-
minute, weekly lab capped at 50 students. In a typical Spring semester, five labs are offered.
Each lab has one faculty instructor and two GTAs or upper-level Undergraduate Students (UGS)
helping provide frequent, prompt, and constructive feedback as recommended by Ambrose and
Amon [2]. The work performed in the labs is team-based and attendance is taken.
(a) (b)
Figure 1. (a) Motion simulation of a geared mechanism. (b) Thermal analysis simulation of
sphere cooling under forced convection.
Throughout the semester, students work on activities in the lab where they are taught how to
create 3D part and assembly models using SolidWorks [16], how to set-up and run a motion
simulation of a geared mechanism [17] (Figure 1(a)), how to perform force analysis of simple
structures [18], and how to set-up and run a thermal analysis simulation on a sphere being cooled
under forced convection [19] (Figure 1(b)). As previously mentioned, SolidWorks is primarily
used to perform these simulations but Matlab is also used. These activities are used to teach the
students how to properly set-up their simulations. The activities also allow the students to match
the concepts discussed in the lectures with the data they obtain through the simulations. The use
of SolidWorks is taught throughout the semester.
The final design project is an opportunity for the students to further explore any of the course
topics they found interesting. For the project, students are asked to do the following:
select a mechanical system and research it (how it works, how it is modeled, etc.);
model the system in SolidWorks (students can use 3D component models from online
catalogs, e.g. gears, shafts, and bearings);
select one or two design parameters that are significant to the system chosen;
and investigate the effects of modifying the design parameters.
The choice of system is up to the students but they are advised against selecting systems that are
too complex. Students can investigate different fin designs to cool an object, design a small toy
car with a gear train, design a structural component, or design a new tool. Projects are assessed
based on the following criteria:
c1. Design Goals - Describe what you hope to accomplish.
c2. Design Alternatives - Explain what parameters will vary between the design alternatives
considered and which parameters will remain the same.
c3. Assumptions and Constraints - Explain what the limitations of the computer
simulations you will perform are.
c4. Simulation Procedure - Explain how data is obtained.
c5. Design Decision - Select a final design using the simulation data of each of the design
alternatives.
c6. Creativity - Creative application of course topics.
c7. Complexity - Undertaking a challenging simulation or mechanical system.
The assessment results are provided in ‘Results’ below. It should be noted that criterion c6 was
strongly encouraged and, as previously mentioned, criterion c7 was advised against due to time
limitations.
The example provided to the students is presented in Appendix A. This example involves
convective cooling of an object with fins. The aim is to mimic how a computer chip can be
cooled more efficiently.
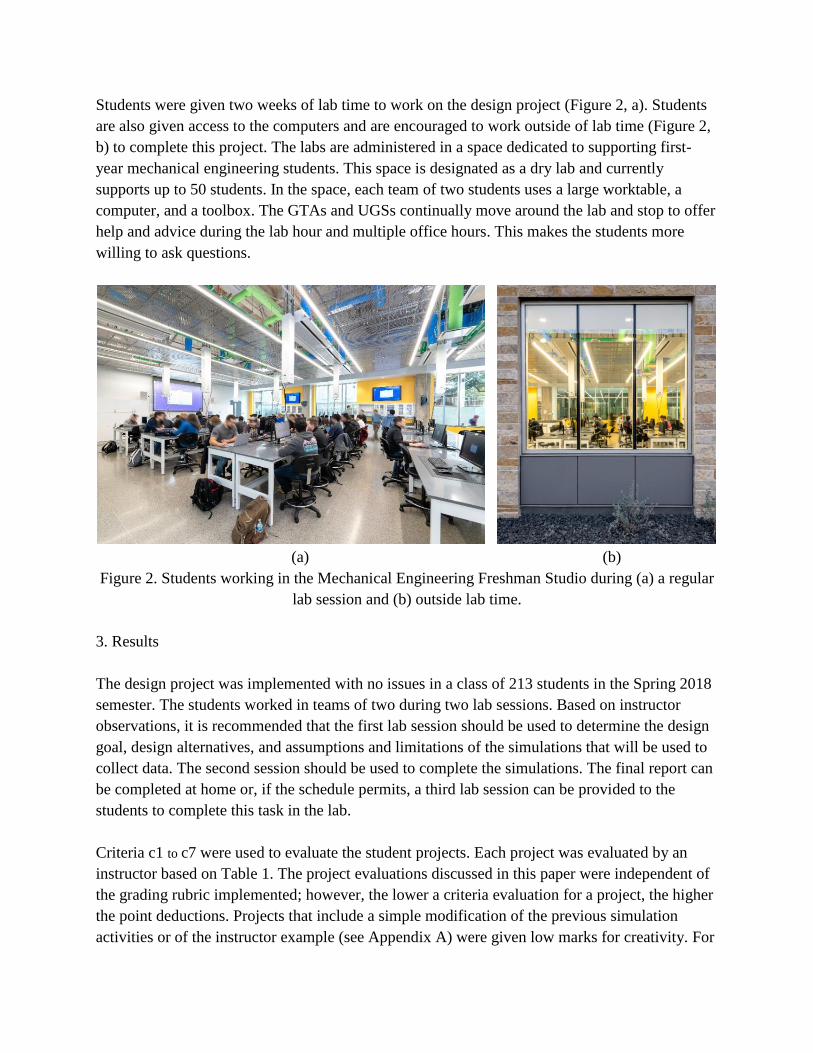
Students were given two weeks of lab time to work on the design project (Figure 2, a). Students
are also given access to the computers and are encouraged to work outside of lab time (Figure 2,
b) to complete this project. The labs are administered in a space dedicated to supporting first-
year mechanical engineering students. This space is designated as a dry lab and currently
supports up to 50 students. In the space, each team of two students uses a large worktable, a
computer, and a toolbox. The GTAs and UGSs continually move around the lab and stop to offer
help and advice during the lab hour and multiple office hours. This makes the students more
willing to ask questions.
(a) (b)
Figure 2. Students working in the Mechanical Engineering Freshman Studio during (a) a regular
lab session and (b) outside lab time.
3. Results
The design project was implemented with no issues in a class of 213 students in the Spring 2018
semester. The students worked in teams of two during two lab sessions. Based on instructor
observations, it is recommended that the first lab session should be used to determine the design
goal, design alternatives, and assumptions and limitations of the simulations that will be used to
collect data. The second session should be used to complete the simulations. The final report can
be completed at home or, if the schedule permits, a third lab session can be provided to the
students to complete this task in the lab.
Criteria c1 to c7 were used to evaluate the student projects. Each project was evaluated by an
instructor based on Table 1. The project evaluations discussed in this paper were independent of
the grading rubric implemented; however, the lower a criteria evaluation for a project, the higher
the point deductions. Projects that include a simple modification of the previous simulation
activities or of the instructor example (see Appendix A) were given low marks for creativity. For

example, one team followed the instructor’s example but looked at different fin shapes instead of
the number of fins. This team worked on an unoriginal design but they were able to draw nice
conclusions from their simulation data and were given high marks for their design decision.
Namely, this team was able to describe how surface area to volume ratio of the fins is important
to consider but shapes having high ratios might be harder to manufacture. An example with high
marks for creativity and making an informed design decision is the coffee pot redesign, which
will be described below. This team conducted good research and applied the thermal simulation
they learned in class in a creative and original manner. The samples of student work provided
later in this section will provide additional examples of students making informed design
decisions.
Table 1. Evaluation of criteria made on a 5-point Likert scale.
Criteria Evaluation
c1. Design Goals 1 – Design goals not presented
5 – Clear description of design goals
c2. Design Alternatives
1 – Not evident what design parameters were considered
5 – Clearly explained all design parameter values including those that vary between
design alternatives and those that are constant
c3. Assumptions and
Constraints
1 – Lacked all assumptions or constraints necessary for their simulation
5 – Clearly described all necessary assumptions and constraints
c4. Simulation Procedure
1 – Not evident how data was collected
5 – Followed assumptions and constraints, and clearly described how data was
collected
c5. Design Decision 1 – Did not make any decision
5 – Able to make a clear design decision based on simulation data
c6. Creativity 1 – Not original; for example, did a simple modification to professor’s example
5 – Students applied course topics in an original and creative way
c7. Complexity 1 – Very simple simulation and mechanical system
5 – Undertook a challenging simulation or mechanical system
Table 2. Statistical analysis of criteria (c1 – c7). Sample size is n=99.
Criteria Average Standard
Deviation
Pearson Correlation Coefficient, p
c1 c2 c3 c4 c5 c6 c7
c1 4.0808 1.0368 - 0.4919 0.1933 0.3202 0.3263 0.3436 0.4815
c2 3.5859 1.1867 - 0.3386 0.3828 0.4777 0.2116 0.3524
c3 3.2828 1.1069 - 0.5205 0.4447 0.2926 0.1154
c4 3.6869 1.3065 - 0.6010 0.2106 0.1925
c5 3.5657 1.3714 - 0.4135 0.5189
c6 3.1010 1.2657 - 0.5952
c7 3.2930 1.3420 -
Table 2 shows the statistical analysis of the seven criteria (c1 – c7). The average and standard
deviation for each criteria are given, as well as the correlation between them. Of particular
interest in this work was the correlation between properly setting up the simulation procedure
and their ability to make an informed design decision (i.e., correlation between criteria c4 and

c5). For this we observed a p=0.6010 indicating a strong positive correlation between these
criteria.
The assessment results for c4 and c5 are plotted in Figure 3. In this plot, the bubble size is
proportional to the number of instances. The data point (c4, c5) = (5,5) occurred 24 times out of
99 projects evaluated (~24%) and correspond to the largest bubble. These projects were deemed
the most successful projects evaluated. An expected trend line is also shown in this figure. The
slope of the trend line illustrates that projects that had issues with the simulation procedure were
also more likely to have issues making an informed design decision.
Figure 3. Design decision vs simulation procedure (p=0.6010).
The assessment results also showed that, overall, students creatively applied the course topics to
challenging problems which indicated a good understanding of the course topics. Their ability to
work in teams to articulate goals, parameters, assumptions, etc. was also an indication of their
problem-solving and communication skills. Overall, the assessment results indicated a mastery
of the course CLOs.
Samples of student work are described next. These samples illustrate the diversity of projects the
students chose to work on.
An example of student work related to thermal energy systems is provided in Figures 4 and 5.
The goal set by the students was to redesign a coffee pot to heat its contents faster. Figure 4
shows 3D solid models developed by the students of a standard coffee pot and heating element
(Figure 4(a)) and their suggested design (Figure 4(b)). Figure 4(a) was used to provide a baseline
for comparison. Figure 5 shows the thermal analysis results of the coffee pot's liquid contents,
which were modeled as a solid for their simulation. One modification the instructors would have
liked to see was to have the students keep the same volume of the coffee pot contents to get a
0
1
2
3
4
5
6
0 1 2 3 4 5 6
Des
ign
Dec
isio
n (
c5)
Ass
ess
men
t
Simulation Procedure (c4) Assessment
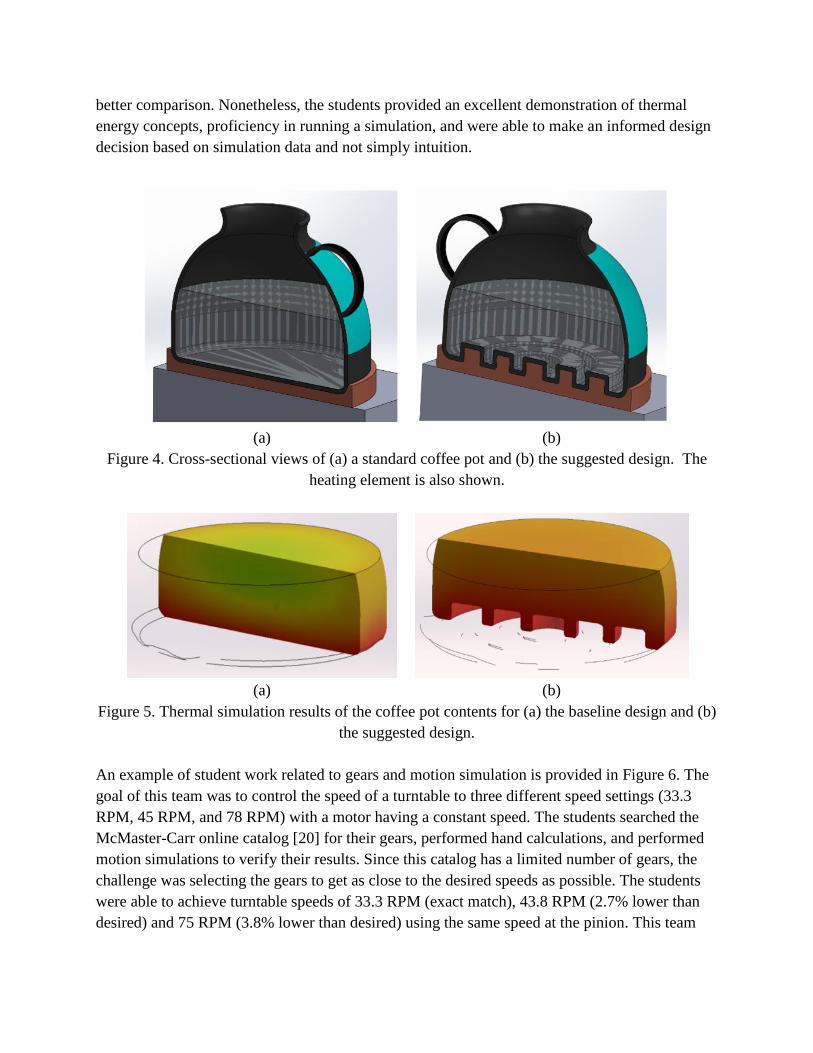
better comparison. Nonetheless, the students provided an excellent demonstration of thermal
energy concepts, proficiency in running a simulation, and were able to make an informed design
decision based on simulation data and not simply intuition.
(a) (b)
Figure 4. Cross-sectional views of (a) a standard coffee pot and (b) the suggested design. The
heating element is also shown.
(a) (b)
Figure 5. Thermal simulation results of the coffee pot contents for (a) the baseline design and (b)
the suggested design.
An example of student work related to gears and motion simulation is provided in Figure 6. The
goal of this team was to control the speed of a turntable to three different speed settings (33.3
RPM, 45 RPM, and 78 RPM) with a motor having a constant speed. The students searched the
McMaster-Carr online catalog [20] for their gears, performed hand calculations, and performed
motion simulations to verify their results. Since this catalog has a limited number of gears, the
challenge was selecting the gears to get as close to the desired speeds as possible. The students
were able to achieve turntable speeds of 33.3 RPM (exact match), 43.8 RPM (2.7% lower than
desired) and 75 RPM (3.8% lower than desired) using the same speed at the pinion. This team
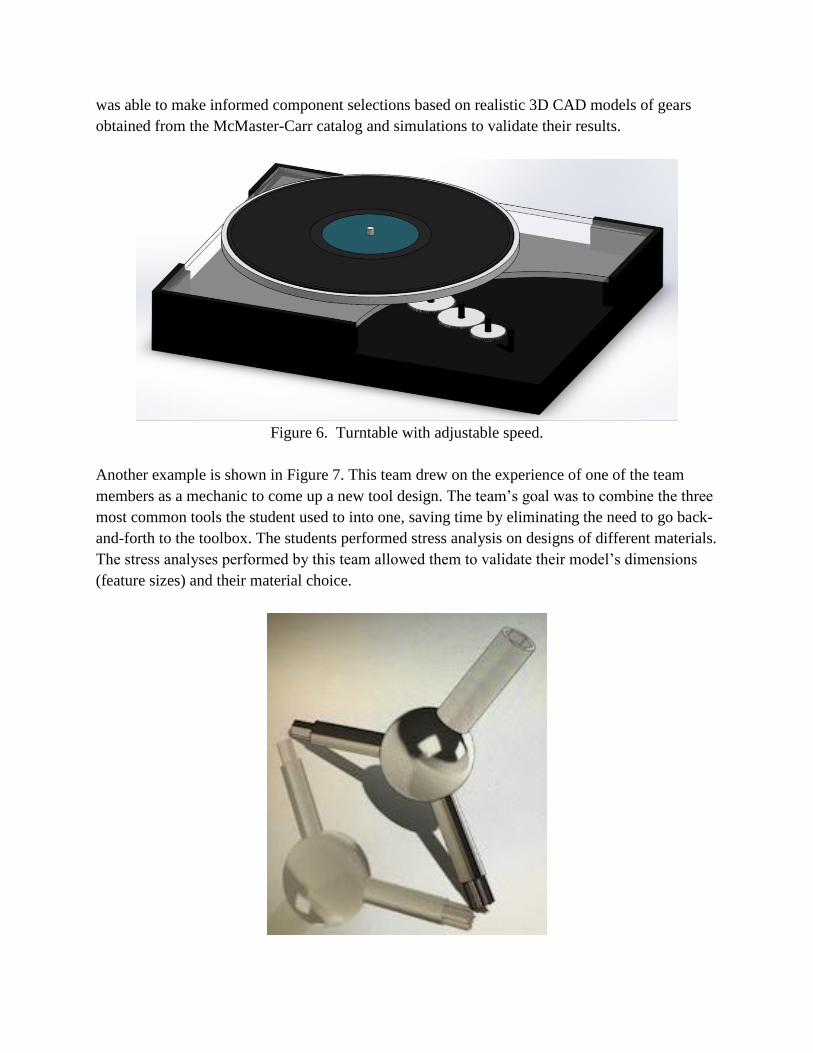
was able to make informed component selections based on realistic 3D CAD models of gears
obtained from the McMaster-Carr catalog and simulations to validate their results.
Figure 6. Turntable with adjustable speed.
Another example is shown in Figure 7. This team drew on the experience of one of the team
members as a mechanic to come up a new tool design. The team’s goal was to combine the three
most common tools the student used to into one, saving time by eliminating the need to go back-
and-forth to the toolbox. The students performed stress analysis on designs of different materials.
The stress analyses performed by this team allowed them to validate their model’s dimensions
(feature sizes) and their material choice.

Figure 7. Multi-purpose automotive tool.
In other design projects, students investigated fluid flow within a pipe with various types of
obstructions, simulated different truss geometries under applied loads, looked at stress and
displacement of different beam designs, simulated planetary gear trains for use in bicycles, and
investigated different koozie designs to keep a beverage cold. Overall, we saw a wide range of
applications making use of the computer simulations they were given as guiding examples,
which was one of our expectations when we introduced this project. However, we also observed
that there were many projects related to the example provided to the students presented in
Appendix A. We saw many variations of this including changing the shape, number, and size of
the fins or of the object that was cooled using the fins.
Another interesting outcome was that the instructors noticed an increase in the number of
questions regarding when – and in which courses – they would see a particular topic again. This
was particularly meaningful to the instructors as important instructor objectives are to get
students motivated, interested, and prepared for their future engineering courses and ultimately
professional careers.
4. Conclusions
In this paper, a design project for a freshman mechanical engineering course based on computer
simulations is described. The project was successfully administered to 200+ students with
limited resources. Throughout the semester, students were given team-based, design activities to
learn how to set-up and run various types of computer simulations in SolidWorks and were
provided with supporting information on the concepts in the lectures. The students applied this
knowledge in their final design project. The topic of the design project was selected by the
students but requirements were specified by the instructors.
Overall, the instructors saw a large variety of projects dealing with machine components, tool
design, fluid flow, heat transfer, and structural design. Students were able to expand on the
course topics in an easy and meaningful manner. Some students applied existing knowledge and
experience to create a new design while others used this opportunity to work on problems they
would see in future engineering courses. Important to all projects was the student’s ability to use
computer simulations and 3D models to make informed design decisions, which was shown
through the statistical analysis of project assessments.
In future work, the authors would like to investigate the long-term effects on student interest.

5. Acknowledgements
The authors would like to thank students Rebecca Choate, Eben Oliver Pfeil, Abhishek Srinivas,
Sai Siddardh Dommeti, William Scott and Dylan Newbery for allowing us to use their models
for this paper. The photographs of the Freshman Design Studio are courtesy of SmithGroup.
6. References
[1] Bates, J. S., "A First Year Course Based on Conceptual Design," Proceedings of the ASEE
Annual Conference and Exposition, Indianapolis, Indiana, 2014.
[2] Ambrose, S. A., Amon, C. H., "Systematic Design of a First-Year Mechanical Engineering
Course at Carnegie Mellon University," Journal of Engineering Education, Vol. 86(2), 1997.
[3] Knight, D. W., Carlson, L. E., Sullivan, J., "Improving Engineering Student Retention
Through Hands-On, Team Based, First-Year Design Projects," Proceedings of the International
Conference on Research in Engineering Education, 2007.
[4] Ha, O., Fang, N., "Computer Simulation and Animation in Engineering Mechanics: A
Critical Review and Analysis," Proceedings of the ASEE Annual Conference and Exposition,
Atlanta, Georgia, 2013.
[5] Wikipedia, https://en.wikipedia.org/wiki/Computer_simulation, Accessed On: 1/30/19.
[6] Aung, K. T., Zhou, J., "Critical Role of Computer Simulations in Teaching and Evaluating
Thermal and Energy System Courses," Proceedings of the ASEE Annual Conference and
Exposition, New Orleans, Louisiana, 2016.
[7] Alexander, D. G., "Computer Simulations Developed to Improve Understanding of
Thermodynamic Principles," Proceedings of the ASEE Annual Conference and Exposition,
Columbus, Ohio, 2017.
[8] De Jong, T., Van Joolingen, W. R., "Scientific Discovery Learning with Computer
Simulations of Conceptual Domains," Review of Educational Research Journal, Vol. 68(2),
1998.
[9] Trundle, K. C., Bell, R. L., "The Use of A Computer Simulation to Promote Conceptual
Change: A Quasi-Experimental Study," Journal of Computers and Education, Vol. 54(4), 2010.
[10] Zacharia, Z. C., Olympiou, G., Papevripidou, M., "Effects of Experimenting with Physical
and Virtual Manipulatives on Students Conceptual Understanding in Heat and Temperature,"
Journal of Research in Science Teaching, Vol. 45(2), 2008.
[11] Campbell, J. O., Bourne, J. R., Mosterman, P. J., Brodersen, A. J., “The Effectiveness of
Learning Simulations for Electronic Laboratories,” The Research Journal for Engineering
Education, Vol. 91(1), 2002.

[12] Carruthers, B. E., Clingan, P. A., “Use of Fluent Software in a First-Year Engineering
Microfluidic Design Course,” Proceedings of the ASEE Annual Conference and Exposition,
Vancouver, British Columbia, 2011.
[13] Wickert, J., Lewis, K., “An Introduction to Mechanical Engineering,” Fourth Edition,
Cengage Learning, ISBN 978-305-63513-5, 2015.
[14] Oakes, W. C., Leone, L. L., “Engineering Your Future: A Comprehensive Introduction to
Engineering,” Eighth Edition, Oxford University Press, ISBN 978-019-934801-5, 2015.
[15] Rios, O. and Fadda, D., "A Mechanical Engineering Activity-Based Freshman Course,"
Proceedings of the ASME IMECE, Tampa, Florida, 2017.
[16] Rios, O. and Fadda, D., "A First-Year Design-Based Activity for Mechanical Engineering
Students," Proceedings of the ASEE Gulf-Southwest Section Annual Conference, University of
Texas at Dallas, Richardson, Texas, 2017.
[17] Rios, O. and Fadda, D., "A Conceptual Design Activity for a First-Year Mechanical
Engineering Course," Proceedings of the ASEE Annual Conference, Salt Lake City, Utah, 2017.
[18] Fadda, D. and Rios, O., "Designing a Scalable Statics Project for a First-Year Mechanical
Engineering Course," First Year Engineering Experience (FYEE) Conference, Daytona Beach,
Florida, 2017.
[19] Rios, O. and Fadda, D., "Introduction to Heat Transfer in a First-Year Mechanical
Engineering Course," Proceedings of the ASEE Annual Conference, Salt Lake City, Utah, 2017.
[20] McMaster-Carr Supply Company (US), Online Catalog, www.mcmaster.com, 2017.
Appendix A
Goal: Determine how long it takes to cool the center of a rectangular object to 300K if it
starts at a uniform temperature of 473K and a fan is blowing air over it. To help cool the
object faster, cylindrical-shaped fins are added to increase the surface area thus increasing the
rate of heat that will be extracted due to convection.
Design Alternatives: The number of fins will be modified to determine the effects on the
time it takes to cool the center of the object. The time to cool will be determined for 0, 12,
20, 28, and 32 fins. The alternative with 0 fins becomes the baseline to compare the other
alternatives. The size of the rectangular object and each individual fin will remain constant.
Additionally, the material (aluminum 1060), the convection coefficient (40 W/m^2-K), the
initial uniform temperature of the object (473K), and the ambient temperature of the air
(273K) will also remain constant.
Assumptions and Constraints: The object is a rectangular shape (1 inch by 0.5 inch by 0.2
inch) and fins are cylindrical (0.05 inch diameter by 0.2 inch length). The entire object
(rectangle and fins) is made of a single material. The object does not have any internal

sources of heat. The SolidWorks thermal simulation parameters are as follows: 600 seconds
total simulation time, 10 second time step, and default mesh settings.
Procedure: The following steps are taken to collect necessary information.
1. Create a 3D SolidWorks model of the object with 0 fins.
2. Run thermal simulation and determine the time to cool. Figure 8 shows how the
center of the object cools over time and the temperature distribution of the object.
3. Modify the 3D model to 12 fins and repeat Step 2.
4. Repeat Step 3 for 20 fins, 28 fins, and 32 fins.
5. Plot time to cool versus the number of fins (see Figure 9).
Design Decision: Based on the results shown in Figure 9, we see diminishing returns with
the number of fins and after 28 fins there is no significant change in the time it takes to cool
the center of the chip. Our final design would have 28 fins.
(a) (b)
Figure 8. (a) Plot of maximum temperature of the object versus time for the case of 12 fins.
Maximum temperature occurs at the center of the computer chip. (b) Temperature distribution
over the object for the case of 12 fins. Through conduction, heat is transferred from the center of
the object to the fins.
Figure 9. Plot of cooling time versus number of fins.