using claim department work measurement systems to determine claim
TRANSCRIPT

Using Claim Department Work
Measurement Systems to Determine Claim
Adjustment Expense Reserves
By
Joanne S. Spalla, FCAS, MAAA

ABSTRACT
Using Claim Department Work Measurement Systems to Determine Claim Adjustment
Expense Reserves
This paper will discuss a methodology for establishing reserves for the portion of loss adjustmentexpense associated with the cost of claim adjusters. These costs are a substantial component ofthe expenses traditionally defined as unallocated loss adjustment expense (ULAE). The actuarialliterature contains very little material on how to estimate ULAE reserves. The most commonmethods are variations on the calendar year paid-to-paid methodology. The literature brieflymentions "transaction-based" methods that require claim department time studies. However,these methods are dismissed as too complex to perform. Fortunately, it is no longer necessary tosit with a stopwatch at a claims adjuster's desk to perform a time study. Most claim departmentsof major insurance carriers and third party administrators now utilize sophisticated automatedwork measurement tools. Many of these automated systems capture the type of data that can beused to perform an automated time study.
In her paper entitled, "A Methodology for Pricing and Reserving for Claim Expenses in WorkersCompensation,” Kay Rahardjo described the application of claim department workload standardsin determining the indicated ULAE reserve for Workers’ Compensation claims. This paper willdescribe in detail how these claim standards can be developed using claim department automatedwork measurement tools.
The first section will describe a process that can be used to perform the work-study. The paperwill include a discussion of the technical and practical issues in conducting such a study. Thesecond section will show how the results of the study can be utilized to determine claim adjusterexpense reserves. Other potential applications of the claim standards will be discussed, includingpricing unbundled claim service, allocating claim department expense to line of business forstatutory and management reporting purposes, and monitoring claim department expenses.Recent changes in the NAIC definition of loss adjustment expense are also discussed in the paper.

Introduction
This paper will discuss a methodology for establishing the estimated liability for the portion of
loss adjustment expense associated with the cost of claim adjusters. Common techniques that are
used to determine these liabilities will be discussed at the beginning of this paper. The paper will
then describe an alternative method of estimating these costs, using a claim department work-
study. The study utilizes an automated work measurement system to determine a standard cost of
handling different types of claims. The paper will then describe how these claim standard costs
can be used to determine outstanding liabilities for claim adjuster expense. Other applications of
the study will be described in the final section.
Definition of Loss Adjustment Expense
Before discussing how to determine a reserve for claim adjuster expenses, it is first necessary to
review recent changes in the definition of loss adjustment expenses. Claim adjuster expenses have
been included in the traditional definition of unallocated loss adjustment expense (ULAE). In the
past, there had been some inconsistency in the distinction between allocated and unallocated loss
adjustment expenses. Part of the confusion resulted from the common assumption that the term
“allocated” refers to expenses that could be identified with a specific claim file. Companies
utilizing different business procedures to settle claims may have had different definitions for
unallocated and allocated loss adjustment expense. This issue was further complicated because
different definitions were used for statistical reporting.
To increase the consistency of reporting between insurers, the Casualty Actuarial (Technical)
Task Force (CATF) recommended to the NAIC’s Accounting Practices and Procedures (EX4)
Task Force that a revised LAE definition be adopted.1 The Accounting Practices and Procedures
Task Force adopted the change effective January 1, 1998. The task force’s objective was
consistent reporting of expenses related to defense, litigation and medical cost containment
1 Casualty Actuarial (Technical) Task Force, “Clarification of Revised ALAE Definition,” 6/24/97 Draft

regardless of whether a company uses its own employees or hires outside firms. To eliminate any
confusion arising from the association of the term "allocated" with the ability to assign expenses
to a specific claim, the NAIC recently approved a Blanks Proposal to change the titles in the 1999
Annual Statement.
Under the revised rules, the ability of an insurer to assign expenses to a specific claim no longer
determines how it is classified. Defense, litigation and medical cost containment expenses—both
internal and external—are now assigned to “Defense & Cost Containment;” the remaining
expenses associated with adjusting and recording claims are assigned to “Adjusting & Other.”
Specifically, Defense & Cost Containment (DCC) now includes:
(i) Surveillance expenses;
(ii) Fixed amounts for medical cost containment expenses;
(iii) Litigation management expenses;
(iv) Loss adjustment expenses for participation in voluntary and involuntary market pools if
reported by accident year;
(v) Fees or salaries for appraisers, private investigators, hearing representatives, reinspectors
and fraud investigators, if working in defense of a claim, and fees or salaries for
rehabilitation nurses, if such cost is not included in losses;
(vi) Attorney fees incurred owing to a duty to defend, even when other coverage does not
exist; and
(vii) The cost of engaging experts.

Adjusting & Other is now defined as those loss adjustment expenses other than the Defense &
Cost Containment expenses as defined above. Adjusting & Other expenses include the following
items:
(i) Fees of adjusters and settling agents;
(ii) Loss adjustment expenses for participation in voluntary and involuntary market pools if
reported by calendar year;
(iii) Attorney fees incurred in the determination of coverage, including litigation between the
insurer and the policyholder; and
(iv) Fees or salaries for appraisers, private investigators, hearing representatives, reinspectors
and fraud investigators, if working in the capacity of an adjuster.
The claim department expense study discussed in this paper will focus on the first item in the
above definition of Adjusting & Other expenses. These costs, which comprise the largest portion
of Adjusting & Other, will be referred to as “claim adjuster expenses” throughout the paper.
Provisions for the other items included in the definition of Adjusting & Other must be calculated
independently and added to the adjuster reserves determined by the methodology discussed in this
paper.
Summary of Common Reserving Methods
The actuarial literature contains very few techniques for determining the outstanding liabilities for
what has traditionally been called unallocated loss adjustment expense or ULAE. The existing
techniques fall into three categories:
• Paid-to-Paid Methods
• Methods Based on Claim Reporting and Closing Patterns (The Johnson Method)
• Transaction-Based Methods
The Paid-to-Paid Method—as well as its shortcomings—has been described in detail in the
actuarial literature. Under this method, the historical ratio of calendar year ULAE payments to
calendar year paid losses is calculated. The ULAE reserve is then determined by applying 100%
of this ratio to the IBNR reserve and 50% of this ratio to the Case reserve. This methodology is
based on the assumption that 50% of the ULAE is paid when a claim is opened and the remaining
50% of the ULAE is paid as losses are paid. It also assumes that the IBNR reserve only provides
for pure IBNR claims.
Several authors (Kittel2 and Johnson3) have pointed out the shortcomings of the assumptions
underlying this method. In particular, the use of a calendar year ratio will either understate or
overstate the ULAE reserve in a changing claims environment. For example, if a line of business
is growing, this method will understate the reserve. Similarly, if there is a change in the claim
reporting and settlement pattern, this method will fail to produce the correct reserve. In addition,
this method assumes that ULAE will inflate at the same rate as losses. Finally, this method
assumes that the underlying loss reserves are adequate. It should be noted that the distortions in
this method would be magnified for long-tailed lines of business.
The Johnson Method overcomes many of the problems associated with the traditional paid-to-
paid methodology. The first step in this method is to calculate historical average ULAE expense
per weighted open claim. The number of claims open at future year-end points is then projected
based on claim reporting and settlement patterns. Finally, the ULAE reserve is calculated by
multiplying the number of open claims by the trended average expense.
By relating calendar year ULAE to claim counts, Johnson recognizes that ULAE payments are
not necessarily tied to loss payments. The ULAE reserve calculated by the Johnson method is
also independent of the adequacy of the underlying loss reserves. In addition, the method is
responsive to changes in exposures and inflation.
2 Kittel, John, “Unallocated Loss Adjustment Reserves in an Inflationary Economic Environment,” Casualty
Actuarial Society Discussion Paper Program, Casualty Actuarial Society, Arlington, Virginia, May 1981, p. 311.
3 Johnson, W. A., “Determination of Outstanding Liabilities for Unallocated Loss Adjustments Expenses,” PCAS
LXXVI, 1989, pp. 111-125.

While the Johnson method overcomes many of the shortcomings of the classical paid-to-paid
methods, it has a major limitation: the technique is dependent on the allocation of ULAE to line of
business. As Johnson notes:
One of the problems with unallocated loss adjustment expenses is that it is difficult to test
one’s assumptions about them because expenses by definition are generally hard to
allocate and therefore hard to track. The only real way that comes to mind to test
assumptions would be to conduct a claim expense study, such as a time and motion study,
which establishes artificial expense allocation procedures for a temporary time period.4
The allocation of calendar year ULAE to line may not be an issue for a company writing only a
single line of business or for a company that has fully dedicated claim staff for each line.
However, it can be a significant issue for insurance companies that utilize multi-line claim offices.
Any distortions from a misallocation of calendar ULAE will, in turn, distort the average ULAE
used to estimate the reserve. In her paper, Johnson uses a growing book of medical malpractice
business in a single state as an example. She notes that the dramatic annual 17.4% trend in the
calendar year average ULAE was surprising. Johnson does not describe the company that
generated the data in the example or the methodology used to allocate calendar year ULAE to
line of business and state. It is, therefore, not possible to determine if the increase in calendar year
ULAE was due to the calendar year allocation methodology. However, this example illustrates
the reliance of Johnson’s technique on the calendar year ULAE allocation methodology.
Johnson, among other authors, has acknowledged that the only way to accurately determine the
true cost of handling various types of claims is to conduct a claim department work-study.
However, all of these authors dismiss a time study as impractical. In the past, such a study would
have been very time-consuming. It would have involved literally standing over a claim adjuster’s
desk armed with a stopwatch or requiring claims adjusters to track every minute of their time.
Fortunately, today’s modern technology offers a more efficient and accurate way of conducting
such a study.
4 Johnson, p. 113-114.

Overview of Claim Department Expense Study
Big Brother is Watching
Most modern claim departments utilize automated claim systems. Claim representatives use these
systems to perform the various functions involved in the claim process, such as opening claims
and making payments, as well as adding notes and composing correspondence. In fact, much of
an inside claims representative’s day is spent at the computer. Many of these systems capture the
individual transaction detail, along with the duration of time spent on each type of activity. This
data will often identify the claim staff position performing the task, as well as the claim generating
the activity. Multiplying the duration of activity for each transaction times the average hourly
cost of the claim position performing the task yields the cost of performing the transaction. The
sum of all the transaction costs is then divided by the number of claims to determine the cost of
handling a claim.
Claim Data Utilized in the Study
The data that is available in the claim system varies by company. Hence, the design of the claim
department study will be governed by the data captured in the system. The data used for the
claim study in this paper is discussed below.
Claim data identifies the individual claim that generated the activity:
• Claim Symbol - identifies the coverage that generated the claim.
• Claim Office - identifies the branch office that is handling the claim.
• Age of Claim - The automated work measurement system utilized in our claim study
classified claims into four age classifications:
(i) Intake - this category represents the work that is performed in the first 30 days of the
claim

(ii) Outstanding 31-90 Days (OS1) - this category represents the work that is done in
the next 60 days in the life of the claim
(iii) Outstanding >90 Days (OS2) - this category represents the work that is done on
claims that are over 90 days old. For Workers' Compensation, this category excludes
claims that are older than 60 months, which were handled separately.
(iv) Outstanding >60 Months (OS3) - this category, which was only utilized for
Workers' Compensation, represents the work that is done on claims that are over five
years old. For the sake of simplicity, the calculation for this category is not illustrated
in this paper.
The choice of these claim categories was governed by the claim system that we used to perform
the study. Other classifications could be used. For example, we considered adding a category for
claim settlement to reflect the work to close a claim. However, we decided not to do so when we
learned that the claim file may not be officially closed in the month in which the claim actually
settled. Claims may be kept open until all the final bills have been paid and any recoveries (such
as salvage, subrogation and second injury funds) have been collected. For this reason, the work in
the final month the claim is open may not accurately reflect the work associated with settling a
claim.
When undertaking a claim work-study, it is important to understand how the claim system counts
claims. Some claim systems count all the claimants from an occurrence as a single claim, while
other systems create individual claim files for each claimant and coverage. For example, an
automobile accident may generate one or more bodily injury claims, a property damage liability
claim and a physical damage claim. Another consideration is how reopened claims are handled—
some systems utilize the original claim number, while others create a new claim.
Policy Data identifies the business unit that wrote the policy that generated the claim. Depending
on the business needs of the organization, the following level of detail may be included in the
claim study:

• Regional Office
• Risk State
• Market Segment
In a multi-line insurance company, the claim study may distinguish between personal and
commercial business. A company writing commercial lines may wish to further distinguish
between small commercial, middle market and large national account policies if it is felt that the
cost of handling these claims are different. For the same reason, the company may wish to
separately identify assigned risk claims. In our study, we found that large national account
policies required less handling time than standard business. It was believed that this was because
large accounts normally have a large volume of claims. These accounts typically have a risk
management department with defined claim reporting procedures that assists in the claim process
by gathering the necessary information and providing it to the claim adjuster. Smaller accounts
have very few claims, and therefore are less experienced in settling claims. Assigned risk claims
were found to have the highest claim adjuster costs.
Work Measurement Data is the basis for the cost of handling the claim. We utilized the
following information from our claim system.
• Type of Transaction - this data element identifies the type of activity on the claim file.
Examples of transactions include creating a claim, making a payment, and adding notes to the
file.
• Claim Position - this data element is the job classification of the claim representative that
performed the activity on the claim. Examples of job classifications used in our study are
shown in Exhibit 1.
• Duration of Transaction - This item measures the length of time expended performing a
task.

Claim Expense Data is required to determine the cost of handling each transaction. To estimate
these costs, it was necessary to collect salary data by claim position, as well as other expenses
such as benefits, rent, automobile, travel, etc.
Steps in Performing a Claim Department Study
The steps involved in performing a claim department study are summarized below:
1. Collect Duration of Claim Transactions by Claim Position
2. Determine Raw Costs by Multiplying Durations by Average Costs for Each Claim Position
3. Load Standards for Unrecorded Time
4. Divide Costs by Claim Volumes to Determine Average Cost
5. Load Standards for Other Field Office Claim Overhead Not Captured in the Work Study
6. Load Standards for Home Office Claim Adjustment Expense Overhead
Each of the above steps will be discussed in more depth in subsequent sections using Workers’
Compensation Lost Time claims as an example. Because Workers’ Compensation claims with
lost work time have very different characteristics than medical only claims, we chose to calculate
separate standards for each category.
It should be noted that the data in the exhibits have been disguised to preserve confidentiality.
Step 1: Collect Duration of Claim Transactions by Claim Position
Exhibits 2 through 5 are each divided into three sections representing the three age categories in
the study: intake, outstanding from 31-90 days, and outstanding from 90 days to 60 months.
Exhibit 2 displays the number of hours recorded in the claim system for each of the job positions
that handled Workers’ Compensation lost time claims during the study. The number of claims
handled in each category is shown at the bottom of each section. For example in Office #1, Inside
Claim Representatives spent a total of 387.5 hours handling the intake of 585 lost time claims.
Other positions, including Outside Claim Representatives, Clerical, Claim Processors and the
Supervisors, also worked on these claims. The system recorded a total of 825.8 hours of staff
time handling lost time claim intake in this office. During the same time period, there were 996
open claims that were between 31 and 90 days old in Office #1. The system recorded a total of
554.6 hours handling these claims. Finally, 1,879.3 hours were captured for the 4,600 claims that
were between 90 days and 60 months old.
It should be noted that several positions—such as a supervisor, claim representative and clerical
staff—perform activities on a single claim. At the same time, there are many claims that do not
have any activity on them in the month. The standard that we are calculating represents the
average monthly cost of handling an open claim.
Step 2: Determine Raw Recorded Costs by Multiplying Durations by Average Salaries
In Exhibit 3, the average hourly cost of the position handling the claim is multiplied by the
duration of the task to determine the total cost. For example, the average hourly cost of an Inside
Claim Representative is $29.95. This hourly cost is multiplied times the 387.5 hours spent
handling intake claims to get a cost of $11,607 for Office #1. The costs are calculated similarly
for the other job categories.
Exhibit 1 shows the calculation of the average hourly cost. The hourly cost is based on 50 weeks
per year at 36 ¼ hours per week for each staff position. For our study, we use countrywide
average salary levels for each position, loaded for benefits and other expenses. The use of
countrywide salary levels reduces the bias from using a sampling of claim offices. Benefits are
loaded as a flat 30% of salary. Other expense categories, such as rent and furniture and
equipment, are allocated to position. Certain categories, such as automobile expense, should only
be allocated to the job categories that generate those expenses. Depending on the nature of the
expense categories, the allocations may be based on salaries, headcount or any other reasonable
basis for allocation.
When we performed our study, we found that the system captured a sufficient proportion of time
at the individual claim level for only five positions (Inside Claim Representative, Outside Claim
Representative, Clerical, Supervisor and Claim Processor). We chose to include only those
positions in the work-study. These positions accounted for 64.3% of the total claim field costs.
The costs for the remaining positions will be reflected in a Field Office Overhead Factor,
discussed later.
Step 3: Load Costs for Unrecorded Time
The average costs determined above must be adjusted to reflect the fact that 100% of work time
is not recorded in the claim system for the positions in the study. Exhibit 4 shows the time that
was captured in the claim system for each position in Office #1 during the four-month study
period. The number of available hours is equal to the staff count times the number of work hours
during the study period. The number of hours recorded at the claim level reflects the time that is
spent working on a specific claim. Examples of time that is not recorded at the claim file level
include absence and vacation time, training and customer service. Note that the percent of time
recorded at the claim level varies significantly by the type of position. The system captures the
largest proportion of time for Claim Processors. On the other hand, only 28.9% of clerical time
can be recorded to specific claims. The proportion of time recorded is summarized for each
position and office at the bottom of Exhibit 4.
To adjust for the time that cannot be allocated to specific claims, the costs determined in Exhibit 3
are grossed up by dividing the cost by the percent of time recorded for each position in each
office. The “Grossed-Up Costs” are displayed in Exhibit 5. For example, the $11,607 of costs
for Inside Claim Representatives in Office #1 is divided by the 66.6% time recorded to obtain a
grossed-up cost of $17,428. In using a factor to gross up the costs, we are allocating unrecorded
time for each claim in the same proportion as the recorded time.
Step 4: Determine Average Costs by Claim Category
The calculation of the average costs for Workers’ Compensation lost time claims for each of the
claim categories is displayed at the bottom of each section in Exhibit 5. For each of the age

categories, the average cost was calculated by dividing the grossed-up costs for all offices by the
number of claims that were handled in the age category during the study period. Dividing the
total intake costs of $273,505 by the claim intake of 2,645 yields a preliminary standard of
$103.40 for handling a lost time claim intake. This standard represents the average cost that is
incurred on a lost time claim in the first month that it is reported to the company. Similarly, the
$51.87 OS2 standard represents the average monthly cost of handling a claim that is between 30
and 90 days old.
At this point, it may be appropriate to apply judgment in selecting the final standards. Unusual
results for any office and category should be reviewed. For example, the costs for Office #3
consistently fall below the costs in the other offices. The statistics for this office should be
validated to make sure that all the data was collected properly. Given the data are correct, the
reasons for the lower cost should be explored. One possible explanation for the lower cost may
be that the Workers' Compensation laws in the jurisdictions that the office serves make it easier to
adjudicate claims. If it is felt that the data for this office is anomalous, it may be appropriate to
exclude it from the final selection of the standards.
Step 5: Load Standards for Other Field Office Claim Overhead
As mentioned above, not all the staff in a field claim office actually handles claims in the system.
For example, the claim office staff may include an office manager, system administrator, and
quality assurance and training resources, as well as clerical and mailroom staff. These field costs
must also be factored into the claim standards. In our study, these costs were added using a
percentage factor. Since the positions included in the work study accounted for 64.3% of total
claim expenses, the standards were multiplied by 1.555 (1/.643) in Exhibit 6. In making this
adjustment, we are again allocating field office overhead to claim in the same proportion as the
staff handling time captured in the system at the claim level.
Step 6: Load Standards for Home Office Claim Adjuster Expense Overhead
In addition to the field overhead discussed above, claim adjuster expense also includes home
office claim department costs, as well as general overhead. Examples of the types of expenses

included in overhead are shown in Exhibit 7. The general overhead factor was calculated by
dividing the annual overhead cost of $66,976 by the total claim field expenses of $174,933 from
Exhibit 1. General Overhead was reflected by multiplying the standards in Exhibit 6 by a factor of
1.383.
Practical Considerations in Conducting the Claim Study
Scope of the Study
When setting up the study, one important consideration is its scope. One of the first decisions
that must be made is whether to include the entire population of claim offices in the study.
Because the volume of data that is collected at the transaction level is so extensive, it may not be
possible to include all the claim offices. Instead, it may be more practical to include a sample of
claim offices. If the decision is made to only sample claim offices, it is important to select offices
that provide a representative sample of the company’s geographical mix. The use of countrywide
salary levels when calculating average costs can mitigate geographic differences in cost of living.
However, variations in state claim adjudication requirements for certain lines, such as Workers’
Compensation, can significantly impact claim costs. It is also important to make sure that the mix
of claims by age in the sample offices reflects the mix for the total claim population.
Our study included five sample offices that handled Workers’ Compensation claims. These
offices accounted for approximately 20% of our claim volume. It should be noted that an
automated work measurement study allows a much larger sample size than would be practical
under a traditional time and motion study.
Duration of Study
Another consideration is the time period for the study. Our claim study spanned four months.
When conducting a work-study, it is important to select a representative time period. It makes
sense to avoid unusual times, such as holidays. In addition, it is important to avoid periods when
the office is handling a heavy volume of catastrophe claims. Even with these caveats, it may be
necessary to adjust the data for months that have a fewer number of workdays.
Credibility
There may not be sufficient volume in every claim category to select valid standards. In our
study, we selected different standards by market segment. However, certain claim categories,
such as auto uninsured motorist, did not have a sufficient volume of claim data. For these
categories, we selected data for all market segments combined.
Adjusting the Data for Anomalies in Claim Transaction Durations
We found several data issues that required adjustment. A significant issue was unusually long
durations for individual transactions compared to the norm. We learned that these anomalies
typically occurred when the claim representative was interrupted in the middle of a transaction. In
order to address this issue, we elected to cap any value for a transaction that exceeded the mean
by more than three standard deviations.
Participation of Claim Department Personnel
Active participation by the claim department is essential to a successful claim work-study. Before
undertaking the study, it is important to thoroughly understand the claim system and how
adjusters utilize it. In enlisting the cooperation of the claim office staff, it is useful to explain the
purpose of the study and to provide appropriate assurances that the goal of the study is not to
reduce staff. Cooperation from the claim office staff—particularly the manager and systems
administrator—during the data collection phase is crucial. To ensure all the data is collected, it is
important to make sure that the system is fully operational and that all the data files are retained.
The study team should be notified of any outages during work hours; data for days with outages
may need to be excluded from the study, and appropriate adjustments must be made.
Adjustments may also be necessary if there is a significant departure from the typical workload,
such as an all-day training session.
After preliminary results are tabulated, it is useful to review them with a cross-section of claim
staff. While the staff may not be able to validate the actual average dollar cost of each type of
claim, they may provide valuable insights into the cost differentials among different types of
claims or the cost of handling similar claims for different market segments.
Other Participants in the Study
A cross-functional team was critical to the success of the claim study. Since the project was
originally designed as a cost allocation study, controllers played a central role in the design and
execution of the study. The study team included several staff members from both claim financial
and cost accounting, as well as two actuaries from claims actuarial. A representative from the
claims work measurement unit also served on the team. It was also helpful to have a systems
analyst and programmer dedicated to the project. In addition, actuaries and controllers from the
market segments and corporate actuarial peer-reviewed the results of the study.
Final Validation of the Claim Standards
As a final validation of the claim standards, the study team tried to replicate actual claim
adjustment expense spending levels using the standards. The standards (loaded for claim office
overhead) were multiplied times the number of claims processed within each category in a given
quarter and the results were summed. The fact that the total was within 2% of the actual claim
adjuster expense spent during that time period helped demonstrate that the standards were
reasonable.
Adjusting the Standards for Inflation and Trend in Claim Department Costs
Since conducting this type of claim study requires a significant resource investment, it is not
practical to update it frequently. For this reason, it is necessary to adjust the standards for
inflation in claim department costs. The simplest solution is to multiply the standards times an
inflation factor. However, simply increasing the standards by an arbitrary inflation factor will not
recognize any productivity gains resulting from the claim department handling a higher volume of
claims with the same amount of staff.

A more refined approach can be used to adjust the standards. Each quarter, the actual spending in
each claim office can be compared to the indicated claim adjuster expense that results from
applying the standards to the claim volume. This is similar to the exercise that was used to
validate the standards described in the previous section. The ratio of actual expenses to indicated
expenses could be used to adjust the claim standards for inflation and productivity changes. This
ratio can also be calculated at a claim office level and applied to the countrywide claim standards
to customize the standards by claim office. Of course, it is important to note that this approach
assumes that all types of claims in the office will inflate at the same rate. It also implies that the
relativity among the standards for different types of claims will remain constant over time and
across claim offices.
Adjusting the Standards for Changes in Claim Department Work Flow
While the above adjustment makes it unnecessary to update the standards every year to reflect
inflation, it is necessary to modify the standards when there is a material change in claim
department workflow. Examples of changes that may impact the standards are the creation of a
centralized 1-800 number for claim reporting, changes in the process for reviewing and paying
medical bills, and other managed care initiatives. In addition, outsourcing certain claim functions,
such as case management, appraisals or fraud management, may require adjustments to the
standards.
Workers’ Compensation Claims Greater Than 60 Months Old
The treatment of claims in the tail is an important consideration, particularly in a long-tailed line
such as Workers’ Compensation. In Workers’ Compensation, claims that are open beyond a
certain age require much less attention. Typically, when Workers’ Compensation claims reach
this age, the investigation of the claim has been concluded. Weekly indemnity payments, and
occasional medical payments, are processed with little intervention from a claims representative.
For this reason, the claim adjuster expenses associated with these claim files are considerably less.
Accordingly, we established a separate OS3 cost for Workers’ Compensation “maintenance claim
files” open longer than five years and excluded claims open more than five years from the OS2
age category. For the sake of simplicity, the calculation of the OS3 cost for Workers'

Compensation claims older than five years is not illustrated in this paper. The examples that
follow use a selected cost of $17 per month or $204 per year.
Using the Claim Standards to Calculate the Claim Adjuster Expense Reserve
The standards developed in the claim work-study can be used as the basis for the calculation of
the claim adjuster expense reserve. Kay Rahardjo described a technique for doing so in her paper,
“A Methodology for Pricing and Reserving for Claim Expenses in Workers Compensation.”5 The
methodology will be reviewed below using a simplified example. Modifications to the
methodology will also be discussed.
The major steps in Rahardjo’s paper are:
(i) Project Ultimate Claim Counts using Triangles of Open and Reported Claims
(ii) Determine the Number of Claims Open at Various Development Ages
(iii) Calculate The Reserve by Multiplying the Number of Open Claims by the
Outstanding Cost per Claim
Projection of Ultimate Claim Counts
Exhibit 8 shows a report year triangle of reported claim counts that forms the basis of the
projection of ultimate claim counts. At the bottom of the exhibit, development factors are
calculated using standard methodologies to project the claim counts to ultimate. For the sake of
simplicity, a ten-year report year by development year triangle is used in this example. In a real
application, it may be more appropriate to use quarterly development triangles and to expand the
triangle beyond ten years.
5 Rahardjo, Kay Kellogg, “A Methodology for Pricing and Reserving for Claim Expenses in Workers
Compensation”; Casualty Actuarial Society Forum, Casualty Actuarial Society, Arlington, Virginia, Summer
1996, pages 151-184.
The reader will observe that there is some development in report year counts beyond twelve
months. This development results from the way our system identifies lost time claims. A claim
may initially be reported to the company with no indemnity incurred on the claim. Our systems
identify this claim as a medical only claim. If any indemnity is subsequently incurred, the claim is
converted to a lost time claim, but retains the original date that the claim was reported to the
company.
Projection of Outstanding Claim Counts
Outstanding claim counts are displayed in the top portion of Exhibit 9. Rahardjo projects the
number of outstanding claims at future development intervals by calculating the ratio of
outstanding claims to ultimate claims at historical points. Ratios of outstanding claims to ultimate
claims are selected for each development age. These averages are used to calculate the number of
outstanding claims at future year-end development points.
Projection of Future Claim Adjuster Expense per Outstanding Claim
The monthly standards developed in the claim study form the basis for the estimates of future
claim adjuster expenses. The monthly standard must be converted into an annual cost. Since our
standard varies with the age of the outstanding claim, the mix by age of claim must be considered.
Exhibit 10 illustrates how the standards can be weighted to reflect the age of outstanding claims,
assuming that claims are reported evenly throughout the year. Recall that the intake standard
reflects the cost of the activity that takes place in the month in which the claim is reported. Since
a claim incurs the intake cost in the month it is reported, it is not necessary to include this cost in
the reserve for reported claims. The claim incurs the OS1 (30-90 day) cost for the next two
months and then incurs the OS2 cost for months 4 through 60.
As the top section of Exhibit 10 shows, report year claims that are outstanding at the end of the
first 12 months have incurred, on average, 21/12 months of OS1 costs and 45/12 months of OS2

costs. The total cost for the first year is $381.98. Similarly, the second section of the exhibit
shows that report year claims that are open between 12 and 24 months incur 3/12 months of the
OS1 cost and 141/12 months of the OS2 cost, or $613.04. After 24 months, open claims incur 12
months of OS2 costs ($597.60) for each year that they are open up to 60 months. Between 60
and 72 months, it is again necessary to adjust the standard to reflect the mix by age. The second
page of Exhibit 10 shows that between 61 and 72 months open claims incur 66/12 months of the
OS2 cost and 78/12 months of the OS3 cost, or $384.40 per year. After 72 months, all open
claims incur the OS3 cost of $17 per month, or $204.00 per year. Of course, using quarterly
triangles rather than the annual triangles used in this example would improve the accuracy in
estimating the age of open claims.
Inflation should be considered in developing future costs. For this example, we assume that
future claim department costs will inflate at a rate of 3% per year. The inflated annualized
standards are shown in the top section of Exhibit 11.
Calculation of Future Claim Adjuster Expenses
The expected claim adjuster expense to be incurred in future years is the product of the average
number of open claims times the inflation-adjusted standard. The average number of outstanding
claims is calculated in the middle section of Exhibit 11 by taking the average of the number of
claims at the beginning and end of each interval from Exhibit 9. More sophisticated assumptions
about the claim closing patterns during the development period could be used.
Determination of Claim Adjuster Expense Reserve for Reported Claims
Once the future claim costs are estimated, calculating the claim adjuster expense reserve is simply
a matter of summing the future claim adjuster expenses. This calculation is illustrated in the
bottom section of Exhibit 11.

For a long-tailed line, such as Workers' Compensation, it is necessary to include a provision for
expenses incurred beyond ten years. Rahardjo describes a methodology for determining a tail for
Workers' Compensation tabular claims which uses mortality assumptions. The tail reserve must
include appropriate inflation assumptions.
Determination of Reserve for IBNR Claims
The methodology discussed above only addresses the claim adjuster expense reserve for reported
claims. Including only reported claims in the claim adjuster expense reserve may be appropriate
when claim service is sold on an unbundled basis. In such cases, the revenue for claim service is
typically collected when the claim is reported, and the claim administrator has no obligation to
handle the claims that have not yet been reported.
In most other circumstances, the revenue for claim service is included in the insurance premium
and the insurance carrier has the obligation to handle all claims that are reported. For this reason,
the claim adjuster expense reserve must include a provision for pure IBNR claims. Any standard
method for calculating the number of pure IBNR claims could be utilized. The number of IBNR
claims can then be multiplied by the average ultimate report year claim adjuster expense per claim
to derive the claim adjuster expense reserve for IBNR claims. This method assumes that the cost
of handling a late-reported claim is identical to the cost of handling a claim that is reported in the
same year as the accident. More sophisticated assumptions could be used to reflect differences in
the cost of handling IBNR claims.
The ultimate report year claim adjuster expense per claim is calculated in Exhibit 13 as the sum of
the intake cost plus the total outstanding costs for each month that the claim is open. Total
outstanding costs are determined by multiplying the average number of outstanding claims at each
age by the outstanding standard. If past claim standards are available, the historical values can be
used. Alternatively, the current standards can be detrended using an inflation assumption, as
shown in the top section of Exhibit 12. Finally, in Exhibit 14, the number of IBNR claims is
multiplied by the ultimate report year claim adjuster expense per claim determined in Exhibit 13.
The total claim adjuster expense reserve is the sum of the reserves for reported and IBNR claims.
In determining the total Adjusting and Other reserve, a provision must be included for the other
components that are not reflected in the claim expense study.
An additional consideration in determining the claim adjuster expense reserve is the treatment of
canceled claims. In developing the claim standards, we recognized that a claim representative
spends a considerable amount of time creating and investigating a claim that is later canceled. For
this reason, a claim incurs the intake cost plus the outstanding cost for each month that it is open.
Once the claim is canceled, no further costs are incurred. Accordingly, when determining the
claim adjuster expense reserve, ultimate claims should be projected gross to canceled claims to
determine the proper intake charges. The triangle of outstanding claims should reflect an
outstanding count for each month the claim remains open.
Other Applications for Claim Study
In addition to calculating the claim adjuster expense reserve, the standards have several other
practical applications: allocating claim adjuster expense to line of business for statutory and
management reporting, pricing unbundled claim service, and monitoring claim department
expenses.
Allocation of Claim Adjuster Expense
In many companies, internal claim adjuster expense is not typically assigned to a specific claim.
For this reason, it is often impossible to identify these expenses by claim type and line of business.
This becomes a particularly difficult issue when a single claim unit handles several different types
of claims or the same type of claims for different market segments. The standards that are
determined in this study could form the basis of an expense allocation system. In fact, the original
purpose of our claim study was to develop a new claim expense allocation system.

In our allocation methodology, the system tabulates the number of claims reported to the office
and the number of claims in each age category. The monthly claim counts are then multiplied by
the appropriate standard for the claim type and age category. The results are then summed by
claim office to determine the indicated claim expense for each office. The indicated claim expense
is compared to the actual claim expense in the office and the standards are adjusted to balance to
the actual spending. Depending on individual company data reporting needs, the results can be
summarized at various levels of detail. For internal management reporting, the data may be
summarized by market segment and subline, branch office, and state. For annual statement
reporting, the data may be tabulated by statutory line and state. In addition, the data may be
further summarized by accident year.
Allocation of Adjusting and Other Expense Payments in Schedule P
The above method provides a methodology to allocate Adjusting and Other Expense to accident
year in Schedule P. Prior to the 1997 Blank, the instructions to the Annual Statement prescribed
a methodology—commonly referred to as the “45/5 Rule”—to allocate ULAE payments and
reserves to accident year. The rule allocates calendar year ULAE payments as follows: (1) 45%
to the most recent accident year, (2) 5% to the next most recent year and (3) the balance in
proportion to the amount of loss payments for each accident year during the most recent calendar
year. This allocation method is based on the assumption that half of the ULAE is incurred when
the loss is reported and the other half is incurred as loss payments are made. In addition, the
method assumes that 90% of claims are reported in the same year as the accident year and the
remaining 10% are reported in the following year. Of course, these assumptions do not apply to
most lines of business typically written by today’s insurers. The old Annual Statement rule was
repealed effective with the 1997 Blank. The revised rule states that insurers should now
apportion Adjusting and Other Expense payments and reserves by year based on claim counts
using any appropriate method. The claim department standards described in this paper can be
multiplied by accident year claim counts for each annual statement line to form the basis of the
allocation of Adjusting and Other Expense payments in Schedule P.
Pricing Claim Service
Another important application of the claim standards is the pricing of claim service. The ultimate
claim costs estimated above can form the basis of a handle-to-conclusion charge for insurance
companies and third party administrators. In addition, assigned risk servicing carriers for
Workers’ Compensation and Automobile can use these claim standards to reflect the cost of
handling claims in the servicing carrier allowance in their bids. As an in-depth discussion of
pricing is beyond the scope of this paper, the reader should refer to Rahardjo’s paper for more
details.6
Claim Department Expense Planning, Monitoring and Control
In addition to the applications discussed above, the claim study provides a set of tools to plan and
monitor claim department costs. Future claim adjuster expenses can be forecasted using a
projection of future adjuster costs similar to the triangle displayed in Exhibit 12. Of course, the
triangle would need to be expanded to reflect projected future incurred claims. Such a forecast
can form the foundation of claim department budgets.
The work-study also produces useful monitoring statistics. As Exhibit 5 shows, the cost of
handling each type of claim varies substantially by office. These average costs can be used to
benchmark claim office productivity. Since the length of time that a claim remains open directly
influences the cost of handling the claim, it is also important to monitor claim closing patterns.
The triangle of ratios shown in Exhibit 9 provides a useful tool to monitor the proportion of
claims remaining open. Another useful statistic is the average life of claim displayed at the bottom
of Exhibit 9. The life of claim is calculated by multiplying the proportion of claims closing in an
interval by the average number of months that the claim remained open. The proportion of claims
closed is the difference between the claims open at the beginning and end of the interval. It
should be noted that this example assumes that the 1.5% of claims remaining open at the end of
6 Rahardjo, p. 164-167.

ten years are open for another 6 months. As mentioned above, more sophisticated assumptions
for the tail may be employed.
Summary
While the claim work-study described in this paper is simpler to conduct than the traditional time
and motion study, it still involves a considerable amount of work. However, a claim work-study
approach offers many advantages. The work-study more closely reflects the actual work involved
in creating and handling different types of claims. The method is responsive to changes in claim
volumes and is independent of loss payment patterns and the adequacy of loss reserves. The
standards can be adjusted to explicitly reflect trends in claim department costs due to inflation and
productivity changes. Finally, the work products resulting from the study provide useful
operational tools for monitoring claim department expenses. The amount of work involved in
conducting such a study is a worthwhile tradeoff for improvement in the accuracy of reserving,
pricing, and monitoring claim adjustment expense.
REFERENCES
Johnson, W. A., “Determination of Outstanding Liabilities for Unallocated Loss Adjustments
Expenses,” PCAS LXXVI, 1989, pp. 111-125.
Kittel, John, “Unallocated Loss Adjustment Reserves in an Inflationary Economic Environment,”
Casualty Actuarial Society Discussion Paper Program, Casualty Actuarial Society, Arlington,
Virginia, May 1981, Page 311.
Casualty Actuarial (Technical) Task Force, “Clarification of Revised ALAE Definition,” 6/24/97
Draft.
Rahardjo, Kay Kellogg, “A Methodology for Pricing and Reserving for Claim Expenses in
Workers Compensation”; Casualty Actuarial Society Forum, Casualty Actuarial Society,
Arlington, Virginia, Summer 1996, pages 151-184.

Exhibit 1
Total Countrywide Field Claim Expenses$(000)
(1) (2) (3) (4) (5) (6) (7)Total Field
Salary & Field Cost perPosition Staff Benefits Auto Travel Other Expenses Hour#
Trainee 24 940 - - 329 1,268 29.16$ Systems Administrator 57 2,538 - - 776 3,314 32.08$ Manager 80 8,174 - 333 1,088 9,596 66.18$
* Inside Claim Representative 513 20,827 - - 7,021 27,848 29.95$ * Outside Claim Representative 265 12,855 1,930 1,109 3,621 19,515 40.63$ * Clerical 904 24,640 - - 12,374 37,014 22.59$
Clerical Supervisor 31 1,184 - - 424 1,608 28.62$ Health Service Representative 67 3,453 209 122 425 4,209 34.66$ Claim Processing Supervisor 57 2,748 - - 780 3,528 34.15$
* Claim Processor 195 6,539 - - 2,672 9,211 26.06$ Compensation Processor 41 1,302 - - 557 1,859 25.01$ Auto Service Rep./Supervisor 112 5,616 686 154 649 7,105 35.00$ Claim Assistant 99 2,725 - - 1,355 4,080 22.74$ General Adjuster 26 1,747 105 127 136 2,115 44.88$ Hearing Representative 14 887 102 59 192 1,240 48.85$ File Supervisor 156 9,583 - - 2,129 11,712 41.42$ Assistant Manager 125 9,116 - - 1,716 10,832 47.81$
* Supervisor 261 15,305 - - 3,575 18,880 39.91$ Total Field 3,027 130,178 3,033 1,904 39,818 174,933
* Expenses Included in Study 2,138 80,166 1,930 1,109 29,263 112,467% of Expenses Included in Study 70.6% 61.6% 64.3%
Field Overhead Factor (1/.643) 1.555
# Based on 50 weeks at 36.25 hours per week

Exhibit 2
Summary of Claim Transaction Durations
Age Category: Intake
Ave.Hourly Number of Hours
Cost Position Name Office #1 Office #2 Office #3 Office #4 Office #529.95$ Inside Claim Representative 387.5 148.7 252.9 783.5 347.440.63$ Outside Claim Representative 74.2 243.7 68.6 38.9 49.622.59$ Clerical 129.9 120.9 52.7 398.1 91.039.91$ Supervisor 112.1 91.6 75.8 274.4 686.526.06$ Claim Processor 122.0 7.0 233.8 171.3 154.4
Total Hours 825.8 612.0 683.8 1,666.1 1,329.0
Number of Claims 585 304 654 650 452
Age Category: Outstanding 31-90 Days
Ave.Hourly Number of Hours
Cost Position Name Office #1 Office #2 Office #3 Office #4 Office #529.95$ Inside Claim Representative 241.2 69.6 175.9 735.1 241.940.63$ Outside Claim Representative 32.9 146.4 30.3 17.6 42.722.59$ Clerical 86.1 132.1 65.7 366.3 263.239.91$ Supervisor 134.9 79.6 122.4 363.8 227.726.06$ Claim Processor 59.5 4.4 142.6 158.1 106.7
Total Hours 554.6 432.1 536.9 1,640.8 882.2
Number of Claims 996 518 948 1,176 667
Age Category: Outstanding > 90 Days
Ave.Hourly Number of Hours
Cost Position Name Office #1 Office #2 Office #3 Office #4 Office #529.95$ Inside Claim Representative 736.0 157.6 712.5 1,928.7 971.940.63$ Outside Claim Representative 68.7 378.3 93.6 182.3 93.722.59$ Clerical 294.4 336.3 251.9 1,381.8 234.239.91$ Supervisor 662.4 483.4 914.0 978.8 187.426.06$ Claim Processor 117.8 10.5 453.4 374.2 181.5
Total Hours 1,879.3 1,366.1 2,425.3 4,845.8 1,668.7
Number of Claims 4,600 3,284 6,747 8,996 5,489
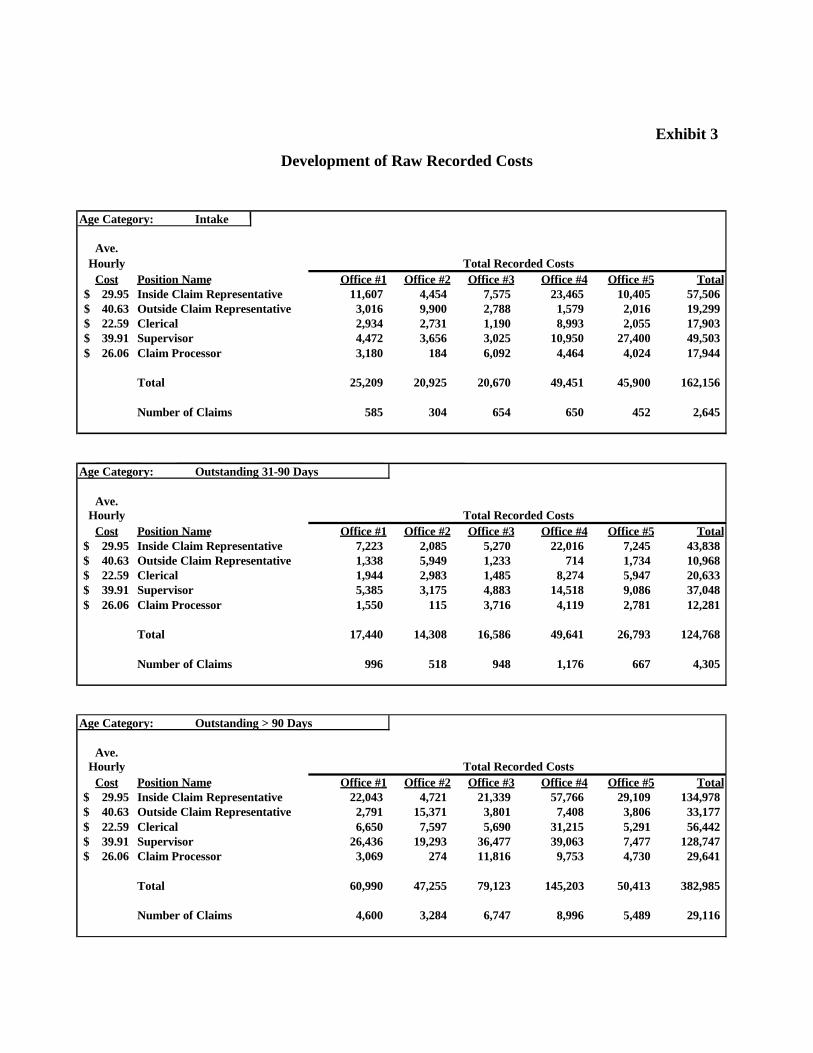
Exhibit 3
Development of Raw Recorded Costs
Age Category: Intake
Ave.Hourly Total Recorded Costs
Cost Position Name Office #1 Office #2 Office #3 Office #4 Office #5 Total29.95$ Inside Claim Representative 11,607 4,454 7,575 23,465 10,405 57,50640.63$ Outside Claim Representative 3,016 9,900 2,788 1,579 2,016 19,29922.59$ Clerical 2,934 2,731 1,190 8,993 2,055 17,90339.91$ Supervisor 4,472 3,656 3,025 10,950 27,400 49,50326.06$ Claim Processor 3,180 184 6,092 4,464 4,024 17,944
Total 25,209 20,925 20,670 49,451 45,900 162,156
Number of Claims 585 304 654 650 452 2,645
Age Category: Outstanding 31-90 Days
Ave.Hourly Total Recorded Costs
Cost Position Name Office #1 Office #2 Office #3 Office #4 Office #5 Total29.95$ Inside Claim Representative 7,223 2,085 5,270 22,016 7,245 43,83840.63$ Outside Claim Representative 1,338 5,949 1,233 714 1,734 10,96822.59$ Clerical 1,944 2,983 1,485 8,274 5,947 20,63339.91$ Supervisor 5,385 3,175 4,883 14,518 9,086 37,04826.06$ Claim Processor 1,550 115 3,716 4,119 2,781 12,281
Total 17,440 14,308 16,586 49,641 26,793 124,768
Number of Claims 996 518 948 1,176 667 4,305
Age Category: Outstanding > 90 Days
Ave.Hourly Total Recorded Costs
Cost Position Name Office #1 Office #2 Office #3 Office #4 Office #5 Total29.95$ Inside Claim Representative 22,043 4,721 21,339 57,766 29,109 134,97840.63$ Outside Claim Representative 2,791 15,371 3,801 7,408 3,806 33,17722.59$ Clerical 6,650 7,597 5,690 31,215 5,291 56,44239.91$ Supervisor 26,436 19,293 36,477 39,063 7,477 128,74726.06$ Claim Processor 3,069 274 11,816 9,753 4,730 29,641
Total 60,990 47,255 79,123 145,203 50,413 382,985
Number of Claims 4,600 3,284 6,747 8,996 5,489 29,116
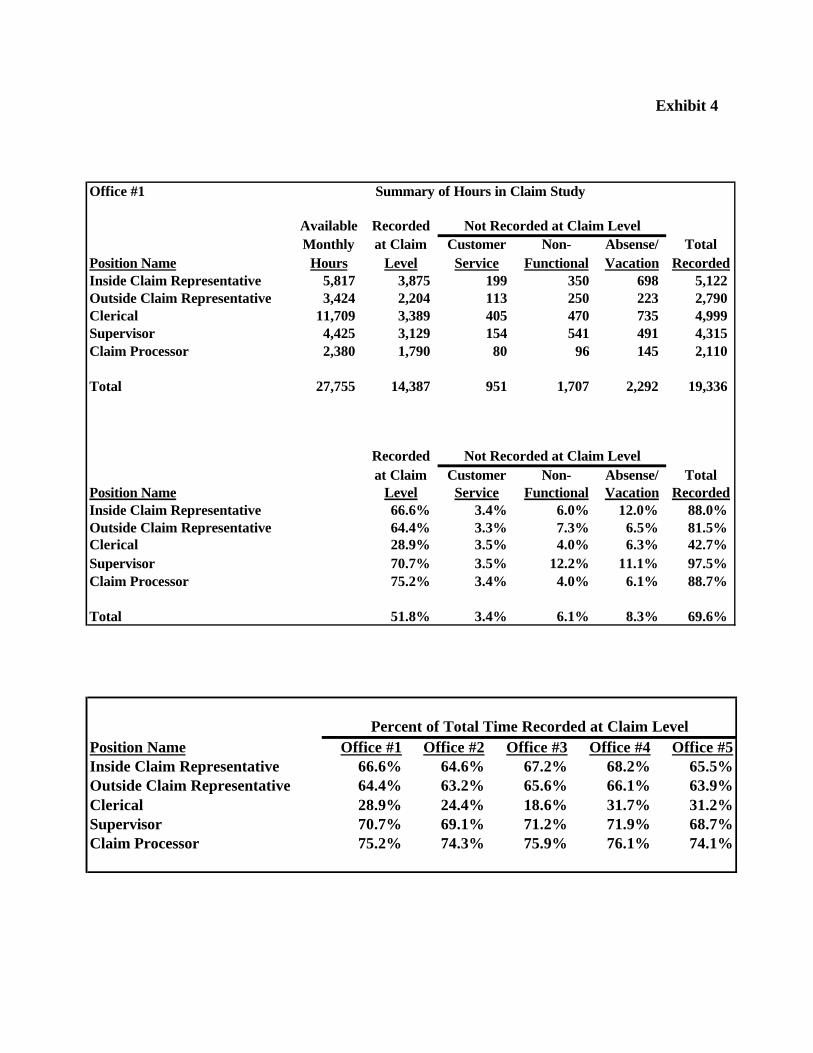
Exhibit 4
Office #1 Summary of Hours in Claim Study
Available Recorded Not Recorded at Claim LevelMonthly at Claim Customer Non- Absense/ Total
Position Name Hours Level Service Functional Vacation RecordedInside Claim Representative 5,817 3,875 199 350 698 5,122 Outside Claim Representative 3,424 2,204 113 250 223 2,790 Clerical 11,709 3,389 405 470 735 4,999 Supervisor 4,425 3,129 154 541 491 4,315 Claim Processor 2,380 1,790 80 96 145 2,110
Total 27,755 14,387 951 1,707 2,292 19,336
Recorded Not Recorded at Claim Levelat Claim Customer Non- Absense/ Total
Position Name Level Service Functional Vacation RecordedInside Claim Representative 66.6% 3.4% 6.0% 12.0% 88.0% Outside Claim Representative 64.4% 3.3% 7.3% 6.5% 81.5% Clerical 28.9% 3.5% 4.0% 6.3% 42.7% Supervisor 70.7% 3.5% 12.2% 11.1% 97.5% Claim Processor 75.2% 3.4% 4.0% 6.1% 88.7%
Total 51.8% 3.4% 6.1% 8.3% 69.6%
Percent of Total Time Recorded at Claim LevelPosition Name Office #1 Office #2 Office #3 Office #4 Office #5Inside Claim Representative 66.6% 64.6% 67.2% 68.2% 65.5%Outside Claim Representative 64.4% 63.2% 65.6% 66.1% 63.9%Clerical 28.9% 24.4% 18.6% 31.7% 31.2%Supervisor 70.7% 69.1% 71.2% 71.9% 68.7%Claim Processor 75.2% 74.3% 75.9% 76.1% 74.1%

Exhibit 5
Summary of Grossed-Up Costs
Age Category: Intake
Total Costs Grossed Up for Unrecorded TimePosition Name Office #1 Office #2 Office #3 Office #4 Office #5 TotalInside Claim Representative 17,428 6,895 11,273 34,407 15,885 85,887Outside Claim Representative 4,683 15,665 4,250 2,388 3,156 30,142Clerical 10,153 11,194 6,396 28,368 6,588 62,699Supervisor 6,325 5,291 4,249 15,230 39,883 70,978Claim Processor 4,229 247 8,027 5,866 5,430 23,799
Total 42,818 39,292 34,194 86,259 70,942 273,505
Number of Claims 585 304 654 650 452 2,645 Average Cost per Claim $73.19 $129.25 $52.28 $132.71 $156.95 $103.40
Age Category: Outstanding 31-90 Days
Total Costs Grossed Up for Unrecorded TimePosition Name Office #1 Office #2 Office #3 Office #4 Office #5 TotalInside Claim Representative 10,845 3,228 7,842 32,281 11,061 65,256Outside Claim Representative 2,078 9,413 1,879 1,079 2,714 17,164Clerical 6,727 12,226 7,983 26,102 19,060 72,097Supervisor 7,616 4,595 6,858 20,192 13,226 52,489Claim Processor 2,062 155 4,895 5,412 3,753 16,278
Total 29,328 29,617 29,457 85,067 49,814 223,284
Number of Claims 996 518 948 1,176 667 4,305 Average Cost per Claim $29.45 $57.18 $31.07 $72.34 $74.68 $51.87
Age Category: Outstanding > 90 Days
Total Costs Grossed Up for Unrecorded TimePosition Name Office #1 Office #2 Office #3 Office #4 Office #5 TotalInside Claim Representative 33,098 7,308 31,754 84,701 44,441 201,302Outside Claim Representative 4,334 24,321 5,795 11,207 5,956 51,613Clerical 23,012 31,134 30,592 98,469 16,957 200,163Supervisor 37,392 27,920 51,232 54,329 10,884 181,758Claim Processor 4,081 369 15,567 12,815 6,383 39,215
Total 101,917 91,052 134,941 261,520 84,622 674,052
Number of Claims 4,600 3,284 6,747 8,996 5,489 29,116 Average Cost per Claim $22.16 $27.73 $20.00 $29.07 $15.42 $23.15

Exhibit 6
Workers' Compensation Lost Time ClaimsDevelopment of Final Standards
Outstanding ClaimsIntake 31-90 Days > 90 Days
Claim Study Costs Excl. Field Office Overhead $103.40 $51.87 $23.15 (From Exhibit 5)
Field Office Overhead 1.555 1.555 1.555 (From Exhibit 1)
Standards Including Field Overhead $160.84 $80.67 $36.01
Home Office Overhead 1.383 1.383 1.383 (From Exhibit 7)
Fully Loaded Standards $222.42 $111.56 $49.80

Exhibit 7
Calculation of General Overhead Factor
$(000) % ofTotal Field
General Overhead Categories Expense ClaimActuarial 1,835 1.0%Claim Headquarters 8,922 5.1%Commercial Lines Field 11,572 6.6%Commercial Lines Home Office 512 0.3%Controllers 6,789 3.9%Corporate Finance 640 0.4%Corporate Relations 175 0.1%Executive 5,015 2.9%General 20,557 11.8%Government Affairs 0 0.0%Human Resources 3,151 1.8%Information Management 1,168 0.7%Legal 3,319 1.9%Operations 3,319 1.9%
Total Overhead 66,976 38.3%
Total Field Claim 174,933From Exhibit I, Column (6) Total
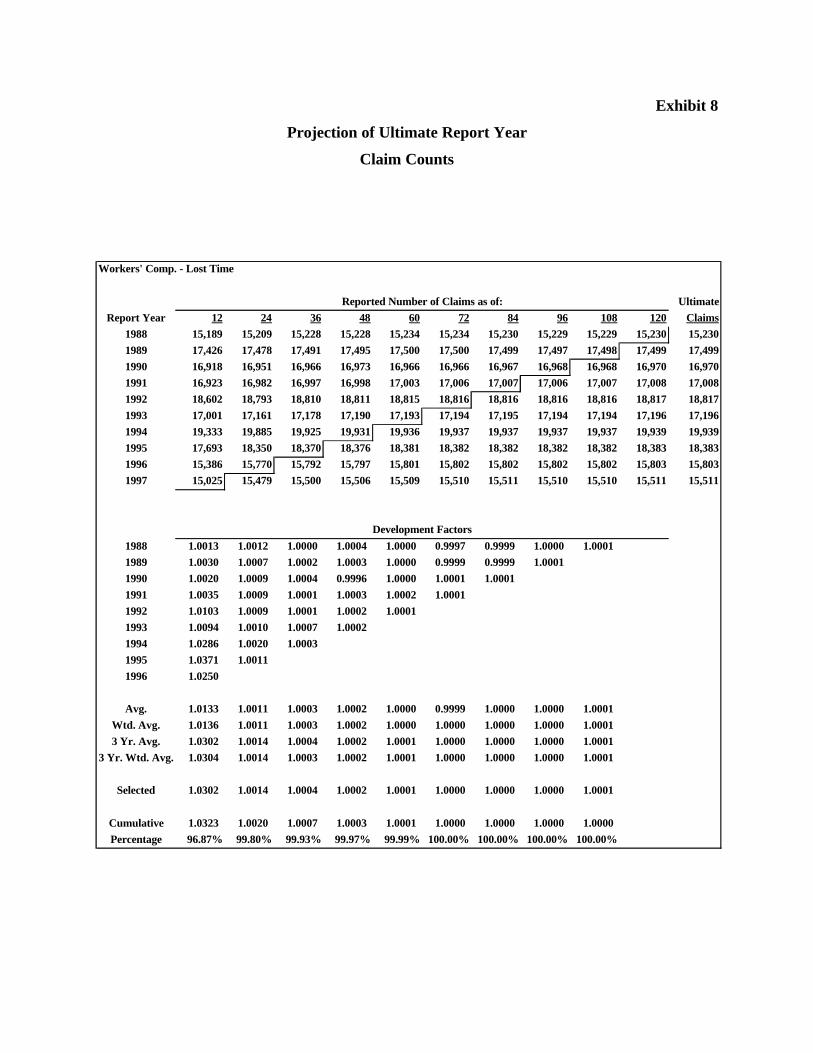
Exhibit 8
Projection of Ultimate Report Year
Claim Counts
Workers' Comp. - Lost Time
Reported Number of Claims as of: Ultimate
Report Year 12 24 36 48 60 72 84 96 108 120 Claims
1988 15,189 15,209 15,228 15,228 15,234 15,234 15,230 15,229 15,229 15,230 15,230
1989 17,426 17,478 17,491 17,495 17,500 17,500 17,499 17,497 17,498 17,499 17,499
1990 16,918 16,951 16,966 16,973 16,966 16,966 16,967 16,968 16,968 16,970 16,970
1991 16,923 16,982 16,997 16,998 17,003 17,006 17,007 17,006 17,007 17,008 17,008
1992 18,602 18,793 18,810 18,811 18,815 18,816 18,816 18,816 18,816 18,817 18,817
1993 17,001 17,161 17,178 17,190 17,193 17,194 17,195 17,194 17,194 17,196 17,196
1994 19,333 19,885 19,925 19,931 19,936 19,937 19,937 19,937 19,937 19,939 19,939
1995 17,693 18,350 18,370 18,376 18,381 18,382 18,382 18,382 18,382 18,383 18,383
1996 15,386 15,770 15,792 15,797 15,801 15,802 15,802 15,802 15,802 15,803 15,803
1997 15,025 15,479 15,500 15,506 15,509 15,510 15,511 15,510 15,510 15,511 15,511
Development Factors
1988 1.0013 1.0012 1.0000 1.0004 1.0000 0.9997 0.9999 1.0000 1.0001
1989 1.0030 1.0007 1.0002 1.0003 1.0000 0.9999 0.9999 1.0001
1990 1.0020 1.0009 1.0004 0.9996 1.0000 1.0001 1.0001
1991 1.0035 1.0009 1.0001 1.0003 1.0002 1.0001
1992 1.0103 1.0009 1.0001 1.0002 1.0001
1993 1.0094 1.0010 1.0007 1.0002
1994 1.0286 1.0020 1.0003
1995 1.0371 1.0011
1996 1.0250
Avg. 1.0133 1.0011 1.0003 1.0002 1.0000 0.9999 1.0000 1.0000 1.0001
Wtd. Avg. 1.0136 1.0011 1.0003 1.0002 1.0000 1.0000 1.0000 1.0000 1.0001
3 Yr. Avg. 1.0302 1.0014 1.0004 1.0002 1.0001 1.0000 1.0000 1.0000 1.0001
3 Yr. Wtd. Avg. 1.0304 1.0014 1.0003 1.0002 1.0001 1.0000 1.0000 1.0000 1.0001
Selected 1.0302 1.0014 1.0004 1.0002 1.0001 1.0000 1.0000 1.0000 1.0001
Cumulative 1.0323 1.0020 1.0007 1.0003 1.0001 1.0000 1.0000 1.0000 1.0000
Percentage 96.87% 99.80% 99.93% 99.97% 99.99% 100.00% 100.00% 100.00% 100.00%

Exhibit 9
Projection of Outstanding Report Year Claim Counts
Workers' Comp. - Lost Time
Outstanding Number of Claims As of Ultimate
Report Year 12 24 36 48 60 72 84 96 108 120 Claims
1988 7,083 3,250 1,855 1,324 981 753 547 366 287 228 15,230
1989 8,196 3,632 2,283 1,507 1,104 770 576 391 303 262 17,499
1990 8,463 4,181 2,638 1,866 1,352 938 702 566 307 254 16,970
1991 8,803 4,367 2,848 1,925 1,229 793 560 452 307 255 17,008
1992 9,961 5,287 3,429 1,988 1,246 837 672 500 340 282 18,817
1993 9,408 4,239 2,414 1,421 953 839 615 457 311 257 17,196
1994 10,365 4,667 2,744 1,616 1,289 973 713 530 360 298 19,939
1995 8,879 4,136 2,312 1,650 1,188 897 657 489 332 275 18,383
1996 7,596 3,785 2,127 1,419 1,021 771 565 420 286 237 15,803
1997 8,107 3,612 2,088 1,393 1,003 757 554 412 280 232 15,511
1988 0.4651 0.2134 0.1218 0.0869 0.0644 0.0494 0.0359 0.0240 0.0188 0.0150
1989 0.4684 0.2076 0.1305 0.0861 0.0631 0.0440 0.0329 0.0223 0.0173
1990 0.4987 0.2464 0.1555 0.1100 0.0797 0.0553 0.0414 0.0334
1991 0.5176 0.2568 0.1675 0.1132 0.0723 0.0466 0.0329
1992 0.5294 0.2810 0.1822 0.1056 0.0662 0.0445
1993 0.5471 0.2465 0.1404 0.0826 0.0554
1994 0.5198 0.2341 0.1376 0.0810
1995 0.4830 0.2250 0.1258
1996 0.4807 0.2395
1997 0.5226
Avg. 0.5032 0.2389 0.1451 0.0951 0.0668 0.0480 0.0358 0.0266 0.0181 0.0150
Wtd. Avg. 0.5040 0.2394 0.1455 0.0950 0.0668 0.0478 0.0358 0.0266 0.0180 0.0150
3 Yr. Avg. 0.4954 0.2329 0.1346 0.0898 0.0646 0.0488 0.0357 0.0266 0.0181 0.0150
Selected 0.4954 0.2329 0.1346 0.0898 0.0646 0.0488 0.0357 0.0266 0.0181 0.0150
% of Ultimate Claims Outstanding
Average Age 6 18 30 42 54 66 78 90 102 114 126
Cumulative
% of Claims Closed 0.5046 0.7671 0.8654 0.9102 0.9354 0.9512 0.9643 0.9734 0.9819 0.9850 1.0000
Incremental
Claims Closed 0.5046 0.2626 0.0983 0.0448 0.0251 0.0158 0.0131 0.0092 0.0085 0.0031 0.0150
Average Life of Claim = (.5046 * 6) + (.2626 * 18) + . . . + (.0031 * 114) + (.015 * 126) = 19.9 Months
Calculation of Average Life of Claim

Exhibit 10
Page 1
Development of Annual Claim Adjuster CostsINTAKE OS1 OS2 OS3
222.42$ 111.56$ 49.80$ 17.00$ ( From Exhibit 6)
Report Development Month
Mo. 1 2 3 4 5 6 7 8 9 10 11 12 Total
1 0.00 111.56 111.56 49.80 49.80 49.80 49.80 49.80 49.80 49.80 49.80 49.80
2 0.00 111.56 111.56 49.80 49.80 49.80 49.80 49.80 49.80 49.80 49.80
3 0.00 111.56 111.56 49.80 49.80 49.80 49.80 49.80 49.80 49.80
4 0.00 111.56 111.56 49.80 49.80 49.80 49.80 49.80 49.80
5 0.00 111.56 111.56 49.80 49.80 49.80 49.80 49.80
6 0.00 111.56 111.56 49.80 49.80 49.80 49.80
7 0.00 111.56 111.56 49.80 49.80 49.80
8 0.00 111.56 111.56 49.80 49.80
9 0.00 111.56 111.56 49.80
10 0.00 111.56 111.56
11 0.00 111.56
12 0.00
Total 0.00 111.56 223.12 272.92 322.72 372.52 422.32 472.12 521.92 571.72 621.52 671.32 4,584
Total O/S Cost in Months 1-12 of Report Year $381.98
= ((45 Mos. * OS2 + (21 Mos. * OS1))/12
= ((45 Mos. * 49.80) + (21 Mos. * 111.56))/12
Report Development Month
Mo. 13 14 15 16 17 18 19 20 21 22 23 24 Total
1 49.80 49.80 49.80 49.80 49.80 49.80 49.80 49.80 49.80 49.80 49.80 49.80
2 49.80 49.80 49.80 49.80 49.80 49.80 49.80 49.80 49.80 49.80 49.80 49.80
3 49.80 49.80 49.80 49.80 49.80 49.80 49.80 49.80 49.80 49.80 49.80 49.80
4 49.80 49.80 49.80 49.80 49.80 49.80 49.80 49.80 49.80 49.80 49.80 49.80
5 49.80 49.80 49.80 49.80 49.80 49.80 49.80 49.80 49.80 49.80 49.80 49.80
6 49.80 49.80 49.80 49.80 49.80 49.80 49.80 49.80 49.80 49.80 49.80 49.80
7 49.80 49.80 49.80 49.80 49.80 49.80 49.80 49.80 49.80 49.80 49.80 49.80
8 49.80 49.80 49.80 49.80 49.80 49.80 49.80 49.80 49.80 49.80 49.80 49.80
9 49.80 49.80 49.80 49.80 49.80 49.80 49.80 49.80 49.80 49.80 49.80 49.80
10 49.80 49.80 49.80 49.80 49.80 49.80 49.80 49.80 49.80 49.80 49.80 49.80
11 111.56 49.80 49.80 49.80 49.80 49.80 49.80 49.80 49.80 49.80 49.80 49.80
12 111.56 111.56 49.80 49.80 49.80 49.80 49.80 49.80 49.80 49.80 49.80 49.80
Total 721.12 659.36 597.60 597.60 597.60 597.60 597.60 597.60 597.60 597.60 597.60 597.60 7,356
Total O/S Cost in Months 12-24 of Report Year $613.04
= (141 Mos. * 49.80) + (3 Mos. * 111.56))/12

Exhibit 10
Page 2
Development of Annual Claim Adjuster Costs
Report Development Month
Mo. 61 62 63 64 65 66 67 68 69 70 71 72 Total
1 17.00 17.00 17.00 17.00 17.00 17.00 17.00 17.00 17.00 17.00 17.00 17.00
2 49.80 17.00 17.00 17.00 17.00 17.00 17.00 17.00 17.00 17.00 17.00 17.00
3 49.80 49.80 17.00 17.00 17.00 17.00 17.00 17.00 17.00 17.00 17.00 17.00
4 49.80 49.80 49.80 17.00 17.00 17.00 17.00 17.00 17.00 17.00 17.00 17.00
5 49.80 49.80 49.80 49.80 17.00 17.00 17.00 17.00 17.00 17.00 17.00 17.00
6 49.80 49.80 49.80 49.80 49.80 17.00 17.00 17.00 17.00 17.00 17.00 17.00
7 49.80 49.80 49.80 49.80 49.80 49.80 17.00 17.00 17.00 17.00 17.00 17.00
8 49.80 49.80 49.80 49.80 49.80 49.80 49.80 17.00 17.00 17.00 17.00 17.00
9 49.80 49.80 49.80 49.80 49.80 49.80 49.80 49.80 17.00 17.00 17.00 17.00
10 49.80 49.80 49.80 49.80 49.80 49.80 49.80 49.80 49.80 17.00 17.00 17.00
11 49.80 49.80 49.80 49.80 49.80 49.80 49.80 49.80 49.80 49.80 17.00 17.00
12 49.80 49.80 49.80 49.80 49.80 49.80 49.80 49.80 49.80 49.80 49.80 17.00
Total 564.80 532.00 499.20 466.40 433.60 400.80 368.00 335.20 302.40 269.60 236.80 204.00 4,613
Total O/S Cost in Months 60-72 of Report Year $384.40
= ((66 Mos. * 49.80) + (78 Mos. * 17.00))/12

Exhibit 11
Determination of Claim Adjuster Expense Reserve for Reported Claims
Workers' Comp. - Lost Time
Future Inflation Assumption 1.03
FUTURE ANNUAL CLAIM ADJUSTER EXPENSE PER OUTSTANDING CLAIM
Report Year 0-12 Mos 12-24 Mos 24-36 Mos 36-48 Mos 48-60 Mos 60-72 Mos 72-84 Mos 84-96 Mos 96-108 Mos 108-120 Mos
1988 $204.00
1989 $204.00 $210.12
1990 $204.00 $210.12 $216.42
1991 $204.00 $210.12 $216.42 $222.92
1992 $384.40 $210.12 $216.42 $222.92 $229.60
1993 $597.60 $395.93 $216.42 $222.92 $229.60 $236.49
1994 $597.60 $615.53 $407.81 $222.92 $229.60 $236.49 $243.59
1995 $597.60 $615.53 $633.99 $420.04 $229.60 $236.49 $243.59 $250.89
1996 $613.04 $615.53 $633.99 $653.01 $432.65 $236.49 $243.59 $250.89 $258.42
1997 $381.98 $631.43 $633.99 $653.01 $672.60 $445.62 $243.59 $250.89 $258.42 $266.17
AVERAGE OUTSTANDING NUMBER OF CLAIMS
Report Year 0-12 Mos 12-24 Mos 24-36 Mos 36-48 Mos 48-60 Mos 60-72 Mos 72-84 Mos 84-96 Mos 96-108 Mos 108-120 Mos
1988 3,542 5,167 2,553 1,590 1,153 867 650 457 327 258
1989 4,098 5,914 2,958 1,895 1,306 937 673 484 347 282
1990 4,232 6,322 3,410 2,252 1,609 1,145 820 634 436 280
1991 4,402 6,585 3,608 2,387 1,577 1,011 677 506 380 281
1992 4,981 7,624 4,358 2,709 1,617 1,042 755 586 420 311
1993 4,704 6,824 3,327 1,918 1,187 896 727 536 384 284
1994 5,183 7,516 3,706 2,180 1,452 1,131 843 621 445 329
1995 4,440 6,508 3,224 1,981 1,419 1,043 777 573 410 304
1996 3,798 5,691 2,956 1,773 1,220 896 668 492 353 261
1997 4,054 5,859 2,850 1,740 1,198 880 656 483 346 256
Claim Adjuster
Reserve for
FUTURE CLAIM ADJUSTER EXPENSE FOR REPORTED CLAIMS ($) Reported
Report Year 0-12 Mos 12-24 Mos 24-36 Mos 36-48 Mos 48-60 Mos 60-72 Mos 72-84 Mos 84-96 Mos 96-108 Mos 108-120 Mos Claims
1988 52,530 52,530
1989 70,788 59,356 130,144
1990 129,336 91,697 60,690 281,723
1991 138,006 106,322 82,188 62,652 389,168
1992 400,353 158,585 126,886 93,660 71,397 850,880
1993 709,351 354,762 157,291 119,428 88,155 67,201 1,496,189
1994 1,302,768 893,954 461,141 187,852 142,633 105,284 80,258 3,173,890
1995 1,926,662 1,219,491 899,822 437,928 178,397 135,454 99,984 76,219 4,973,956
1996 3,488,504 1,819,485 1,123,979 796,725 387,753 157,957 119,934 88,528 67,486 8,050,349
1997 1,548,356 3,699,843 1,806,757 1,136,333 805,482 392,015 159,693 121,252 89,501 68,228 9,827,460
29,226,290

Exhibit 12
Determination of Outstanding Claim Adjuster Expense Costs
For Reported Claims
Workers' Comp. - Lost Time
Future Inflation Assumption 1.03 Historical Inflation Assumption 1.03
ANNUAL CLAIM ADJUSTER EXPENSE PER OUTSTANDING CLAIM
Report Year 0-12 Mos 12-24 Mos 24-36 Mos 36-48 Mos 48-60 Mos 60-72 Mos 72-84 Mos 84-96 Mos 96-108 Mos 108-120 Mos
1988 292.76 483.94 485.90 500.48 515.50 341.53 186.69 192.29 198.06 204.00
1989 301.54 498.46 500.48 515.50 530.96 351.78 192.29 198.06 204.00 210.12
1990 310.58 513.41 515.50 530.96 546.89 362.33 198.06 204.00 210.12 216.42
1991 319.90 528.81 530.96 546.89 563.30 373.20 204.00 210.12 216.42 222.92
1992 329.50 544.68 546.89 563.30 580.19 384.40 210.12 216.42 222.92 229.60
1993 339.38 561.02 563.30 580.19 597.60 395.93 216.42 222.92 229.60 236.49
1994 349.57 577.85 580.19 597.60 615.53 407.81 222.92 229.60 236.49 243.59
1995 360.05 595.18 597.60 615.53 633.99 420.04 229.60 236.49 243.59 250.89
1996 370.85 613.04 615.53 633.99 653.01 432.65 236.49 243.59 250.89 258.42
1997 381.98 631.43 633.99 653.01 672.60 445.62 243.59 250.89 258.42 266.17
Total
OUTSTANDING CLAIM ADJUSTER EXPENSE FOR REPORTED CLAIMS Outstanding
Report Year 0-12 Mos 12-24 Mos 24-36 Mos 36-48 Mos 48-60 Mos 60-72 Mos 72-84 Mos 84-96 Mos 96-108 Mos 108-120 Mos Cost
1988 1,036,795 2,500,273 1,240,269 795,514 594,108 296,110 121,348 87,780 64,666 52,530 6,789,393
1989 1,235,705 2,947,878 1,480,171 976,863 693,168 329,618 129,411 95,761 70,788 59,356 8,018,720
1990 1,314,239 3,245,787 1,757,580 1,195,722 879,944 414,872 162,408 129,336 91,697 60,690 9,252,275
1991 1,408,050 3,482,238 1,915,438 1,305,150 888,317 377,309 138,006 106,322 82,188 62,652 9,765,669
1992 1,641,071 4,152,626 2,383,341 1,525,685 938,174 400,353 158,585 126,886 93,660 71,397 11,491,778
1993 1,596,464 3,828,109 1,873,802 1,112,522 709,351 354,762 157,291 119,428 88,155 67,201 9,907,086
1994 1,811,625 4,343,113 2,149,910 1,302,768 893,954 461,141 187,852 142,633 105,284 80,258 11,478,538
1995 1,598,454 3,873,163 1,926,662 1,219,491 899,822 437,928 178,397 135,454 99,984 76,219 10,445,573
1996 1,408,505 3,488,504 1,819,485 1,123,979 796,725 387,753 157,957 119,934 88,528 67,486 9,458,854
1997 1,548,356 3,699,843 1,806,757 1,136,333 805,482 392,015 159,693 121,252 89,501 68,228 9,827,460
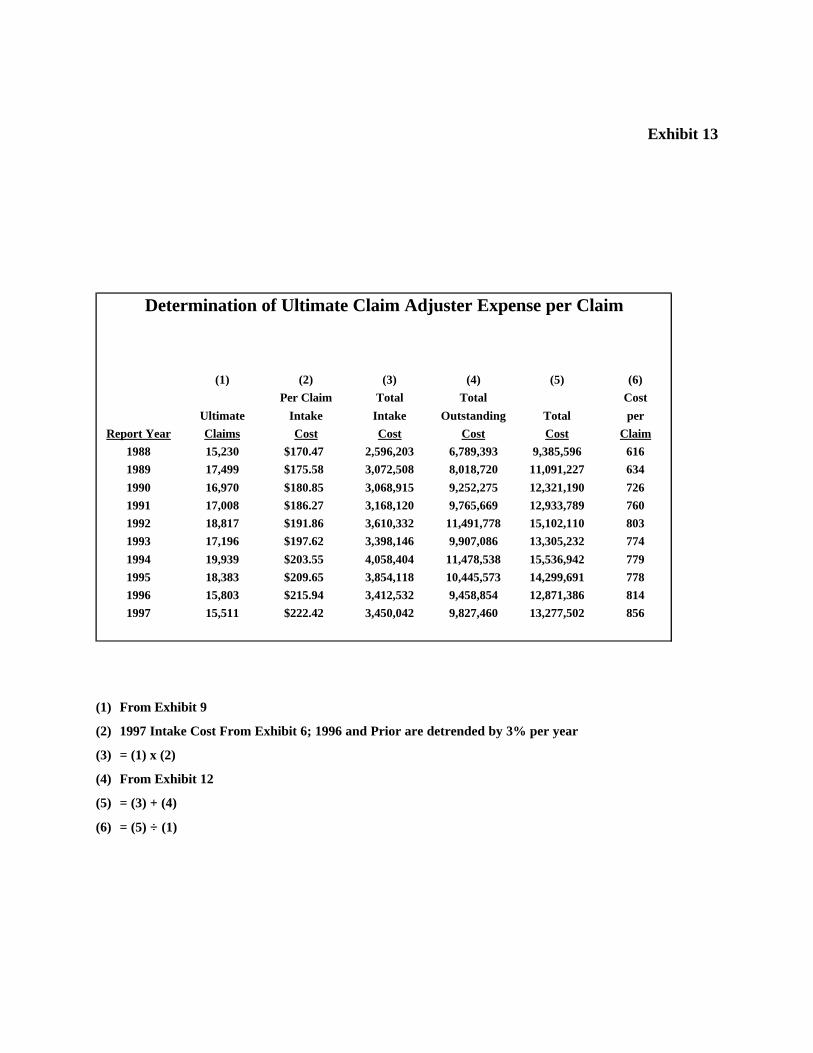
Exhibit 13
(1) From Exhibit 9
(2) 1997 Intake Cost From Exhibit 6; 1996 and Prior are detrended by 3% per year
(3) = (1) x (2)
(4) From Exhibit 12
(5) = (3) + (4)
(6) = (5) ÷÷ (1)
Determination of Ultimate Claim Adjuster Expense per Claim
(1) (2) (3) (4) (5) (6)
Per Claim Total Total Cost
Ultimate Intake Intake Outstanding Total per
Report Year Claims Cost Cost Cost Cost Claim
1988 15,230 $170.47 2,596,203 6,789,393 9,385,596 616
1989 17,499 $175.58 3,072,508 8,018,720 11,091,227 634
1990 16,970 $180.85 3,068,915 9,252,275 12,321,190 726
1991 17,008 $186.27 3,168,120 9,765,669 12,933,789 760
1992 18,817 $191.86 3,610,332 11,491,778 15,102,110 803
1993 17,196 $197.62 3,398,146 9,907,086 13,305,232 774
1994 19,939 $203.55 4,058,404 11,478,538 15,536,942 779
1995 18,383 $209.65 3,854,118 10,445,573 14,299,691 778
1996 15,803 $215.94 3,412,532 9,458,854 12,871,386 814
1997 15,511 $222.42 3,450,042 9,827,460 13,277,502 856

Exhibit 14
(1) May be calculated using any method for determining IBNR claims
(2) From Exhibit 13
(3) = (1) x (2)
(4) From Exhibit 11
(5) = (3) + (4)
Determination of Total Claim Adjuster Reserve Including IBNR
(1) (2) (3) (4) (5)
Number Cost Reserve Reserve for
of IBNR per IBNR for IBNR Reported Total
Year Claims Claim Claims Claims Reserve
1988 0 616 0 52,530 52,530
1989 0 634 0 130,144 130,144
1990 0 726 0 281,723 281,723
1991 24 760 18,108 389,168 407,276
1992 132 803 105,655 850,880 956,536
1993 101 774 78,214 1,496,189 1,574,403
1994 126 779 98,200 3,173,890 3,272,090
1995 163 778 126,966 4,973,956 5,100,922
1996 272 814 221,741 8,050,349 8,272,090
1997 350 856 299,341 9,827,460 10,126,802
Total 1,168 948,226 29,226,290 30,174,516