using child outcomes data for determinations: a …...total score and categorizing states data...
TRANSCRIPT

Using Child Outcomes Data
for Determinations:
A Proposal Improving Data, Improving Outcomes Conference
September, 2014

Background
• OSEP requested that ECO/ECTA propose a methodology for
use of child outcomes data for determinations.
• Parameters:
– Create groupings of states based on their data
– Identify a small number of states in the lowest group

Overview of the Methodology
• Two main components:
1. Quality of the data
2. Child achievement
• Two measures within each component.

1. Data quality
• What is considered?
1. Extent of missing data
2. “Out of range” percentages for “a” thru “e” progress categories
• States get a score in each area.
• Scores from each area are combined for an overall
data quality score.
2. Child Achievement
• What is considered?
1. How a state compares on the 6 Summary Statements to other states
2. How a state has changed over time in the 6 Summary Statements
• States get a score in each area. The scores are combined to
create an overall child achievement score.

Total score
Data quality score + Child achievement score
= Total Score
• States divided into 3 groups based on the total score.

Overview of the Total Score 1) Missing data
2) Out of range a to e values
1) Summary Statements
relative to other states
2) Change over time in
Summary Statements
Child
achievement
score
Data
quality
score Total
score
used
to
group
states

Discussion (or things to keep in mind)
• Thoughts on the two components?
– Data quality?
– Child achievement?
• The four pieces of the total score are weighted equally.
– Should they be?

1. Data Quality Score
1) Missing data:
– States assigned a score based on reporting outcomes data on:
• less than 34% of exiters ( = 0)
• 34 to 69% (= 1)
• 70% and above (= 2)
– 10 states in 2014 (out of 56) received a 0
– One state that sampled assigned a score of 1.
– This is a low bar for quality but a higher one would identify more states.

1. Data Quality Score
2) Out of range values for a through e
• We looked at the distributions across states to identify “cut
points” for out of range within each category:
• Assigned a score based on number (out of 15) in range:
– 9 or fewer in range (= 0)
– 10-12 (= 1)
– 13-15 (= 2)
• 3 states received a 0
Category a Category b Category c Category d Category e
0 <5 <5 <5 <5
>5 >50 >50 >50 >65

1. Data Quality Score
• Scores for Missing Data and Out of Range were added.
• Combined score could be 0 to 4:
– One state received a 0
– Five states received a 1
• The six states that received a 0 or 1 on Data Quality were
given a 0 for Child Achievement because their data could not
be trusted.
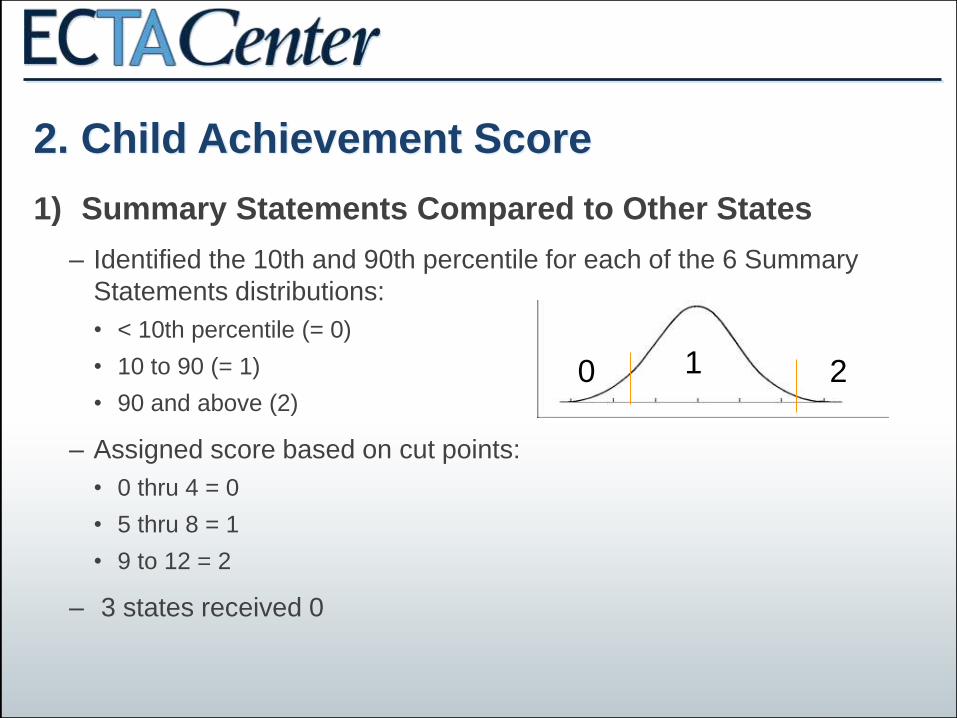
2. Child Achievement Score
1) Summary Statements Compared to Other States
– Identified the 10th and 90th percentile for each of the 6 Summary
Statements distributions:
• < 10th percentile (= 0)
• 10 to 90 (= 1)
• 90 and above (2)
– Assigned score based on cut points:
• 0 thru 4 = 0
• 5 thru 8 = 1
• 9 to 12 = 2
– 3 states received 0
0 1 2

2. Child Achievement Score
2) Change over Time in the Summary Statements (SS)
– Calculated statistical significance of changes in 6 Summary
Statements (most recent data compared to previous year’s)
– For each SS, a state received:
• 0 for negative change
• 1 for no difference
• 2 for positive change
– Assigned score based on cut points:
• 0 thru 3 = 0
• 4 thru 7 = 1
• 8 thru 12 = 2
– 6 states received a 0

2. Child Achievement Score
– Scores for SS Comparison and SS Change Over Time were combined
– Combined score could be 0 to 4
• No state received a 0
• Six states received a 1
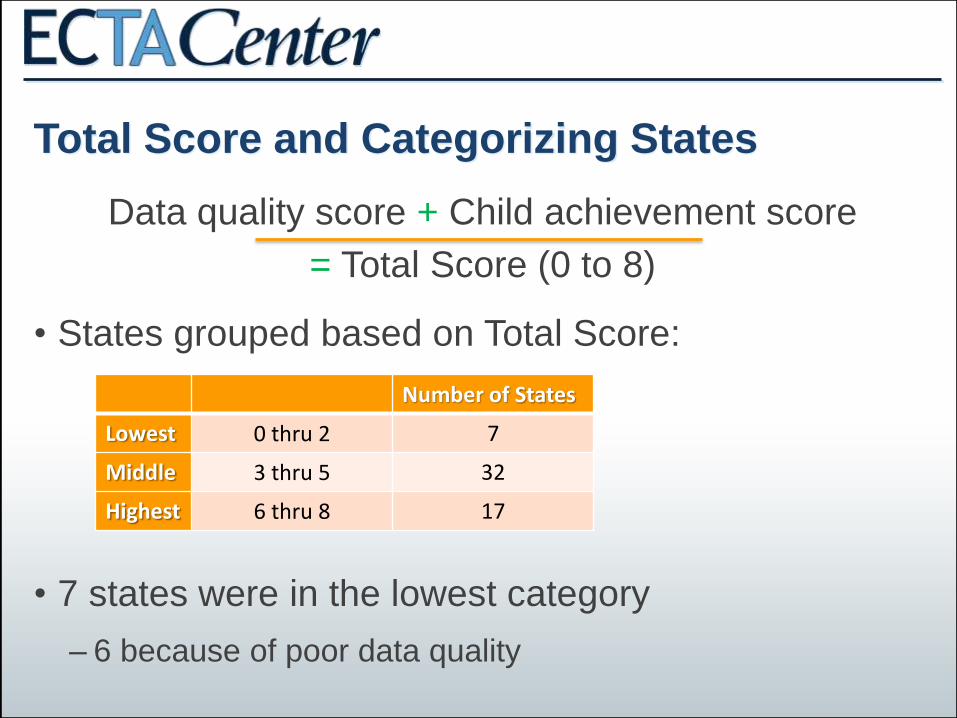
Total Score and Categorizing States
Data quality score + Child achievement score
= Total Score (0 to 8)
• States grouped based on Total Score:
• 7 states were in the lowest category
– 6 because of poor data quality
Number of States
Lowest 0 thru 2 7
Middle 3 thru 5 32
Highest 6 thru 8 17

1. Missing data (0-2)
2. Out of range a to e values
(0-2)
1. Summary Statements
relative to other states
(0-2)
2. Change over time in
Summary Statements (0-2)
Overview of Total Score
Child
achievement
score (0-4)
Data
quality
score
(0-4) Total
score
used to
group
states
(0-8)

Some Considerations
• How many states fall into any category is a function of where the cuts are
made
– 0-2 vs. 0-4
• System was designed to identify a small number of states in the lowest
category
• The criteria for data quality are not very high
– Should the criteria be set higher in future years as more states meet
the low bar?
• Our ability to examine data quality based on what states report in the APR
is very limited.
– Without a requirement for states to provide evidence of the validity of
their data, states with “undetectable” poor quality data can appear to
have good results (i.e., as if children are achieving at high levels.)
Additional Considerations and Discussion
• Are there other outcomes data we should consider?
– Family Outcomes?
– Child Find?
– Natural Environments?
– Other publically available data?
• Let’s examine some of these:
Family Outcomes
• What about family outcomes?
– State to state variation in how the family indicator data is collected is
extreme
• Different populations, different timing
– There is not much variation in what states are reporting on the family
data.
• Would be difficult to distinguish states
Child Find
• What about child find?
– Child find efforts are strongly influenced by factors that impact state
capacity to identify and serve children:
• Provider shortages, statewide hiring freezes, funding issues, etc.
• Changes made to “narrow” eligibility criteria due to reduced fiscal resources

Natural Environments
• What about natural environments (NE)?
– Over 51 states report over 90% of services in the natural environment.
– There is no expectation that 100% of services be provided in NE since
services should be individualized to meet children’s needs.
– Some states continue to struggle with implementing NE in rural areas:
• Provider shortages, driving distances, reimbursement rates for providers,
etc.