using an online interactive tool in an assignment on...
TRANSCRIPT

Using an Online Interactive Tool in anAssignment on Percent
Michael P. SacloloSt. Edward’s University
Austin, [email protected]
Joint Mathematics Meetings 2015San Antonio, TXJanuary 13, 2015

Outline
1. The Course
2. Online Interactive Tool
3. The Assignment
4. Reflection and The Future
Mathematics for the Liberal Arts
Fulfills mathematics general education for humanities andsocial science students.
Topics include: methods of problem solving, real numberoperations and applications, mathematical modeling, basicfinance, geometry and symmetry, voting andapportionment, networks and graph theory, and elementaryprobability and statistics.
Intended focus on improving quantitative literacy.

What Percent Are You?
I New York Times Interactive Feature.Acknowledgement: Dr. Chad Long, St. Edward’s University.
I Published January, 14, 2012.
I Search phrase: “What percent are you?”
I What Percent Are You? (2012, January 14). RetrievedJanuary 6, 2015, fromhttp://www.nytimes.com/interactive/2012/01/15/business/one-percent-map.html
I Note: None NYT have a 10 article “limit” per month.

What Percent Are You?
Source: What Percent Are You? (2012, January 14). Retrieved January 6, 2015, from
http://www.nytimes.com/interactive/2012/01/15/business/one-percent-map.html

What Percent Are You?
Source: What Percent Are You? (2012, January 14). Retrieved January 6, 2015, from
http://www.nytimes.com/interactive/2012/01/15/business/one-percent-map.html
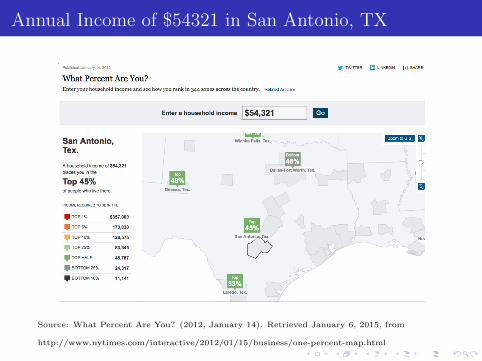
Annual Income of $54321 in San Antonio, TX
Source: What Percent Are You? (2012, January 14). Retrieved January 6, 2015, from
http://www.nytimes.com/interactive/2012/01/15/business/one-percent-map.html

Annual Income of $54321 in Austin, TX
Source: What Percent Are You? (2012, January 14). Retrieved January 6, 2015, from
http://www.nytimes.com/interactive/2012/01/15/business/one-percent-map.html

Related Site: Jobs of One Percenters
Source: The Top 1 Percent: What Jobs Do They Have? (2012, January 15). Retrieved January8, 2015, from
http://www.nytimes.com/packages/html/newsgraphics/2012/0115-one-percent-occupations/

Related Site: Jobs of One Percenters
1.8% of college and university professors are in the 1 percent.
Source: The Top 1 Percent: What Jobs Do They Have? (2012, January 15). Retrieved January8, 2015, from
http://www.nytimes.com/packages/html/newsgraphics/2012/0115-one-percent-occupations/
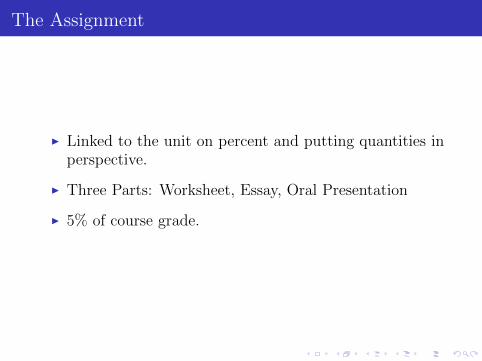
The Assignment
I Linked to the unit on percent and putting quantities inperspective.
I Three Parts: Worksheet, Essay, Oral Presentation
I 5% of course grade.
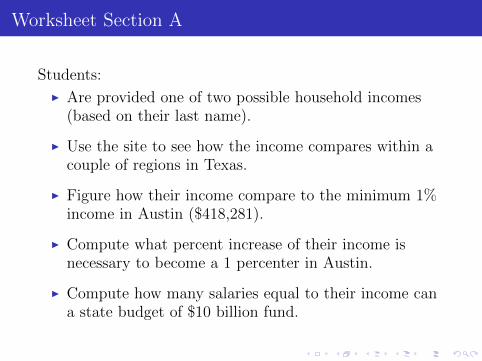
Worksheet Section A
Students:
I Are provided one of two possible household incomes(based on their last name).
I Use the site to see how the income compares within acouple of regions in Texas.
I Figure how their income compare to the minimum 1%income in Austin ($418,281).
I Compute what percent increase of their income isnecessary to become a 1 percenter in Austin.
I Compute how many salaries equal to their income cana state budget of $10 billion fund.

Worksheet Section B
Uses linked and related site about occupations andincomes. Students:
I Look at one type of occupation and solve (simple)problems relating percent.
I Reflect on why some quantities do not match exactly(due to rounding and significant digits).
I Research one particular occupation of their choosingand corresponding median or starting salaries, andobtain information about it from the site.
I Decide in which communities they would rather livegiven their chosen occupation.

Essay and Oral Presentation
I “In a short essay (100-150 words) write about thefollowing: Assuming you can secure the salary youfound [for your chosen career above], name anotherarea of the USA or the world other than Dallas-FortForth or Minneapolis-St. Paul, where you would mostlike to live and explain why. Cite at least three factorsthat explain your decision. At least one of the factorsmust be numerical in nature. Bonus point(s) for citingmore factors that are numerical in nature. Type thison a separate sheet and attach to the Project 1 packetthat you turn in.”
I Oral presentation is based on the short essay. (1minute)

The Assignment Packet
MATH 1312 Project I
What Percent Are You? Household income has become a hot-button issue in politics and the economy in recent years. The term “one percenter” has been used to refer to those people whose incomes are in the top one percent, and many regard this group of people as having a comfortable life. But since the cost of living varies in different parts of the country, a certain income may or may not afford a comfortable living in every region. For this project, you will access the following two websites, and examine household incomes and occupational salaries.
v The first is “What Percent Are You?” On this site, one can enter a household income and find out where does this income lies as compared to others in the country or certain regions of the country. From now on refer to this site as “Percent Site.”
http://www.nytimes.com/interactive/2012/01/15/business/one-percent-map.html?_r=0
Familiarize yourself with the interactive features of the Percent Site.
v The other is “The Top 1 Percent: What Jobs Do They Have?” On this site, one can explore different types of occupations and find out how many people in the country hold such jobs as well as the likelihood that they are in the top 1%. From now on refer to this site as “Jobs Site.” Note that the Jobs Site is also linked to the Percent Site.
http://www.nytimes.com/packages/html/newsgraphics/2012/0115-one-percent-
occupations/index.html?ref=business Familiarize yourself with the interactive features of the Jobs Site.
Page 1 Top Half

The Assignment Packet
Now proceed with the project. There are two parts:
Ø Part I is the written portion. This consists of doing exercises on the “Exercise Sheet” and attaching an essay. The Exercise Sheet and instructions for the essay start on Page 3. The essay will be your response to Exercise 9f of the Exercise Sheet be will evaluated according to completeness and writing proficiency.
Ø Part II is the oral presentation portion. The oral presentation portion is based on the essay (response
to 9f). Do not read the essay out loud; rather you must give a speech based on the contents of the essay. In the oral presentation you must mention:
o The occupation you choose in Number 9a as well as the salary you found in 9d. o The part of the world where you choose to live. o At least three factors that explain your decision to live there (at least one of the factors must
have a numerical component.
The presentation must 45 to 60 seconds long. No visual aids are allowed for this presentation. Thepresentation will be scored on whether you addressed the three items above, whether you stayed within the time allotted, as well as how well you delivered your presentation (engaging? appropriate volume? good flow?).
DUE DATE and WHAT TO TURN IN: The due date for the written portion and the oral presentation is Thursday, September 25, 2014. On this day, turn it a packet consisting of the following sheets of paper stapled together in this order:
• Grade Sheet (with your name on top). • Exercise Sheet • Essay
Page 1 Bottom Half

The Assignment Packet
Name_____________________________
Math 1312 Project I: What Percent Are You?
Grade Sheet
Component (Remember you will only have points for 3 out of the 4 articles.
Maximum Points
Points obtained
Exercise Sheet (1-9e)
Total out of 40 (see worksheet for point breakdown) not including 9f:_____________ x 2 = ____________
80
Essay Fulfilled all requirements of the essay (bonus possible) 6
Right length and overall writing quality 4
Oral presentation Total (10 points total)
Fulfilled all requirements of for the content of presentation
5
Right length (45-60 seconds) and Overall Presentation Quality (Was the presentation engaging? Did the presenter speak with an appropriate voice volume? Did the presentation have a good flow?)
4
Did the student evaluate others’ presentations? 1
Total points from above 100
Penalties Packet not stapled, lack of neatness, not right order, missing items such as the grade sheet, etc. (up to 5 points off) Lateness (2 points off per class day late)
Page 2

The Assignment Packet
Exercise Sheet for “What Percent Are You?” Do the following exercises. Section A: Use the Percent Site for this portion.
1) (2 pts) Enter the following incomes depending on the letter with which your family (last) name begins: $69,500 for A-L, or $83,500 for M-Z. From now on refer to this income as “your household income.” Now click on the Austin, Tex. region on the interactive map. (You may need to center Texas on the screen and zoom in.) How does a your household income compare to the rest in that same region (something like “Top X%?”).
Answer:______________________________________
2) (2 pts) Now click on the Wichita Falls, Tex. region (close to the border with Oklahoma). How does your household income compare to the rest in that region? Write the answer below.
Answer:______________________________________
3) (2 pts) Suppose that the Austin, Tex. region consists of 784,000 households. Using your answer in Number 1 above, how many households in the region have an income at or above your household income? Compute the answer below and show all your calculations.
Answer:______________________________________
4) (2 pts) Click back on Austin, Tex. and look to the left of the map. It should say some more information about household incomes in the Austin, Tex. region. According to the information on this part, what household income would put you at the top 1% of incomes in Austin? Write the answer below. (Hint: The answer should be bigger than your household income.)
Answer______________________________________
Page 3 Top Half

The Assignment Packet
5) (4 pts) How does the household income you obtained as the answer in Number 4 above compare to your household income? Answer this question by completing the following sentence:
The household income in Number 4 is about____________ times my household income. (Fill in the blank with the closest whole number.)
Show how you obtained the number you wrote on the blank in the space below.
6) (4 pts) What percent of your household income do you need to add to it in order to reach an income that puts you at the top 1% in the Austin, Tex. region? Hint: You may need to compute a “relative difference.” Compute the answer below and show your work. Round your answer to the nearest whole percent. Show all your calculations.
Answer:________________________
7) (4 pts) Suppose that a state has devoted $10 billion for state employee salaries. If the average state employee salary is the amount of your household income, how many people can the state employ? Round your answer to the nearest whole number. Show all your calculations.
Answer:________________________
Page 3 Bottom Half

The Assignment Packet
Section B: Use the Jobs Site for this portion (except for Number 9d).
8) Find and hover on “Fabricators and Operators.” (The easiest way to find this is to enter “Fabricators and Operators” in search field on the upper right of the interactive feature.)
a. (2 pts) According to the information on this site, about how many people have this job?
Answer:_____________________________________
b. (2 pts) What percent of these fabricators and operators are in the top 1%? Answer:_____________________________________
c. (2 pts) Compute the actual number of fabricators in the top 1% using your answers from 8a and 8b. Show your calculation.
Answer:_____________________________________
d. (2 pts) Explain why your answer in 8c is not necessarily equal to 3,079, which is the number of fabricators and operators that live in households in the top 1%.
Page 4 Top Half

The Assignment Packet
1
9) Now choose a different occupation on the interactive feature. Make sure to be as specific as possible. For example, under “Managers,” you must also choose the sector (e.g. Banking).
a. (2 pts) Write your occupation choice here:______________________________________________.
b. (2 pts) According to the information provided, about how many people have this occupation?
Answer:______________________________________
c. (2 pts) What percent of the people with this occupation is in the top 1%.
Answer:______________________________________
d. (3 pts) Do some research on other sites and find out an average starting salary for this occupation. Write the
salary and cite your source. Then enter this salary on the Percent Site. Where does this salary place you in the United States (e.g. top X%? or bottom Y%)?
Salary:_________________________
Placement:_______________________ Source:____________________________________________________
e. (3 pts) Assuming you are able to secure the same salary you found in 9d, where would your rather live: Dallas-Fort Worth area or Minneapolis-St. Paul (Minnesota)? Cite three factors that justify your decision. At least one of the factors must be numerical in nature. Bonus point(s) for citing more factors that are numerical in nature.
f. In a short essay (100-150 words) write about the following: Assuming you can secure the salary you found in
9d, name another area of the USA or the world other than Dallas-Fort Forth or Minneapolis-St. Paul, where you would most like to live and explain why. Cite at least three factors that explain your decision. At least one of the factors must be numerical in nature. Bonus point(s) for citing more factors that are numerical in nature. Type this on a separate sheet and attach to the Project 1 packet that you turn in.
(Instructor use only: Total Points for Parts 1 to 9e = ___________________________.)
Page 4 Bottom Half

Challenges, Results, Reflection from Fall 2014
I Scope and length of the assignment. How to focus onquantitative literacy and interpreting numbers inmedia, and at the same time reinforce the moreparticular (and more mathematical) skills in the unit?
I Challenge of combining common, free-response, andopen-ended questions. The first type of question iseasier/faster to grade.
I In essay portion, students focused too much on beingon the upper percent, rather than thinking about theirown interests and lifestyle. (A noticeable number choseto live in Flynt, Michigan.)

Planned Changes for Spring 2015
I Enhanced essay portion (and consequently a change tothe oral presentation).
I Students are asked to find an ideal region in the US fora fictional character to live based on her situation andwish list (includes salary, housing price restrictions,hobbies and interests).
I Students must support their choices and claims (e.g.through citing sources).
I Students are to make numerical comparisons (e.g. “Thecrime rate in Place X is three times that of Place Y.”)
I Develop and write out clear statement of the goals ofthe assignment.
Email: [email protected]