using aerial imagery to assess wetland hydrology
TRANSCRIPT
1
Background
Using Aerial Imagery to Assess
Wetland Hydrology
WETLAND CONSERVATION ACT
BWSR Technical Guidance, July 1, 2010
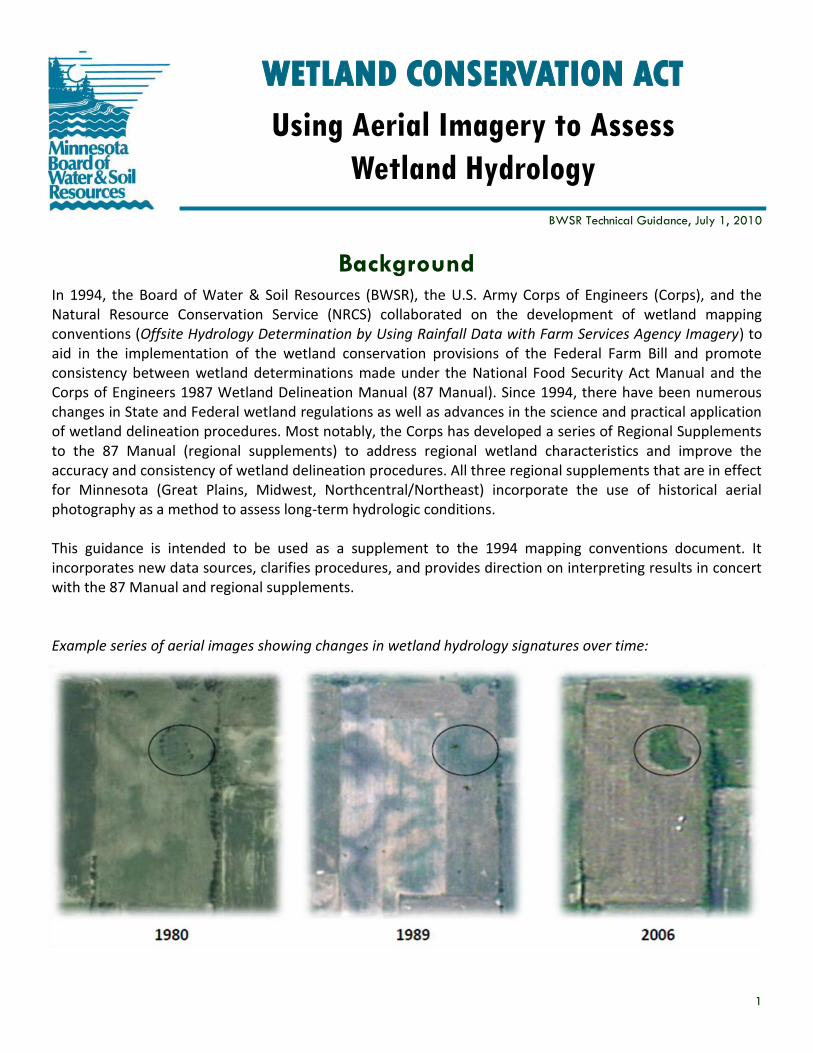
In 1994, the Board of Water & Soil Resources (BWSR), the U.S. Army Corps of Engineers (Corps), and the Natural Resource Conservation Service (NRCS) collaborated on the development of wetland mapping conventions (Offsite Hydrology Determination by Using Rainfall Data with Farm Services Agency Imagery) to aid in the implementation of the wetland conservation provisions of the Federal Farm Bill and promote consistency between wetland determinations made under the National Food Security Act Manual and the Corps of Engineers 1987 Wetland Delineation Manual (87 Manual). Since 1994, there have been numerous changes in State and Federal wetland regulations as well as advances in the science and practical application of wetland delineation procedures. Most notably, the Corps has developed a series of Regional Supplements to the 87 Manual (regional supplements) to address regional wetland characteristics and improve the accuracy and consistency of wetland delineation procedures. All three regional supplements that are in effect for Minnesota (Great Plains, Midwest, Northcentral/Northeast) incorporate the use of historical aerial photography as a method to assess long-term hydrologic conditions. This guidance is intended to be used as a supplement to the 1994 mapping conventions document. It incorporates new data sources, clarifies procedures, and provides direction on interpreting results in concert with the 87 Manual and regional supplements. Example series of aerial images showing changes in wetland hydrology signatures over time:
2
The procedures described in this document are most useful for interpreting wetland hydrology in agricultural areas. In general, review of aerial imagery for assessing wetland hydrology is more accurate in agricultural fields that were planted with annually seeded row crops such as soybeans and corn. These fields will often show signs of crop stress, standing water, or drowned out crops in summer aerial imagery when wetland hydrology is present. An aerial imagery review for signs of crop stress due to wetness is typically not as reliable for fields planted in perennial forage crops compared to those planted to row crops, depending on a number of factors discussed later. There are also some situations where air photo review can provide useful information in areas that are not cropped or hayed, such as pastures and naturally vegetated seasonally flooded/saturated wetlands (with appropriate caution). However, greater emphasis should be placed on other data sources (e.g. those listed in the 87 Manual and supplements) in these situations.
Applicability
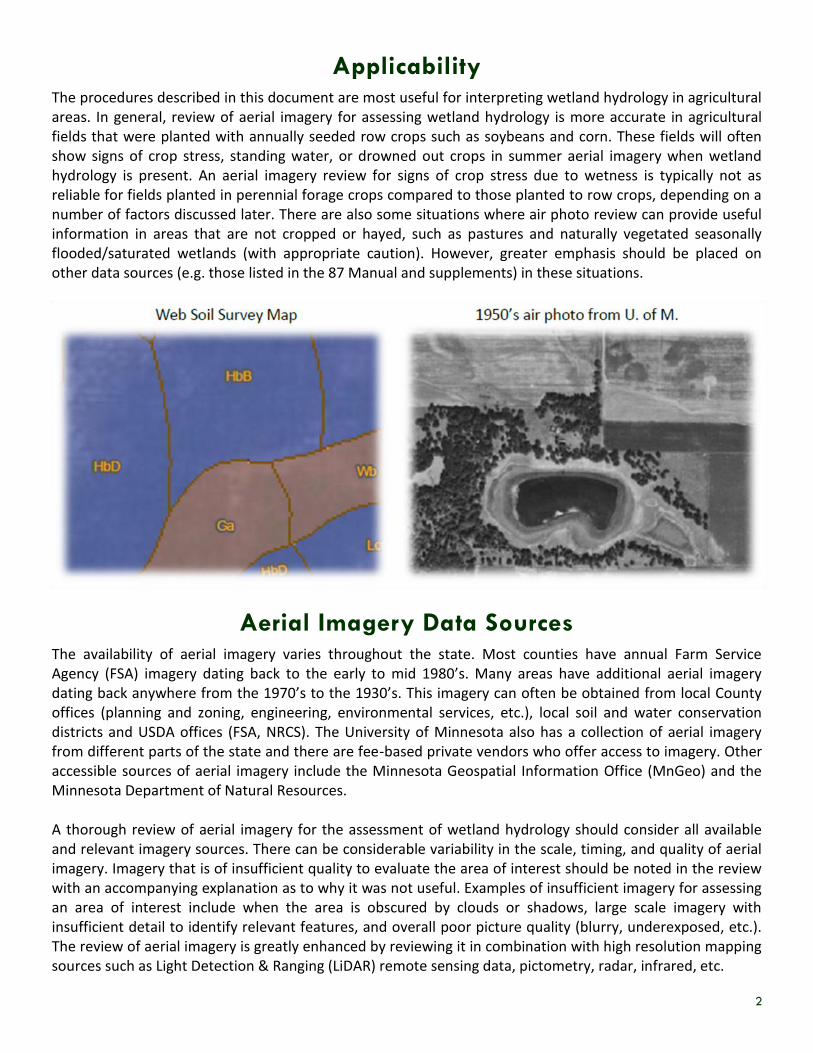
Aerial Imagery Data Sources The availability of aerial imagery varies throughout the state. Most counties have annual Farm Service Agency (FSA) imagery dating back to the early to mid 1980’s. Many areas have additional aerial imagery dating back anywhere from the 1970’s to the 1930’s. This imagery can often be obtained from local County offices (planning and zoning, engineering, environmental services, etc.), local soil and water conservation districts and USDA offices (FSA, NRCS). The University of Minnesota also has a collection of aerial imagery from different parts of the state and there are fee-based private vendors who offer access to imagery. Other accessible sources of aerial imagery include the Minnesota Geospatial Information Office (MnGeo) and the Minnesota Department of Natural Resources. A thorough review of aerial imagery for the assessment of wetland hydrology should consider all available and relevant imagery sources. There can be considerable variability in the scale, timing, and quality of aerial imagery. Imagery that is of insufficient quality to evaluate the area of interest should be noted in the review with an accompanying explanation as to why it was not useful. Examples of insufficient imagery for assessing an area of interest include when the area is obscured by clouds or shadows, large scale imagery with insufficient detail to identify relevant features, and overall poor picture quality (blurry, underexposed, etc.). The review of aerial imagery is greatly enhanced by reviewing it in combination with high resolution mapping sources such as Light Detection & Ranging (LiDAR) remote sensing data, pictometry, radar, infrared, etc.
3
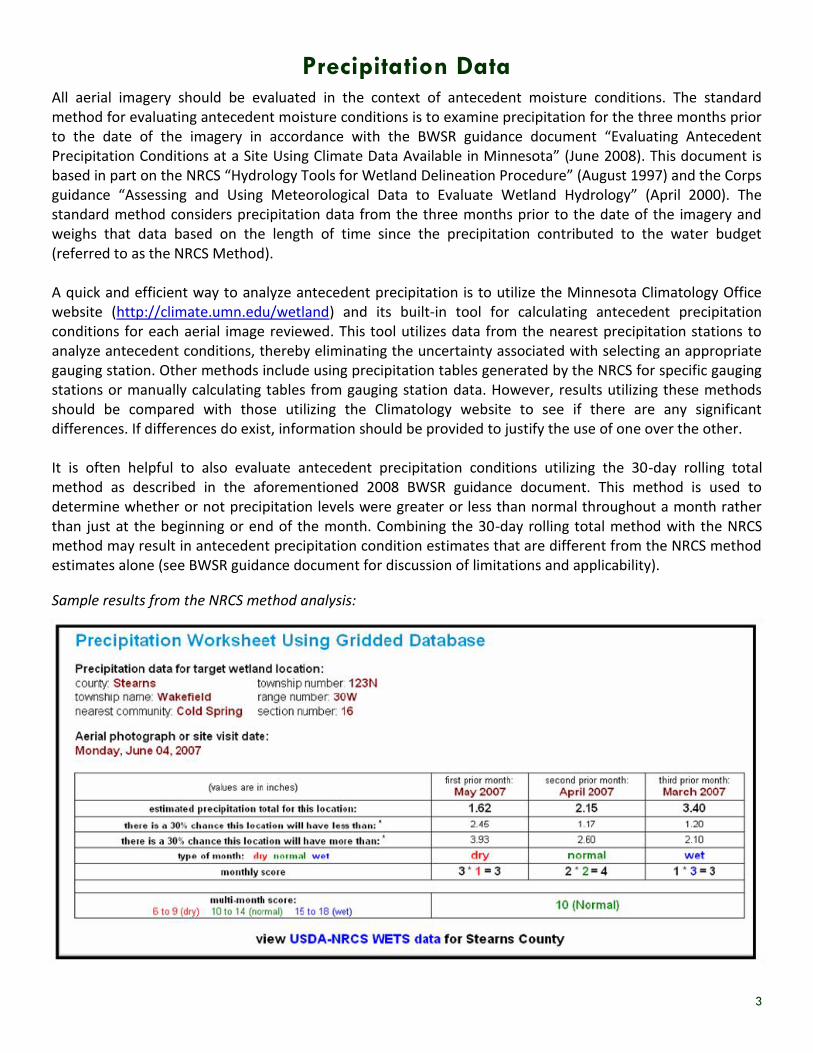
Precipitation Data All aerial imagery should be evaluated in the context of antecedent moisture conditions. The standard method for evaluating antecedent moisture conditions is to examine precipitation for the three months prior to the date of the imagery in accordance with the BWSR guidance document “Evaluating Antecedent Precipitation Conditions at a Site Using Climate Data Available in Minnesota” (June 2008). This document is based in part on the NRCS “Hydrology Tools for Wetland Delineation Procedure” (August 1997) and the Corps guidance “Assessing and Using Meteorological Data to Evaluate Wetland Hydrology” (April 2000). The standard method considers precipitation data from the three months prior to the date of the imagery and weighs that data based on the length of time since the precipitation contributed to the water budget (referred to as the NRCS Method). A quick and efficient way to analyze antecedent precipitation is to utilize the Minnesota Climatology Office website (http://climate.umn.edu/wetland) and its built-in tool for calculating antecedent precipitation conditions for each aerial image reviewed. This tool utilizes data from the nearest precipitation stations to analyze antecedent conditions, thereby eliminating the uncertainty associated with selecting an appropriate gauging station. Other methods include using precipitation tables generated by the NRCS for specific gauging stations or manually calculating tables from gauging station data. However, results utilizing these methods should be compared with those utilizing the Climatology website to see if there are any significant differences. If differences do exist, information should be provided to justify the use of one over the other. It is often helpful to also evaluate antecedent precipitation conditions utilizing the 30-day rolling total method as described in the aforementioned 2008 BWSR guidance document. This method is used to determine whether or not precipitation levels were greater or less than normal throughout a month rather than just at the beginning or end of the month. Combining the 30-day rolling total method with the NRCS method may result in antecedent precipitation condition estimates that are different from the NRCS method estimates alone (see BWSR guidance document for discussion of limitations and applicability).
Sample results from the NRCS method analysis:
4
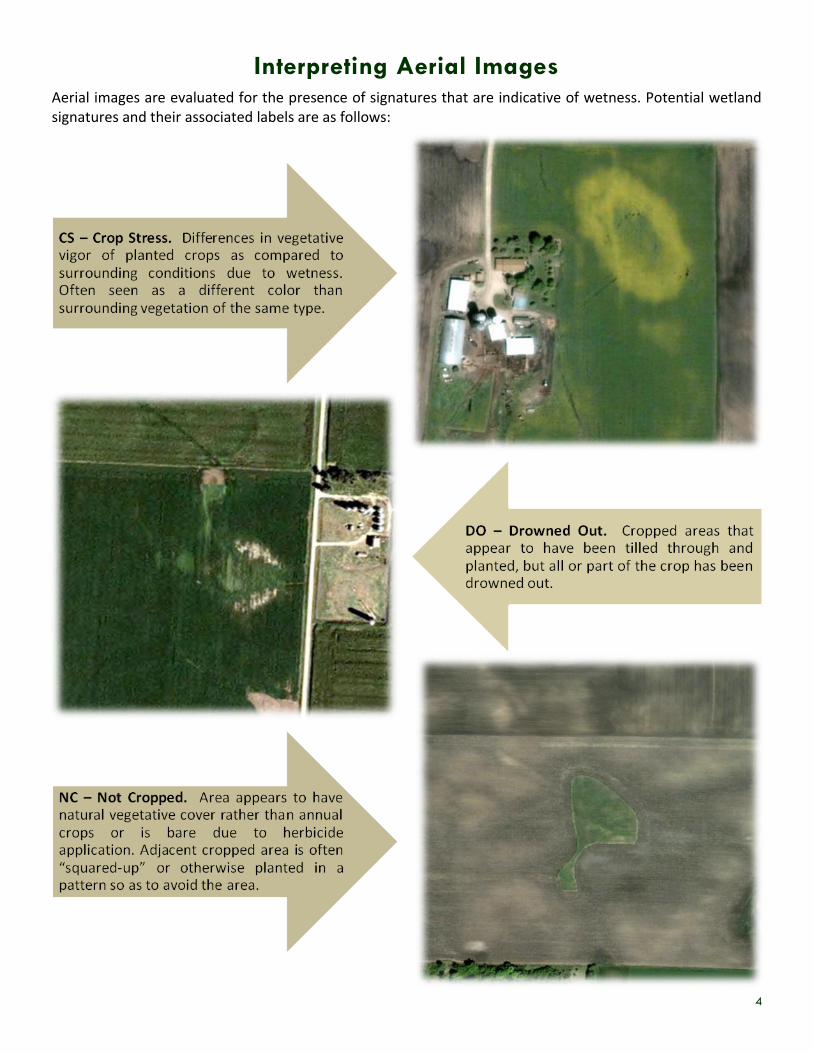
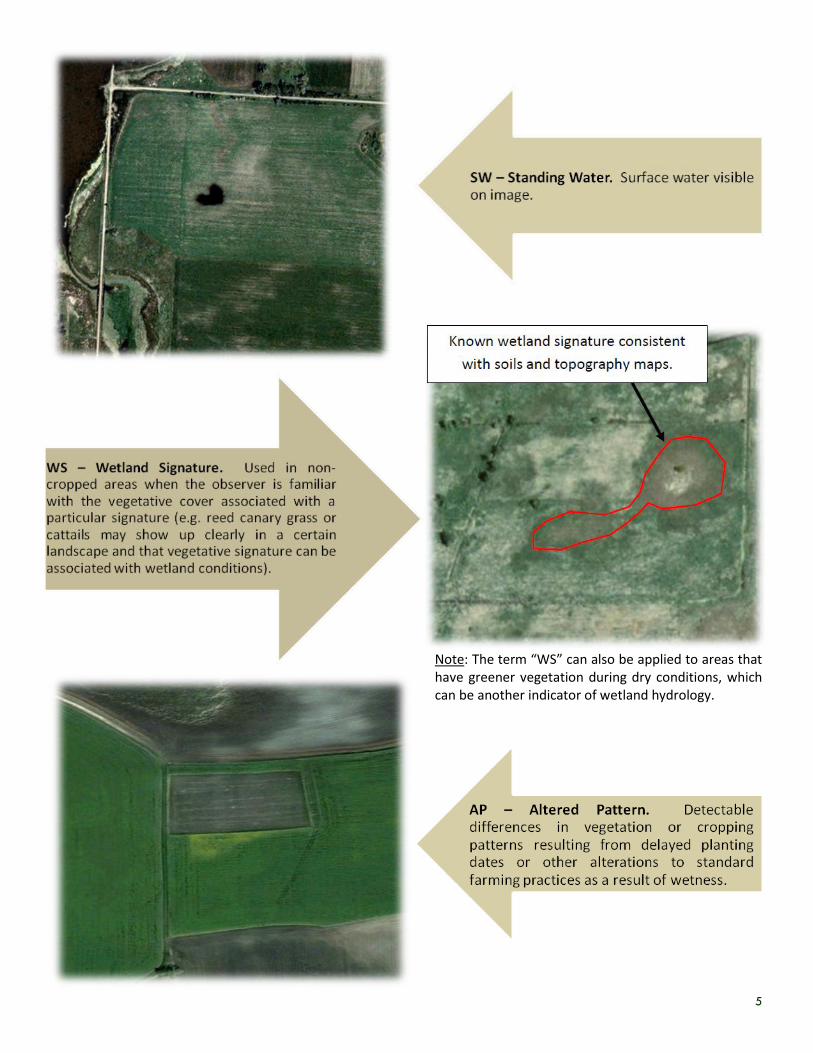
Interpreting Aerial Images Aerial images are evaluated for the presence of signatures that are indicative of wetness. Potential wetland signatures and their associated labels are as follows:
5
Note: The term “WS” can also be applied to areas that have greener vegetation during dry conditions, which can be another indicator of wetland hydrology.
6
The following signature and label is associated with non-wetland conditions: NV – Normal Vegetative cover. The outline of the area in question cannot be readily distinguished from the surrounding upland area or the signatures on the image are not due to wetness. Multiple signature notations such as CS/DO or NC/SW can be used to more accurately describe areas on photos that exhibit multiple wetland hydrology signatures. It is sometimes beneficial to review aerial imagery taken during or following periods of low precipitation or drought. Signs of wetness during these periods may include darker vegetation tones and colors in potential wetland areas contrasted with lighter colors and tones in surrounding areas. In those instances the general “WS” notation can be utilized if it is accompanied by an explanation in the associated report or on the review data form. It is essential to have an understanding of land use and landscape conditions associated with the site being evaluated in order to accurately interpret aerial imagery. There are often instances where the wetland signatures described above appear for reasons other than wetness. For example, high alkalinity areas in cropped fields (iron chlorosis) can often show up as crop stress or drowned out on aerial imagery even though these manifestations are not associated with wetness. Similarly, areas of crop stress or apparent drowned out in winter wheat may in fact be due to severe winter weather such as high fall/winter precipitation or freeze out. In areas of cropped organic soils, photo tone differences can be caused by peat depth (shallower peat may show a lighter photo tone) and by the ability of organic soils to retain moisture (an area may show a dark photo tone that contrasts with the appearance of nearby mineral soils). In addition, producers can make decisions on cropping based on business considerations that may have nothing to do with wetness in a particular field.
Variables Affecting the Reliability of Photo Interpretation
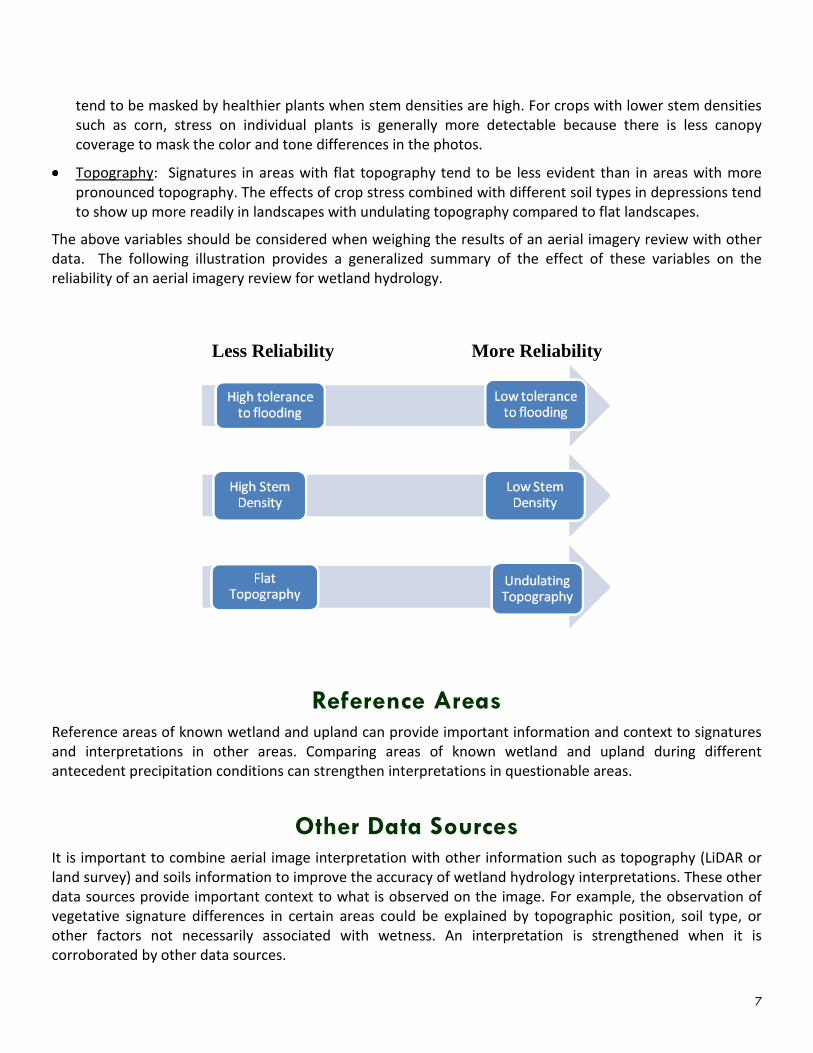
Several variables associated with the landscape conditions of the particular area being reviewed will influence the reliability of air photo signatures and the interpretation of them. These variables include the overall tolerance of vegetation to flooding or saturation, average vegetative stem density/canopy coverage, and topography.
Tolerance to flooding/saturation: The type of vegetation present at the time of the image and the relative tolerance of that vegetation to flooding and saturation influence the reliability of an image to accurately reflect hydrologic conditions. Some information on vegetation tolerance to flooding or saturation can be deduced from the assigned wetland indicator status of the species (i.e. a FACW species is more tolerant to flooding and saturation than a FACU species). Signatures in fields planted with species that are less tolerant to prolonged flooding or saturation will typically be more reliable than signatures in fields planted with more tolerant species. For example, certain turf grasses may have a high tolerance for flooding or saturation whereas certain forage crops such as alfalfa have a low tolerance for prolonged flooding or saturation. Information on the tolerance of crop and hay species to flooding and saturation can also be obtained from other sources such as the University of Minnesota Extension and published agronomy studies.
Stem Density/Canopy Coverage: The existence and strength of a signature due to prolonged flooding or saturation is partly dependent on the average stem density or canopy coverage of the planted crop. In general, the lower the stem density, the easier it is to detect the effects of prolonged flooding/saturation on aerial imagery. From an aerial view, the effects of moisture-related stress on individual plants will tend to be masked by healthier plants when stem densities are high. For crops with lower stem densities
7
tend to be masked by healthier plants when stem densities are high. For crops with lower stem densities such as corn, stress on individual plants is generally more detectable because there is less canopy coverage to mask the color and tone differences in the photos.
Topography: Signatures in areas with flat topography tend to be less evident than in areas with more pronounced topography. The effects of crop stress combined with different soil types in depressions tend to show up more readily in landscapes with undulating topography compared to flat landscapes.
The above variables should be considered when weighing the results of an aerial imagery review with other data. The following illustration provides a generalized summary of the effect of these variables on the reliability of an aerial imagery review for wetland hydrology.
Other Data Sources
Less Reliability More Reliability
Reference areas of known wetland and upland can provide important information and context to signatures and interpretations in other areas. Comparing areas of known wetland and upland during different antecedent precipitation conditions can strengthen interpretations in questionable areas.
Reference Areas
It is important to combine aerial image interpretation with other information such as topography (LiDAR or land survey) and soils information to improve the accuracy of wetland hydrology interpretations. These other data sources provide important context to what is observed on the image. For example, the observation of vegetative signature differences in certain areas could be explained by topographic position, soil type, or other factors not necessarily associated with wetness. An interpretation is strengthened when it is corroborated by other data sources.
8
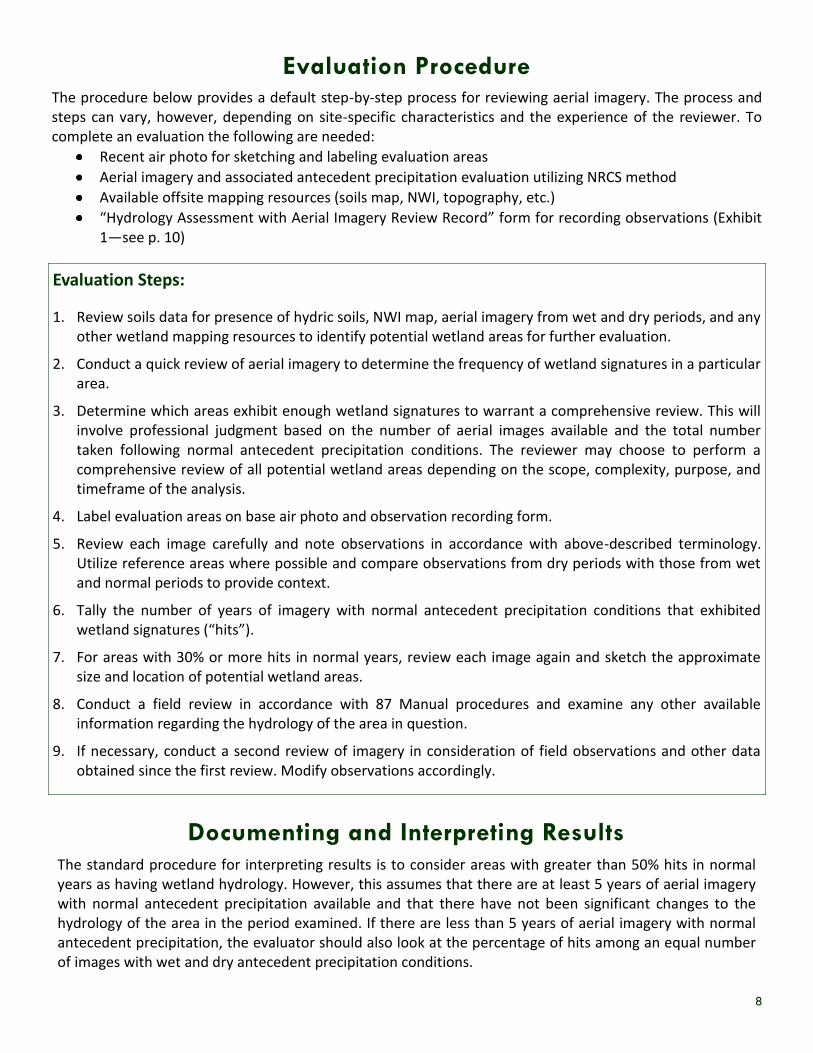
Evaluation Procedure The procedure below provides a default step-by-step process for reviewing aerial imagery. The process and steps can vary, however, depending on site-specific characteristics and the experience of the reviewer. To complete an evaluation the following are needed:
Recent air photo for sketching and labeling evaluation areas
Aerial imagery and associated antecedent precipitation evaluation utilizing NRCS method
Available offsite mapping resources (soils map, NWI, topography, etc.)
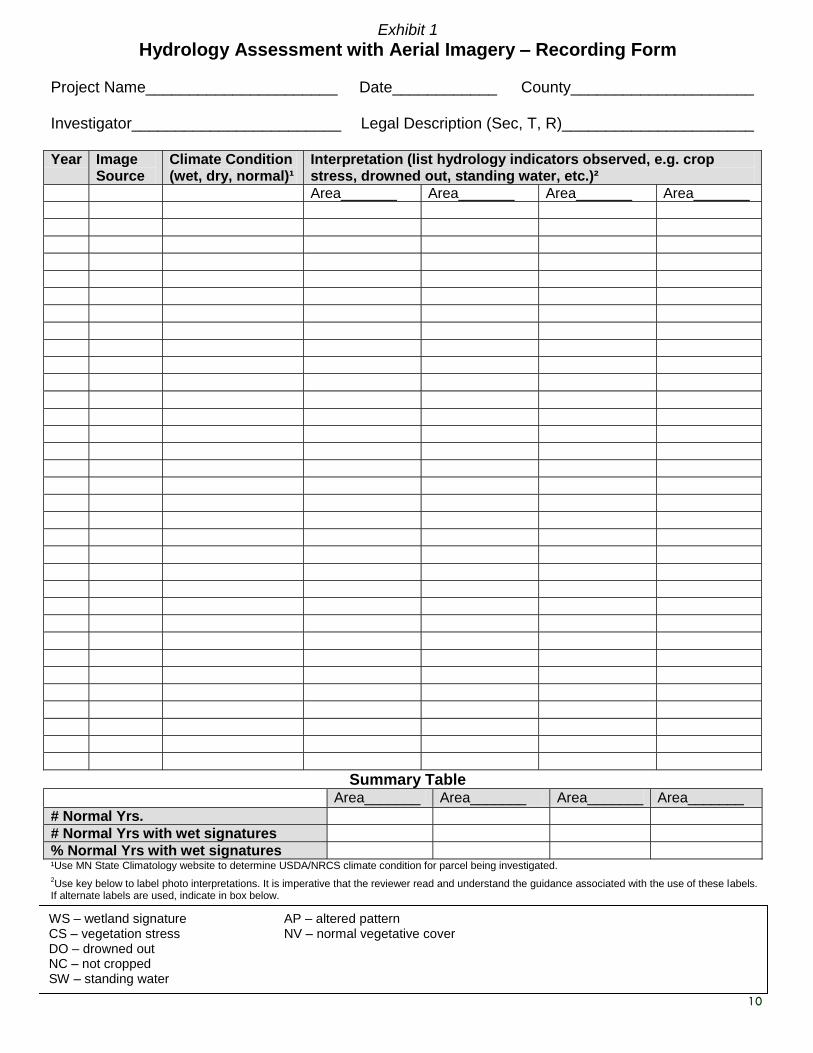
“Hydrology Assessment with Aerial Imagery Review Record” form for recording observations (Exhibit 1—see p. 10)
Documenting and Interpreting Results
Evaluation Steps:
1. Review soils data for presence of hydric soils, NWI map, aerial imagery from wet and dry periods, and any other wetland mapping resources to identify potential wetland areas for further evaluation.
2. Conduct a quick review of aerial imagery to determine the frequency of wetland signatures in a particular area.
3. Determine which areas exhibit enough wetland signatures to warrant a comprehensive review. This will involve professional judgment based on the number of aerial images available and the total number taken following normal antecedent precipitation conditions. The reviewer may choose to perform a comprehensive review of all potential wetland areas depending on the scope, complexity, purpose, and timeframe of the analysis.
4. Label evaluation areas on base air photo and observation recording form.
5. Review each image carefully and note observations in accordance with above-described terminology. Utilize reference areas where possible and compare observations from dry periods with those from wet and normal periods to provide context.
6. Tally the number of years of imagery with normal antecedent precipitation conditions that exhibited wetland signatures (“hits”).
7. For areas with 30% or more hits in normal years, review each image again and sketch the approximate size and location of potential wetland areas.
8. Conduct a field review in accordance with 87 Manual procedures and examine any other available information regarding the hydrology of the area in question.
9. If necessary, conduct a second review of imagery in consideration of field observations and other data obtained since the first review. Modify observations accordingly.
The standard procedure for interpreting results is to consider areas with greater than 50% hits in normal years as having wetland hydrology. However, this assumes that there are at least 5 years of aerial imagery with normal antecedent precipitation available and that there have not been significant changes to the hydrology of the area in the period examined. If there are less than 5 years of aerial imagery with normal antecedent precipitation, the evaluator should also look at the percentage of hits among an equal number of images with wet and dry antecedent precipitation conditions.
9
In instances where hydrologic changes have occurred over time, the results of the review may need to be grouped to reflect current conditions. For example, an area may exhibit wetland signatures in a number of years prior to a tile repair, followed by a lack of observed signatures after the repair. The reviewer must determine if the repair was legal/authorized and now represents the “normal circumstance” according to the 87 Manual. If so, then only the images after the tile repair would be relevant in determining if wetland hydrology is present on the site under the new normal circumstance. Conversely, aerial imagery of an area with a failed tile line may show wetland signatures after the failure, but not during the years in which it was functioning. In that case, the current condition of the area with the failed tile represents the new normal circumstance for determining if it has wetland hydrology at the time of the evaluation. The strength of an aerial imagery review for wetland hydrology is increased when a larger number of images are available from periods following normal antecedent precipitation. Even when a sufficient number of images exist to complete the standard evaluation, the strength of the results should be considered in relation to the quality of aerial imagery, overall confidence in interpretations, and other site-specific factors.
Important Final Points
The results of an aerial imagery review are not the final determination as to whether or not an area is a wetland. Most imagery used in this procedure is taken during mid-growing season and consequently does not always reflect typical wetter early-growing season conditions. Because of this, it is incumbent upon delineators to utilize other data to more accurately evaluate the hydrologic condition of the site. Delineators should follow the wetland delineation protocol described in the 87 Manual and applicable regional supplement to make a final determination, including field reviews and considering other data. Evaluating multiple years of aerial imagery is one of many approaches described in Chapter 5 of the regional supplements for determining whether wetland hydrology is present in a particular area. The results of the aerial imagery review should not be used to override or “trump” other data to the contrary, but instead should be weighed alongside it. The reliability of a wetland delineation is increased when multiple data sources and approaches support the same conclusion. Delineators must weigh the strength of their aerial imagery review results with the strength of other data sources when determining the existence of a wetland and its boundary.
The primary author of this guidance is Ken Powell, Senior Wetland Specialist.
This document is available on the BWSR website and may be revised periodically. Check the website for the most current version. www.bwsr.state.mn.us/wetlands
Contact your Local Government Unit or BWSR Wetland
Specialist for assistance in determining the applicability and
appropriate use of aerial imagery to assess a particular site.
BWSR Guidance, July 1, 2010
10
Exhibit 1
Hydrology Assessment with Aerial Imagery – Recording Form Project Name______________________ Date____________ County_____________________ Investigator________________________ Legal Description (Sec, T, R)______________________ Year Image
Source Climate Condition (wet, dry, normal)¹
Interpretation (list hydrology indicators observed, e.g. crop stress, drowned out, standing water, etc.)²
Area_______ Area_______ Area_______ Area_______
Summary Table
Area_______ Area_______ Area_______ Area_______
# Normal Yrs.
# Normal Yrs with wet signatures
% Normal Yrs with wet signatures ¹Use MN State Climatology website to determine USDA/NRCS climate condition for parcel being investigated. 2Use key below to label photo interpretations. It is imperative that the reviewer read and understand the guidance associated with the use of these labels.
If alternate labels are used, indicate in box below.
WS – wetland signature AP – altered pattern CS – vegetation stress NV – normal vegetative cover DO – drowned out NC – not cropped SW – standing water