usinas siderúrgicas de minas gerais s.a. -...
TRANSCRIPT

(A free translation of the original in Portuguese)
Usinas Siderúrgicas de Minas Gerais S.A. - USIMINAS Quarterly Information (ITR) at September 30, 2018 and report on review of quarterly information

PriceT: (3
Re To tUsi Int We UsiInfodatethenand Manaccoof th(IASwelSecresp Sco We FinIndthe inquandwithassuAcc Con Basparrefeappstan
ewaterhouseCoop31) 3269‐1500, F:
eport on r
the Board of Dnas Siderúrgi
troduction
have reviewenas Siderúrgiormation Forme and the statn ended, and
d a summary o
nagement is rounting inforhe Brazilian AS) 34, Interiml as the preseurities Commponsibility is
ope of review
conducted ouancial Inform
dependent AudIndependentuiries, primar
d other reviewh Brazilian anurance that wcordingly, we
nclusion on
sed on our revent company
erred to aboveplicable to thendards issued
ers, Rua dos Incon: (31) 3261‐6950
review of
Directors andicas de Minas
ed the accompicas de Minasm (ITR) for thtements of opthe statemen
of significant
responsible formation in accAccounting Prm Financial R
ntation of thimission (CVM
to express a c
w
ur review in amation (NBC T
ditor of the Et Auditor of thrily of person
w procedures. nd Internation
we would becodo not expres
n the interim
view, nothing and consolid
e has not beene preparation d by the CVM.
nfidentes 911, 17º, www.pwc.com/
f quarterl
d Shareholders Gerais S.A. -
panying parens Gerais S.A. -he quarter en
perations and nts of changes
accounting p
or the preparacordance withronouncemeneporting issueis information), applicable t
conclusion on
accordance wiTR 2410 - Revntity and ISR
he Entity, resps responsibleA review is su
nal Standardsome aware of ss an audit op
m informatio
has come to odated interim n prepared, inof the Quarte.
º e 18º, Belo Horiz/br
ly inform
rs - USIMINAS
nt company a- USIMINAS (nded Septemb
comprehensis in equity andolicies and ot
ation of the pah the accountints Committeed by the Inten in accordanto the prepara
n this interim
ith Brazilian aview of Interim
RE 2410 - Revpectively). A r for financial ubstantially les on Auditing all significant
pinion.
on
our attentionaccounting in
n all material erly Informati
zonte, MG, Brasil 3
mation
and consolidat("Company")
ber 30, 2018, ive income ford cash flow fother explanato
arent companing standard
ee (CPC) and Iernational Acce with the station of the Qaccounting in
and Internatim Financial I
view of Interimreview of inteand accounti
ess in scope thg and consequt matters that
n that causes unformation inrespects, in a
ion, and prese
30140-128, Caixa
ted interim ac, included in tcomprising thr the quarter
or the nine-mory informati
ny and consolCPC 21, InterInternational
ccounting Stantandards issu
Quarterly Infonformation ba
onal StandardInformation Pm Financial Inerim informating matters, ahan an audit
uently does not might be ide
us to believe tncluded in theaccordance wiented in acco
Postal 289
ccounting infthe Quarterlyhe balance shand nine-moonth period tion.
lidated interimrim Financial l Accounting Sndards Boarded by the Bra
ormation (ITRased on our re
ds on ReviewPerformed by nformation Ption consists oand applying aconducted in
ot enable us toentified in an
that the accome quarterly infith CPC 21 anrdance with t
formation of y heet at that onth periods then ended,
m Reporting, Standard d (IASB), as azilian R). Our eview.
ws of Interim the
Performed by of making analytical
n accordance o obtain audit.
mpanying formation
nd IAS 34 the
PricewaterhousT: (31) 3269‐1
Other mat Statement We have alsperiod endeand are requpreparationwhich do nosubmitted tattention thconsistent w Belo Horizo PricewaterhAuditores InCRC 2SP00 Fábio AbreuContador C
seCoopers, Rua d500, F: (31) 326
tters
ts of value a
so reviewed ted Septembeuired to be p
n of Quarterlyot require theto the same rhat causes us with the pare
onte, October
houseCooperndependente
00160/O-5
u de Paula RC 1MG0752
dos Inconfidentes61‐6950, www.pw
added
the parent cor 30, 2018. T
presented in ay Informatioe presentatio
review procedto believe th
ent company
r 25, 2018
rs es
204/O-0
s 911, 17º e 18º, Bwc.com/br
ompany and These statemaccordance w
on (ITR) and on of the statdures describhat they have
and consolid
Belo Horizonte, M
consolidatedments are the
with standardare consider
tement of valbed above ane not been prdated interim
MG, Brasil 30140
d statements responsibilitds issued by red supplemelue added. Thnd, based on repared, in alm accounting
0-128, Caixa Post
of value addty of the Comthe CVM appentary informhese statemeour review, nll material reg information
tal 289
ded for the nimpany's manplicable to thmation undeents have beenothing has
espects, in a mn taken as a w
ine-month nagement, he r IFRS, en come to our manner whole.
4
Contents
Company Information / Capital Breakdown 4
Parent Company Financial Statements / Balance Sheet – Assets 5
Parent Company Financial Statements / Balance Sheet - Liabilities 6
Parent Company Financial Statements / Statement of Operations 7
Parent Company Financial Statements / Statement of Comprehensive Income (Loss) 8
Parent Company Financial Statements / Cash Flow Statement - Indirect Method 9
Parent Company Financial Statements / Statement of Changes in Equity - 01/01/2018 to 09/30/2018 10
Parent Company Financial Statements / Statement of Changes in Equity - 01/01/2017 to 09/30/2017 11
Parent Company Financial Statements / Statement of Value Added 12
Consolidated Financial Statements - Balance Sheet - Assets 13
Consolidated Financial Statements / Balance Sheet - Liabilities 14
Consolidated Financial Statements / Statement of Operations 15
Consolidated Financial Statements / Statement of Comprehensive Income (loss) 16
5
Consolidated Financial Statements / Cash Flow Statement - Indirect Method 17
Consolidated Financial Statements / Statement of Changes in Equity - 01/01/2018 to 09/30/2018 18
Consolidated Financial Statements / Statement of Changes in Equity - 01/01/2017 to 09/30/2017 19
Consolidated Financial Statements / Statement of Value Added 20
Notes 21

(A free translation of the original in Portuguese)
6
Company Information / Capital Breakdown
Number of shares (units) Current quarter
09/30/2018Common Shares - Paid-in Capital 705,260,684Preferred Shares - Paid-in Capital 547,818,424Total - Paid-in Capital 1,253,079,108Common Treasury Shares 2,526,656Preferred Treasury Shares 21,250,817Total Treasury Shares 23,777,473
(A free translation of the original in Portuguese)
7
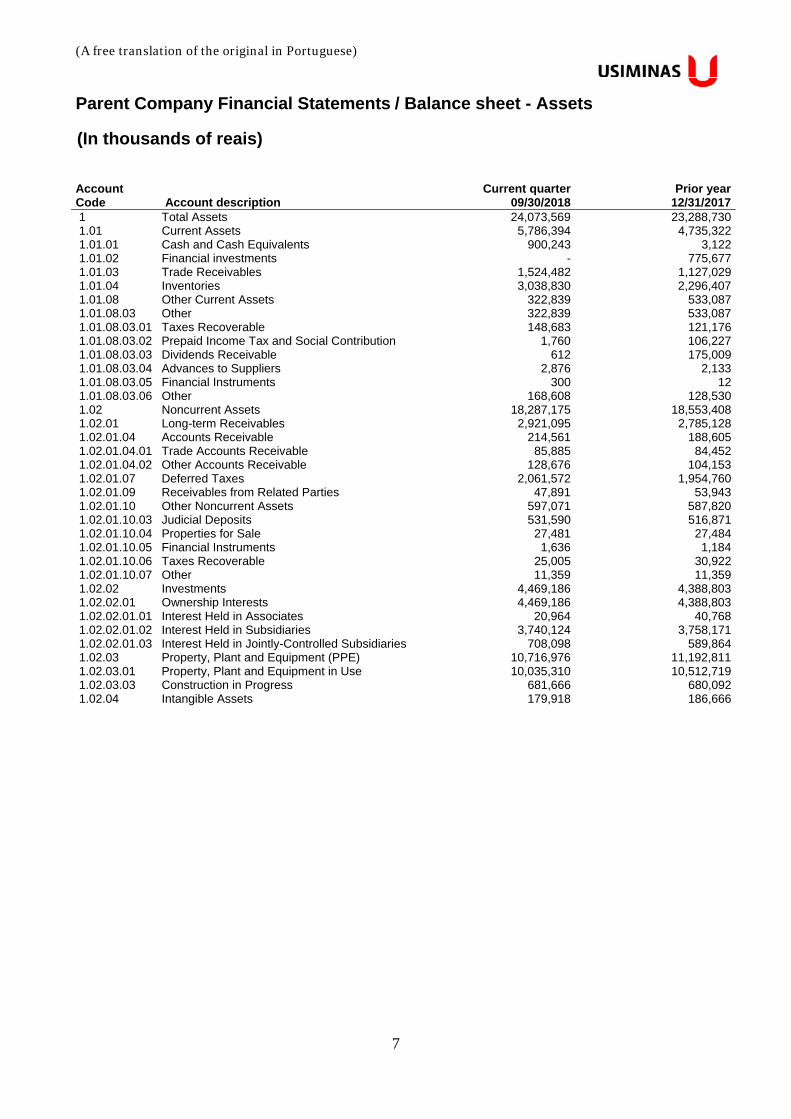
Parent Company Financial Statements / Balance sheet - Assets
(In thousands of reais) Account Code Account description
Current quarter 09/30/2018
Prior year 12/31/2017
1 Total Assets 24,073,569 23,288,730 1.01 Current Assets 5,786,394 4,735,322 1.01.01 Cash and Cash Equivalents 900,243 3,122 1.01.02 Financial investments - 775,677 1.01.03 Trade Receivables 1,524,482 1,127,029 1.01.04 Inventories 3,038,830 2,296,407 1.01.08 Other Current Assets 322,839 533,087 1.01.08.03 Other 322,839 533,087 1.01.08.03.01 Taxes Recoverable 148,683 121,176 1.01.08.03.02 Prepaid Income Tax and Social Contribution 1,760 106,227 1.01.08.03.03 Dividends Receivable 612 175,009 1.01.08.03.04 Advances to Suppliers 2,876 2,133 1.01.08.03.05 Financial Instruments 300 12 1.01.08.03.06 Other 168,608 128,530 1.02 Noncurrent Assets 18,287,175 18,553,408 1.02.01 Long-term Receivables 2,921,095 2,785,128 1.02.01.04 Accounts Receivable 214,561 188,605 1.02.01.04.01 Trade Accounts Receivable 85,885 84,452 1.02.01.04.02 Other Accounts Receivable 128,676 104,153 1.02.01.07 Deferred Taxes 2,061,572 1,954,760 1.02.01.09 Receivables from Related Parties 47,891 53,943 1.02.01.10 Other Noncurrent Assets 597,071 587,820 1.02.01.10.03 Judicial Deposits 531,590 516,871 1.02.01.10.04 Properties for Sale 27,481 27,484 1.02.01.10.05 Financial Instruments 1,636 1,184 1.02.01.10.06 Taxes Recoverable 25,005 30,922 1.02.01.10.07 Other 11,359 11,359 1.02.02 Investments 4,469,186 4,388,803 1.02.02.01 Ownership Interests 4,469,186 4,388,803 1.02.02.01.01 Interest Held in Associates 20,964 40,768 1.02.02.01.02 Interest Held in Subsidiaries 3,740,124 3,758,171 1.02.02.01.03 Interest Held in Jointly-Controlled Subsidiaries 708,098 589,864 1.02.03 Property, Plant and Equipment (PPE) 10,716,976 11,192,811 1.02.03.01 Property, Plant and Equipment in Use 10,035,310 10,512,719 1.02.03.03 Construction in Progress 681,666 680,092 1.02.04 Intangible Assets 179,918 186,666
(A free translation of the original in Portuguese)
8
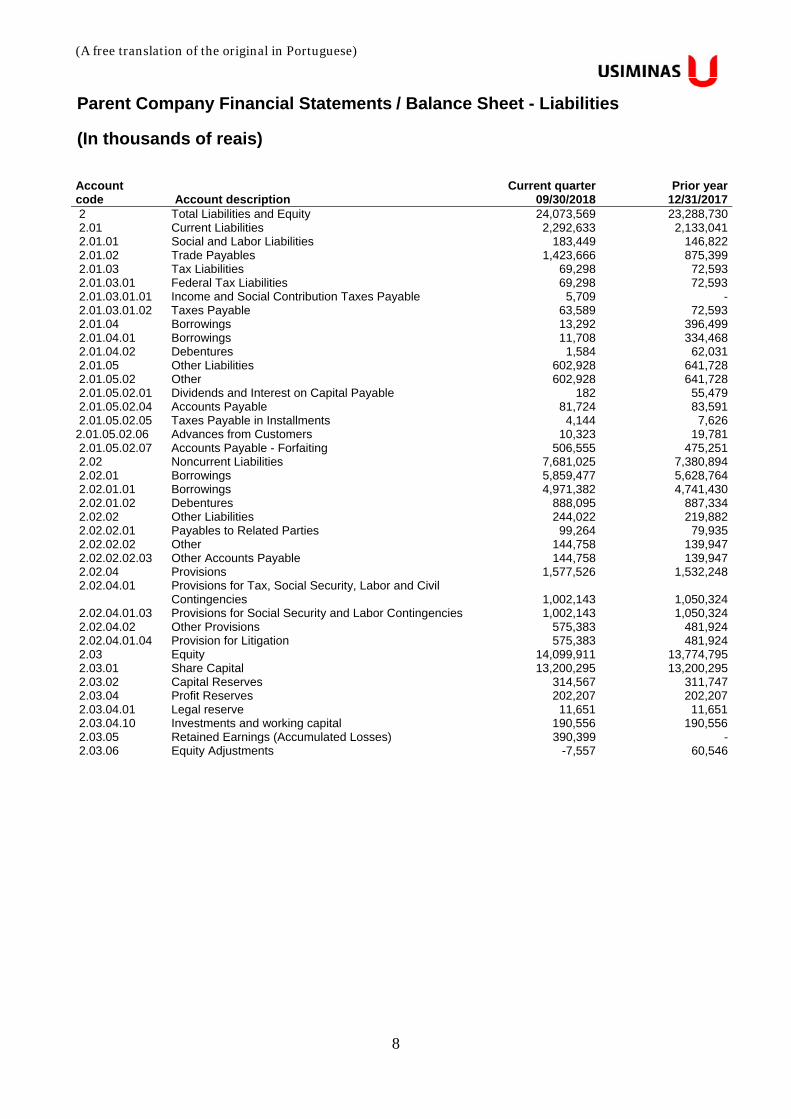
Parent Company Financial Statements / Balance Sheet - Liabilities
(In thousands of reais) Account code Account description
Current quarter 09/30/2018
Prior year 12/31/2017
2 Total Liabilities and Equity 24,073,569 23,288,730 2.01 Current Liabilities 2,292,633 2,133,041 2.01.01 Social and Labor Liabilities 183,449 146,822 2.01.02 Trade Payables 1,423,666 875,399 2.01.03 Tax Liabilities 69,298 72,593 2.01.03.01 Federal Tax Liabilities 69,298 72,593 2.01.03.01.01 Income and Social Contribution Taxes Payable 5,709 - 2.01.03.01.02 Taxes Payable 63,589 72,593 2.01.04 Borrowings 13,292 396,499 2.01.04.01 Borrowings 11,708 334,468 2.01.04.02 Debentures 1,584 62,031 2.01.05 Other Liabilities 602,928 641,728 2.01.05.02 Other 602,928 641,728 2.01.05.02.01 Dividends and Interest on Capital Payable 182 55,479 2.01.05.02.04 Accounts Payable 81,724 83,591 2.01.05.02.05 Taxes Payable in Installments 4,144 7,626 2.01.05.02.06 Advances from Customers 10,323 19,781 2.01.05.02.07 Accounts Payable - Forfaiting 506,555 475,251 2.02 Noncurrent Liabilities 7,681,025 7,380,894 2.02.01 Borrowings 5,859,477 5,628,764 2.02.01.01 Borrowings 4,971,382 4,741,430 2.02.01.02 Debentures 888,095 887,334 2.02.02 Other Liabilities 244,022 219,882 2.02.02.01 Payables to Related Parties 99,264 79,935 2.02.02.02 Other 144,758 139,947 2.02.02.02.03 Other Accounts Payable 144,758 139,947 2.02.04 Provisions 1,577,526 1,532,248 2.02.04.01 Provisions for Tax, Social Security, Labor and Civil
Contingencies 1,002,143 1,050,324 2.02.04.01.03 Provisions for Social Security and Labor Contingencies 1,002,143 1,050,324 2.02.04.02 Other Provisions 575,383 481,924 2.02.04.01.04 Provision for Litigation 575,383 481,924 2.03 Equity 14,099,911 13,774,795 2.03.01 Share Capital 13,200,295 13,200,295 2.03.02 Capital Reserves 314,567 311,747 2.03.04 Profit Reserves 202,207 202,207 2.03.04.01 Legal reserve 11,651 11,651 2.03.04.10 Investments and working capital 190,556 190,556 2.03.05 Retained Earnings (Accumulated Losses) 390,399 - 2.03.06 Equity Adjustments -7,557 60,546

(A free translation of the original in Portuguese)
9
Parent Company Financial Statements / Statement of Operations
(In thousands of reais)
Account code Account description
Current quarter 07/01/2018 to
09/30/2018
Current period 01/01/2018 to
09/30/2018
Prior periodcurrent quarter
07/01/2017 to 09/30/2017
Prior period 01/01/2017 to
09/30/2017 3.01 Revenue 3,440,677 9,367,143 2,544,237 7,216,740 3.02 Cost of Sales and/or Services -2,969,009 -7,920,549 -2,263,789 -6,254,155 3.03 Gross Profit 471,668 1,446,594 280,448 962,585 3.04 Operating Income (Expenses) -73,789 -474,240 -136,865 -276,981 3.04.01 Selling Expenses -36,183 -111,902 -40,830 -119,864 3.04.02 General and Administrative Expenses -73,871 -231,298 -78,807 -217,677 3.04.04 Other Operating Income 148,644 397,305 186,153 489,612 3.04.05 Other Operating Expenses -237,413 -728,112 -205,743 -637,596 3.04.06 Equity in Results of Investees 125,034 199,767 2,362 208,544 3.05 Income Before Financial Income (Expense) and
Taxes 397,879 972,354 143,583 685,604 3.06 Finance result, Net -139,492 -593,852 -35,271 -358,968 3.07 Income Before Income Taxes 258,387 378,502 108,312 326,636 3.08 Income Tax and Social Contribution 5,537 -6,643 -31,353 -43,703 3.08.01 Current -41,375 -85,227 11,476 -6,383 3.08.02 Deferred 46,912 78,584 -42,829 -37,320 3.09 Net Income (loss) from Continuing Operations 263,924 371,859 76,959 282,933 3.11 Net Income/Loss for the Period 263,924 371,859 76,959 282,933 3.99 Earnings (Loss) per Share (Reais / Shares) - - - - 3.99.01 Basic Earnings per Share - - - - 3.99.01.01 Registered Common Shares (RCS) 0.2100 0.2900 0.0600 0.2200 3.99.01.02 Registered Preferred Shares (RPS) 0.2300 0.3200 0.0600 0.2400 3.99.02 Diluted Earnings per Share - - - - 3.99.02.01 RCS 0.2100 0.2900 0.0600 0.2200 3.99.02.02 RPS 0.2300 0.3200 0.0600 0.2400
(A free translation of the original in Portuguese)
10
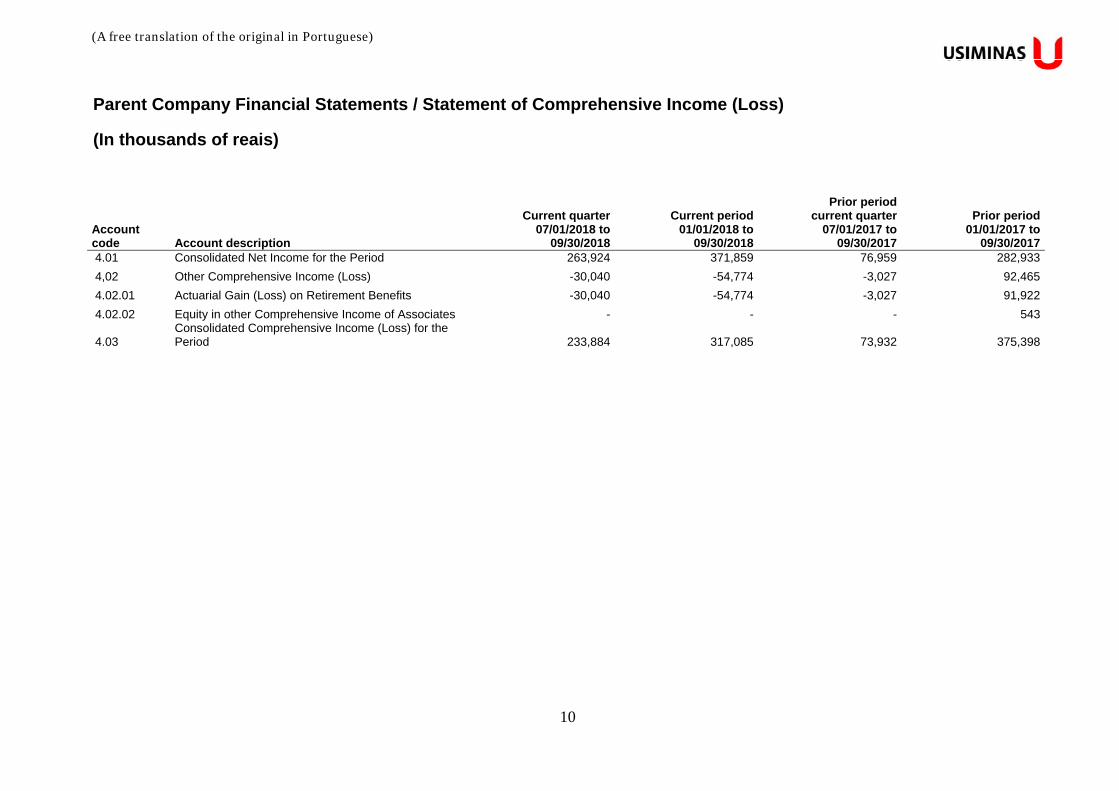
Parent Company Financial Statements / Statement of Comprehensive Income (Loss)
(In thousands of reais)
Account code Account description
Current quarter07/01/2018 to
09/30/2018
Current period01/01/2018 to
09/30/2018
Prior periodcurrent quarter
07/01/2017 to 09/30/2017
Prior period 01/01/2017 to
09/30/2017 4.01 Consolidated Net Income for the Period 263,924 371,859 76,959 282,933
4,02 Other Comprehensive Income (Loss) -30,040 -54,774 -3,027 92,465
4.02.01 Actuarial Gain (Loss) on Retirement Benefits -30,040 -54,774 -3,027 91,922
4.02.02 Equity in other Comprehensive Income of Associates - - - 543
4.03 Consolidated Comprehensive Income (Loss) for the Period 233,884 317,085 73,932 375,398
(A free translation of the original in Portuguese)
11
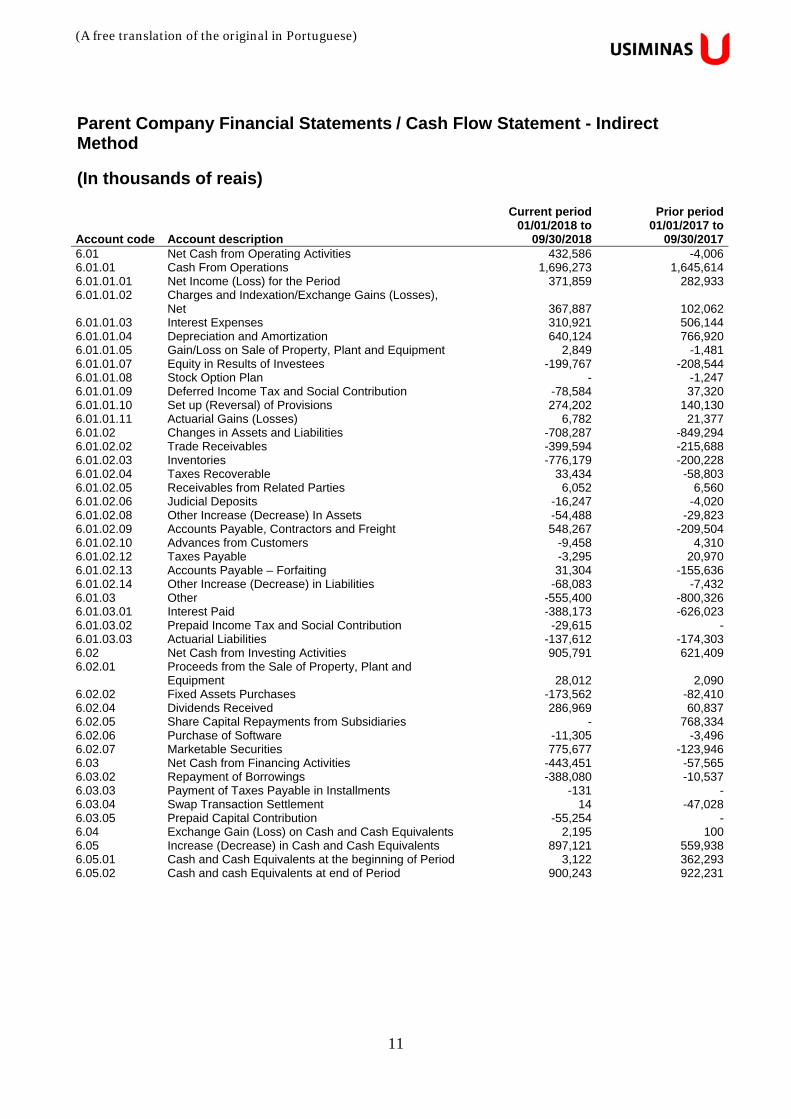
Parent Company Financial Statements / Cash Flow Statement - Indirect Method
(In thousands of reais)
Account code Account description
Current period 01/01/2018 to
09/30/2018
Prior period 01/01/2017 to
09/30/20176.01 Net Cash from Operating Activities 432,586 -4,0066.01.01 Cash From Operations 1,696,273 1,645,6146.01.01.01 Net Income (Loss) for the Period 371,859 282,9336.01.01.02 Charges and Indexation/Exchange Gains (Losses),
Net 367,887 102,0626.01.01.03 Interest Expenses 310,921 506,1446.01.01.04 Depreciation and Amortization 640,124 766,9206.01.01.05 Gain/Loss on Sale of Property, Plant and Equipment 2,849 -1,4816.01.01.07 Equity in Results of Investees -199,767 -208,5446.01.01.08 Stock Option Plan - -1,2476.01.01.09 Deferred Income Tax and Social Contribution -78,584 37,3206.01.01.10 Set up (Reversal) of Provisions 274,202 140,1306.01.01.11 Actuarial Gains (Losses) 6,782 21,3776.01.02 Changes in Assets and Liabilities -708,287 -849,2946.01.02.02 Trade Receivables -399,594 -215,6886.01.02.03 Inventories -776,179 -200,2286.01.02.04 Taxes Recoverable 33,434 -58,8036.01.02.05 Receivables from Related Parties 6,052 6,5606.01.02.06 Judicial Deposits -16,247 -4,0206.01.02.08 Other Increase (Decrease) In Assets -54,488 -29,8236.01.02.09 Accounts Payable, Contractors and Freight 548,267 -209,5046.01.02.10 Advances from Customers -9,458 4,3106.01.02.12 Taxes Payable -3,295 20,9706.01.02.13 Accounts Payable – Forfaiting 31,304 -155,6366.01.02.14 Other Increase (Decrease) in Liabilities -68,083 -7,4326.01.03 Other -555,400 -800,3266.01.03.01 Interest Paid -388,173 -626,0236.01.03.02 Prepaid Income Tax and Social Contribution -29,615 -6.01.03.03 Actuarial Liabilities -137,612 -174,3036.02 Net Cash from Investing Activities 905,791 621,4096.02.01 Proceeds from the Sale of Property, Plant and
Equipment 28,012 2,0906.02.02 Fixed Assets Purchases -173,562 -82,4106.02.04 Dividends Received 286,969 60,8376.02.05 Share Capital Repayments from Subsidiaries - 768,3346.02.06 Purchase of Software -11,305 -3,4966.02.07 Marketable Securities 775,677 -123,9466.03 Net Cash from Financing Activities -443,451 -57,5656.03.02 Repayment of Borrowings -388,080 -10,5376.03.03 Payment of Taxes Payable in Installments -131 -6.03.04 Swap Transaction Settlement 14 -47,0286.03.05 Prepaid Capital Contribution -55,254 -6.04 Exchange Gain (Loss) on Cash and Cash Equivalents 2,195 1006.05 Increase (Decrease) in Cash and Cash Equivalents 897,121 559,9386.05.01 Cash and Cash Equivalents at the beginning of Period 3,122 362,2936.05.02 Cash and cash Equivalents at end of Period 900,243 922,231
(A free translation of the original in Portuguese)
12
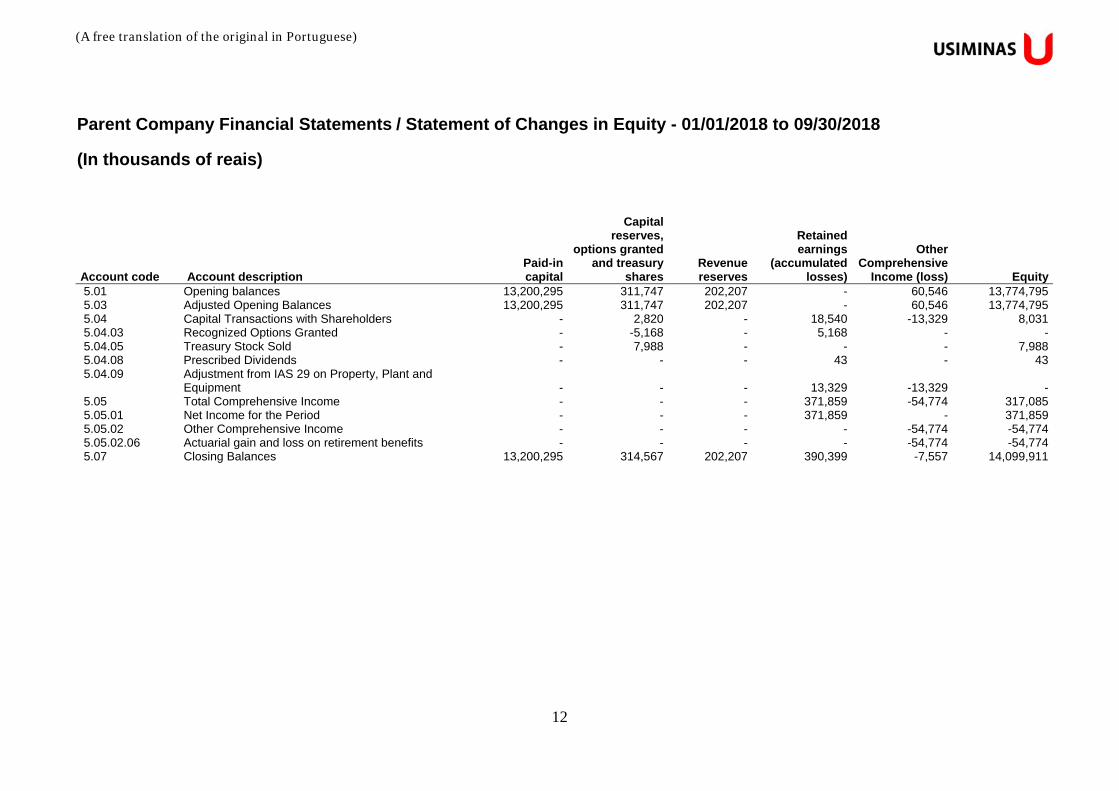
Parent Company Financial Statements / Statement of Changes in Equity - 01/01/2018 to 09/30/2018
(In thousands of reais)
Account code Account description Paid-in capital
Capital reserves,
options granted and treasury
shares Revenue reserves
Retained earnings
(accumulated losses)
Other Comprehensive
Income (loss) Equity 5.01 Opening balances 13,200,295 311,747 202,207 - 60,546 13,774,795 5.03 Adjusted Opening Balances 13,200,295 311,747 202,207 - 60,546 13,774,795 5.04 Capital Transactions with Shareholders - 2,820 - 18,540 -13,329 8,031 5.04.03 Recognized Options Granted - -5,168 - 5,168 - - 5.04.05 Treasury Stock Sold - 7,988 - - - 7,988 5.04.08 Prescribed Dividends - - - 43 - 43 5.04.09 Adjustment from IAS 29 on Property, Plant and
Equipment - - - 13,329 -13,329 - 5.05 Total Comprehensive Income - - - 371,859 -54,774 317,085 5.05.01 Net Income for the Period - - - 371,859 - 371,859 5.05.02 Other Comprehensive Income - - - - -54,774 -54,774 5.05.02.06 Actuarial gain and loss on retirement benefits - - - - -54,774 -54,774 5.07 Closing Balances 13,200,295 314,567 202,207 390,399 -7,557 14,099,911
(A free translation of the original in Portuguese)
13
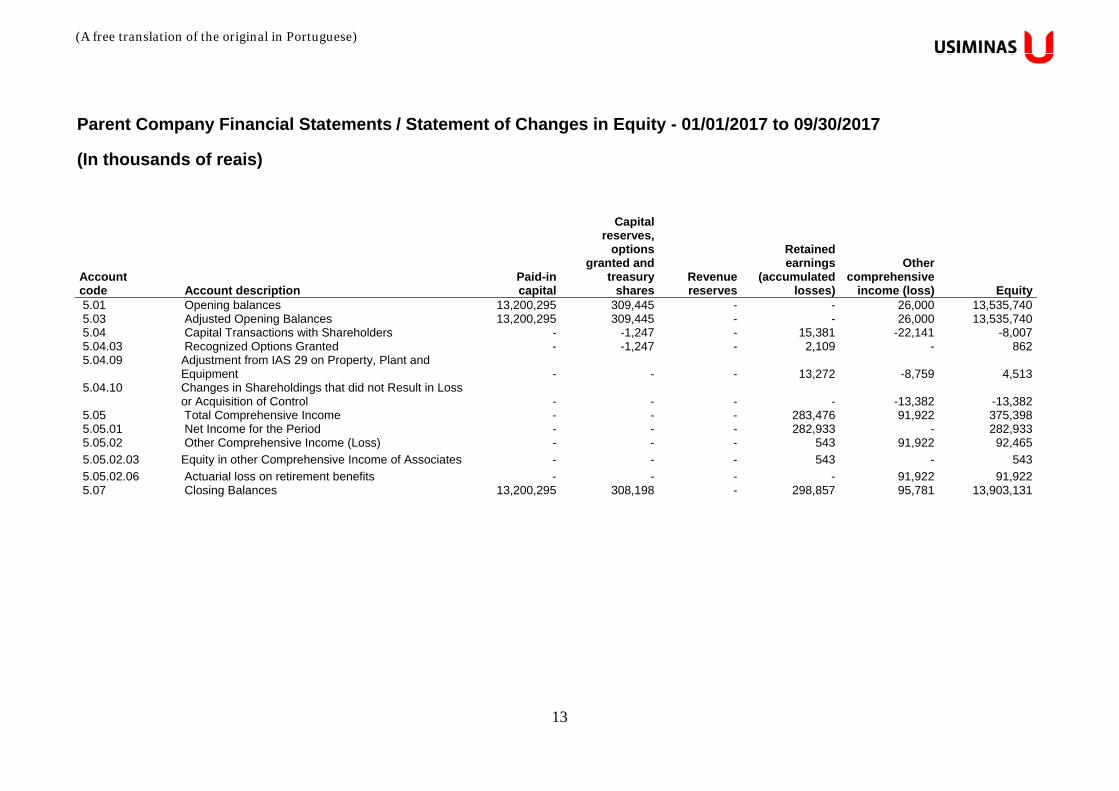
Parent Company Financial Statements / Statement of Changes in Equity - 01/01/2017 to 09/30/2017
(In thousands of reais)
Account code Account description
Paid-in capital
Capital reserves,
options granted and
treasury shares
Revenue reserves
Retained earnings
(accumulated losses)
Other comprehensive
income (loss) Equity 5.01 Opening balances 13,200,295 309,445 - - 26,000 13,535,740 5.03 Adjusted Opening Balances 13,200,295 309,445 - - 26,000 13,535,740 5.04 Capital Transactions with Shareholders - -1,247 - 15,381 -22,141 -8,007 5.04.03 Recognized Options Granted - -1,247 - 2,109 - 862 5.04.09 Adjustment from IAS 29 on Property, Plant and
Equipment - - - 13,272 -8,759 4,513 5.04.10 Changes in Shareholdings that did not Result in Loss
or Acquisition of Control - - - - -13,382 -13,382 5.05 Total Comprehensive Income - - - 283,476 91,922 375,398 5.05.01 Net Income for the Period - - - 282,933 - 282,933 5.05.02 Other Comprehensive Income (Loss) - - - 543 91,922 92,465
5.05.02.03 Equity in other Comprehensive Income of Associates - - - 543 - 543
5.05.02.06 Actuarial loss on retirement benefits - - - - 91,922 91,922 5.07 Closing Balances 13,200,295 308,198 - 298,857 95,781 13,903,131
(A free translation of the original in Portuguese)
14
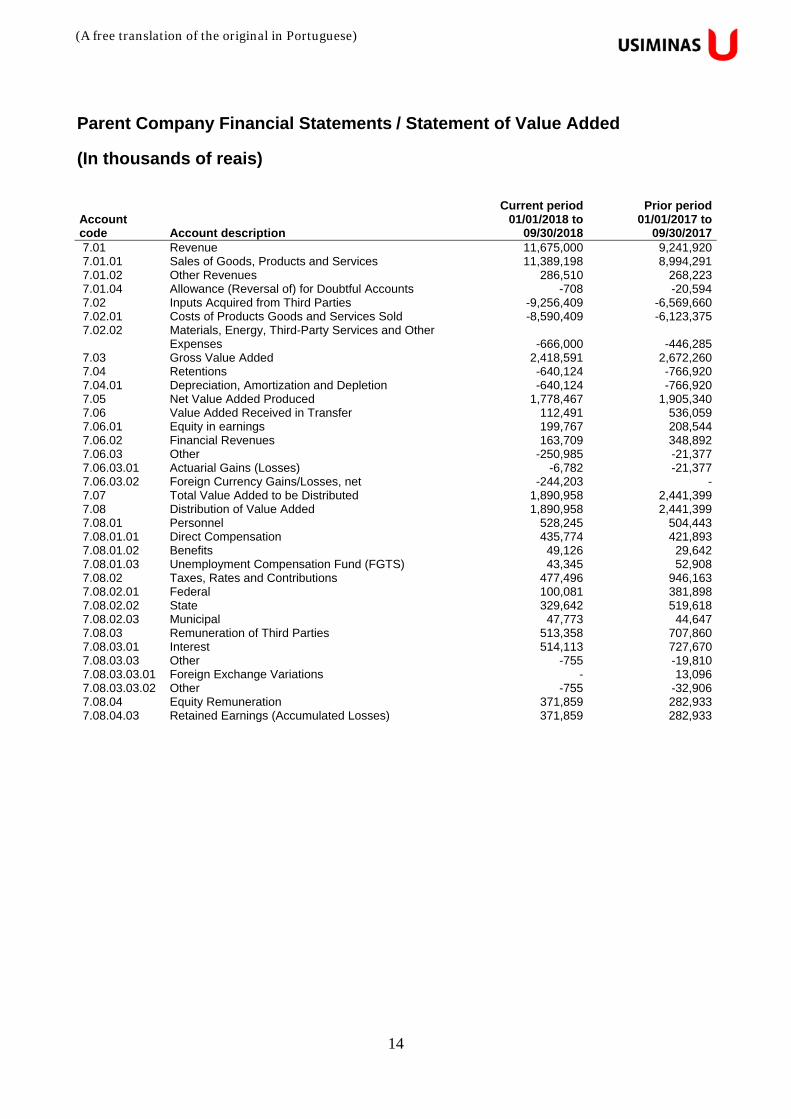
Parent Company Financial Statements / Statement of Value Added
(In thousands of reais)
Account code Account description
Current period 01/01/2018 to
09/30/2018
Prior period 01/01/2017 to
09/30/2017 7.01 Revenue 11,675,000 9,241,920 7.01.01 Sales of Goods, Products and Services 11,389,198 8,994,291 7.01.02 Other Revenues 286,510 268,223 7.01.04 Allowance (Reversal of) for Doubtful Accounts -708 -20,594 7.02 Inputs Acquired from Third Parties -9,256,409 -6,569,660 7.02.01 Costs of Products Goods and Services Sold -8,590,409 -6,123,375 7.02.02 Materials, Energy, Third-Party Services and Other
Expenses -666,000 -446,285 7.03 Gross Value Added 2,418,591 2,672,260 7.04 Retentions -640,124 -766,920 7.04.01 Depreciation, Amortization and Depletion -640,124 -766,920 7.05 Net Value Added Produced 1,778,467 1,905,340 7.06 Value Added Received in Transfer 112,491 536,059 7.06.01 Equity in earnings 199,767 208,544 7.06.02 Financial Revenues 163,709 348,892 7.06.03 Other -250,985 -21,377 7.06.03.01 Actuarial Gains (Losses) -6,782 -21,377 7.06.03.02 Foreign Currency Gains/Losses, net -244,203 - 7.07 Total Value Added to be Distributed 1,890,958 2,441,399 7.08 Distribution of Value Added 1,890,958 2,441,399 7.08.01 Personnel 528,245 504,443 7.08.01.01 Direct Compensation 435,774 421,893 7.08.01.02 Benefits 49,126 29,642 7.08.01.03 Unemployment Compensation Fund (FGTS) 43,345 52,908 7.08.02 Taxes, Rates and Contributions 477,496 946,163 7.08.02.01 Federal 100,081 381,898 7.08.02.02 State 329,642 519,618 7.08.02.03 Municipal 47,773 44,647 7.08.03 Remuneration of Third Parties 513,358 707,860 7.08.03.01 Interest 514,113 727,670 7.08.03.03 Other -755 -19,810 7.08.03.03.01 Foreign Exchange Variations - 13,096 7.08.03.03.02 Other -755 -32,906 7.08.04 Equity Remuneration 371,859 282,933 7.08.04.03 Retained Earnings (Accumulated Losses) 371,859 282,933
(A free translation of the original in Portuguese)
15
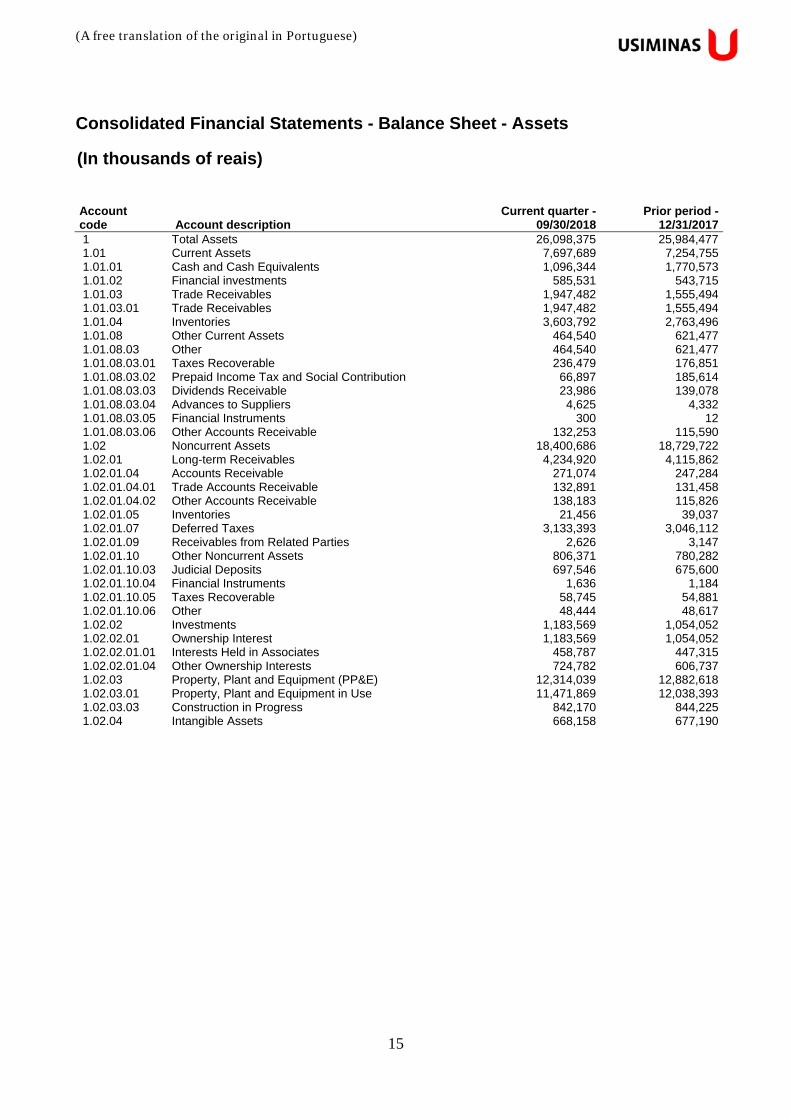
Consolidated Financial Statements - Balance Sheet - Assets
(In thousands of reais) Account code Account description
Current quarter - 09/30/2018
Prior period -12/31/2017
1 Total Assets 26,098,375 25,984,477 1.01 Current Assets 7,697,689 7,254,755 1.01.01 Cash and Cash Equivalents 1,096,344 1,770,573 1.01.02 Financial investments 585,531 543,715 1.01.03 Trade Receivables 1,947,482 1,555,494 1.01.03.01 Trade Receivables 1,947,482 1,555,494 1.01.04 Inventories 3,603,792 2,763,496 1.01.08 Other Current Assets 464,540 621,477 1.01.08.03 Other 464,540 621,477 1.01.08.03.01 Taxes Recoverable 236,479 176,851 1.01.08.03.02 Prepaid Income Tax and Social Contribution 66,897 185,614 1.01.08.03.03 Dividends Receivable 23,986 139,078 1.01.08.03.04 Advances to Suppliers 4,625 4,332 1.01.08.03.05 Financial Instruments 300 12 1.01.08.03.06 Other Accounts Receivable 132,253 115,590 1.02 Noncurrent Assets 18,400,686 18,729,722 1.02.01 Long-term Receivables 4,234,920 4,115,862 1.02.01.04 Accounts Receivable 271,074 247,284 1.02.01.04.01 Trade Accounts Receivable 132,891 131,458 1.02.01.04.02 Other Accounts Receivable 138,183 115,826 1.02.01.05 Inventories 21,456 39,037 1.02.01.07 Deferred Taxes 3,133,393 3,046,112 1.02.01.09 Receivables from Related Parties 2,626 3,147 1.02.01.10 Other Noncurrent Assets 806,371 780,282 1.02.01.10.03 Judicial Deposits 697,546 675,600 1.02.01.10.04 Financial Instruments 1,636 1,184 1.02.01.10.05 Taxes Recoverable 58,745 54,881 1.02.01.10.06 Other 48,444 48,617 1.02.02 Investments 1,183,569 1,054,052 1.02.02.01 Ownership Interest 1,183,569 1,054,052 1.02.02.01.01 Interests Held in Associates 458,787 447,315 1.02.02.01.04 Other Ownership Interests 724,782 606,737 1.02.03 Property, Plant and Equipment (PP&E) 12,314,039 12,882,618 1.02.03.01 Property, Plant and Equipment in Use 11,471,869 12,038,393 1.02.03.03 Construction in Progress 842,170 844,225 1.02.04 Intangible Assets 668,158 677,190
(A free translation of the original in Portuguese)
16
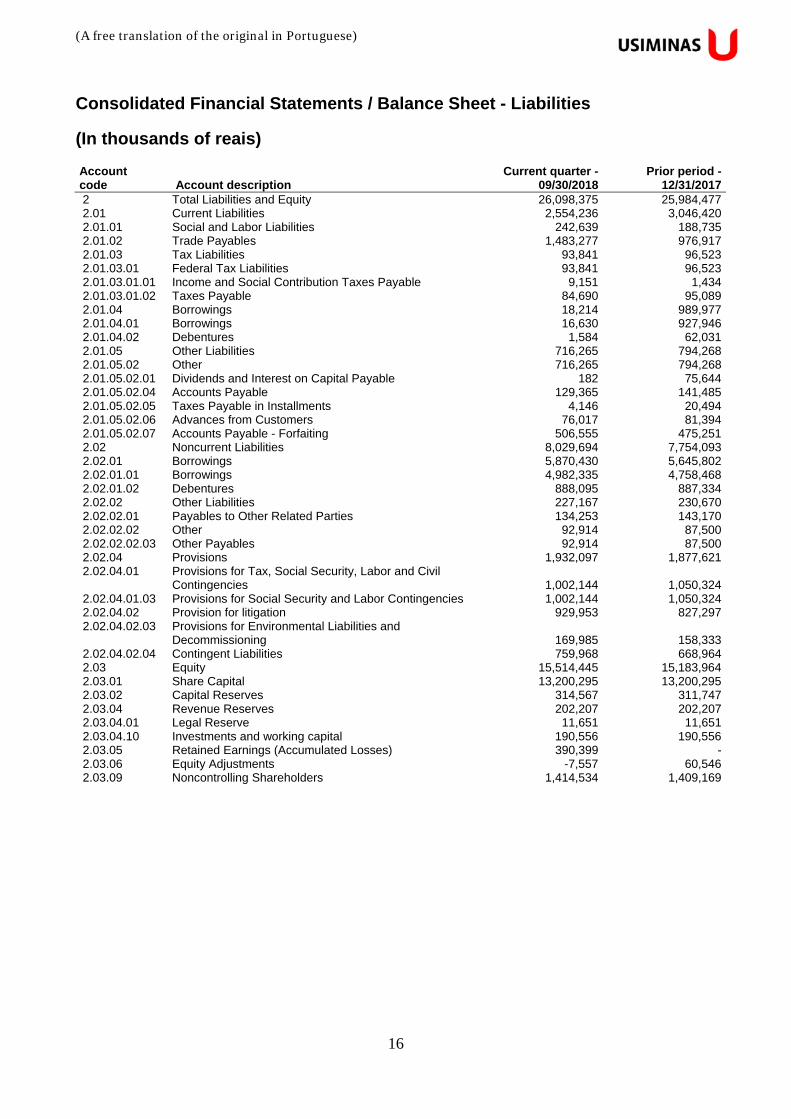
Consolidated Financial Statements / Balance Sheet - Liabilities
(In thousands of reais) Account code Account description
Current quarter - 09/30/2018
Prior period -12/31/2017
2 Total Liabilities and Equity 26,098,375 25,984,477 2.01 Current Liabilities 2,554,236 3,046,420 2.01.01 Social and Labor Liabilities 242,639 188,735 2.01.02 Trade Payables 1,483,277 976,917 2.01.03 Tax Liabilities 93,841 96,523 2.01.03.01 Federal Tax Liabilities 93,841 96,523 2.01.03.01.01 Income and Social Contribution Taxes Payable 9,151 1,434 2.01.03.01.02 Taxes Payable 84,690 95,089 2.01.04 Borrowings 18,214 989,977 2.01.04.01 Borrowings 16,630 927,946 2.01.04.02 Debentures 1,584 62,031 2.01.05 Other Liabilities 716,265 794,268 2.01.05.02 Other 716,265 794,268 2.01.05.02.01 Dividends and Interest on Capital Payable 182 75,644 2.01.05.02.04 Accounts Payable 129,365 141,485 2.01.05.02.05 Taxes Payable in Installments 4,146 20,494 2.01.05.02.06 Advances from Customers 76,017 81,394 2.01.05.02.07 Accounts Payable - Forfaiting 506,555 475,251 2.02 Noncurrent Liabilities 8,029,694 7,754,093 2.02.01 Borrowings 5,870,430 5,645,802 2.02.01.01 Borrowings 4,982,335 4,758,468 2.02.01.02 Debentures 888,095 887,334 2.02.02 Other Liabilities 227,167 230,670 2.02.02.01 Payables to Other Related Parties 134,253 143,170 2.02.02.02 Other 92,914 87,500 2.02.02.02.03 Other Payables 92,914 87,500 2.02.04 Provisions 1,932,097 1,877,621 2.02.04.01 Provisions for Tax, Social Security, Labor and Civil
Contingencies 1,002,144 1,050,324 2.02.04.01.03 Provisions for Social Security and Labor Contingencies 1,002,144 1,050,324 2.02.04.02 Provision for litigation 929,953 827,297 2.02.04.02.03 Provisions for Environmental Liabilities and
Decommissioning 169,985 158,333 2.02.04.02.04 Contingent Liabilities 759,968 668,964 2.03 Equity 15,514,445 15,183,964 2.03.01 Share Capital 13,200,295 13,200,295 2.03.02 Capital Reserves 314,567 311,747 2.03.04 Revenue Reserves 202,207 202,207 2.03.04.01 Legal Reserve 11,651 11,651 2.03.04.10 Investments and working capital 190,556 190,556 2.03.05 Retained Earnings (Accumulated Losses) 390,399 - 2.03.06 Equity Adjustments -7,557 60,546 2.03.09 Noncontrolling Shareholders 1,414,534 1,409,169
(A free translation of the original in Portuguese)
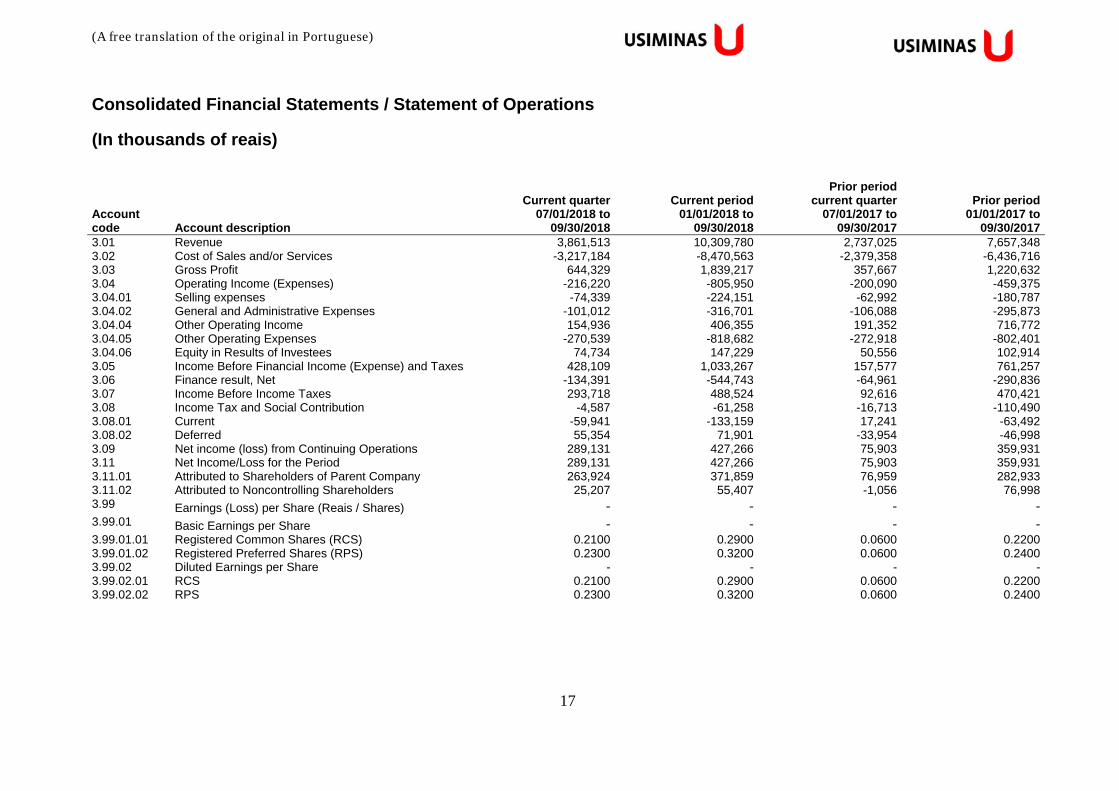
17
Consolidated Financial Statements / Statement of Operations
(In thousands of reais)
Account code Account description
Current quarter07/01/2018 to
09/30/2018
Current period01/01/2018 to
09/30/2018
Prior periodcurrent quarter
07/01/2017 to 09/30/2017
Prior period 01/01/2017 to
09/30/2017 3.01 Revenue 3,861,513 10,309,780 2,737,025 7,657,348 3.02 Cost of Sales and/or Services -3,217,184 -8,470,563 -2,379,358 -6,436,716 3.03 Gross Profit 644,329 1,839,217 357,667 1,220,632 3.04 Operating Income (Expenses) -216,220 -805,950 -200,090 -459,375 3.04.01 Selling expenses -74,339 -224,151 -62,992 -180,787 3.04.02 General and Administrative Expenses -101,012 -316,701 -106,088 -295,873 3.04.04 Other Operating Income 154,936 406,355 191,352 716,772 3.04.05 Other Operating Expenses -270,539 -818,682 -272,918 -802,401 3.04.06 Equity in Results of Investees 74,734 147,229 50,556 102,914 3.05 Income Before Financial Income (Expense) and Taxes 428,109 1,033,267 157,577 761,257 3.06 Finance result, Net -134,391 -544,743 -64,961 -290,836 3.07 Income Before Income Taxes 293,718 488,524 92,616 470,421 3.08 Income Tax and Social Contribution -4,587 -61,258 -16,713 -110,490 3.08.01 Current -59,941 -133,159 17,241 -63,492 3.08.02 Deferred 55,354 71,901 -33,954 -46,998 3.09 Net income (loss) from Continuing Operations 289,131 427,266 75,903 359,931 3.11 Net Income/Loss for the Period 289,131 427,266 75,903 359,931 3.11.01 Attributed to Shareholders of Parent Company 263,924 371,859 76,959 282,933 3.11.02 Attributed to Noncontrolling Shareholders 25,207 55,407 -1,056 76,998 3.99 Earnings (Loss) per Share (Reais / Shares) - - - - 3.99.01 Basic Earnings per Share - - - - 3.99.01.01 Registered Common Shares (RCS) 0.2100 0.2900 0.0600 0.2200 3.99.01.02 Registered Preferred Shares (RPS) 0.2300 0.3200 0.0600 0.2400 3.99.02 Diluted Earnings per Share - - - - 3.99.02.01 RCS 0.2100 0.2900 0.0600 0.2200 3.99.02.02 RPS 0.2300 0.3200 0.0600 0.2400
(A free translation of the original in Portuguese)
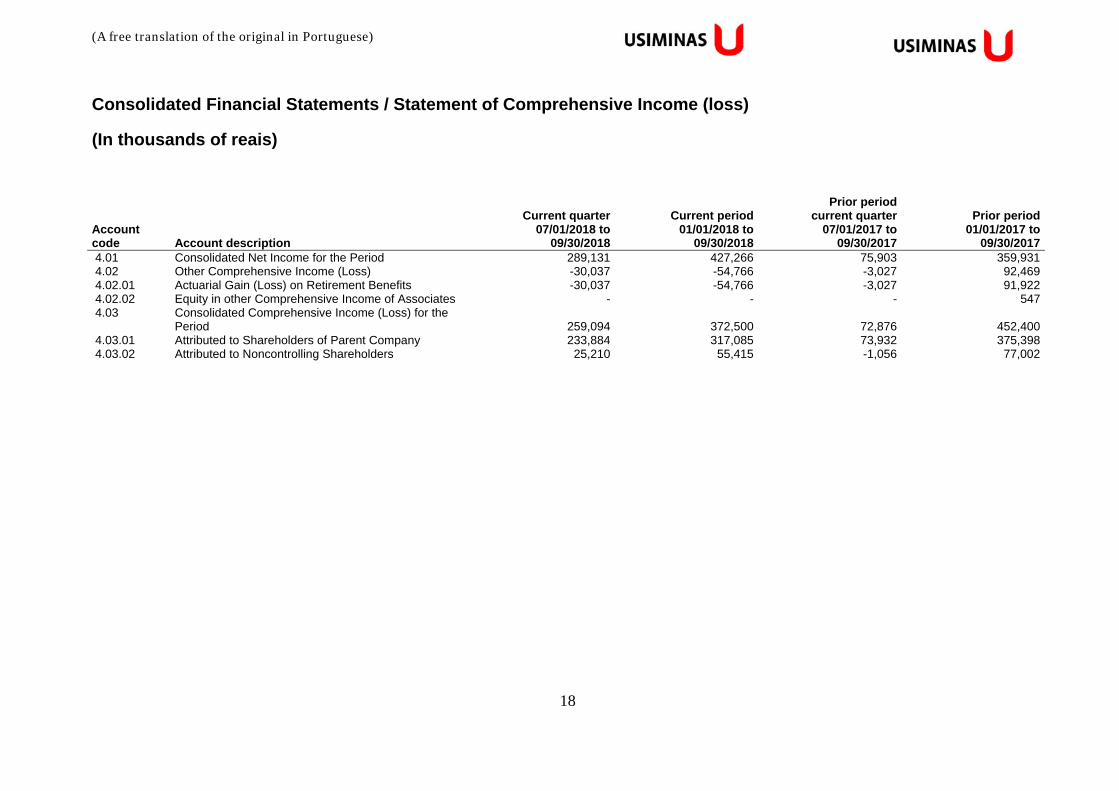
18
Consolidated Financial Statements / Statement of Comprehensive Income (loss)
(In thousands of reais)
Account code Account description
Current quarter07/01/2018 to
09/30/2018
Current period01/01/2018 to
09/30/2018
Prior periodcurrent quarter
07/01/2017 to 09/30/2017
Prior period 01/01/2017 to
09/30/2017 4.01 Consolidated Net Income for the Period 289,131 427,266 75,903 359,931 4.02 Other Comprehensive Income (Loss) -30,037 -54,766 -3,027 92,469 4.02.01 Actuarial Gain (Loss) on Retirement Benefits -30,037 -54,766 -3,027 91,922 4.02.02 Equity in other Comprehensive Income of Associates - - - 547 4.03 Consolidated Comprehensive Income (Loss) for the
Period 259,094 372,500 72,876 452,400 4.03.01 Attributed to Shareholders of Parent Company 233,884 317,085 73,932 375,398 4.03.02 Attributed to Noncontrolling Shareholders 25,210 55,415 -1,056 77,002
(A free translation of the original in Portuguese)
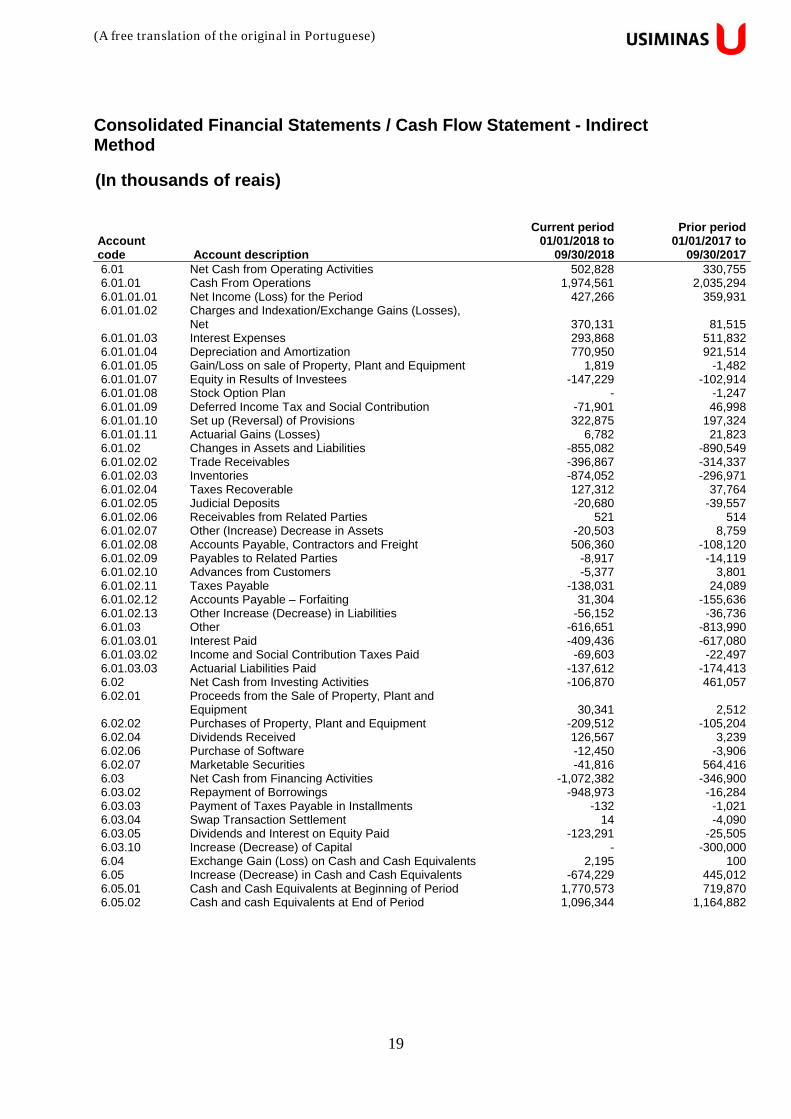
19
Consolidated Financial Statements / Cash Flow Statement - Indirect Method
(In thousands of reais)
Account code Account description
Current period 01/01/2018 to
09/30/2018
Prior period 01/01/2017 to
09/30/2017 6.01 Net Cash from Operating Activities 502,828 330,755 6.01.01 Cash From Operations 1,974,561 2,035,294 6.01.01.01 Net Income (Loss) for the Period 427,266 359,931 6.01.01.02 Charges and Indexation/Exchange Gains (Losses),
Net 370,131 81,515 6.01.01.03 Interest Expenses 293,868 511,832 6.01.01.04 Depreciation and Amortization 770,950 921,514 6.01.01.05 Gain/Loss on sale of Property, Plant and Equipment 1,819 -1,482 6.01.01.07 Equity in Results of Investees -147,229 -102,914 6.01.01.08 Stock Option Plan - -1,247 6.01.01.09 Deferred Income Tax and Social Contribution -71,901 46,998 6.01.01.10 Set up (Reversal) of Provisions 322,875 197,324 6.01.01.11 Actuarial Gains (Losses) 6,782 21,823 6.01.02 Changes in Assets and Liabilities -855,082 -890,549 6.01.02.02 Trade Receivables -396,867 -314,337 6.01.02.03 Inventories -874,052 -296,971 6.01.02.04 Taxes Recoverable 127,312 37,764 6.01.02.05 Judicial Deposits -20,680 -39,557 6.01.02.06 Receivables from Related Parties 521 514 6.01.02.07 Other (Increase) Decrease in Assets -20,503 8,759 6.01.02.08 Accounts Payable, Contractors and Freight 506,360 -108,120 6.01.02.09 Payables to Related Parties -8,917 -14,119 6.01.02.10 Advances from Customers -5,377 3,801 6.01.02.11 Taxes Payable -138,031 24,089 6.01.02.12 Accounts Payable – Forfaiting 31,304 -155,636 6.01.02.13 Other Increase (Decrease) in Liabilities -56,152 -36,736 6.01.03 Other -616,651 -813,990 6.01.03.01 Interest Paid -409,436 -617,080 6.01.03.02 Income and Social Contribution Taxes Paid -69,603 -22,497 6.01.03.03 Actuarial Liabilities Paid -137,612 -174,413 6.02 Net Cash from Investing Activities -106,870 461,057 6.02.01 Proceeds from the Sale of Property, Plant and
Equipment 30,341 2,512 6.02.02 Purchases of Property, Plant and Equipment -209,512 -105,204 6.02.04 Dividends Received 126,567 3,239 6.02.06 Purchase of Software -12,450 -3,906 6.02.07 Marketable Securities -41,816 564,416 6.03 Net Cash from Financing Activities -1,072,382 -346,900 6.03.02 Repayment of Borrowings -948,973 -16,284 6.03.03 Payment of Taxes Payable in Installments -132 -1,021 6.03.04 Swap Transaction Settlement 14 -4,090 6.03.05 Dividends and Interest on Equity Paid -123,291 -25,505 6.03.10 Increase (Decrease) of Capital - -300,000 6.04 Exchange Gain (Loss) on Cash and Cash Equivalents 2,195 100 6.05 Increase (Decrease) in Cash and Cash Equivalents -674,229 445,012 6.05.01 Cash and Cash Equivalents at Beginning of Period 1,770,573 719,870 6.05.02 Cash and cash Equivalents at End of Period 1,096,344 1,164,882
(A free translation of the original in Portuguese)
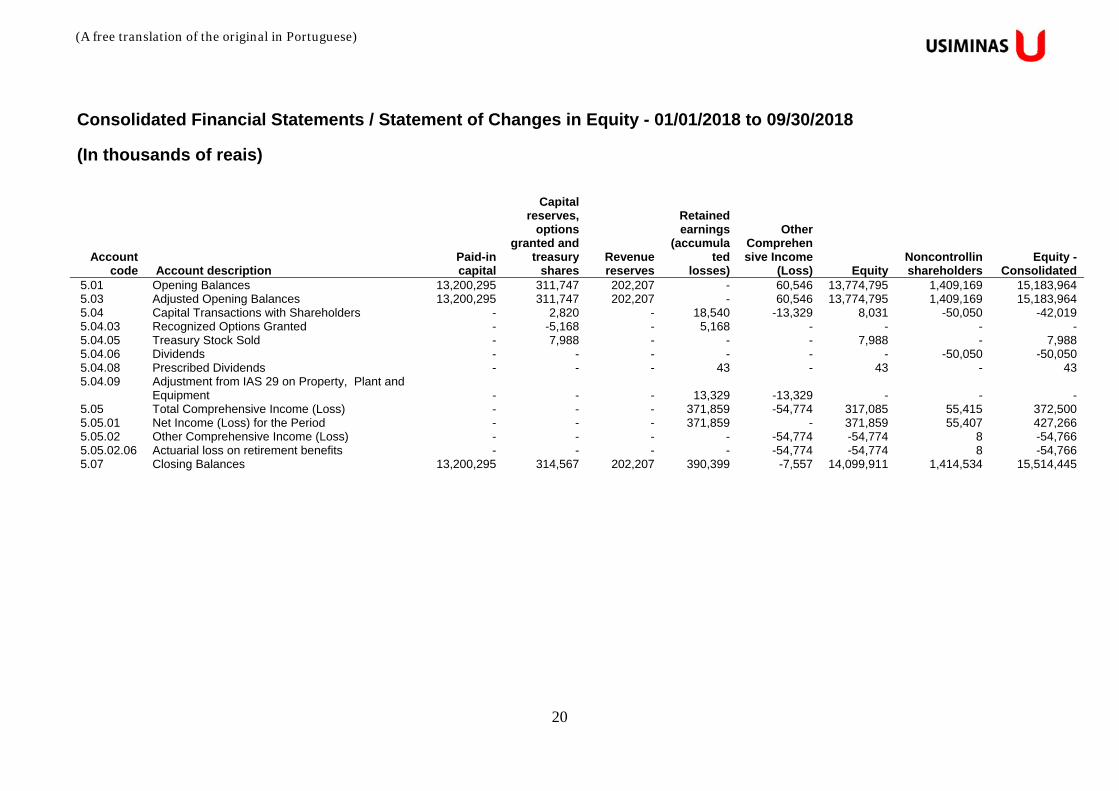
20
Consolidated Financial Statements / Statement of Changes in Equity - 01/01/2018 to 09/30/2018
(In thousands of reais)
Account code Account description
Paid-in capital
Capital reserves,
options granted and
treasury shares
Revenue reserves
Retained earnings
(accumulated
losses)
Other Comprehensive Income
(Loss) Equity Noncontrollin shareholders
Equity - Consolidated
5.01 Opening Balances 13,200,295 311,747 202,207 - 60,546 13,774,795 1,409,169 15,183,964 5.03 Adjusted Opening Balances 13,200,295 311,747 202,207 - 60,546 13,774,795 1,409,169 15,183,964 5.04 Capital Transactions with Shareholders - 2,820 - 18,540 -13,329 8,031 -50,050 -42,019 5.04.03 Recognized Options Granted - -5,168 - 5,168 - - - - 5.04.05 Treasury Stock Sold - 7,988 - - - 7,988 - 7,988 5.04.06 Dividends - - - - - - -50,050 -50,050 5.04.08 Prescribed Dividends - - - 43 - 43 - 43 5.04.09 Adjustment from IAS 29 on Property, Plant and
Equipment - - - 13,329 -13,329 - - - 5.05 Total Comprehensive Income (Loss) - - - 371,859 -54,774 317,085 55,415 372,500 5.05.01 Net Income (Loss) for the Period - - - 371,859 - 371,859 55,407 427,266 5.05.02 Other Comprehensive Income (Loss) - - - - -54,774 -54,774 8 -54,766 5.05.02.06 Actuarial loss on retirement benefits - - - - -54,774 -54,774 8 -54,766 5.07 Closing Balances 13,200,295 314,567 202,207 390,399 -7,557 14,099,911 1,414,534 15,514,445
(A free translation of the original in Portuguese)
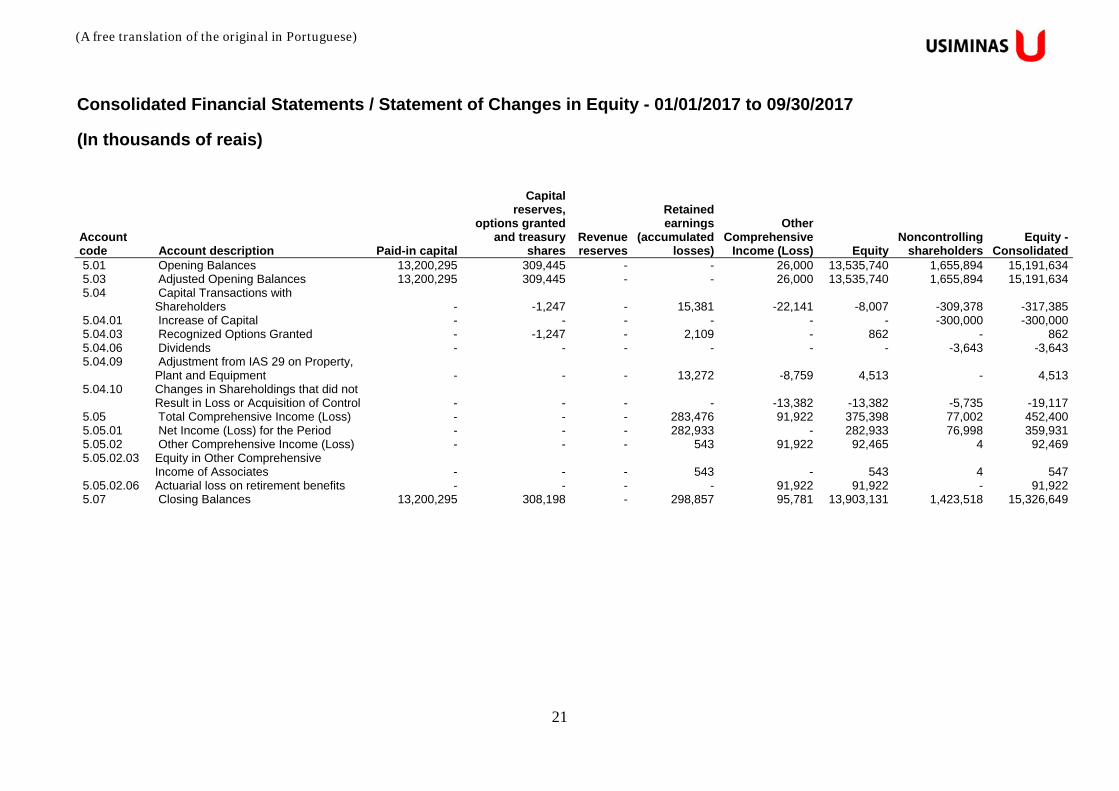
21
Consolidated Financial Statements / Statement of Changes in Equity - 01/01/2017 to 09/30/2017
(In thousands of reais)
Account code Account description Paid-in capital
Capital reserves,
options granted and treasury
shares Revenue reserves
Retained earnings
(accumulated losses)
Other Comprehensive
Income (Loss) Equity
Noncontrolling
shareholders Equity -
Consolidated 5.01 Opening Balances 13,200,295 309,445 - - 26,000 13,535,740 1,655,894 15,191,634 5.03 Adjusted Opening Balances 13,200,295 309,445 - - 26,000 13,535,740 1,655,894 15,191,634 5.04 Capital Transactions with
Shareholders - -1,247 - 15,381 -22,141 -8,007 -309,378 -317,385 5.04.01 Increase of Capital - - - - - - -300,000 -300,000 5.04.03 Recognized Options Granted - -1,247 - 2,109 - 862 - 862 5.04.06 Dividends - - - - - - -3,643 -3,643 5.04.09 Adjustment from IAS 29 on Property,
Plant and Equipment - - - 13,272 -8,759 4,513 - 4,513 5.04.10 Changes in Shareholdings that did not
Result in Loss or Acquisition of Control - - - - -13,382 -13,382 -5,735 -19,117 5.05 Total Comprehensive Income (Loss) - - - 283,476 91,922 375,398 77,002 452,400 5.05.01 Net Income (Loss) for the Period - - - 282,933 - 282,933 76,998 359,931 5.05.02 Other Comprehensive Income (Loss) - - - 543 91,922 92,465 4 92,469 5.05.02.03 Equity in Other Comprehensive
Income of Associates - - - 543 - 543 4 547 5.05.02.06 Actuarial loss on retirement benefits - - - - 91,922 91,922 - 91,922 5.07 Closing Balances 13,200,295 308,198 - 298,857 95,781 13,903,131 1,423,518 15,326,649
(A free translation of the original in Portuguese)
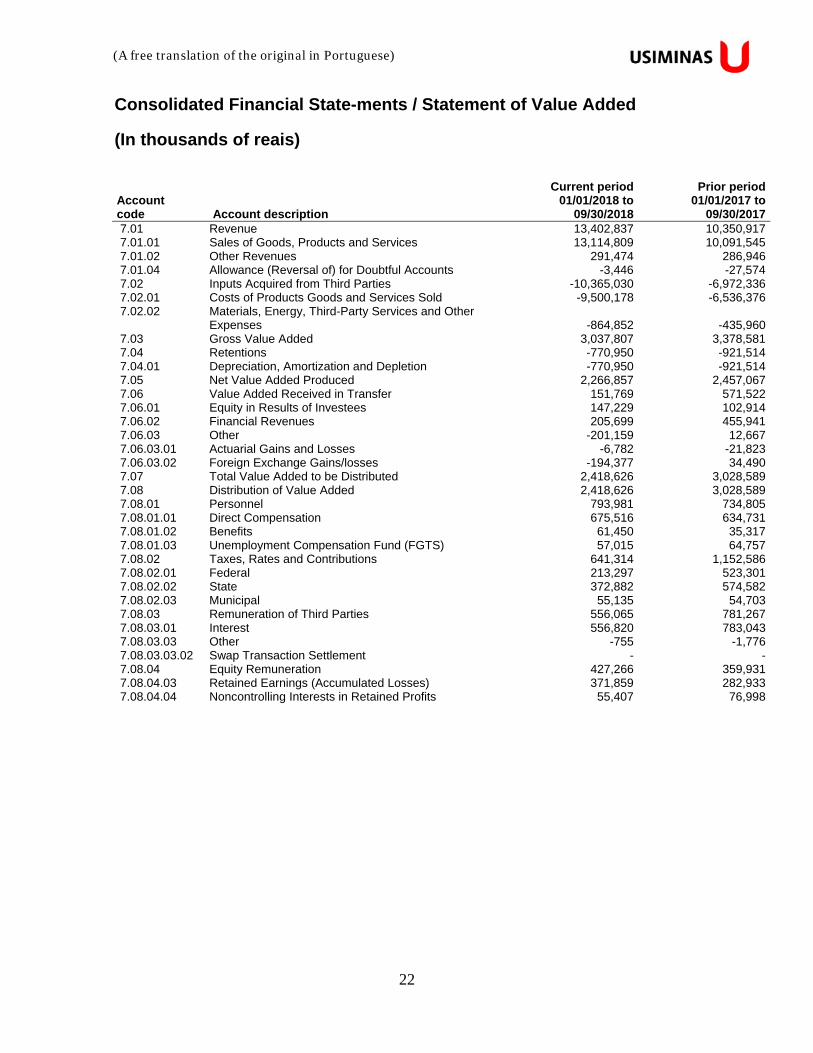
22
Consolidated Financial State-ments / Statement of Value Added
(In thousands of reais)
Account code Account description
Current period 01/01/2018 to
09/30/2018
Prior period 01/01/2017 to
09/30/2017 7.01 Revenue 13,402,837 10,350,917 7.01.01 Sales of Goods, Products and Services 13,114,809 10,091,545 7.01.02 Other Revenues 291,474 286,946 7.01.04 Allowance (Reversal of) for Doubtful Accounts -3,446 -27,574 7.02 Inputs Acquired from Third Parties -10,365,030 -6,972,336 7.02.01 Costs of Products Goods and Services Sold -9,500,178 -6,536,376 7.02.02 Materials, Energy, Third-Party Services and Other
Expenses -864,852 -435,960 7.03 Gross Value Added 3,037,807 3,378,581 7.04 Retentions -770,950 -921,514 7.04.01 Depreciation, Amortization and Depletion -770,950 -921,514 7.05 Net Value Added Produced 2,266,857 2,457,067 7.06 Value Added Received in Transfer 151,769 571,522 7.06.01 Equity in Results of Investees 147,229 102,914 7.06.02 Financial Revenues 205,699 455,941 7.06.03 Other -201,159 12,667 7.06.03.01 Actuarial Gains and Losses -6,782 -21,823 7.06.03.02 Foreign Exchange Gains/losses -194,377 34,490 7.07 Total Value Added to be Distributed 2,418,626 3,028,589 7.08 Distribution of Value Added 2,418,626 3,028,589 7.08.01 Personnel 793,981 734,805 7.08.01.01 Direct Compensation 675,516 634,731 7.08.01.02 Benefits 61,450 35,317 7.08.01.03 Unemployment Compensation Fund (FGTS) 57,015 64,757 7.08.02 Taxes, Rates and Contributions 641,314 1,152,586 7.08.02.01 Federal 213,297 523,301 7.08.02.02 State 372,882 574,582 7.08.02.03 Municipal 55,135 54,703 7.08.03 Remuneration of Third Parties 556,065 781,267 7.08.03.01 Interest 556,820 783,043 7.08.03.03 Other -755 -1,776 7.08.03.03.02 Swap Transaction Settlement - - 7.08.04 Equity Remuneration 427,266 359,931 7.08.04.03 Retained Earnings (Accumulated Losses) 371,859 282,933 7.08.04.04 Noncontrolling Interests in Retained Profits 55,407 76,998
(A free translation of the original in Portuguese)
23
Notes
1 Operations
Usinas Siderúrgicas de Minas Gerais S.A. - USIMINAS (“USIMINAS”, “Usiminas”, “Parent company” or “Company”), headquartered in the city of Belo Horizonte, state of Minas Gerais, is a publicly-held company and its shares are traded on the Brazilian stock exchange (B3 - Brasil, Bolsa, Balcão) under tickers USIM3, USIM5 and USIM6. The Company and its subsidiaries, jointly-controlled subsidiaries and associates (“Usiminas”) operate in the steel industry and related activities, such as iron ore extraction, steel transformation, production of capital goods and logistics. It currently has two steel mills with nominal production capacity of 9.5 million metric tons (not reviewed) per annum of flat-rolled products, located in the cities of Ipatinga, state of Minas Gerais, and Cubatão, state of São Paulo, in addition to iron ore reserves, service and distribution centers, maritime ports, cargo terminals, strategically located in several Brazilian cities. The Company holds, directly or indirectly, interest in subsidiaries, jointly-controlled subsidiaries and associates, as described in Note 1 to the financial statements for the year ended December 31, 2017.
2 Interim accounting information
The issue and disclosure of the interim accounting information included in this Quarterly Information Form (ITR) on the Parent company and Consolidated accounts were approved by the Board of Directors at a meeting held on October 25, 2018.
3 Summary of significant accounting policies The main accounting policies applied in the preparation of this interim accounting information are presented in the financial statements of the Company for the year ended December 31, 2017. The accounting policies applied in transactions considered immaterial were not included in this interim accounting information. The accounting policies, which have been consistently applied in the current period, are consistent with those of the year and period presented for comparison purposes, and are common to the parent company, subsidiaries, associates and jointly-controlled subsidiaries, and the interim accounting information on the subsidiaries was adjusted, as applicable, to meet this criterion.
(A free translation of the original in Portuguese)
24
3.1 Basis of preparation and statement of compliance
This interim accounting information for the nine-month period ended September 30, 2018, should be read together with the Company’s financial statements for the year ended December 31, 2017. Considering that there were no material changes in the composition and nature of the balances presented in the financial statements for the year ended December 31, 2017, the following Notes are presented in a condensed manner for the nine-month period ended September 30, 2018. 3 Summary of significant accounting policies; 4 Financial risk management objectives and policy; 12 Income tax and social contribution; 13 Judicial deposits; 14 Investments; 15 Property, plant and equipment; 16 Impairment of non-financial assets; 17 Intangible assets; 18 Borrowings and debentures; 20 Taxes payable in installments; 21 Provision for litigation; 22 Retirement benefit obligations; 23 Equity; 29 Transactions with related parties; and 31 Stock option plan. Parent company and consolidated interim accounting information The parent company and consolidated interim accounting information presented herein under Parent company and Consolidated, respectively, has been prepared in accordance with Technical Pronouncement CPC 21 (R1) - Interim Financial Reporting, International Accounting Standard (IAS) 34 - Interim Financial Reporting, and the rules of the Brazilian Securities Commission (CVM). Accordingly, this interim accounting information discloses all the applicable significant information, which is consistent with the information utilized by management in the performance of its duties.
3.2 Standards, amendments to and interpretations of existing standards In the nine-month period ended September 30, 2018, no new standards, amendments to or interpretations of existing standards were issued. IFRS 9 / CPC 48 - “Financial Instruments” and IFRS 15 / CPC 47 – “Revenue from Contracts with Customers” have been effective since January 1, 2018. As described in Note 3.20 to the financial statements at December 31, 2017, the Company did not identify material impacts from the adoption of these new standards in the nine-month period ended September 30, 2018.
(A free translation of the original in Portuguese)
25
With respect to IFRS 9 / CPC 48 - “Financial Instruments” in the nine-month period ended September 30, 2018, the disclosure of the financial instruments (Note 6) was adjusted as follows:
(a) Financial assets and liabilities IFRS 9 / CPC 48 - “Financial Instruments” establishes three primary classification categories for financial assets: amortized cost, fair value through other comprehensive income (“FVOCI”) and fair value through profit or loss (“FVTPL”). With the effectiveness of this standard, the classification started to be based on the business model by which a financial asset is managed by its contractual cash flows. The new standard maintained part of the requirements of the previous standard for the classification of financial liabilities. The substantial changes in the fair value classification are presented below: • the amount corresponding to the change in the fair value attributable to changes in the
credit risk of the liability is presented in other comprehensive income; and • the remaining amount of the change in the fair value is presented in profit or loss. The classification of financial instruments in accordance with the new standard is presented in Note 6 - “Financial instruments by category”.
(i) Initial recognition and measurement A financial asset or financial liability is measured initially at fair value plus, provided that it is not an item measured at fair value through profit or loss, transaction costs that are directly attributable to their acquisition or issue.
(ii) Classification of financial assets Upon initial recognition, a financial asset is classified as measured at amortized cost, FVOCI or FVTPL. A financial asset is measured at amortized cost if both of the following conditions are met: • the asset is held within a business model whose objective is to collect contractual cash
flows; and • the contractual terms of the financial asset give rise, on specified dates, to cash flows
that are solely payments of principal and interest on the principal amount outstanding. A debt instrument is measured at FVOCI if both of the following conditions are met: • the asset is held within a business model whose objective is achieved through both
the collection of contractual cash flows and the sale of financial assets; and

(A free translation of the original in Portuguese)
26
• the contractual terms of the financial asset give rise, on specified dates, to cash flows that represent payments of principal and interest on the principal amount outstanding.
All the other financial assets are classified as measured at fair value through profit or loss. In addition, at initial recognition, the Company may irrevocably designate a financial asset that meets the requirements to be measured at amortized cost, as FVOCI or even FVTPL. This designation has the purpose of eliminating or significantly reducing a possible accounting mismatch arising from the gains or losses produced by the respective asset measured on different bases.
(iii) Transition The changes in accounting policies resulting from the adoption of IFRS 9 / CPC 48 have been applied since January 1, 2018 and have not had effects on the measurement of the Company's financial assets and liabilities.

(A free translation of the original in Portuguese)
27
4 Financial risk management objectives and policy
At September 30, 2018, there were no significant changes in financial risk policies and management in relation to those disclosed in the Company's financial statements for the year ended December 31, 2017.
4.1 Foreign exchange risk
(i) Foreign exchange exposure
Usiminas operates internationally and is exposed to foreign exchange risk arising from exposures in certain currencies, primarily with respect to the U.S. dollar and, to a lesser extent, yen and euro. Foreign exchange risk arises from recognized assets and liabilities and net investments in foreign operations. Parent
company Consolidated 9/30/2018 12/31/2017 9/30/2018 12/31/2017
Assets in foreign currency
Cash and cash equivalents 44,529 939 147,894 1,478,473
Marketable securities - 775,665 9,140 8,428
Trade receivables 167,487 182,137 270,489 297,966
Advances to suppliers 3,843 4,042 4,796 5,404
215,859 962,783 432,319 1,790,271
Liabilities in foreign currency
Borrowings (1,314,311) (1,157,250) (1,314,311) (1,747,954) Trade payables, contractors and freight charges (301,923) (201,202) (314,289) (219,628)
Advances from customers (8,604) (12,385) (12,906) (13,699)
Other payables (23,889) (18,163) (23,885) (18,159)
(1,648,727) (1,389,000) (1,665,391) (1,999,440)
Total currency exposure (1,432,868) (426,217) (1,233,072) (209,169)
(A free translation of the original in Portuguese)
28
(ii) Sensitivity analysis - foreign exchange risk arising from assets and liabilities
denominated in foreign currency
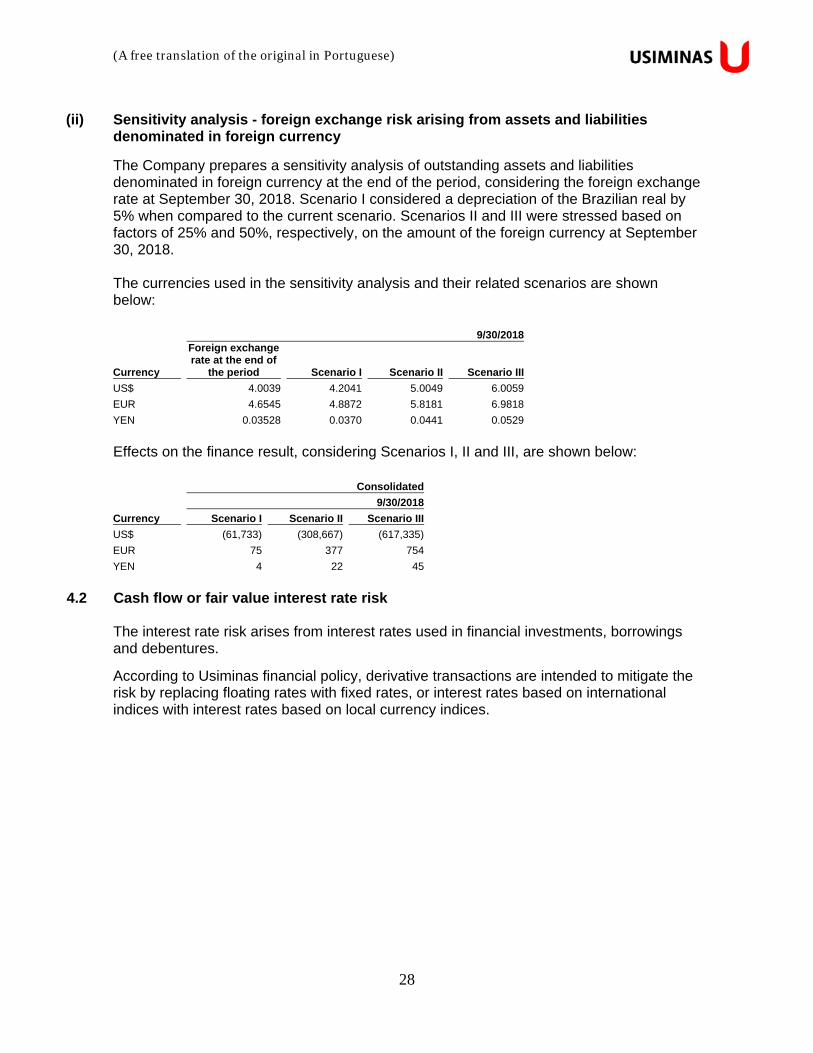
The Company prepares a sensitivity analysis of outstanding assets and liabilities denominated in foreign currency at the end of the period, considering the foreign exchange rate at September 30, 2018. Scenario I considered a depreciation of the Brazilian real by 5% when compared to the current scenario. Scenarios II and III were stressed based on factors of 25% and 50%, respectively, on the amount of the foreign currency at September 30, 2018. The currencies used in the sensitivity analysis and their related scenarios are shown below:
9/30/2018
Currency
Foreign exchange rate at the end of
the period Scenario I Scenario II Scenario III
US$ 4.0039 4.2041 5.0049 6.0059
EUR 4.6545 4.8872 5.8181 6.9818
YEN 0.03528 0.0370 0.0441 0.0529
Effects on the finance result, considering Scenarios I, II and III, are shown below: Consolidated 9/30/2018
Currency Scenario I Scenario II Scenario III
US$ (61,733) (308,667) (617,335)
EUR 75 377 754
YEN 4 22 45
4.2 Cash flow or fair value interest rate risk
The interest rate risk arises from interest rates used in financial investments, borrowings and debentures.
According to Usiminas financial policy, derivative transactions are intended to mitigate the risk by replacing floating rates with fixed rates, or interest rates based on international indices with interest rates based on local currency indices.

(A free translation of the original in Portuguese)
29
(i) Composition of borrowings and debentures by type of interest rate
The composition of borrowings and debentures contracted, by type of interest rate, in current and non-current liabilities, is presented as follows:
Parent company Consolidated
9/30/2018 % 12/31/2017 % 9/30/2018 % 12/31/2017 % Borrowings
Fixed 21,488 1 25,735 1 37,363 1 636,251 9
TJLP 336,758 6 359,896 6 336,758 6 359,896 5
LIBOR 1,170,370 20 1,032,430 17 1,170,370 20 1,032,430 16
CDI 3,324,037 56 3,549,410 58 3,324,037 56 3,549,410 54
Other 130,437 2 108,427 2 130,437 2 108,427 2
4,983,090 85 5,075,898 84 4,998,965 85 5,686,414 86
Debentures
CDI 889,679 15 949,365 16 889,679 15 949,365 14 5,872,769 100 6,025,263 100 5,888,644 100 6,635,779 100
The Company has derivative financial instruments for the management of risks related to fluctuations in interest rates on borrowings.
(ii) Sensitivity analysis of changes in interest rates
The Company prepares a sensitivity analysis of outstanding assets and liabilities indexed to interest rates at the end of the period, considering the rates prevailing at September 30, 2018 for the probable scenario. Scenario I considers a 5% increase on the average interest rate applicable to the floating portion of its current debt. Scenarios II and III were stressed based on factors of 25% and 50%, respectively, on the amounts of these rates at September 30, 2018.
The rates used and their related scenarios are shown below:
9/30/2018
Index
Rates at theend of theperiod (i) Scenario I Scenario II Scenario III
CDI 6.4% 6.7% 8.0% 9.6%
TJLP 6.6% 6.9% 8.2% 9.8%
LIBOR 2.9% 3.1% 3.6% 4.4% (i) Annual rates.

(A free translation of the original in Portuguese)
30
Effects on the finance result, considering Scenarios I, II and III, are shown below: Consolidated 9/30/2018
Index Scenario I Scenario II Scenario III
CDI (8,708) (43,540) (87,081)
TJLP (1,105) (5,523) (11,046)
LIBOR (1,708) (8,540) (17,079)
The interest rates to which the Company is exposed, which are related to borrowings and debentures, are presented in Note 20 to the financial statements for the year ended December 31, 2017, and mainly comprise London Interbank Offered Rate (LIBOR), Long-Term Interest Rate (TJLP) and Interbank Deposit Certificate (CDI). Derivative financial instruments related to interest rates, contracted to minimize the impact of fluctuations in interest rates on the Company’s profit or loss, were included in the sensitivity analysis of assets and liabilities. These instruments are described in Note 5.
4.3 Capital management
The objectives for managing capital are to safeguard the ability to continue as going concern in order to provide returns for stockholders and benefits for other stakeholders and to maintain an optimal capital structure at optimum costs. Consistent with others in the industry, Usiminas monitors capital on the basis of the gearing ratio. This ratio corresponds to the net debt divided by total capital. Net debt is calculated as total borrowings and debentures, and taxes payable in installments (including current and non-current transactions, as shown in the consolidated balance sheet) less cash and cash equivalents and marketable securities. Total capital is calculated as equity as shown in the consolidated balance sheet plus net debt. We present below the calculation of the gearing ratio considering net debt as a percentage of total capital.
(A free translation of the original in Portuguese)
31
Parent
company Consolidated
9/30/2018 12/31/2017 9/30/2018 12/31/2017
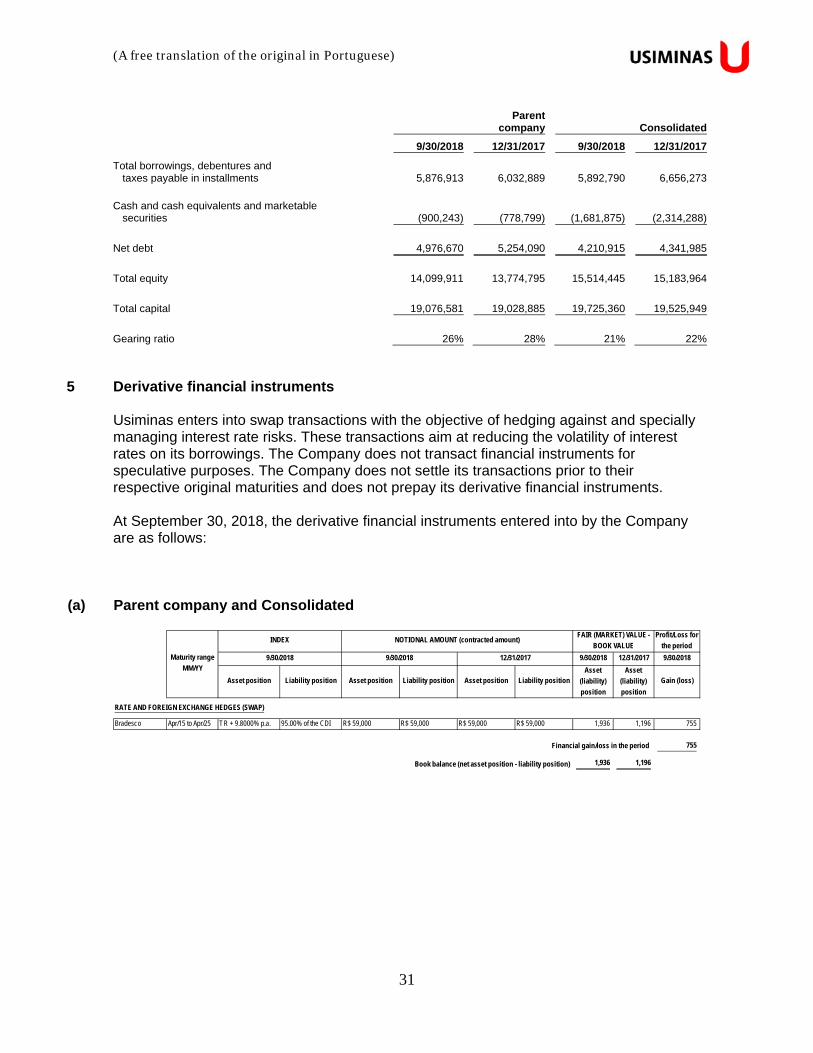
Total borrowings, debentures and taxes payable in installments 5,876,913 6,032,889 5,892,790 6,656,273
Cash and cash equivalents and marketable
securities (900,243) (778,799) (1,681,875) (2,314,288)
Net debt 4,976,670 5,254,090 4,210,915 4,341,985
Total equity 14,099,911 13,774,795 15,514,445 15,183,964
Total capital 19,076,581 19,028,885 19,725,360 19,525,949
Gearing ratio 26% 28% 21% 22%
5 Derivative financial instruments Usiminas enters into swap transactions with the objective of hedging against and specially managing interest rate risks. These transactions aim at reducing the volatility of interest rates on its borrowings. The Company does not transact financial instruments for speculative purposes. The Company does not settle its transactions prior to their respective original maturities and does not prepay its derivative financial instruments. At September 30, 2018, the derivative financial instruments entered into by the Company are as follows:
(a) Parent company and Consolidated
Profit/Loss for
the period
9/30/2018 12/31/2017 9/30/2018
Asset position Liability position Asset position Liability position Asset position Liability positionAsset
(liability)
position
Asset
(liability)
position
Gain (loss)
RATE AND FOREIGN EXCHANGE HEDGES (SWAP)
Bradesco Apr/15 to Apr/25 TR + 9.8000% p.a. 95.00% of the CDI R$ 59,000 R$ 59,000 R$ 59,000 R$ 59,000 1,936 1,196 755
Financial gain/loss in the period 755
Book balance (net asset position - liability position) 1,936 1,196
Maturity range
MM/YY
FAIR (MARKET) VALUE -
BOOK VALUEINDEX NOTIONAL AMOUNT (contracted amount)
9/30/2018 9/30/2018 12/31/2017
(A free translation of the original in Portuguese)
32
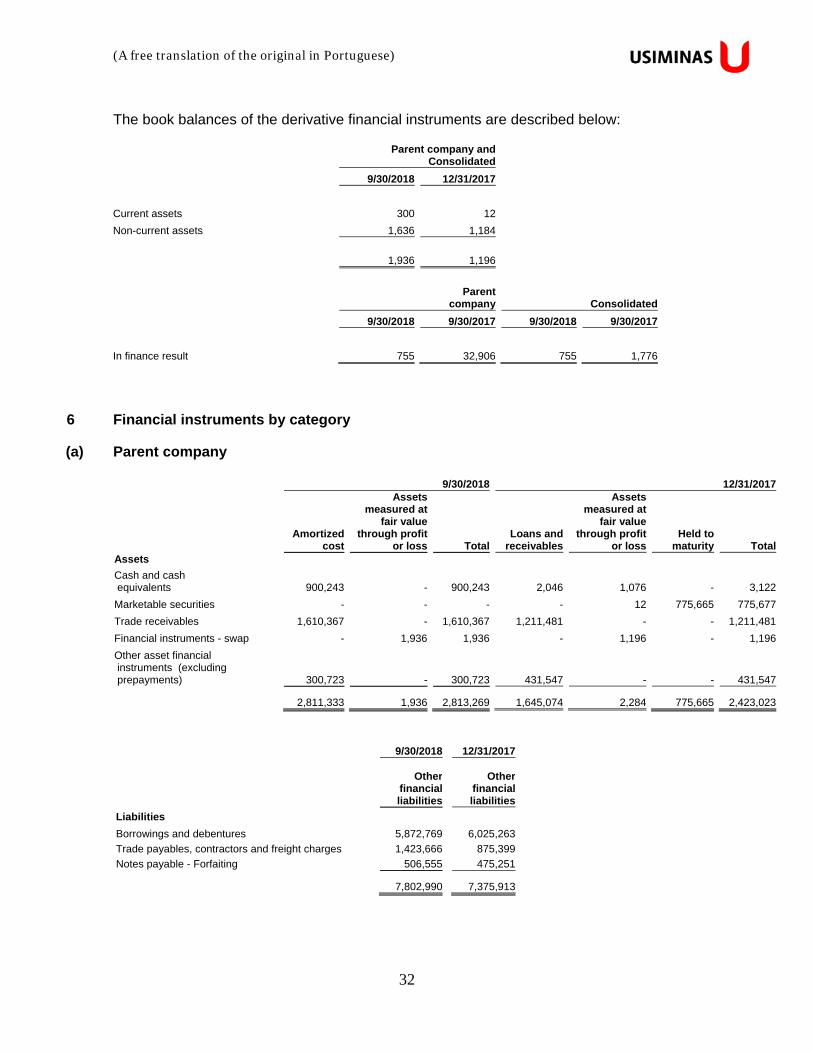
The book balances of the derivative financial instruments are described below: Parent company and
Consolidated 9/30/2018 12/31/2017
Current assets 300 12
Non-current assets 1,636 1,184
1,936 1,196
Parent company Consolidated
9/30/2018 9/30/2017 9/30/2018 9/30/2017
In finance result 755 32,906 755 1,776
6 Financial instruments by category
(a) Parent company 9/30/2018 12/31/2017
Amortized
cost
Assets measured at
fair value through profit
or loss TotalLoans and
receivables
Assets measured at
fair value through profit
or loss Held to
maturity TotalAssets
Cash and cash equivalents 900,243 - 900,243 2,046 1,076 - 3,122
Marketable securities - - - - 12 775,665 775,677
Trade receivables 1,610,367 - 1,610,367 1,211,481 - - 1,211,481
Financial instruments - swap - 1,936 1,936 - 1,196 - 1,196
Other asset financial instruments (excluding prepayments) 300,723 - 300,723 431,547 - - 431,547
2,811,333 1,936 2,813,269 1,645,074 2,284 775,665 2,423,023
9/30/2018 12/31/2017
Other
financial liabilities
Other
financial liabilities
Liabilities
Borrowings and debentures 5,872,769 6,025,263
Trade payables, contractors and freight charges 1,423,666 875,399
Notes payable - Forfaiting 506,555 475,251
7,802,990 7,375,913
(A free translation of the original in Portuguese)
33
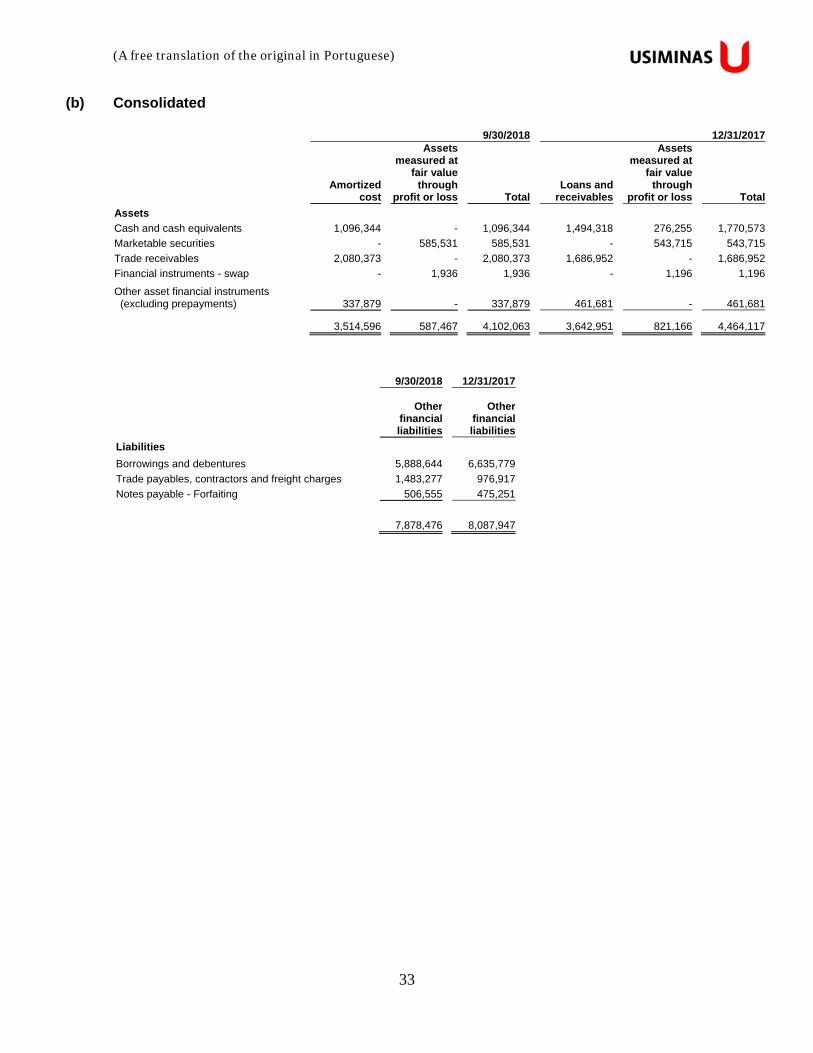
(b) Consolidated 9/30/2018 12/31/2017
Amortized
cost
Assets measured at
fair value through
profit or loss Total Loans and
receivables
Assets measured at
fair value through
profit or loss Total
Assets
Cash and cash equivalents 1,096,344 - 1,096,344 1,494,318 276,255 1,770,573
Marketable securities - 585,531 585,531 - 543,715 543,715
Trade receivables 2,080,373 - 2,080,373 1,686,952 - 1,686,952
Financial instruments - swap - 1,936 1,936 - 1,196 1,196
Other asset financial instruments (excluding prepayments) 337,879 - 337,879 461,681 -
461,681
3,514,596 587,467 4,102,063 3,642,951 821,166 4,464,117
9/30/2018 12/31/2017
Other
financial liabilities
Other
financial liabilities
Liabilities
Borrowings and debentures 5,888,644 6,635,779
Trade payables, contractors and freight charges 1,483,277 976,917
Notes payable - Forfaiting 506,555 475,251
7,878,476 8,087,947

(A free translation of the original in Portuguese)
34
7 Cash and cash equivalents
Parent
company Consolidated
9/30/2018 12/31/2017 9/30/2018 12/31/2017
Bank accounts 22,400 1,107 36,653 15,845
Bank accounts abroad 44,529 939 147,894 91,854Bank Deposit Certificates (CDB) and repurchase agreements 833,314 1,076 911,797 276,255
Financial investments abroad (Time deposits) - - - 1,386,619
900,243 3,122 1,096,344 1,770,573
Financial investments in Bank Deposit Certificates (CDB) and repurchase agreements have immediate liquidity and earn on average 99.61% (December 31, 2017 - 100.07%) of the CDI rate in the Parent company and 100.25% (December 31, 2017 – 100.41%) of the CDI rate in Consolidated. At December 31, 2017, the amount of R$1,386,619 presented in the Consolidated accounts refers to the investment in time deposits made by the foreign subsidiary Usiminas Commercial related to the prepayment by Usiminas on December 15, 2017 of Eurobonds issued in 2008 by the subsidiary and that had been loaned to the Company. On January 18, 2018, the foreign subsidiary Usiminas Commercial paid the full amount of Eurobonds to their related creditors. At September 30, 2018, Usiminas does not have overdraft accounts.

(A free translation of the original in Portuguese)
35
8 Marketable securities
Parent
companyConsolidated
12/31/2017 9/30/2018 12/31/2017
Bank Deposit Certificates (CDB) - 576,391 534,768
Financial investments abroad - 9,140 8,428
Eurobonds 775,665 - -
Other investments 12 - 519
775,677 585,531 543,715
Financial investments in Bank Deposit Certificates (CDB) earn on average 100.25% (December 31, 2017 - 100.41%) of the CDI rate in Consolidated. None of these financial assets is either past due or impaired. At December 31, 2017, the amount of R$ 775,665 in the Parent Company refers to a portion of approximately US$ 220 million of the Eurobonds held by the Company, originally issued in 2008 by the foreign subsidiary Usiminas Commercial. On January 18, 2018, as a result of the maturity of the Eurobonds, that amount was added to the Company's cash. In the nine-month period ended September 30, 2018, funds related to this transaction were fully used in the Company's operational flow. In the nine-month period ended September 30, 2018, the Company does not have balances related to financial investments classified as marketable securities.

(A free translation of the original in Portuguese)
36
9 Trade receivables
Parent
companyConsolidated
9/30/2018 12/31/2017 9/30/2018 12/31/2017
Trade receivables:
In local currency 1,198,277 954,817 1,880,212 1,485,132
In foreign currency 70,721 181,277 173,723 299,862
Provision for impairment of trade receivables (i) (110,062) (108,544) (149,425) (145,526)
Trade receivables, net 1,158,936 1,027,550 1,904,510 1,639,468
Receivables from related parties
In local currency 349,978 180,402 74,410 46,711
In foreign currency 101,453 3,529 101,453 773
Receivables from related parties 451,431 183,931 175,863 47,484
1,610,367 1,211,481 2,080,373 1,686,952
Current assets 1,524,482 1,127,029 1,947,482 1,555,494
Non-current assets 85,885 84,452 132,891 131,458
(i) Of the total provision for impairment of trade receivables in the Parent company and Consolidated accounts, the balance
of R$4,687 (R$2,669 - December 31, 2017) refers to trade receivables denominated in foreign currency.
The ageing analysis of trade receivables was as follows:
Parent
company Consolidated
9/30/2018 12/31/2017 9/30/2018 12/31/2017
Amounts not yet due 1,436,603 1,042,201 1,871,554 1,481,810
Amounts past due:
Up to 30 days 112,778 103,377 131,516 85,026
From 31 to 60 days 2,648 1,460 4,918 1,428
From 61 to 90 days - 4 2,582 1,361
From 91 to 180 days 1,020 1,896 3,835 3,904
Over 181 days 167,380 171,087 215,393 258,949
(-) Provision for impairment of trade receivables (110,062) (108,544) (149,425) (145,526)
1,610,367 1,211,481 2,080,373 1,686,952
At September 30, 2018, trade receivables amounting to R$173,764 in the Parent company and R$208,819 in Consolidated were past due but not impaired (December 31, 2017 - R$169,280 and R$205,142, respectively). These relate to a number of independent customers for which there is no recent history of default, or the outstanding balances of which are supported by guarantees.
(A free translation of the original in Portuguese)
37
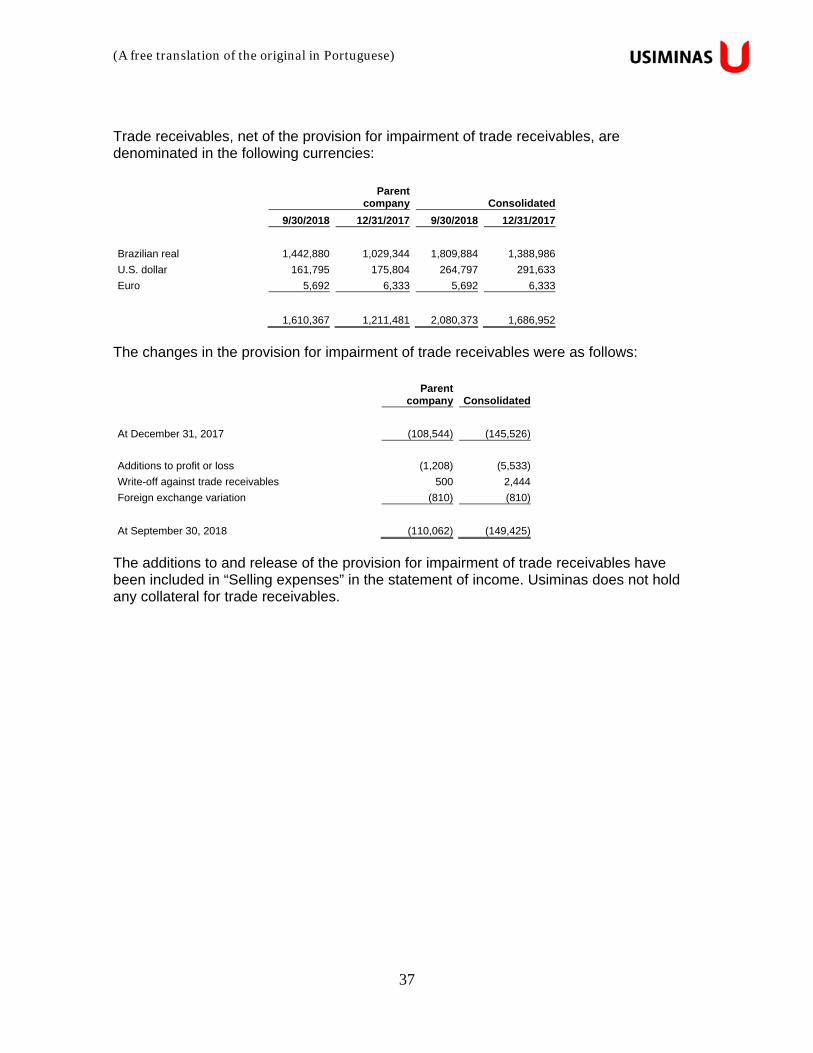
Trade receivables, net of the provision for impairment of trade receivables, are denominated in the following currencies:
Parent
company Consolidated
9/30/2018 12/31/2017 9/30/2018 12/31/2017
Brazilian real 1,442,880 1,029,344 1,809,884 1,388,986
U.S. dollar 161,795 175,804 264,797 291,633
Euro 5,692 6,333 5,692 6,333
1,610,367 1,211,481 2,080,373 1,686,952
The changes in the provision for impairment of trade receivables were as follows:
Parent
company Consolidated
At December 31, 2017 (108,544) (145,526)
Additions to profit or loss (1,208) (5,533)
Write-off against trade receivables 500 2,444
Foreign exchange variation (810) (810)
At September 30, 2018 (110,062) (149,425)
The additions to and release of the provision for impairment of trade receivables have been included in “Selling expenses” in the statement of income. Usiminas does not hold any collateral for trade receivables.
(A free translation of the original in Portuguese)
38
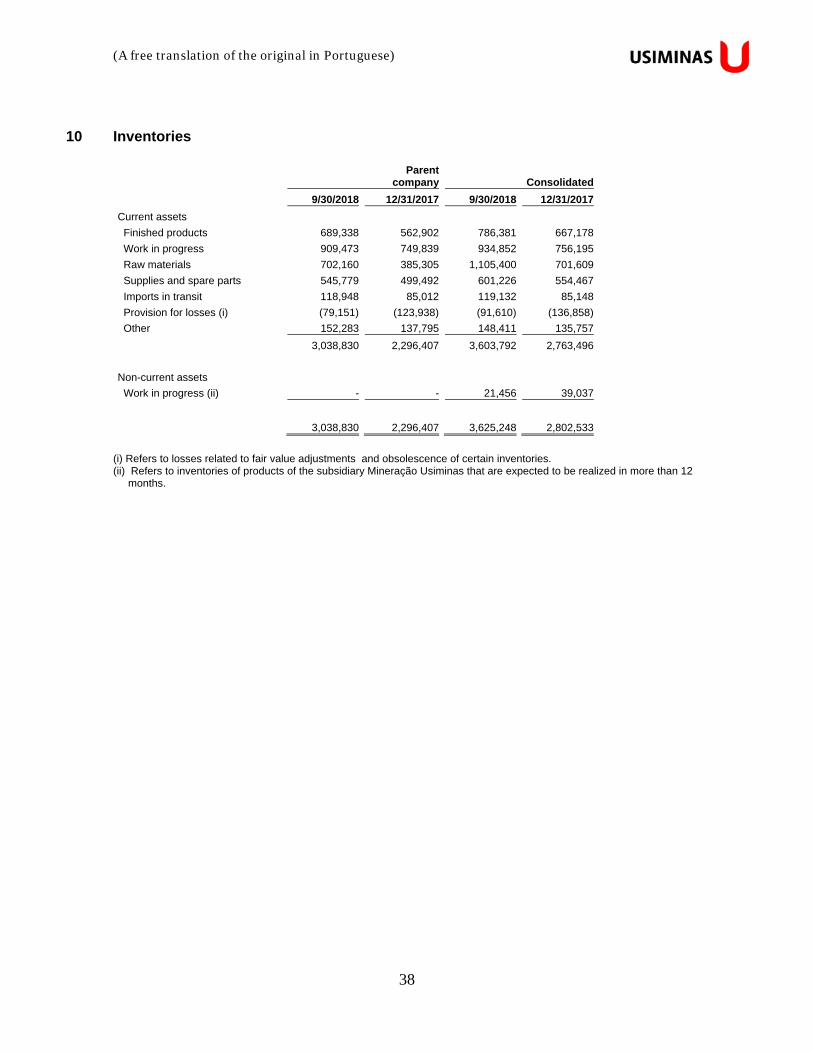
10 Inventories
Parent
company Consolidated
9/30/2018 12/31/2017 9/30/2018 12/31/2017
Current assets
Finished products 689,338 562,902 786,381 667,178
Work in progress 909,473 749,839 934,852 756,195
Raw materials 702,160 385,305 1,105,400 701,609
Supplies and spare parts 545,779 499,492 601,226 554,467
Imports in transit 118,948 85,012 119,132 85,148
Provision for losses (i) (79,151) (123,938) (91,610) (136,858)
Other 152,283 137,795 148,411 135,757
3,038,830 2,296,407 3,603,792 2,763,496
Non-current assets
Work in progress (ii) - - 21,456 39,037
3,038,830 2,296,407 3,625,248 2,802,533
(i) Refers to losses related to fair value adjustments and obsolescence of certain inventories. (ii) Refers to inventories of products of the subsidiary Mineração Usiminas that are expected to be realized in more than 12
months.
(A free translation of the original in Portuguese)
39
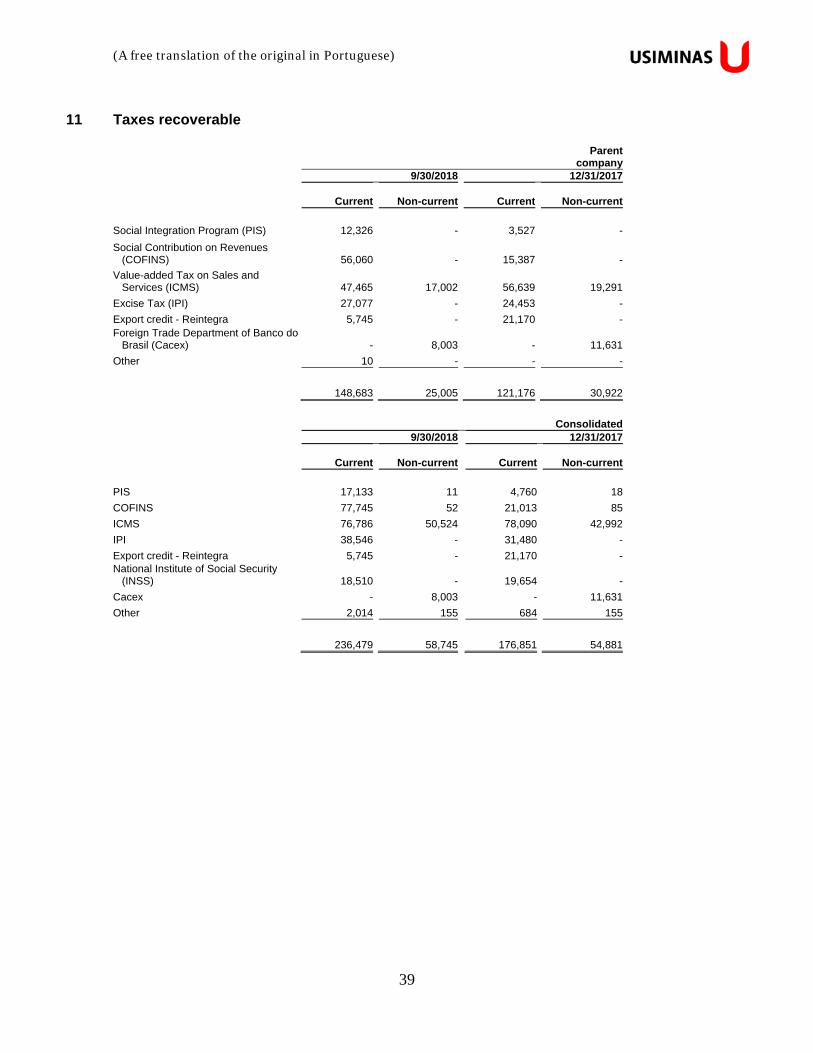
11 Taxes recoverable
Parent
company 9/30/2018 12/31/2017 Current Non-current Current Non-current
Social Integration Program (PIS) 12,326 - 3,527 -
Social Contribution on Revenues (COFINS) 56,060 - 15,387 -
Value-added Tax on Sales and Services (ICMS) 47,465 17,002 56,639 19,291
Excise Tax (IPI) 27,077 - 24,453 -
Export credit - Reintegra 5,745 - 21,170 -Foreign Trade Department of Banco do Brasil (Cacex) - 8,003 - 11,631
Other 10 - - -
148,683 25,005 121,176 30,922
Consolidated 9/30/2018 12/31/2017 Current Non-current Current Non-current
PIS 17,133 11 4,760 18
COFINS 77,745 52 21,013 85
ICMS 76,786 50,524 78,090 42,992
IPI 38,546 - 31,480 -
Export credit - Reintegra 5,745 - 21,170 -National Institute of Social Security (INSS) 18,510 - 19,654 -
Cacex - 8,003 - 11,631
Other 2,014 155 684 155
236,479 58,745 176,851 54,881
(A free translation of the original in Portuguese)
40
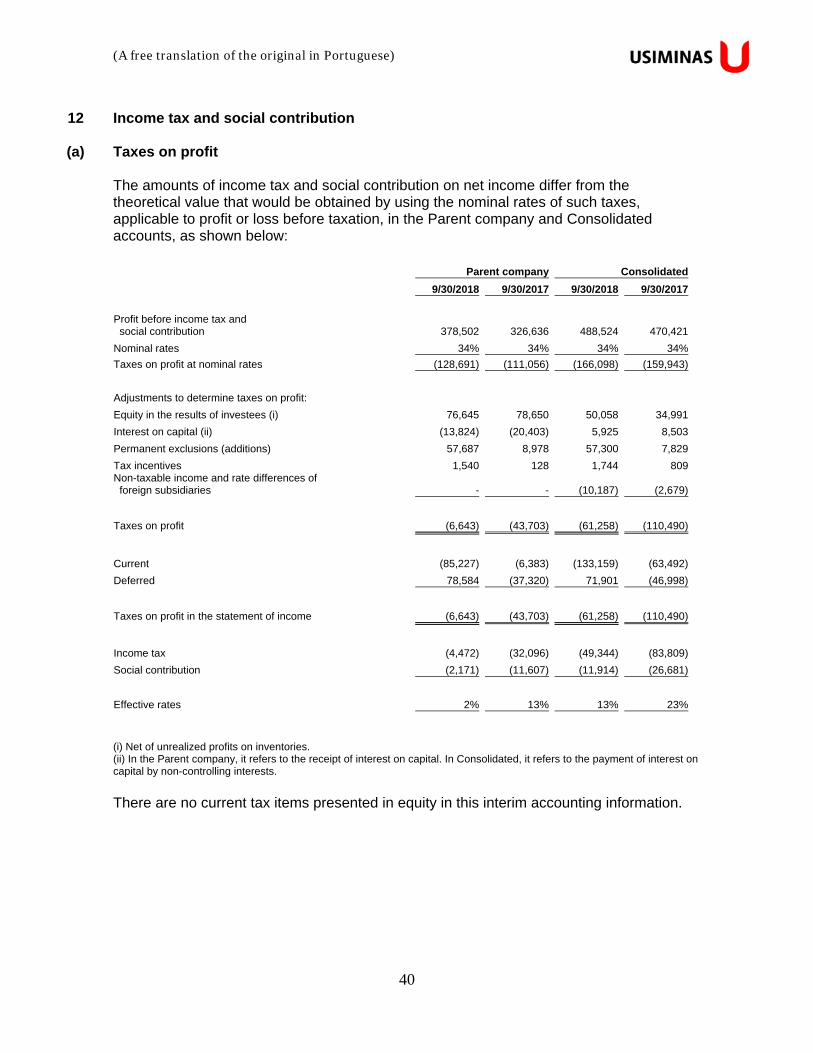
12 Income tax and social contribution
(a) Taxes on profit
The amounts of income tax and social contribution on net income differ from the theoretical value that would be obtained by using the nominal rates of such taxes, applicable to profit or loss before taxation, in the Parent company and Consolidated accounts, as shown below:
Parent company Consolidated
9/30/2018 9/30/2017 9/30/2018 9/30/2017
Profit before income tax and social contribution 378,502 326,636 488,524 470,421
Nominal rates 34% 34% 34% 34%
Taxes on profit at nominal rates (128,691) (111,056) (166,098) (159,943)
Adjustments to determine taxes on profit:
Equity in the results of investees (i) 76,645 78,650 50,058 34,991
Interest on capital (ii) (13,824) (20,403) 5,925 8,503
Permanent exclusions (additions) 57,687 8,978 57,300 7,829
Tax incentives 1,540 128 1,744 809Non-taxable income and rate differences of foreign subsidiaries - - (10,187) (2,679)
Taxes on profit (6,643) (43,703) (61,258) (110,490)
Current (85,227) (6,383) (133,159) (63,492)
Deferred 78,584 (37,320) 71,901 (46,998)
Taxes on profit in the statement of income (6,643) (43,703) (61,258) (110,490)
Income tax (4,472) (32,096) (49,344) (83,809)
Social contribution (2,171) (11,607) (11,914) (26,681)
Effective rates 2% 13% 13% 23%
(i) Net of unrealized profits on inventories. (ii) In the Parent company, it refers to the receipt of interest on capital. In Consolidated, it refers to the payment of interest on capital by non-controlling interests.
There are no current tax items presented in equity in this interim accounting information.
(A free translation of the original in Portuguese)
41
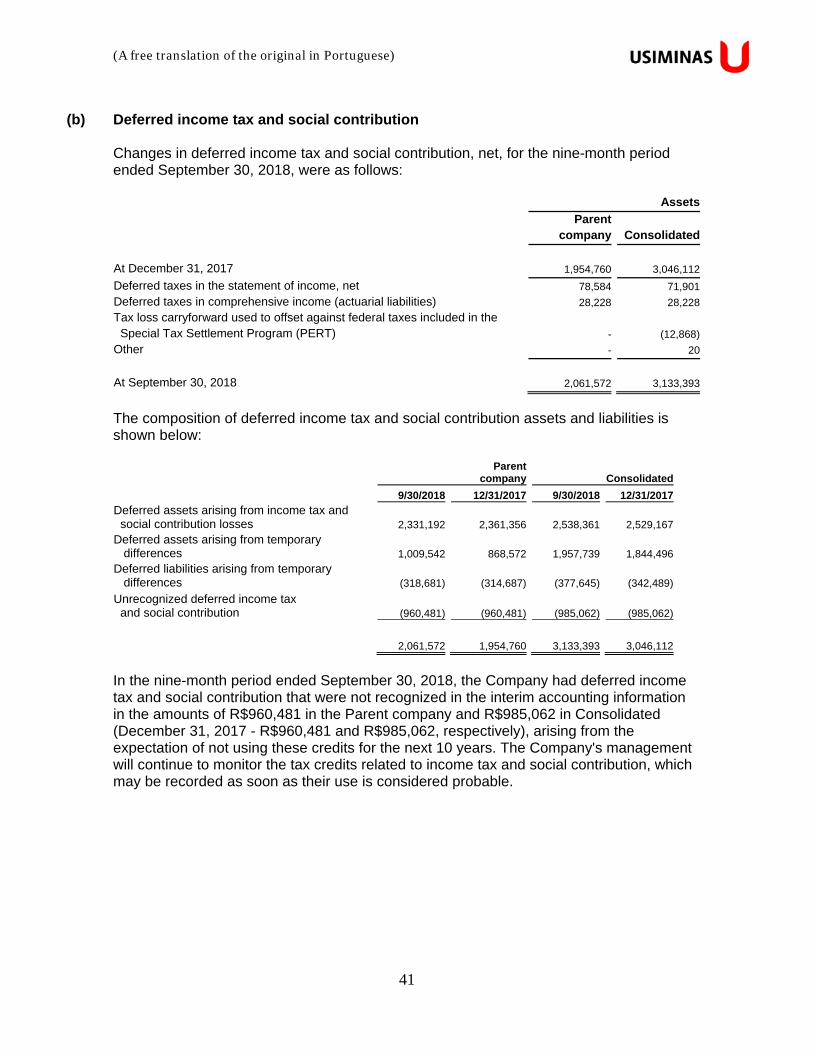
(b) Deferred income tax and social contribution
Changes in deferred income tax and social contribution, net, for the nine-month period ended September 30, 2018, were as follows: Assets
Parent
company Consolidated
At December 31, 2017 1,954,760 3,046,112
Deferred taxes in the statement of income, net 78,584 71,901
Deferred taxes in comprehensive income (actuarial liabilities) 28,228 28,228
Tax loss carryforward used to offset against federal taxes included in the Special Tax Settlement Program (PERT) - (12,868)
Other - 20
At September 30, 2018 2,061,572 3,133,393
The composition of deferred income tax and social contribution assets and liabilities is shown below:
Parent
company Consolidated
9/30/2018 12/31/2017 9/30/2018 12/31/2017
Deferred assets arising from income tax and social contribution losses 2,331,192 2,361,356 2,538,361 2,529,167
Deferred assets arising from temporary differences 1,009,542 868,572 1,957,739 1,844,496
Deferred liabilities arising from temporary differences (318,681) (314,687) (377,645) (342,489)
Unrecognized deferred income tax and social contribution (960,481) (960,481) (985,062) (985,062)
2,061,572 1,954,760 3,133,393 3,046,112
In the nine-month period ended September 30, 2018, the Company had deferred income tax and social contribution that were not recognized in the interim accounting information in the amounts of R$960,481 in the Parent company and R$985,062 in Consolidated (December 31, 2017 - R$960,481 and R$985,062, respectively), arising from the expectation of not using these credits for the next 10 years. The Company's management will continue to monitor the tax credits related to income tax and social contribution, which may be recorded as soon as their use is considered probable.
(A free translation of the original in Portuguese)
42
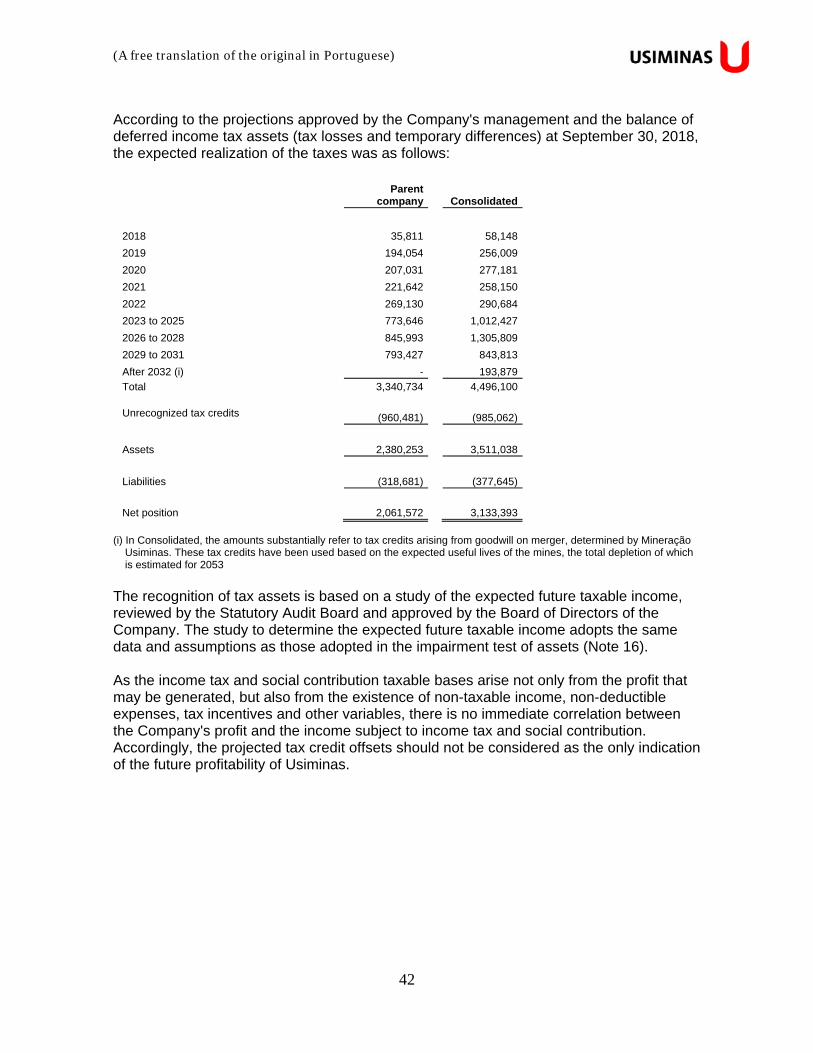
According to the projections approved by the Company's management and the balance of deferred income tax assets (tax losses and temporary differences) at September 30, 2018, the expected realization of the taxes was as follows:
Parent
company Consolidated
2018 35,811 58,148
2019 194,054 256,009
2020 207,031 277,181
2021 221,642 258,150
2022 269,130 290,684
2023 to 2025 773,646 1,012,427
2026 to 2028 845,993 1,305,809
2029 to 2031 793,427 843,813
After 2032 (i) - 193,879
Total 3,340,734 4,496,100 Unrecognized tax credits (960,481) (985,062)
Assets 2,380,253 3,511,038
Liabilities (318,681) (377,645)
Net position 2,061,572 3,133,393
(i) In Consolidated, the amounts substantially refer to tax credits arising from goodwill on merger, determined by Mineração Usiminas. These tax credits have been used based on the expected useful lives of the mines, the total depletion of which is estimated for 2053
The recognition of tax assets is based on a study of the expected future taxable income, reviewed by the Statutory Audit Board and approved by the Board of Directors of the Company. The study to determine the expected future taxable income adopts the same data and assumptions as those adopted in the impairment test of assets (Note 16). As the income tax and social contribution taxable bases arise not only from the profit that may be generated, but also from the existence of non-taxable income, non-deductible expenses, tax incentives and other variables, there is no immediate correlation between the Company's profit and the income subject to income tax and social contribution. Accordingly, the projected tax credit offsets should not be considered as the only indication of the future profitability of Usiminas.

(A free translation of the original in Portuguese)
43
13 Judicial deposits
At September 30, 2018, changes in judicial deposits were as follows: Parent company Consolidated
At December 31, 2017 (i) 713,763 872,492
Additions (ii) 31,936 110,327
Interest/restatements 8,234 11,780
Reversals (ii) (25,451) (100,161)
Subtotal 728,482 894,438
(-) Offset against taxes payable in installments (196,892) (196,892)
At September 30, 2018 531,590 697,546 (i) From the total amount of judicial deposits presented in the balance sheet, the amount of R$196,892 must be deducted,
related to the offset of taxes payable in installments. (ii) In Consolidated the amounts substantially refer to additions and reversals in the subsidiary Soluções Usiminas, related to
a civil proceeding.
(A free translation of the original in Portuguese)
44
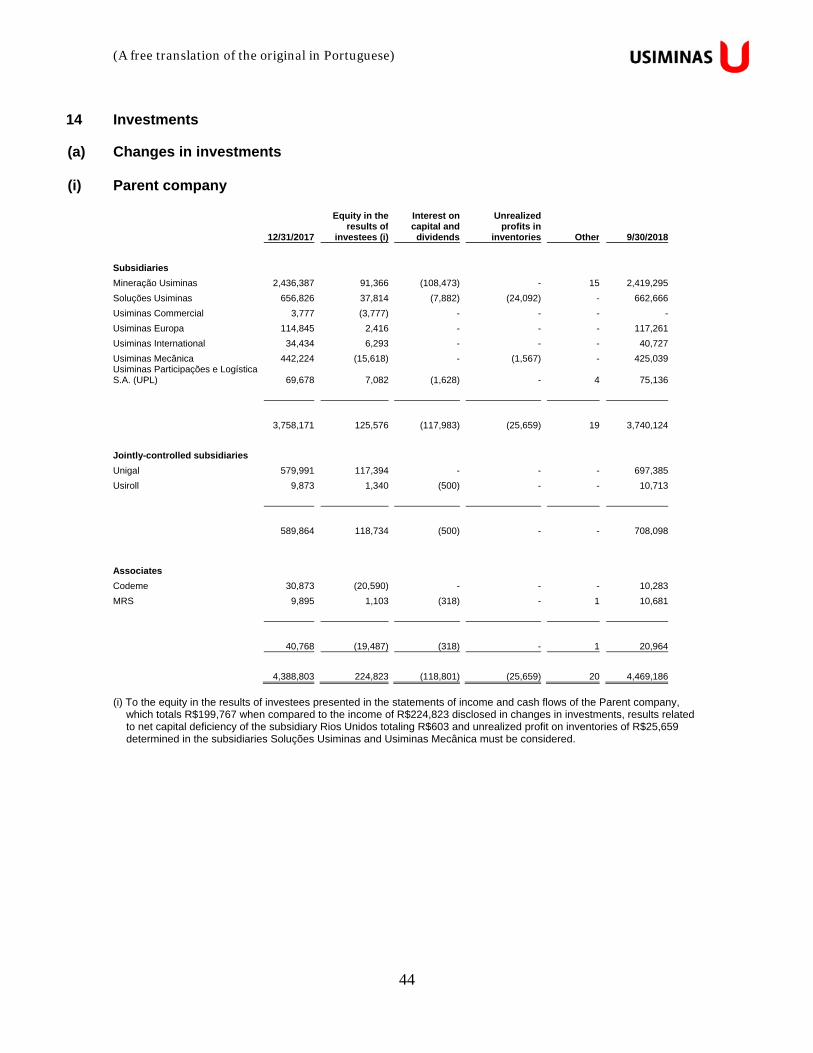
14 Investments (a) Changes in investments
(i) Parent company
12/31/2017
Equity in theresults of
investees (i)
Interest on capital and dividends
Unrealized profits in
inventories Other
9/30/2018
Subsidiaries
Mineração Usiminas 2,436,387 91,366 (108,473) - 15 2,419,295
Soluções Usiminas 656,826 37,814 (7,882) (24,092) - 662,666
Usiminas Commercial 3,777 (3,777) - - - -
Usiminas Europa 114,845 2,416 - - - 117,261
Usiminas International 34,434 6,293 - - - 40,727
Usiminas Mecânica 442,224 (15,618) - (1,567) - 425,039Usiminas Participações e Logística S.A. (UPL) 69,678 7,082 (1,628) - 4 75,136
3,758,171 125,576 (117,983) (25,659) 19 3,740,124
Jointly-controlled subsidiaries
Unigal 579,991 117,394 - - - 697,385
Usiroll 9,873 1,340 (500) - - 10,713
589,864 118,734 (500) - - 708,098
Associates
Codeme 30,873 (20,590) - - - 10,283
MRS 9,895 1,103 (318) - 1 10,681
40,768 (19,487) (318) - 1 20,964
4,388,803 224,823 (118,801) (25,659) 20 4,469,186
(i) To the equity in the results of investees presented in the statements of income and cash flows of the Parent company,
which totals R$199,767 when compared to the income of R$224,823 disclosed in changes in investments, results related to net capital deficiency of the subsidiary Rios Unidos totaling R$603 and unrealized profit on inventories of R$25,659 determined in the subsidiaries Soluções Usiminas and Usiminas Mecânica must be considered.

(A free translation of the original in Portuguese)
45
(ii) Consolidated
12/31/2017
Equity in the results of investees
Interest on capital and dividends Other 9/30/2018
Jointly-controlled subsidiaries Modal 2,672 1,996 (2,185) - 2,483
Unigal 579,991 117,394 - - 697,385
Usiroll 9,873 1,340 (500) - 10,713
Goodwill on jointly-controlled subsidiaries 14,201 - - - 14,201
606,737 120,730 (2,685) - 724,782
Associates
Codeme 30,873 (20,590) - - 10,283
MRS 404,246 45,057 (12,984) 31 436,350
Paraopeba Terminal 902 (6) - - 896
Sarzedo Terminal 1,459 2,088 (2,036) 1,511
Other 2,635 (50) - (38) 2,547
Goodwill on associates 7,200 - - - 7,200
447,315 26,499 (15,020) (7) 458,787
Total 1,054,052 147,229 (17,705) (7) 1,183,569
(A free translation of the original in Portuguese)
46
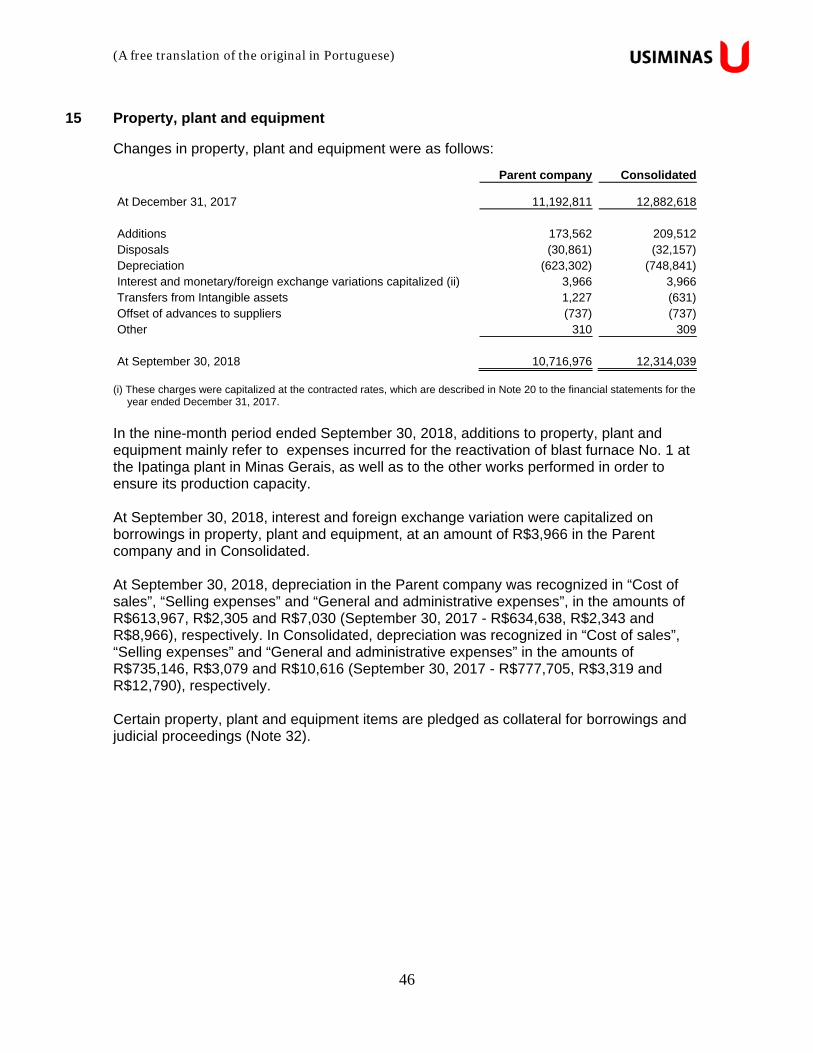
15 Property, plant and equipment
Changes in property, plant and equipment were as follows:
Parent company Consolidated
At December 31, 2017 11,192,811 12,882,618
Additions 173,562 209,512Disposals (30,861) (32,157)Depreciation (623,302) (748,841)Interest and monetary/foreign exchange variations capitalized (ii) 3,966 3,966Transfers from Intangible assets 1,227 (631)Offset of advances to suppliers (737) (737)Other 310 309
At September 30, 2018 10,716,976 12,314,039
(i) These charges were capitalized at the contracted rates, which are described in Note 20 to the financial statements for the
year ended December 31, 2017.
In the nine-month period ended September 30, 2018, additions to property, plant and equipment mainly refer to expenses incurred for the reactivation of blast furnace No. 1 at the Ipatinga plant in Minas Gerais, as well as to the other works performed in order to ensure its production capacity. At September 30, 2018, interest and foreign exchange variation were capitalized on borrowings in property, plant and equipment, at an amount of R$3,966 in the Parent company and in Consolidated. At September 30, 2018, depreciation in the Parent company was recognized in “Cost of sales”, “Selling expenses” and “General and administrative expenses”, in the amounts of R$613,967, R$2,305 and R$7,030 (September 30, 2017 - R$634,638, R$2,343 and R$8,966), respectively. In Consolidated, depreciation was recognized in “Cost of sales”, “Selling expenses” and “General and administrative expenses” in the amounts of R$735,146, R$3,079 and R$10,616 (September 30, 2017 - R$777,705, R$3,319 and R$12,790), respectively. Certain property, plant and equipment items are pledged as collateral for borrowings and judicial proceedings (Note 32).
(A free translation of the original in Portuguese)
47
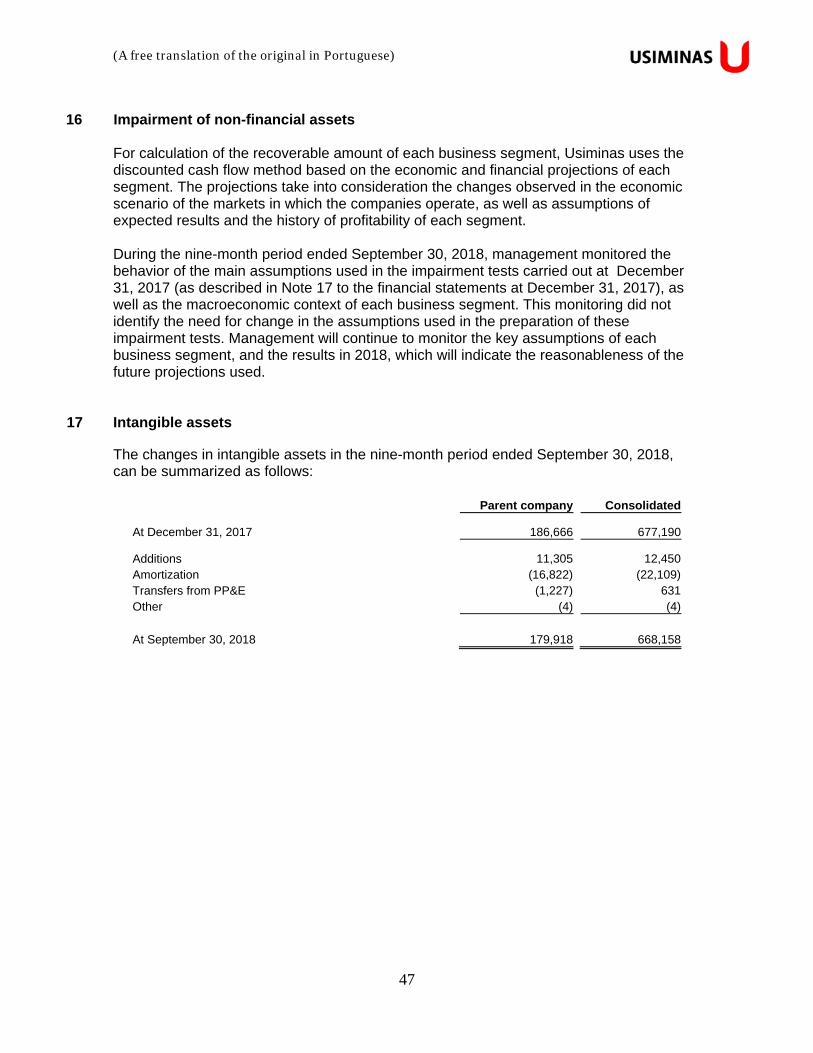
16 Impairment of non-financial assets
For calculation of the recoverable amount of each business segment, Usiminas uses the discounted cash flow method based on the economic and financial projections of each segment. The projections take into consideration the changes observed in the economic scenario of the markets in which the companies operate, as well as assumptions of expected results and the history of profitability of each segment. During the nine-month period ended September 30, 2018, management monitored the behavior of the main assumptions used in the impairment tests carried out at December 31, 2017 (as described in Note 17 to the financial statements at December 31, 2017), as well as the macroeconomic context of each business segment. This monitoring did not identify the need for change in the assumptions used in the preparation of these impairment tests. Management will continue to monitor the key assumptions of each business segment, and the results in 2018, which will indicate the reasonableness of the future projections used.
17 Intangible assets The changes in intangible assets in the nine-month period ended September 30, 2018, can be summarized as follows:
Parent company Consolidated
At December 31, 2017 186,666 677,190
Additions 11,305 12,450Amortization (16,822) (22,109)Transfers from PP&E (1,227) 631Other (4) (4)
At September 30, 2018 179,918 668,158

(A free translation of the original in Portuguese)
48
18 Borrowings and debentures
(a) Covenants
With respect to financial covenants, as presented in Note 20.1 (a) to the financial statements for the year ended December 31, 2017, the Company is required to comply with the following indices, calculated on an individual basis (Parent company) as from June 2019. In relation to the non-financial covenants established in the debt instruments, the Company has monitoring controls and, for the nine-month period ended September 30, 2018, no breaches of these covenants were found.
(b) Borrowings Changes in borrowings were as follows:
Parent
company Consolidated
At December 31, 2017 5,075,898 5,686,414
Accrued charges 244,133 246,409
Monetary variation 75,658 75,840
Foreign exchange variation 228,384 213,441
Payment of interest (324,069) (345,332)
Repayment of principal (327,739) (888,632)
Deferral of commissions 10,825 10,825
At September 30, 2018 4,983,090 4,998,965
Current liabilities 11,708 16,630
Non-current liabilities 4,971,382 4,982,335
The amounts recorded in non-current liabilities have the following composition, by maturity year:
Parent company Consolidated
9/30/2018 12/31/2017 9/30/2018 12/31/2017
2019 63,299 66,368 64,438 70,943
2020 350,026 332,197 353,933 336,104
2021 656,116 624,370 659,263 627,517
2022 948,178 903,198 950,908 905,928
2023 948,480 903,787 948,506 906,446
2024 to 2026 2,005,283 1,911,510 2,005,287 1,911,530
4,971,382 4,741,430 4,982,335 4,758,468

(A free translation of the original in Portuguese)
49
(c) Debentures At September 30, 2018, changes in debentures were as follows:
Parent company and
Consolidated
At December 31, 2017 949,365
Accrued charges 51,280
Monetary variation 12,466
Payment of interest (64,104)
Repayment of principal (60,341)
Deferral of commissions 1,013
At September 30, 2018 (i) 889,679
Current liabilities 1,584
Non-current liabilities 888,095
(i) Balance presented net, after deducting the amount of R$6,804 related to the deferral of transaction costs, in accordance with Technical Pronouncement CPC 08 - Transaction Costs and Premiums on Issue of Securities.
At September 30, 2018, the charges of R$1,584 on the debentures are recorded in current liabilities (December 31, 2017 - R$1,942). At September 30, 2018, after the renegotiation of the Company’s debts, the amount of R$893,549 relates to the principal balance of debentures, with annual maturities from 2019 to 2026. The amounts recorded in non-current liabilities have the following composition, by maturity year:
Parent company andConsolidated
9/30/2018 12/31/2017
2019 11,818 11,692
2020 61,818 61,692
2021 116,818 116,692
2022 169,318 169,192
2023 169,318 169,192
2024 to 2026 359,005 358,874
888,095 887,334
(A free translation of the original in Portuguese)
50
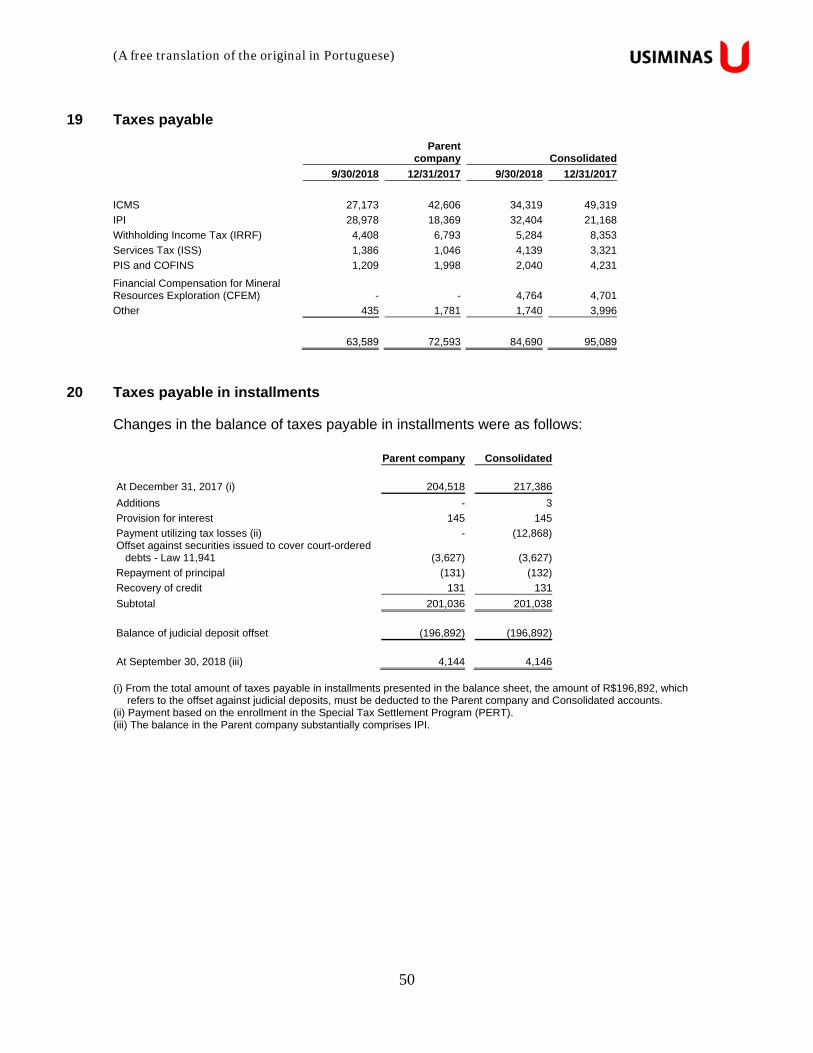
19 Taxes payable
Parent
company Consolidated
9/30/2018 12/31/2017 9/30/2018 12/31/2017
ICMS 27,173 42,606 34,319 49,319
IPI 28,978 18,369 32,404 21,168
Withholding Income Tax (IRRF) 4,408 6,793 5,284 8,353
Services Tax (ISS) 1,386 1,046 4,139 3,321
PIS and COFINS 1,209 1,998 2,040 4,231
Financial Compensation for Mineral Resources Exploration (CFEM) - -
4,764 4,701
Other 435 1,781 1,740 3,996
63,589 72,593 84,690 95,089
20 Taxes payable in installments
Changes in the balance of taxes payable in installments were as follows: Parent company Consolidated
At December 31, 2017 (i) 204,518 217,386
Additions - 3
Provision for interest 145 145
Payment utilizing tax losses (ii) - (12,868)Offset against securities issued to cover court-ordered debts - Law 11,941 (3,627) (3,627)
Repayment of principal (131) (132)
Recovery of credit 131 131
Subtotal 201,036 201,038
Balance of judicial deposit offset (196,892) (196,892)
At September 30, 2018 (iii) 4,144 4,146 (i) From the total amount of taxes payable in installments presented in the balance sheet, the amount of R$196,892, which
refers to the offset against judicial deposits, must be deducted to the Parent company and Consolidated accounts. (ii) Payment based on the enrollment in the Special Tax Settlement Program (PERT). (iii) The balance in the Parent company substantially comprises IPI.
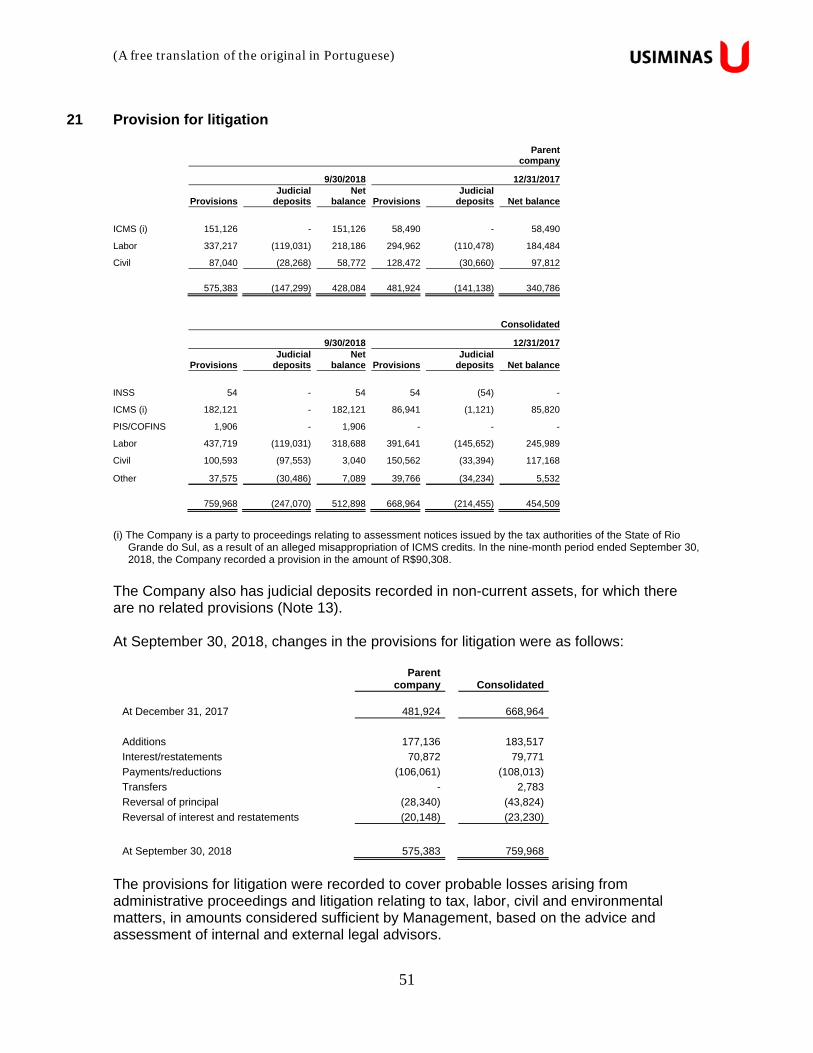
(A free translation of the original in Portuguese)
51
21 Provision for litigation
Parent
company
9/30/2018 12/31/2017
ProvisionsJudicial
deposits Net
balance ProvisionsJudicial
deposits Net balance
ICMS (i) 151,126 - 151,126 58,490 - 58,490
Labor 337,217 (119,031) 218,186 294,962 (110,478) 184,484
Civil 87,040 (28,268) 58,772 128,472 (30,660) 97,812
575,383 (147,299) 428,084 481,924 (141,138) 340,786
Consolidated
9/30/2018 12/31/2017
ProvisionsJudicial
deposits Net
balance ProvisionsJudicial
deposits Net balance
INSS 54 - 54 54 (54) -
ICMS (i) 182,121 - 182,121 86,941 (1,121) 85,820
PIS/COFINS 1,906 - 1,906 - - -
Labor 437,719 (119,031) 318,688 391,641 (145,652) 245,989
Civil 100,593 (97,553) 3,040 150,562 (33,394) 117,168
Other 37,575 (30,486) 7,089 39,766 (34,234) 5,532
759,968 (247,070) 512,898 668,964 (214,455) 454,509
(i) The Company is a party to proceedings relating to assessment notices issued by the tax authorities of the State of Rio
Grande do Sul, as a result of an alleged misappropriation of ICMS credits. In the nine-month period ended September 30, 2018, the Company recorded a provision in the amount of R$90,308.
The Company also has judicial deposits recorded in non-current assets, for which there are no related provisions (Note 13). At September 30, 2018, changes in the provisions for litigation were as follows:
Parent
company Consolidated
At December 31, 2017 481,924 668,964
Additions 177,136 183,517
Interest/restatements 70,872 79,771
Payments/reductions (106,061) (108,013)
Transfers - 2,783
Reversal of principal (28,340) (43,824)
Reversal of interest and restatements (20,148) (23,230)
At September 30, 2018 575,383 759,968
The provisions for litigation were recorded to cover probable losses arising from administrative proceedings and litigation relating to tax, labor, civil and environmental matters, in amounts considered sufficient by Management, based on the advice and assessment of internal and external legal advisors.
(A free translation of the original in Portuguese)
52
(a) Possible loss contingencies
In the nine-month period ended September 30, 2018, Usiminas was the defendant in proceedings involving risks of losses classified as possible by management, based on the opinion of its legal advisors, amounting to R$7,658,327 (December 31, 2017 - R$6,666,559). At September 30, 2018, the mentioned proceedings, for which no provision was recorded, related to civil matters - R$2,882,739; environmental matters - R$19,666; labor matters - R$862,672; and tax matters - R$3,893,250 (December 31, 2017 - civil matters - R$2,606,904; environmental matters - R$16,362; labor matters - R$587,987 and tax matters - R$3,455,306).
(b) Contingent assets At September 30, 2018, the main proceedings in which the Company is the plaintiff are presented below: (i) Compulsory loan - Eletrobrás The Company is the plaintiff in a lawsuit claiming the receipt of the full amount paid by Usiminas related to its Cubatão and Ipatinga branches to Eletrobrás, as a compulsory loan, in accordance with the legislation criteria in force at the time the tax was paid. A final and unappealable decision was rendered with respect to the action relating to the Cubatão branch. In June 2016, the Company filed a petition for liquidation by determination, with the immediate appointment of a forensic expert. At September 30, 2018, the amount in dispute totaled R$825,215. A final and unappealable decision was rendered with respect to the action relating to the Ipatinga branch. In August 2016, the Company filed a petition for liquidation by determination. The Company is waiting for the completion of the expert inspection of the records, which is in progress. At September 30, 2018, the amount in dispute totaled R$1,372,822. (ii) PIS and COFINS - Imports The Company was also the plaintiff in a proceeding claiming the unconstitutionality of the inclusion of ICMS and the contributions themselves in the calculation bases of PIS and COFINS on Imports. The final and unappealable decision issued in August 2015 recognized the right to offset the amounts effectively overpaid. The Company had the credits approved by the Federal Revenue Office. Of the total amount, R$738,405 was offset up to December 31, 2017. In the nine-month period ended September 30, 2018, the amounts offset totaled R$55,699.
(A free translation of the original in Portuguese)
53
(iii) Inclusion of ICMS in the calculation basis of PIS and COFINS In May 2018, a final and unappealable decision was issued on the petition for writ of mandamus filed by the Company in 2010, which challenged the inclusion of ICMS in the calculation bases of PIS and COFINS. As a result of the favorable outcome for the Company, amounts related to the taxes improperly paid in the period from June 2005 to December 2014 may be recovered. The Company, together with its external legal advisors, has been calculating the tax amounts improperly paid. Considering that the gathering of the relevant information is a complex process, its completion is expected in the fourth quarter of 2018. The calculation has been considering the uncertainties related to the matter with respect to the quantification of the credits, the monetary restatement method to be adopted, as well as the perspectives of realization through offsetting against federal taxes payable. The Company has continued with its calculation efforts in order to reliably measure the future economic benefit resulting from the final and unappealable decision issued on the petition for writ of mandamus. Accordingly, as established in CPC 00 (R1) - “Conceptual Framework for Financial Reporting”, the asset was not recognized in the interim accounting information for the quarter ended September 30, 2018.
22 Retirement benefit obligations
The amounts and information on retirement benefit obligations were as follows:
Parent company Consolidated
9/30/2018 12/31/2017 9/30/2018 12/31/2017
Balance sheet obligations for:
Pension benefits 572,209 648,860 572,209 648,860
Post-employment medical benefits 429,934 401,464 429,935 401,464
1,002,143 1,050,324 1,002,144 1,050,324
Parent company Consolidated
9/30/2018 9/30/2017 9/30/2018 9/30/2017
Income (expenses) recognized in the statement of income related to:
Pension benefits 22,060 5,828 22,059 5,828
Post-employment medical benefits (28,470) (27,205) (28,470) (27,651) (6,410) (21,377) (6,411) (21,823)

(A free translation of the original in Portuguese)
54
At September 30, 2018, the changes in actuarial gains and losses recognized in other comprehensive income were as follows:
Parent company Consolidated
Actuarial losses recognized directly in other comprehensive income (141,785) (141,765)
Actuarial losses on debts contracted and directly recognized in other comprehensive income - CPC 33 and IFRIC 14 (3,833) (3,833)
Decrease in assets (asset ceiling) in other comprehensive income - paragraph 58, CPC 33 and IAS 19 90,824 90,824
Accumulated actuarial losses recognized in other comprehensive income (i) (54,794) (54,774)
(i) At September 30, 2018, total balance in the Company included the amount of R$20 related to actuarial gains (losses) of
subsidiaries and jointly-controlled subsidiaries, recorded by the equity method of accounting. Changes in retirement benefit obligations In line with CPC 33 (R1) and IAS 19, the actuarial study carried out by an independent actuary as of December 31, 2017 presented liabilities totaling R$1,050,324. Changes in retirement benefit obligations are presented below:
Parent company Consolidated
At December 31, 2017 1,050,324 1,050,324
Amortization (137,612) (137,612)
Amounts recognized in the statement of income 6,410 6,411
Actuarial losses recognized directly in other comprehensive income 83,021 83,021
At September 30, 2018 1,002,143 1,002,144

(A free translation of the original in Portuguese)
55
23 Equity
(a) Capital
At September 30, 2018, the Company’s capital is R$13,200,295, comprising 1,253,079,108 book entry shares with no par value, of which 705,260,684 common shares; 547,749,823 Class A preferred shares and 68,601 Class B preferred shares, as shown below:
Common sharesClass A
Preferred sharesClass B
Preferred shares Total
Total shares at December 31, 2017 705,260,684 547,740,661 77,763 1,253,079,108
Transfers - 9,162 (9,162) -
Total shares at September 30, 2018 705,260,684 547,749,823 68,601 1,253,079,108
Total treasury shares (2,526,656) (21,250,817) - (23,777,473)
Total shares except treasury stock 702,734,028 526,499,006 68,601 1,229,301,635
(b) Reserves
At September 30, 2018, there were no changes in the nature and conditions of reserves in relation to those described in Note 27 (b) to the Company’s financial statements for the year ended December 31, 2017. Therefore, management decided not to repeat this disclosure in this interim accounting information.
(A free translation of the original in Portuguese)
56
24 Segment reporting
Usiminas has four reportable operating segments, which offer different products and services and are managed separately. These segments are determined based on different legal entities and there are no different segments within the same company. The following summary describes the main operations of each of the reportable segments of Usiminas: Reportable segments Operations
Mining and logistics
Extraction and processing of iron ore as pellet feed, sinter feed and granulated iron ore. Storage, handling, transport of cargo and operation of highway and railway cargo terminals. The sales of iron ore are mainly intended for the steel segment.
Steelworks Manufacture and sale of steel products. A portion of the sales is for the steel transformation and capital goods segments.
Steel transformation Transformation and distribution of steel products.
Capital goods Manufacture of equipment and installations for several industries.
Management reviews the internal managerial reports for each segment periodically.
(A free translation of the original in Portuguese)
57
Information on operating income (loss), assets and liabilities by reportable segment
9/30/2018
Mining and
logistics Steelworks Steel
transformation Capital goods Subtotal
Eliminations and adjustments Total
Revenue 768,726 9,367,419 2,406,800 285,898 12,828,843 (2,519,063) 10,309,780
Cost of sales (528,533) (7,733,066) (2,252,425) (268,724) (10,782,748) 2,312,185 (8,470,563)
Gross profit (loss) 240,193 1,634,353 154,375 17,174 2,046,095 (206,878) 1,839,217
Operating (expenses)/income (122,144) (581,893) (71,539) (38,294) (813,870) 7,920 (805,950)
Selling expenses (68,287) (111,902) (31,682) (8,867) (220,738) (3,413) (224,151)
General and administrative expenses (19,322) (239,256) (41,711) (26,519) (326,808) 10,107 (316,701)
Other income (expenses) (80,570) (331,892) 1,854 (2,859) (413,467) 1,140 (412,327)
Share of results of subsidiaries, jointly- controlled subsidiaries and associates 46,035 101,157 - (49) 147,143 86 147,229
Operating (loss) profit 118,049 1,052,460 82,836 (21,120) 1,232,225 (198,958) 1,033,267
Finance result 30,103 (568,945) 2,429 (2,205) (538,618) (6,125) (544,743)
Profit (loss) before income tax and social contribution 148,152 483,515 85,265 (23,325) 693,607 (205,803) 488,524
Income tax and social contribution (13,332) (94,721) (30,364) 7,707 (130,710) 69,452 (61,258)
Profit (loss) for the period 134,820 388,794 54,901 (15,618) 562,897 (135,631) 427,266
Attributable to
Controlling interests 96,499 388,794 37,815 (15,618) 507,490 (135,631) 371,859
Non-controlling interests 38,321 - 17,086 - 55,407 - 55,407
Assets 4,098,634 24,100,244 1,652,650 615,971 30,467,499 (4,369,124) 26,098,375
Total assets include:
Investments in associates (except goodwill and investment properties 428,077 21,027 - 2,484 451,588 - 451,588 Additions to non-current assets (except financial instruments and deferred tax assets) 24,396 217,928 83,561 7,539 333,424 (1,135) 332,289
Current and non-current liabilities 480,637 9,919,683 522,699 184,342 11,107,361 (523,431) 10,583,930

(A free translation of the original in Portuguese)
58
9/30/2017
Mining and
logistics Steelworks Steel
transformation Capital goods Subtotal
Eliminations and adjustments Total
Revenue 318,890 7,219,276 1,830,040 236,855 9,605,061 (1,947,713) 7,657,348
Cost of sales (189,249) (6,117,678) (1,699,444) (223,783) (8,230,154) 1,793,438 (6,436,716)
Gross profit (loss) 129,641 1,101,598 130,596 13,072 1,374,907 (154,275) 1,220,632
Operating (expenses)/income 102,995 (363,697) (71,927) (59,230) (391,859) (67,516) (459,375)
Selling expenses (13,332) (119,864) (34,751) (9,329) (177,276) (3,511) (180,787)
General and administrative expenses (16,476) (224,999) (39,884) (24,064) (305,423) 9,550 (295,873)
Other income (expenses) 88,473 (148,044) 2,708 (25,793) (82,656) (2,973) (85,629)
Share of results of subsidiaries, jointly- controlled subsidiaries and associates 44,330 129,210 - (44) 173,496 (70,582) 102,914
Operating (loss) profit 232,636 737,901 58,669 (46,158) 983,048 (221,791) 761,257
Finance result 34,757 (332,392) 5,324 7,256 (285,055) (5,781) (290,836)
Profit (loss) before income tax and social contribution 267,393 405,509 63,993 (38,902) 697,993 (227,572) 470,421
Income tax and social contribution (49,250) (101,017) (19,815) 13,080 (157,002) 46,512 (110,490)
Profit (loss) for the period 218,143 304,492 44,178 (25,822) 540,991 (181,060) 359,931
Attributable to
Controlling interests 154,894 304,492 30,429 (25,822) 463,993 (181,060) 282,933
Non-controlling interests 63,249 - 13,749 - 76,998 - 76,998
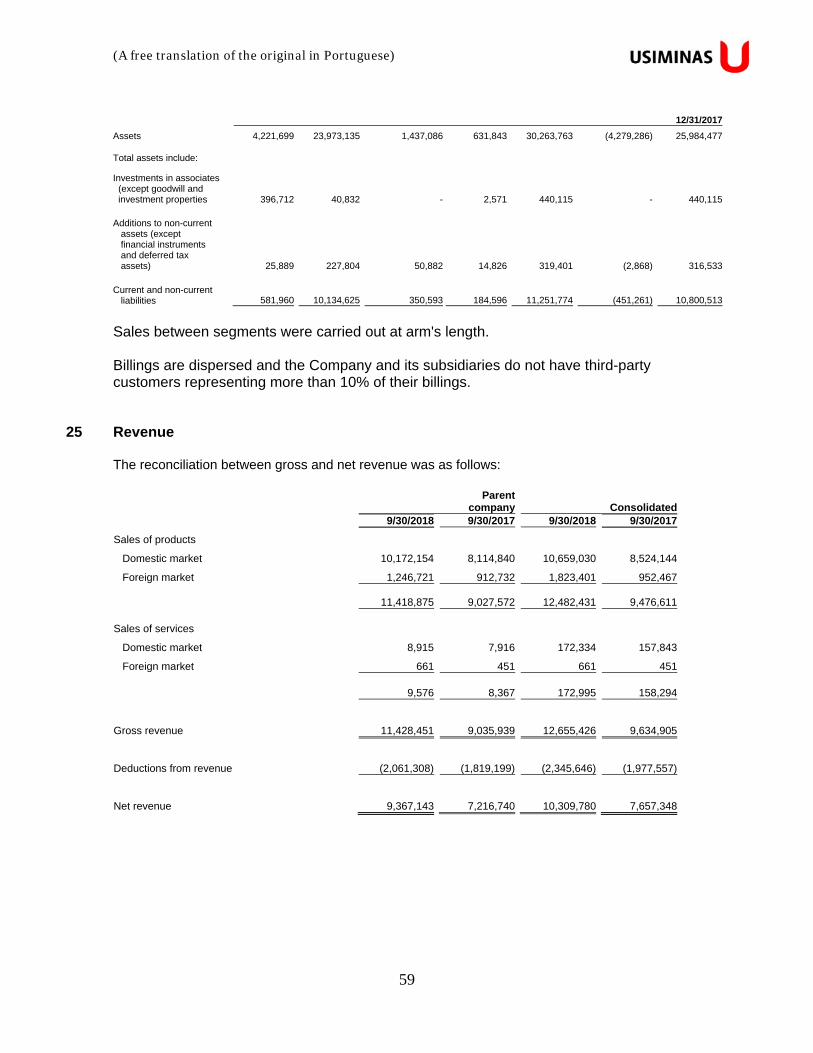
(A free translation of the original in Portuguese)
59
12/31/2017
Assets 4,221,699 23,973,135 1,437,086 631,843 30,263,763 (4,279,286) 25,984,477
Total assets include:
Investments in associates (except goodwill and investment properties 396,712 40,832 - 2,571 440,115 - 440,115 Additions to non-current assets (except financial instruments and deferred tax assets) 25,889 227,804 50,882 14,826 319,401 (2,868) 316,533
Current and non-current liabilities 581,960 10,134,625 350,593 184,596 11,251,774 (451,261) 10,800,513
Sales between segments were carried out at arm's length. Billings are dispersed and the Company and its subsidiaries do not have third-party customers representing more than 10% of their billings.
25 Revenue
The reconciliation between gross and net revenue was as follows:
Parent
company Consolidated 9/30/2018 9/30/2017 9/30/2018 9/30/2017
Sales of products
Domestic market 10,172,154 8,114,840 10,659,030 8,524,144
Foreign market 1,246,721 912,732 1,823,401 952,467
11,418,875 9,027,572 12,482,431 9,476,611
Sales of services
Domestic market 8,915 7,916 172,334 157,843
Foreign market 661 451 661 451
9,576 8,367 172,995 158,294
Gross revenue 11,428,451 9,035,939 12,655,426 9,634,905
Deductions from revenue (2,061,308) (1,819,199) (2,345,646) (1,977,557)
Net revenue 9,367,143 7,216,740 10,309,780 7,657,348
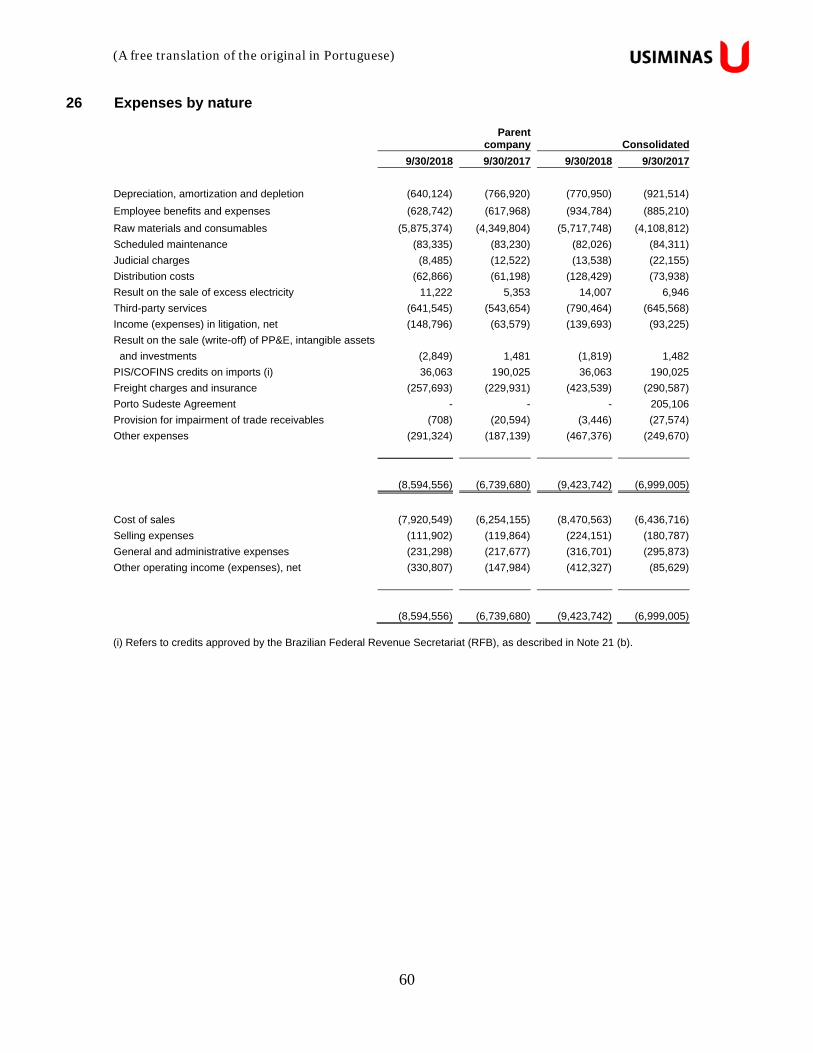
(A free translation of the original in Portuguese)
60
26 Expenses by nature
Parent
company Consolidated
9/30/2018 9/30/2017 9/30/2018 9/30/2017
Depreciation, amortization and depletion (640,124) (766,920) (770,950) (921,514)
Employee benefits and expenses (628,742) (617,968) (934,784) (885,210)
Raw materials and consumables (5,875,374) (4,349,804) (5,717,748) (4,108,812)
Scheduled maintenance (83,335) (83,230) (82,026) (84,311)
Judicial charges (8,485) (12,522) (13,538) (22,155)
Distribution costs (62,866) (61,198) (128,429) (73,938)
Result on the sale of excess electricity 11,222 5,353 14,007 6,946
Third-party services (641,545) (543,654) (790,464) (645,568)
Income (expenses) in litigation, net (148,796) (63,579) (139,693) (93,225)
Result on the sale (write-off) of PP&E, intangible assets
and investments (2,849) 1,481 (1,819) 1,482
PIS/COFINS credits on imports (i) 36,063 190,025 36,063 190,025
Freight charges and insurance (257,693) (229,931) (423,539) (290,587)
Porto Sudeste Agreement - - - 205,106
Provision for impairment of trade receivables (708) (20,594) (3,446) (27,574)
Other expenses (291,324) (187,139) (467,376) (249,670)
(8,594,556) (6,739,680) (9,423,742) (6,999,005)
Cost of sales (7,920,549) (6,254,155) (8,470,563) (6,436,716)
Selling expenses (111,902) (119,864) (224,151) (180,787)
General and administrative expenses (231,298) (217,677) (316,701) (295,873)
Other operating income (expenses), net (330,807) (147,984) (412,327) (85,629)
(8,594,556) (6,739,680) (9,423,742) (6,999,005) (i) Refers to credits approved by the Brazilian Federal Revenue Secretariat (RFB), as described in Note 21 (b).
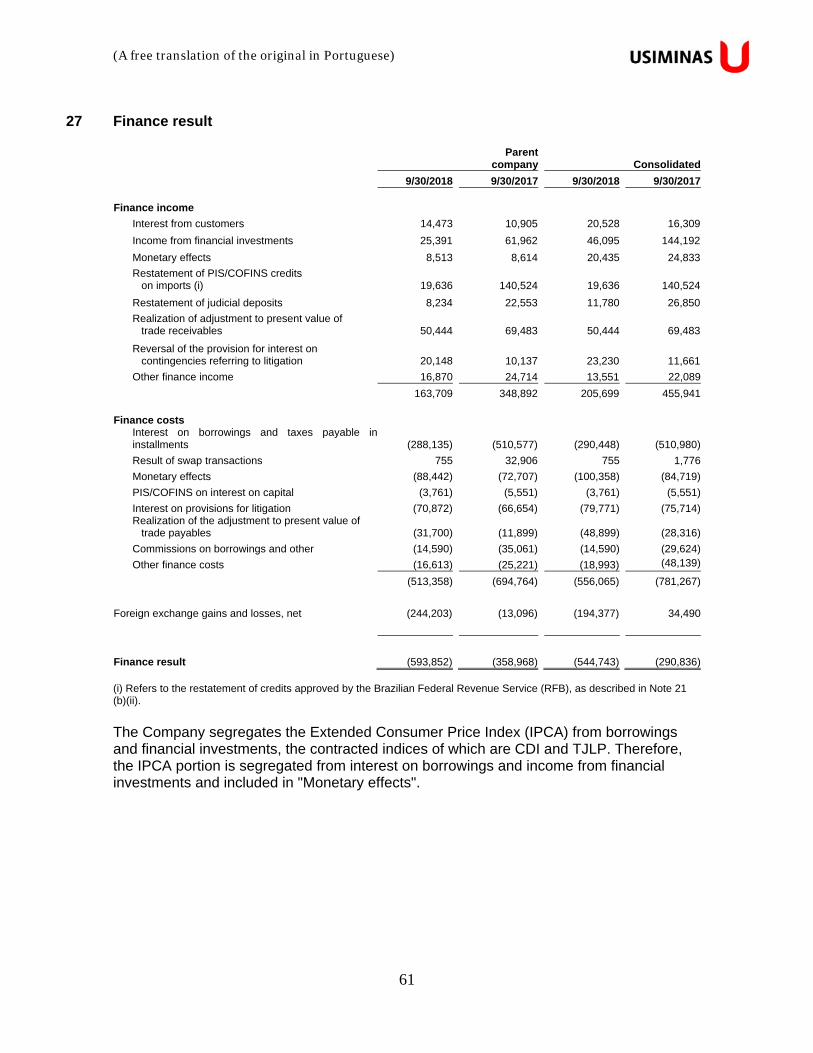
(A free translation of the original in Portuguese)
61
27 Finance result
Parent
company Consolidated
9/30/2018 9/30/2017 9/30/2018 9/30/2017
Finance income
Interest from customers 14,473 10,905 20,528 16,309
Income from financial investments 25,391 61,962 46,095 144,192
Monetary effects 8,513 8,614 20,435 24,833
Restatement of PIS/COFINS credits on imports (i) 19,636 140,524 19,636 140,524
Restatement of judicial deposits 8,234 22,553 11,780 26,850
Realization of adjustment to present value of trade receivables 50,444 69,483 50,444 69,483
Reversal of the provision for interest on contingencies referring to litigation 20,148 10,137 23,230 11,661
Other finance income 16,870 24,714 13,551 22,089
163,709 348,892 205,699 455,941 Finance costs
Interest on borrowings and taxes payable ininstallments (288,135) (510,577) (290,448) (510,980)
Result of swap transactions 755 32,906 755 1,776
Monetary effects (88,442) (72,707) (100,358) (84,719)
PIS/COFINS on interest on capital (3,761) (5,551) (3,761) (5,551)
Interest on provisions for litigation (70,872) (66,654) (79,771) (75,714)Realization of the adjustment to present value of trade payables (31,700) (11,899) (48,899) (28,316)
Commissions on borrowings and other (14,590) (35,061) (14,590) (29,624)
Other finance costs (16,613) (25,221) (18,993) (48,139)
(513,358) (694,764) (556,065) (781,267)
Foreign exchange gains and losses, net (244,203) (13,096) (194,377) 34,490
Finance result (593,852) (358,968) (544,743) (290,836) (i) Refers to the restatement of credits approved by the Brazilian Federal Revenue Service (RFB), as described in Note 21 (b)(ii).
The Company segregates the Extended Consumer Price Index (IPCA) from borrowings and financial investments, the contracted indices of which are CDI and TJLP. Therefore, the IPCA portion is segregated from interest on borrowings and income from financial investments and included in "Monetary effects".

(A free translation of the original in Portuguese)
62
28 Earnings (loss) per share
Basic and diluted Basic and diluted earnings (loss) per share are calculated by dividing the profit (loss) attributable to the Company’s stockholders by the weighted average number of common and preferred shares issued during the year excluding common shares acquired by the Company and held in treasury (Note 23). The Company does not have debt convertible into shares. The stock option plan does not include potential common or preferred shares for dilution purposes (Note 31).
Parent company
9/30/2018 9/30/2017
Common
sharesPreferred
shares TotalCommon
shares Preferred
shares Total
Basic and diluted numerator Profit available to owners of the parent 203,843 168,016 371,859 155,423 127,510 282,933
Basic and diluted denominator Weighted average number of shares, excluding treasury shares 702,734,028 526,009,649 1,228,743,677 702,734,028 524,112,696 1,226,846,724
Basic and diluted earnings per share - R$ 0.29 0.32 0.22 0.24
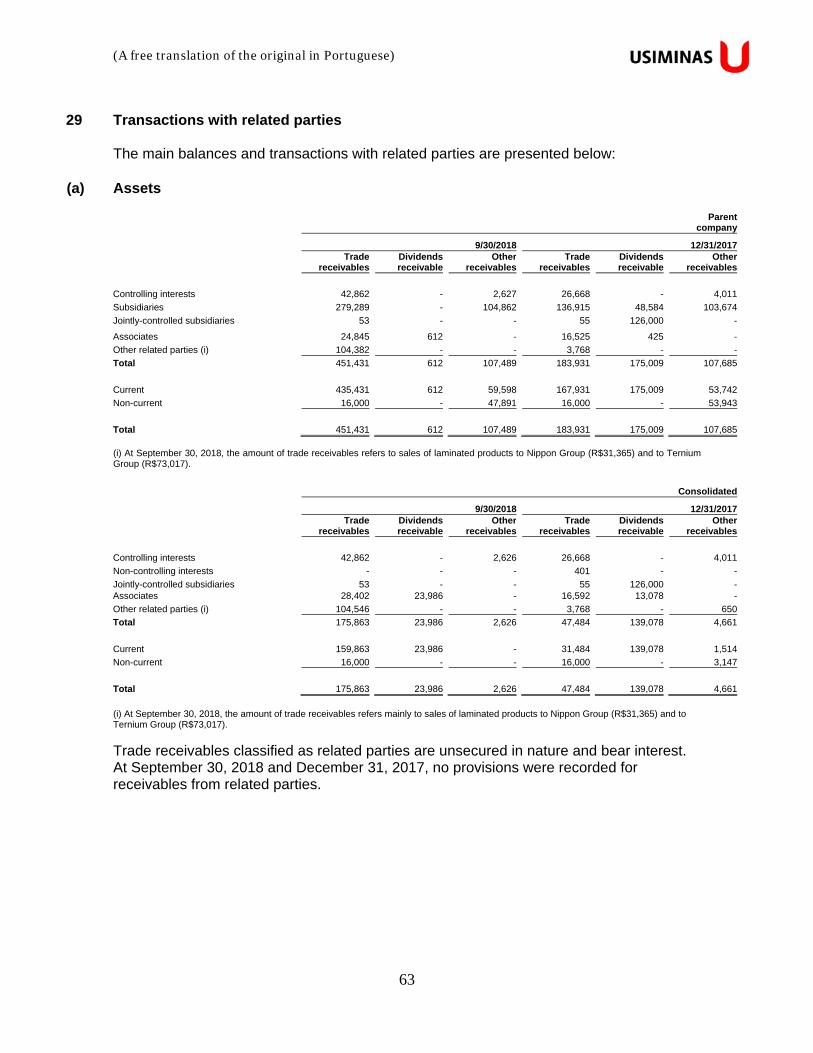
(A free translation of the original in Portuguese)
63
29 Transactions with related parties The main balances and transactions with related parties are presented below:
(a) Assets
Parent company
9/30/2018 12/31/2017
Trade
receivables Dividends receivable
Other receivables
Trade receivables
Dividends receivable
Other receivables
Controlling interests 42,862 - 2,627 26,668 - 4,011
Subsidiaries 279,289 - 104,862 136,915 48,584 103,674
Jointly-controlled subsidiaries 53 - - 55 126,000 -
Associates 24,845 612 - 16,525 425 -
Other related parties (i) 104,382 - - 3,768 - -
Total 451,431 612 107,489 183,931 175,009 107,685
Current 435,431 612 59,598 167,931 175,009 53,742
Non-current 16,000 - 47,891 16,000 - 53,943
Total 451,431 612 107,489 183,931 175,009 107,685 (i) At September 30, 2018, the amount of trade receivables refers to sales of laminated products to Nippon Group (R$31,365) and to Ternium Group (R$73,017).
Consolidated
9/30/2018 12/31/2017
Trade
receivables Dividends receivable
Other receivables
Trade receivables
Dividends receivable
Other receivables
Controlling interests 42,862 - 2,626 26,668 - 4,011
Non-controlling interests - - - 401 - -
Jointly-controlled subsidiaries 53 - - 55 126,000 -Associates 28,402 23,986 - 16,592 13,078 -
Other related parties (i) 104,546 - - 3,768 - 650
Total 175,863 23,986 2,626 47,484 139,078 4,661
Current 159,863 23,986 - 31,484 139,078 1,514
Non-current 16,000 - - 16,000 - 3,147
Total 175,863 23,986 2,626 47,484 139,078 4,661
(i) At September 30, 2018, the amount of trade receivables refers mainly to sales of laminated products to Nippon Group (R$31,365) and to Ternium Group (R$73,017).
Trade receivables classified as related parties are unsecured in nature and bear interest. At September 30, 2018 and December 31, 2017, no provisions were recorded for receivables from related parties.
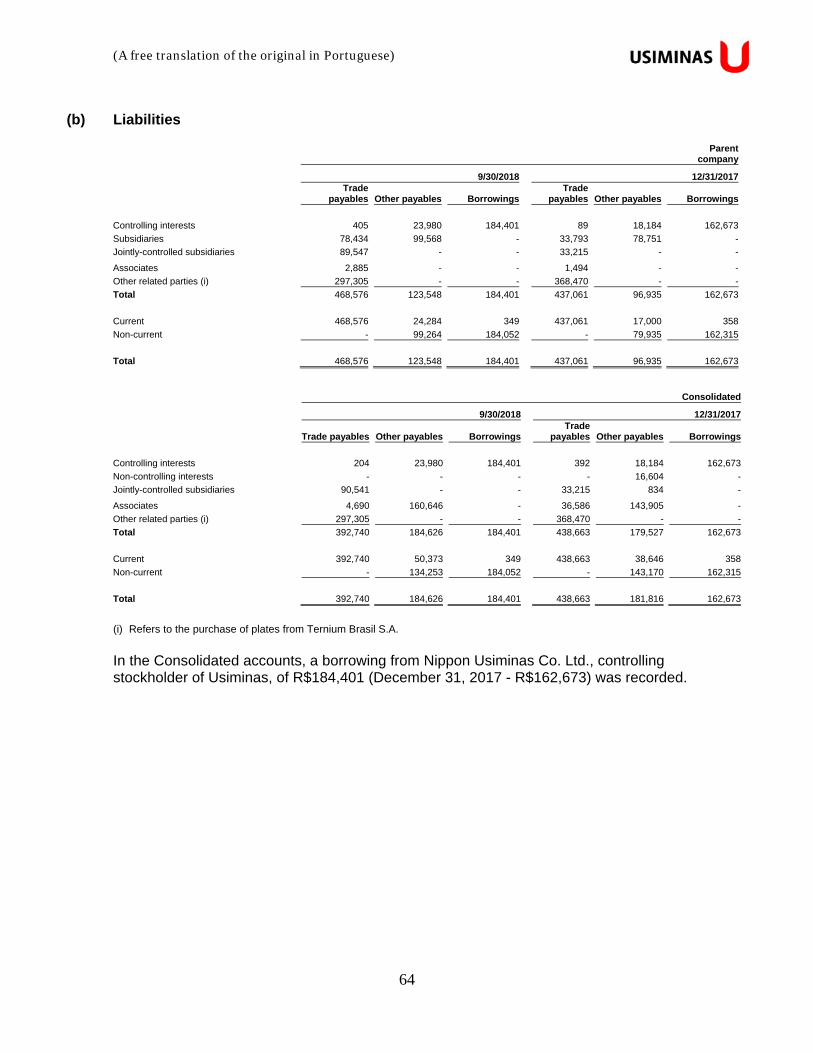
(A free translation of the original in Portuguese)
64
(b) Liabilities
Parent company
9/30/2018 12/31/2017
Trade
payables Other payables BorrowingsTrade
payables Other payables Borrowings
Controlling interests 405 23,980 184,401 89 18,184 162,673
Subsidiaries 78,434 99,568 - 33,793 78,751 -
Jointly-controlled subsidiaries 89,547 - - 33,215 - -
Associates 2,885 - - 1,494 - -
Other related parties (i) 297,305 - - 368,470 - -
Total 468,576 123,548 184,401 437,061 96,935 162,673
Current 468,576 24,284 349 437,061 17,000 358
Non-current - 99,264 184,052 - 79,935 162,315
Total 468,576 123,548 184,401 437,061 96,935 162,673
Consolidated
9/30/2018 12/31/2017
Trade payables Other payables Borrowings
Trade payables Other payables Borrowings
Controlling interests 204 23,980 184,401 392 18,184 162,673
Non-controlling interests - - - - 16,604 -
Jointly-controlled subsidiaries 90,541 - - 33,215 834 -
Associates 4,690 160,646 - 36,586 143,905 -
Other related parties (i) 297,305 - - 368,470 - -
Total 392,740 184,626 184,401 438,663 179,527 162,673
Current 392,740 50,373 349 438,663 38,646 358
Non-current - 134,253 184,052 - 143,170 162,315
Total 392,740 184,626 184,401 438,663 181,816 162,673
(i) Refers to the purchase of plates from Ternium Brasil S.A.
In the Consolidated accounts, a borrowing from Nippon Usiminas Co. Ltd., controlling stockholder of Usiminas, of R$184,401 (December 31, 2017 - R$162,673) was recorded.
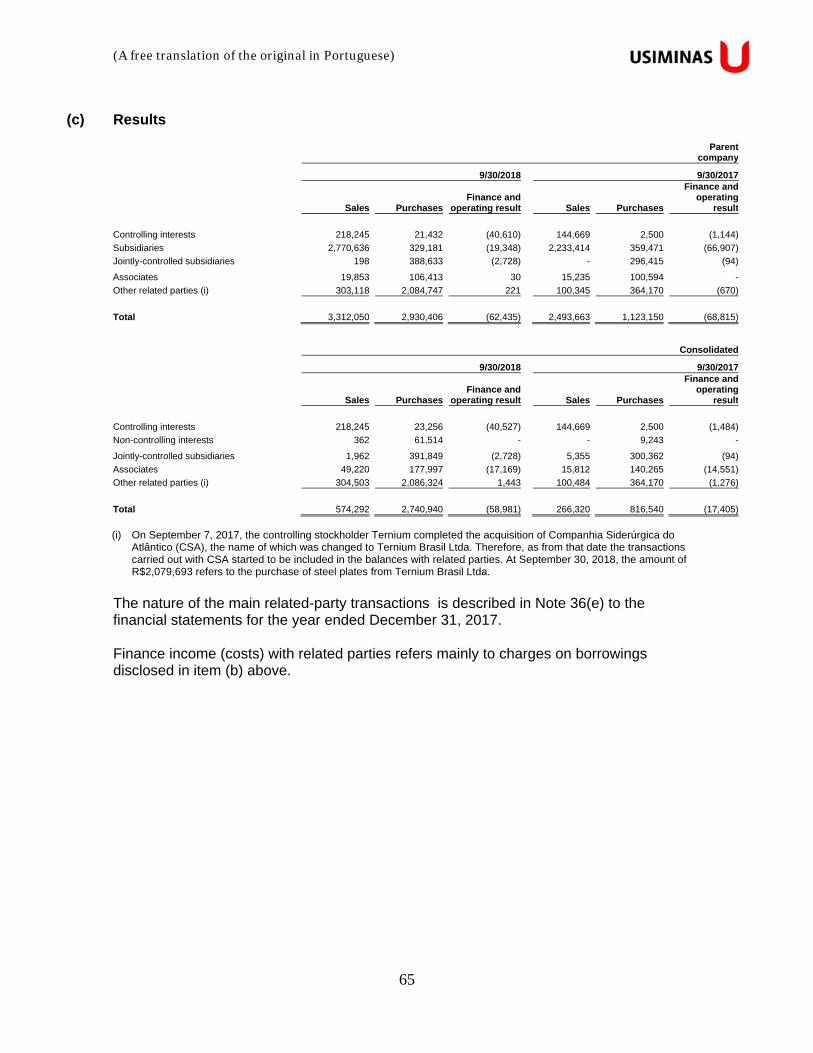
(A free translation of the original in Portuguese)
65
(c) Results
Parentcompany
9/30/2018 9/30/2017
Sales Purchases
Finance and operating result Sales Purchases
Finance andoperating
result
Controlling interests 218,245 21,432 (40,610) 144,669 2,500 (1,144)
Subsidiaries 2,770,636 329,181 (19,348) 2,233,414 359,471 (66,907)
Jointly-controlled subsidiaries 198 388,633 (2,728) - 296,415 (94)
Associates 19,853 106,413 30 15,235 100,594 -
Other related parties (i) 303,118 2,084,747 221 100,345 364,170 (670)
Total 3,312,050 2,930,406 (62,435) 2,493,663 1,123,150 (68,815)
Consolidated
9/30/2018 9/30/2017
Sales Purchases
Finance and operating result Sales Purchases
Finance andoperating
result
Controlling interests 218,245 23,256 (40,527) 144,669 2,500 (1,484)
Non-controlling interests 362 61,514 - - 9,243 -
Jointly-controlled subsidiaries 1,962 391,849 (2,728) 5,355 300,362 (94)
Associates 49,220 177,997 (17,169) 15,812 140,265 (14,551)
Other related parties (i) 304,503 2,086,324 1,443 100,484 364,170 (1,276)
Total 574,292 2,740,940 (58,981) 266,320 816,540 (17,405)
(i) On September 7, 2017, the controlling stockholder Ternium completed the acquisition of Companhia Siderúrgica do
Atlântico (CSA), the name of which was changed to Ternium Brasil Ltda. Therefore, as from that date the transactions carried out with CSA started to be included in the balances with related parties. At September 30, 2018, the amount of R$2,079,693 refers to the purchase of steel plates from Ternium Brasil Ltda.
The nature of the main related-party transactions is described in Note 36(e) to the financial statements for the year ended December 31, 2017. Finance income (costs) with related parties refers mainly to charges on borrowings disclosed in item (b) above.
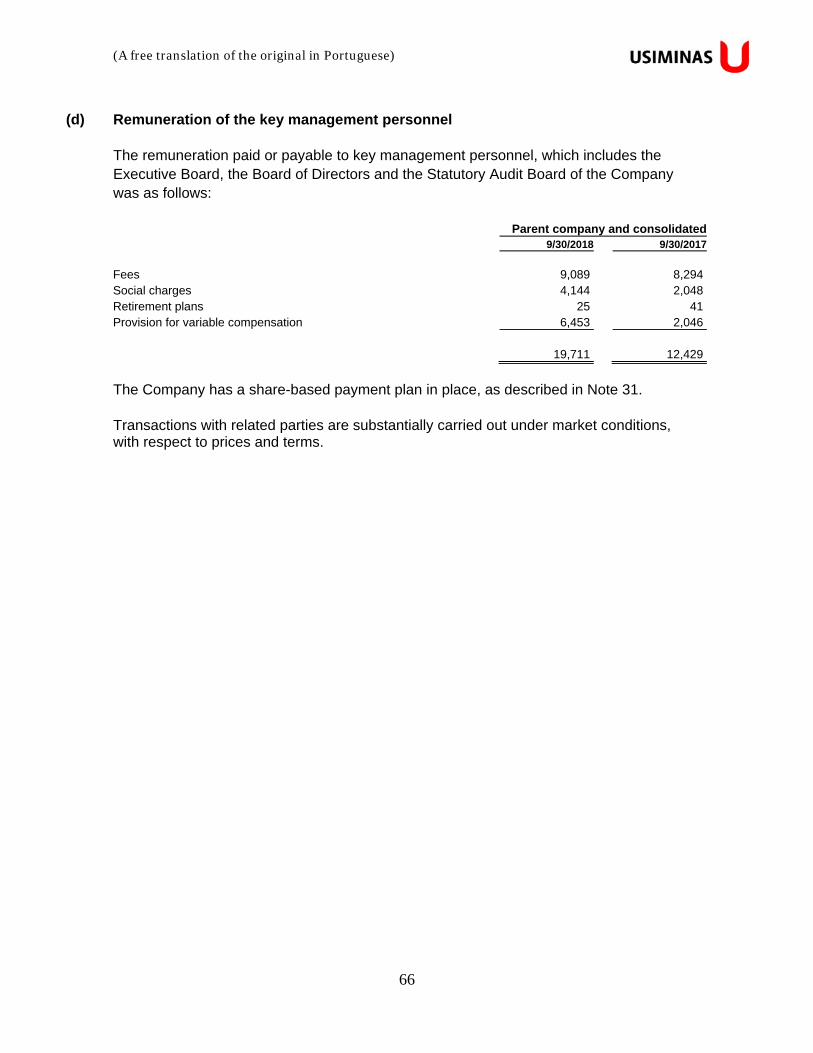
(A free translation of the original in Portuguese)
66
(d) Remuneration of the key management personnel
The remuneration paid or payable to key management personnel, which includes the Executive Board, the Board of Directors and the Statutory Audit Board of the Company was as follows: Parent company and consolidated 9/30/2018 9/30/2017 Fees 9,089 8,294Social charges 4,144 2,048Retirement plans 25 41Provision for variable compensation 6,453 2,046
19,711 12,429
The Company has a share-based payment plan in place, as described in Note 31. Transactions with related parties are substantially carried out under market conditions, with respect to prices and terms.

(A free translation of the original in Portuguese)
67
30 Insurance cover
The insurance policies taken out by the Company and certain of its subsidiaries provide cover considered sufficient by management. At September 30, 2018, these policies covered buildings, products and raw materials, equipment, machinery, furniture, objects, fixtures and installations at the insured establishments and respective facilities of the Company, Usiminas Mecânica, Unigal and Usiroll, with value at risk of US$12,002,992 thousand, an "All Risks" policy with a maximum indemnity of US$600,000 thousand per claim. At September 30, 2018, the deductible amount for material damages was US$7,500 thousand and the coverage for loss of profits (loss of revenues) had a deductible term of 30 days (waiting period). This insurance policy expires on December 30, 2018. On August 10, 2018, an explosion took place at one of the four gasometers of the Ipatinga plant. This gasometer has a nominal capacity to store up to 150,000 m³ (not reviewed) of gases generated in the steelmaking process and assists in the supply of energy to several areas. The effects of this accident, calculated since the date of its occurrence, were recorded in the interim financial information at September 30, 2018 and are detailed below: (i) write-off of the net book value of the gasometer in the amount of R$ 3,571 of property, plant and equipment, with a corresponding entry in other operating expenses (Note 26); (ii) emergency repair expenses, in the amount of R$ 1,795, recorded in other operating expenses (Note 26); and (iii) additional production costs due to the higher consumption of natural gas, fuel oil and electricity. Up to September 30, 2018, these additional costs totaled R$ 47,340, and the related impact on the Company's results will occur according to the regular allocation of the costs of sales. As a result of this accident, the Company immediately contacted the insurance companies involved for the coverage contracted for the mentioned equipment. The additional production costs mentioned in item (iii) are covered by a loss of profits insurance policy, according to the deductible limit. The loss of profits insurance coverage for this equipment starts after a twenty one day deductible period. Therefore, before the replacement of the equipment and before it t is back to normal operations, the Company will continue to record on a monthly basis the estimated additional production costs, which are covered by the loss of profits insurance policy, within other operating income. The amounts calculated by the Company related to these additional production costs will be assessed by its own and the insurance companies’ experts.
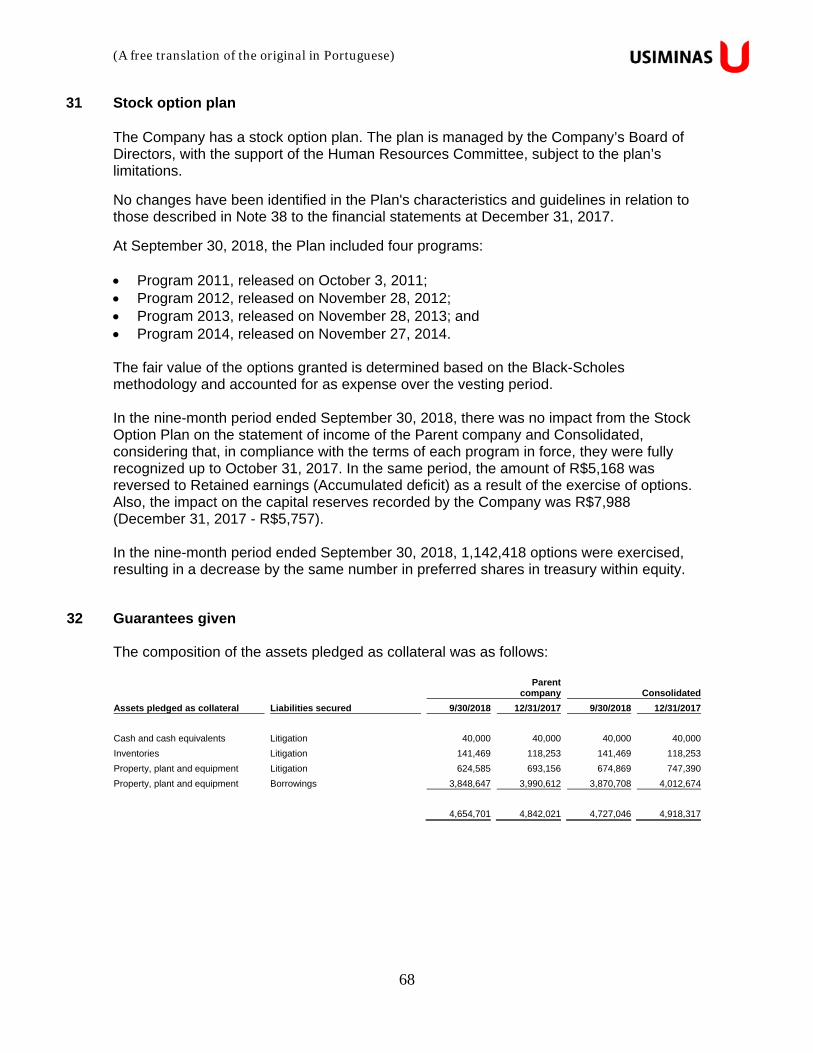
(A free translation of the original in Portuguese)
68
31 Stock option plan The Company has a stock option plan. The plan is managed by the Company’s Board of Directors, with the support of the Human Resources Committee, subject to the plan’s limitations. No changes have been identified in the Plan's characteristics and guidelines in relation to those described in Note 38 to the financial statements at December 31, 2017.
At September 30, 2018, the Plan included four programs: Program 2011, released on October 3, 2011; Program 2012, released on November 28, 2012; Program 2013, released on November 28, 2013; and Program 2014, released on November 27, 2014. The fair value of the options granted is determined based on the Black-Scholes methodology and accounted for as expense over the vesting period. In the nine-month period ended September 30, 2018, there was no impact from the Stock Option Plan on the statement of income of the Parent company and Consolidated, considering that, in compliance with the terms of each program in force, they were fully recognized up to October 31, 2017. In the same period, the amount of R$5,168 was reversed to Retained earnings (Accumulated deficit) as a result of the exercise of options. Also, the impact on the capital reserves recorded by the Company was R$7,988 (December 31, 2017 - R$5,757). In the nine-month period ended September 30, 2018, 1,142,418 options were exercised, resulting in a decrease by the same number in preferred shares in treasury within equity.
32 Guarantees given The composition of the assets pledged as collateral was as follows:
Parent
company Consolidated
Assets pledged as collateral Liabilities secured 9/30/2018 12/31/2017 9/30/2018 12/31/2017
Cash and cash equivalents Litigation 40,000 40,000 40,000 40,000
Inventories Litigation 141,469 118,253 141,469 118,253
Property, plant and equipment Litigation 624,585 693,156 674,869 747,390
Property, plant and equipment Borrowings 3,848,647 3,990,612 3,870,708 4,012,674
4,654,701 4,842,021 4,727,046 4,918,317
(A free translation of the original in Portuguese)
69
33 Explanatory notes presented in the annual financial statements that are not
presented in this interim accounting information Pursuant to CVM/SNC/SEP Circular Letter No. 003/2011, the Company disclosed Notes considered material within the context of CPC 00 - “Conceptual Framework for Financial Reporting”. All information the omission or misstatement of which could influence the economic decisions of users was properly disclosed in this interim accounting information, which should be read together with the financial statements for the year ended December 31, 2017. The Notes whose information was not repeated in this interim accounting information, considering that no significant changes were made to the nature and conditions of these Notes in relation to those disclosed in the Company’s financial statements for the year ended December 31, 2017 are listed below: Note 04 - Significant accounting judgments, estimates and assumptions; Note 19 - Trade payables, contractors and freight charges; Note 25 - Provision for environmental recovery; Note 31 - Employee benefits and expenses; Note 32 - Operating (expenses) income; Note 35 - Commitments; and Note 40 - Non-cash investment transactions.
(A free translation of the original in Portuguese)
70
Board of Directors
Ruy Roberto Hirschheimer Chairman
Antonio Mendes Board Member
Elias de Matos Brito Board Member
Kazuhiro Egawa Board Member
Luiz Carlos de Miranda Faria (i) Board Member
Oscar Montero Martinez
Board Member Rita Rebelo Horta de Assis Fonseca
Board Member
Ronald Seckelmann Board Member
Statutory Audit Board
Wanderley Rezende de Souza Board Member
Aloisio Macário Ferreira de Souza
Board Member Lúcio de Lima Pires
Board Member
Paulo Frank Coelho da Rocha Board Member
Paulo Roberto Batista Machado Board Member
Executive Board
Sérgio Leite de Andrade CEO
Alberto Akikazu Ono
Vice-President - Finance and Investor Relations
Kohei Kimura Vice-President - Technology and Quality
Miguel Angel Homes Camejo Vice-President - Commercial Area
Takahiro Mori Vice-President - Corporate Planning
Túlio César do Couto Chipoletti Vice-President - Industrial Area
Lucas Marinho Sizenando Silva Accountant CRC-MG 080.788/O
(i) Due to the decision for anticipation of the effects of the relief, granted on July 23rd, 2018 by the judge of the 3rd Labor Court of Coronel Fabriciano - MG, Mr, Luiz Carlos de Miranda Faria is, at the date of the release of the present quarterly information, forced to abstain from exercising every and all functions directly or indirectly related to the position of representative of the workers in the Board of Directors of the Company.