usgs dds-43, hydrology and water resources
TRANSCRIPT

855
Sierra Nevada Ecosystem Project: Final report to Congress, vol. II, Assessments and scientific basis for management options. Davis: University of California, Centers forWater and Wildland Resources, 1996.
ABSTRACT
Water is a critical component of the resource issues and conflicts of
the Sierra Nevada. Almost every environmental dispute in the range
involves water as principal or secondary concern. Most human ac-
tivities have some potential to influence the quantity, distribution, or
quality of water.
Rivers of the Sierra Nevada appear to have shown remarkable
resiliency in recovering from the gold mining era; however, so few
channels were left untouched by historic disturbances that reference
streams in a completely natural state may not exist for comparison.
Water management structures developed concurrently with hydrau-
lic mining and have since come to dominate the flows of water from
the Sierra Nevada. Few river systems in the range have natural flow
regimes over much of their length. In most river basins, this active
management of the water itself affects the annual water balance,
temporal distribution, flood hydrology, minimum flows, and water qual-
ity much more than any human disturbance of the landscape. Ironi-
cally, the primary benefits to society of water from the Sierra Nevada
cause the primary impacts. By trying to serve the so-called highest
beneficial uses, domestic water supply and production of food and
power, we have caused the greatest impacts.
Watershed disturbance in the form of mining, road building, log-
ging, grazing, fire, residential development, and other uses has al-
tered vegetation and soil properties in particular areas. Where these
disturbances have altered a large fraction of a watershed, including
areas near stream channels, flows of water and sediment may be
changed significantly. Nevertheless, major changes in hydrologic pro-
cesses resulting from watershed disturbance have been noticed in
only a few streams. More extensive changes are suspected, but they
have not been detected because of the minimal monitoring network
that is in place. Proposed programs for reducing the amounts of fuels
in forests have potential for significant aquatic impacts; however, cata-
strophic wildfire carries far greater risks of grave damage to aquatic
systems.
30
Hydrology andWater Resources
RICHARD KATTELMANNUniversity of California Sierra Nevada
Aquatic Research LaboratoryMammoth Lakes, California
I N T RO D U C T I O NWater, in all its forms, is indeed the crowning gloryof the Sierra. Whether in motion or at rest, the wa-ters of the Sierra are a constant joy to the beholder.Above all, they are the Sierra’s greatest contributionto human welfare.
Farquhar 1965, 1
Water is central to the resource issues and conflicts of the Si-erra Nevada. Changes in water availability, stream-flow quan-tity and timing, flooding, quality of surface and ground water,aquatic and riparian habitat, soil erosion, and sedimentationhave occurred throughout the range as results of land distur-bance and resource management (Kattelmann and Dozier1991). However, the magnitude of such changes, their rela-tive importance, and the ability of natural and human com-munities to adapt to or recover from alterations in hydrologicprocesses in the Sierra Nevada are largely unknown. Con-cern about degradation of water quality is widespread inpublic reaction to past and proposed resource managementactivities. Californians need to know whether their primarywater source, the Sierra Nevada, is functioning well in gen-eral and what problems need attention.
The Sierra Nevada generates about 25 km3 (20 million acre-feet [AF]) of runoff each year out of a total for California ofabout 88 km3 (71 million AF) or about 28% (Kahrl 1978; Cali-fornia Department of Water Resources 1994). This runoff ac-counts for an even larger proportion of the developed waterresources and is critical to the state’s economy. The rivers ofthe Sierra Nevada supply most water used by California’scities, agriculture, industry, and hydroelectric facilities. Thestorage and conveyance systems developed to utilize thewater resources of the Sierra Nevada are perhaps the most

856VOLUME I I , CHAPTER 30
extensive hydrotechnical network in the world. Major watersupply systems have tapped the Tuolumne River for San Fran-cisco, the Mokelumne River for Alameda and Contra CostaCounties, eastern Sierra streams for Los Angeles, and theFeather River for the San Joaquin valley and other parts ofsouthern California. Irrigated agriculture throughout Califor-nia consumes more than the annual runoff of the Sierra Ne-vada and accounts for more than 90% of consumptive use inthe state (U.S. Geological Survey 1984; California Departmentof Water Resources 1994). More than 150 powerhouses on Si-erra Nevada rivers produce about 24 million megawatt-hoursof electricity per year (see Stewart 1996). Operations of mostof the water projects are quite sensitive to fluctuations in cli-mate over periods of a few years. Sierra Nevada rivers sup-port extensive aquatic and riparian communities and maintainthe Sacramento–San Joaquin Delta estuary ecosystems (seeJennings 1996; Moyle 1996; Moyle and Randall 1966; Moyleet al. 1996; Erman 1996).
Perhaps the most common perception of water from theSierra Nevada is no perception at all, merely benign igno-rance. For many, water is something that appears at thekitchen faucet, showerhead, garden hose, or is a choice amongbottled beverages. Water rarely makes the general news ex-cept in times of serious shortage or excess. Agricultural andurban communities of the Central Valley that are dependenton water from Sierra Nevada rivers probably have the great-est direct interest in water issues, but they are chiefly con-cerned about the amount delivered and how fisheries policiesmight affect those deliveries. Most residents of the SierraNevada are probably knowledgeable and concerned aboutlocal water supplies and ground water but are not known toharbor any common misperceptions about the local resource,just a shared hope that there always will be enough wateravailable. People in cities benefiting from water supplies ex-ported from the Sierra Nevada are concerned about quantityand quality of water at the tap, but many are unsure aboutthe source of their water. Visitors to the Sierra Nevada areusually concerned about the aesthetic qualities of water thatthey see. Environmentally conscious segments of the publicmay believe the water resources of the Sierra Nevada are sub-stantially degraded. Serious water problems in parts of theSierra Nevada and throughout the country may be extrapo-lated and perceived as occurring throughout the Sierra Ne-vada. For example, if poor logging practices in the PacificNorthwest are initiating landslides and ruining fish habitat,then some people may assume the same things are happen-ing within the Sierra Nevada. Water issues highlighted inpopular books (e.g., Reisner 1986; Postel 1992; Doppelt et al.1993; Palmer 1994) are often assumed to apply to the SierraNevada but may not be of similar severity.
Water flowing from the Sierra Nevada has far-reaching ef-fects. On the western slope, runoff naturally flowed throughthe Central Valley of California and San Francisco Bay to thePacific Ocean or, in the south, contributed to Tulare and BuenaVista Lakes. On the eastern slope, streams flowed toward the
terminal lakes of the western Great Basin. In all cases, thewaters of the Sierra Nevada enriched the lands through whichthey flowed. In the past century, the fluid wealth of the moun-tains has been extended well beyond natural hydrographicboundaries through engineering projects to distant agricul-tural and urban areas. Electricity generated from falling wa-ter in the Sierra Nevada and distributed through the westernpower grid affects distant communities. Crops grown withand containing water precipitated over the Sierra Nevada aresold around the world. The recreational and aesthetic quali-ties of Sierran rivers and lakes attract visitors from through-out the United States and the world. Artwork portraying waterin the Sierra Nevada is found around the globe; for example,a watercolor mural in traditional Chinese style of waterfallsin Yosemite Valley hangs in the Taipei airport as an exampleof Chinese scenery.
Water has played a critical role in Euro-American affairs inthe Sierra Nevada since the discovery of gold in a channelleading to a water-powered sawmill in 1848. Water was es-sential to large-scale gold mining and processing. Water de-velopment for mining led to one of the nation’s earliest majordecisions in environmental law (that halted hydraulic min-ing) and to our intricate network of hydrotechnical structuresthat transfer water from the Sierra Nevada to farms, cities,and powerhouses. Conflicts over water from the Sierra Ne-vada are likely to be a continuing part of the California scene.Water is simply too valuable to society and all forms of life tobe anything but a high priority for resource policies and man-agement. Water eventually emerges in almost all environmen-tal disputes, even when the debate starts on some otherdistinct issue. All parties to the dispute can usually agree thatwater is an influence on or is influenced by the original issue.Water is tied to all other issues considered by SNEP, with somelinks more obvious than others, but it is literally an integralcomponent of the ecosystem approach.
G E N E R A L S TAT E O FK N OW L E D G E
Despite the importance of water to California, there have beenremarkably few integrative studies of water resources in thestate or the Sierra Nevada. State agencies have issued reportsabout statewide water matters for more than a century (e.g.,Hall 1881; Conservation Commission 1913; California Depart-ment of Public Works 1923). The first California Water Planwas released by the Department of Water Resources in 1957.Originally a description of proposed water projects, updatesto the California Water Plan have evolved into a more thor-ough evaluation of water supply, demand, and management(e.g., California Department of Water Resources 1994). Com-prehensive descriptions of water in the state appear in booksby Harding (1960), Seckler (1971), and the Governor’s Office

857Hydrology and Water Resources
of Planning and Research (Kahrl 1978). The history of waterdevelopment in California is treated by Hundley (1992). Thecondition of California’s rivers is assessed by the CaliforniaState Lands Commission (1993). Possible scenarios of the fu-ture of water resources in California have been developed bythe California Department of Water Resources (1994) and thePacific Institute (Gleick et al. 1995). Although all these booksdeal with the Sierra Nevada as a critical part of the Californiawaterscape, and books devoted to the Sierra Nevada (e.g.,Peattie 1947; Lee 1962; Johnston 1970; Webster 1972; Bowen1972; Palmer 1988) at least mention water resources, a thor-ough treatment of water in the Sierra Nevada has yet to bewritten. Thousands of articles, chapters, and reports addressthe various aspects of hydrology and water resources in theSierra Nevada, but there has been little synthesis of this vastwork. The isolated, topical work provides a wealth of infor-mation about specific details but does not inform society aboutthe context of that work at the scale of the mountain range oreven of a river basin. In addition, there are serious gaps in thecollection of information about Sierra Nevada waters. Al-though knowledge is far from complete for most aspects ofthe water-resource situation, the most troubling gap is thevirtual absence of experimental research on hydrologic im-pacts of land management activities. Because of this near lackof local research, we usually had to infer the likely conse-quences of disturbance from studies done outside the SierraNevada. In addition, the state does not have a thorough de-scription of each river basin that would be adequate for envi-ronmental assessments. Comprehensive lists of environmentalproblems in each river basin do not exist. There is no consis-tent method for characterizing watersheds. Absence of con-sistent criteria for evaluating ecological conditions alongstreams or in watersheds inhibits assessment of managementconsequences or need for restoration (California State LandsCommission 1993).
O V E R A L L A P P ROAC H A N DS O U R C E S
This assessment was primarily a literature review augmentedwith the author’s experiences throughout the Sierra Nevadaover the past two decades and a few weeks of specific fieldchecking during the SNEP period. The libraries of the Uni-versity of California and the Water Resources Center Archivesat Berkeley, in particular, were critical to the effort. Offices ofthe national forests in the Sierra Nevada also provided awealth of documents. Other materials were provided by doz-ens of agencies and individuals. Newspapers were essentialsources of current information. Interviews with agency per-sonnel and private parties augmented the written word. Theprimary challenges were to compile and synthesize the di-versity of material. The quantity and quality of information
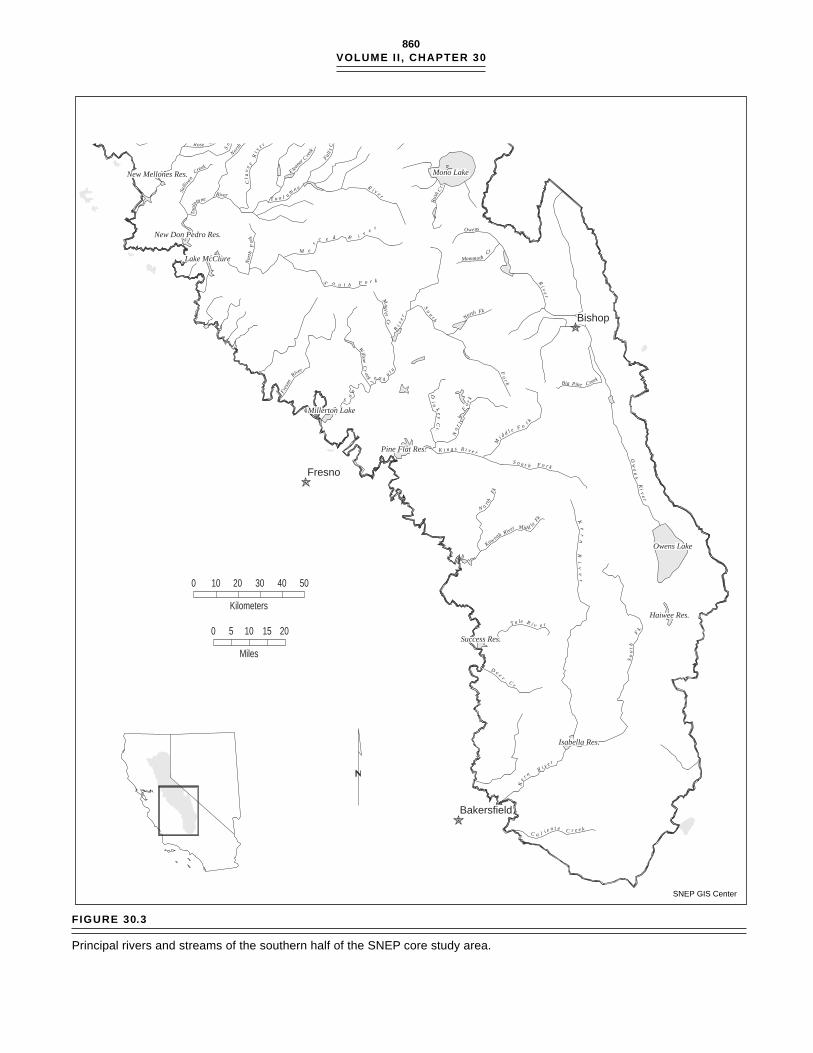
gathered varied widely between river basins throughout therange. Important sources were undoubtedly overlooked be-cause of ignorance of their existence and inability to actuallylocate all known sources. One of the critical assumptions ofthis assessment was that the reported material was indeedreliable. Multiple sources of information that were consistentprovided greater confidence in most material. Informationwas organized by resource, by impact, and geographicallyby river basin. Use of natural hydrologic areas was a centraltenet of this effort. Consideration of nested catchments fromheadwaters to large river basins provides a logical hierarchythat makes physical and ecological sense. Watersheds are be-coming a more common unit of analysis and planning. TheCalifornia Resources Agency is organizing many of its pro-grams on a watershed basis and has adopted a watersheddelineation scheme called Calwater. This system was usedin this study and by other parts of SNEP. River basinsand major streams of the study area are identified in figures30.1–30.3.
Attributes of Water
There are several attributes of water and streams that are im-pacted by management activities. The physical attributes arebriefly described in the following paragraphs (see Moyle 1996;Moyle and Randall 1996; Erman 1996; Moyle et al. 1996;Jennings 1996 for biological impacts). The present study didnot perform any systematic analyses of these attributes. Suchanalyses (within the constraints of readily available data)would not provide clear indications of the health of the hy-drologic system of the Sierra Nevada. Instead, synthesis ofexisting analyses originally performed for various other pur-poses provided the basis of this assessment.
Stream flow (or stream discharge) is the most fundamentalaspect of watershed hydrology. Stream flow will usually beaddressed in this assessment just as a concept: volume of waterpassing by a point on a stream over some period of time. For-tunately, this concept is also measured at hundreds of siteswithin the SNEP study area. However, the number of siteswith data useful to this study is much more limited, number-ing in the dozens. Most stream-flow measuring stations arelocated in association with some water management projectrather than for scientific study. Therefore, most informationis available on highly regulated streams that suggest littleabout hydrologic response to changes in the landscape otherthan the direct manipulation of water in the channel. Gaugeson unregulated (often called unimpaired) streams often haveshort or incomplete records or are sited in locations inappro-priate for any particular after-the-fact study. The number ofsuch gauges in the Sierra Nevada has decreased with time ascosts have risen. Stream gauging stations are operated by theU.S. Geological Survey, utilities, irrigation districts, and a fewother public agencies. Many of the records are published asdaily values in annual volumes by the U.S. Geological Sur-vey (USGS). Most of these records are now available on CD-

858VOLUME I I , CHAPTER 30
FIGURE 30.1
Major river basins of the SNEP core study area.

859Hydrology and Water Resources
Rivers, Streams & Lakes
0 10 20 30 40 50
Kilometers
0 5 10 15 20
Miles
P i n e C r.
Pet
esC
r.
WillowC
r. Secr e t
Cre
ek
A n t e l o pe
C r e e k
M
i l l C r e e k
Indi
anC
ree
k
Last Chanc
e CreekD
ee
r
C r e e k
Red
Cl o ver Creek
Bu
t te
Cr
ee
k
N
orth
Fork
Fea therRiv e r M iddle
Fork LongV
alleyC
r eek
Canyo
nC
reek
Y u b a R i v e r
Deer Creek
Tru
c kee
River
North Fork
Mid
dl
eF ork
R ub
i
co
nR
i v e r
Americ
anRive
r
S ilver Creek
S o u t h F o r k Up
pe
rTr
uck
eeR
iv
W e b e r C r e e k
Silv er
F
ork
No r th Fork
M i d d l e F o r k
Riv er
South F orkC osu mnesN o rth Fork
DryCr
Middle F ork
Ri v e r
S u t t e rC r e e k
No
r t h F o r kS o u t h
Fo
r kJ ackso n Cr
Calaveras RiverJes u s M aria CrM
o k e l u m n e
Fo
r k
Beave
r Creek
Gr isw
al
dCr
Ea stW
alker Riv.
M i d d l e
Rose C reek
Vir
gin
ia Cr
So
ut h
F o r k
No rth
Fork
River
Cla
ve
yR
i v
e r
Sulli
van
Creek
R i v e r
Rob
inso
nCr.
We
st
Wa
lke
r
R i v.
Rus
hC
r.
Sa n Antonio Cr
San Domingo Cr
CarsonR
iverE
ast Fk.
Car
son River W e st
Fk.
T u o l u
m n e
Tuo l
umne
Fall s
Cre
ek
Cherr
y
Creek
E leano
r C
reek
St a
ni
sl a
us
Ri v
e r
Bear
R iver
M
iddleFor
k
Be a r R
i v e r
South Yu ba River
Midd le Yuba R iver
So
ut h
Fo
r k
We
s tB
ra
nc
h
Big
Chi
coC
reek
C a mpb
ell
Cr.
Pin e
Cre
ek
North
ForkF
eathe
r
River
B u t t C r e e k
L ittl e
Grizly Creek
L ittle La s t Ch
ance
Cr.
S u s a n R i v e r
A me r i c a n R i v e r
Eagle Lake Cramer Res.
Honey LakeLake Almanor
Mtn. Meadows Res.
Lake DavisFrenchman LakeBucks Lake
Little Grass Valley Res.
Lake Oroville
Stampede Res.
Lake Tahoe
Bridgeport Res.
Camanche Res.
New Hogan Res.
Mono LakeNew Mellones Res.
Folsom Lake
South Lake Tahoe
Sacramento
Reno
SNEP GIS Center
FIGURE 30.2
Principal rivers and streams of the northern half of the SNEP core study area.
860VOLUME I I , CHAPTER 30
Southern Core Study AreaRivers, Streams & Lakes
Nt hF
o r kJ ackso n Cr
Calaveras RiverJes u s M aria CrM
o k e l u m n e
Fo
r k
Beave
r Creek
Gr isw
aldCr
Ea stW
alker Riv.
M i d d l e
Rose C reek
Virg
inia C
r
So
ut h
F o r k
North
Fork
River
Cla
ve
yR
i v
e r
Sulli
van
Creek
R i v e r
Owens
MammothCr
Nor
thF
ork
S o u t h F o r k Ri v
er
North Fk
So
ut h
Mugl
erC
r
Ri v
e r
Willow
Cr
eek
Big Pine Creek
Fo
r k
Fresn
oRiver
Di
nk
ey
C r.
No
rt
hF
o r
k
M
i d d l e F o
r k
S o u t h F o r k
Ow
en
sR
iv
e r
N o
rth
Fk
Kaw eah River Mid d le
Fk
T u le R i v e r
D e e
rC r.
So
uth
F k.
Ke
rn
Ri
ve
r
Ke r n
R i v e r
Jo a q
u i n
S
a n
Rob
inso
nCr.
We
st
Wa
lke
r
R
Rus
hC
r.
M e
r
c e d R i v e r
K i n g s R i v e r
Sa n Antonio Cr
San Domingo Cr
C a l i e n t e C r e e k
T u o l u
m n eTu
olum
ne
Fall s
Cre
ek
Cherr
y
Creek
E leano
r C
reek
St a
ni
sl a
us
Ri v
e r Bridgeport Res.
New Hogan Res.
Mono LakeNew Mellones Res.
New Don Pedro Res.
Lake McClure
Millerton Lake
Pine Flat Res.
Success Res.
Owens Lake
Haiwee Res.
Isabella Res.
Fresno
Bishop
Bakersfield
SNEP GIS Center
0 10 20 30 40 50
Kilometers
0 5 10 15 20
Miles
FIGURE 30.3
Principal rivers and streams of the southern half of the SNEP core study area.
861Hydrology and Water Resources
ROM from private firms and the USGS. The usual character-istics of stream flow that are studied are the annual volume,distribution over time (i.e., annual hydrograph), maximumflows, and minimum flows. Measurement of flows in naturalchannels is not a trivial exercise, and errors can exceed 10%to 20% of the measured value (Herschy 1985). Natural vari-ability in all aspects of stream flow can be quite high.
Sediment is the other main constituent of the fluid flowingin streams that we casually call water. Changes in sedimentremoval, transport, and deposition affect the general natureof stream channels and riparian areas and their biota, as wellas affecting human uses of water. Mineral particles erodedfrom the land surface and transported mostly by flowingwater gradually (or sometimes suddenly) move downslopefrom the mountains. These particles of various sizes are ei-ther suspended in the water or bounce along the channel asbedload. Both types of sediment move episodically as thecapacity of streams to transport sediment varies with flowvelocity. Sediment can be stored in a channel for years (oreven centuries) before conditions are right to dislodge andtransport it. Individual particles have a discontinuous jour-ney downstream, with intermittent advances of varyinglengths interrupted by temporary storage of varying dura-tion. Suspended sediment is sampled at few stations through-out the Sierra Nevada and is a marginal measure of totalsediment load. Bedload moving past a point is not routinelymeasured anywhere in the Sierra Nevada, but it has beenmeasured in special studies (e.g., Andrews and Erman 1986).Repeated surveys of the bottom topography of natural andartificial lakes and calculation of the change in volume overthe time interval is the best means of estimating total sedi-ment transport (Dunne and Leopold 1978). However, this tech-nique integrates sediment production from a large area andduration and, therefore, is difficult to associate with particu-lar land-use activities. It is also very expensive.
Most other materials that are found in flowing water con-stitute the dissolved load of streams. A variety of ions occurnaturally in streams, although the waters of the Sierra Ne-vada tend to have relatively low amounts of dissolved con-stituents compared with other rivers of the world (e.g.,California State Water Resources Control Board 1992a). Thechemical quality of streams is routinely measured at only afew gauging stations in the Sierra Nevada. There is also abiotic component of streams, ranging from viruses and bac-teria to invertebrates and fish (see Moyle 1996; Moyle et al.1996; Erman 1996).
Water temperature is another important attribute ofstreams, particularly with respect to suitable conditions foraquatic life. Some creatures can tolerate only relatively nar-row ranges in temperature at different stages in their lifecycles. The amount of dissolved oxygen also varies with tem-perature, decreasing as temperature increases. As with otherwater quality parameters, temperature is measured at only afew river gauging stations. Stream temperature varies primar-ily with stream discharge, original temperature of water in-
puts, exposure to sunlight, geothermal conditions, and tem-perature of reservoir releases.
Attributes of ground water that are of primary interest andare subject to change are the amount and quality of water instorage. Ground-water conditions in the Sierra Nevada arenot routinely monitored in the manner of stream flow. Publicutilities that pump ground water for water supply monitortheir own wells but do not systematically report their results.Most of the publicly available information about ground wa-ter in the Sierra Nevada is from a handful of special studies.
Scale
Consideration of the scale of hydrologic impacts is crucial tounderstanding how water resources are affected by distur-bance. A point of reference is necessary. Usually, some par-ticular point along a stream where measurements are madeof flow and/or quality parameters provides the geographiccontext. Impacts upstream of that point may have some mea-surable effect at the reference site. Activities in the river chan-nel itself are likely to produce the greatest noticeable impactsin the channel at the point of reference. Activities near thechannel in areas with occasional hydraulic connection to thechannel will also have direct impacts (i.e., change in water orsediment yield) in the channel under consideration. Such ar-eas may be surface-runoff contributing zones (sometimescalled variable source areas) that yield water as sheet flow ornear-surface pipe-flow in response to rainfall. At greater dis-tances from main channels or ephemeral tributaries, waterresulting from rainfall or snowmelt moves slowly downslopethrough soil or subsoil. Alteration of hillslope properties atlocations distant from the stream channel simply has lessopportunity to make a difference at the downslope and down-stream point of reference. To restate the typical effect of geo-graphic location on hydrologic impacts, a given disturbancematters less on a ridgetop than adjacent to a channel.
Cumulative Effects
One must also consider the combined or cumulative effectsof activities on attributes of water at a point of reference. Al-tering the local water balance of a small fraction of a water-shed or even adding a small quantity of pollutant to a streamusually will not result in any detectable change at some dis-tant downstream point of reference. However, altering manysmall fractions of the watershed or adding the small quantityof pollutant at many places along the stream will cause a de-tectable change downstream. Even though each individualimpact is insignificant with respect to the whole watershed,their cumulative effects may be dire. An instructive exampleof cumulative watershed effects occurs in the Lake Tahoe Ba-sin, an easily visualized hydrologic unit in which the lake isthe item of reference. Construction of roads, houses, casinos,parking lots, ski runs, septic systems, and so on initially af-fected only the immediate area of the particular development.
862VOLUME I I , CHAPTER 30
However, at some time, perhaps in the 1960s, there were somany individual disturbances that the nutrient balance of thelake was profoundly changed and algal production increased,with a consequent decrease in lake clarity (e.g., Goldman 1974and 1990). Similarly, while a small diversion from a streamfor irrigation might not be detectable at a downstream point,hundreds of small diversions can totally dry up a stream.Ground-water overdraft is typically the cumulative result ofhundreds of small extractions. Therefore, when consideringthe potential impact of some activity on water resources, onemust examine the intensity of the impact, how extensive it is(what fraction of the watershed is affected), the proximity ofthe activity to a stream channel, what other impacts in thewatershed it is adding to, and the degree of recovery frompast impacts. These questions of scale are implicitly addressedthroughout this chapter.
H I S TO RY O F I M PAC T S O NW AT E R R E S O U R C E S
Examination of past impacts to streams and rivers helps usunderstand their current condition. Impacts of Native Ameri-cans on the hydrologic system appear to have been minor,largely because of the comparatively small population in themountains and limited technology. Their deliberate use of fireas a vegetation-management tool would have been the pri-mary agent in altering local hydrology. To the extent that in-tentional fires removed vegetation, evapotranspiration wasreduced, water yields were increased, and surface erosion wasincreased. The geographical extent, intensity, and frequencyof such fires cannot be quantified. Therefore, about all we cansay concerning the hydrologic consequences of this activityis that there were some. Areas near to population centers wereprobably impacted to a greater degree than remote areas. Littleis known about water development by Native Americans.Perhaps the best documented projects occurred on Bishop andBig Pine Creeks. Starting perhaps 1,000 years ago, the Paiutebuilt dams and large irrigation canals to irrigate areas exceed-ing 5 km2 (2 mi2) in the bottomlands of the Owens Valley toenhance the growth of native vegetation (Steward 1934;Lawton et al. 1976). More modest water impoundments anddiversions were built in the Tahoe basin by the Washoe(Lindstrom 1994).
The discovery of gold in 1848 had swift and dramatic con-sequences for streams and rivers of the Sierra Nevada. Streamswere dammed, diverted, dewatered, excavated, polluted, andfilled with debris from enormous hydraulic mines. Removalof trees over large areas for flumes, mine timbers, buildings,and fuel resulted in soil loss, augmentation of downstreamsedimentation, and major changes in vegetative cover. Goldmining also led to many innovations in water institutions andengineering. Miners established the principle of priority in
determining water rights just as in mining claims. The resul-tant doctrine of prior appropriation has far-reaching effectsin the allocation of water resources throughout the westernUnited States. Acquisition of water for hydraulic mines de-veloped engineering technology and physical works that havehad lasting impacts on California’s water distribution system.Generation of power for mines and mills led to one of theworld’s most extensive hydroelectric networks.
Initially, miners worked as individuals on small claims withsimple implements. Shallow gravels were excavated andwashed with water in pans, rockers, long toms, and othercrude devices (Silva 1986). Virtually all streams on the cen-tral western slope of the Sierra Nevada were prospected(Averill 1946; Clark 1970). Although the depth of disturbancewas limited, these excavations destabilized channel beds andbanks and devastated riparian vegetation over a vast area.As the surface gravels were exhausted, more intensive meth-ods required cooperation and consolidation of the miners.Flumes were constructed to carry the summer flows of streamsso that beds could be blasted and excavated. Small dams werebuilt so that several hours of discharge could be stored andreleased suddenly to disaggregate the gravels hydraulicallyand carry away lower-density sediments in a practice knownas booming or gouging. Diversions and flumes were also builtto supply water to off-channel claims for separating gold andfor ground sluicing where diverted water was used to erodeancient stream deposits (Averill 1946). Natural channels wereoften totally dewatered to supply maximum flow in an artifi-cial waterway (Pagenhart 1969).
The erosive power of water was marshaled to great effec-tiveness by containing water within pipes and hoses underhigh pressure and then directing it at hillslopes composed ofgold-bearing gravels (Stanley 1965; May 1970). As an exampleof the power and water use of hydraulic techniques, flumesand pipes with 120 m (400 ft) of head could deliver about 3.8million liters (1 million gal) of water per hour through a 25cm (10 in) nozzle at a speed of about 200 kph (120 mph) (Lo-gan 1948). Sediment-laden runoff from the eroded hillslopeswas directed into long sluice boxes, often in tunnels, to ex-tract the gold and then discharged into the nearest creek.
At the peak of hydraulic mining, there were more than fourhundred hydraulic mines in operation (Wagner 1970). Hy-draulic mining was most prevalent from the Feather River tothe North Fork American River (Gilbert 1917; Averill 1946).The largest quantities of material were found in the SouthYuba, lower Yuba, Bear River, and North Fork American River(Gilbert 1917; James 1994). Collapse of the English Dam onthe Middle Fork of the Yuba (Ellis 1939; McPhee 1993) in June1883 released almost 18 million m3 (15,000 AF) of water sud-denly and cleaned out much of the stored mining debris inthat channel (James 1994). Several of the individual pits exca-vated more than 75 million m3 (60,000 AF) of material andflushed it downstream (Gilbert 1917; Senter 1987; McPhee1993). Channels immediately downstream of the hydraulicpits were usually overwhelmed by the enormous sediment
863Hydrology and Water Resources
loads and stored the sediments until high-flow events flushedsome of the material downstream. Surveys of the 1870sshowed accumulations of 30 to 60 m (100 to 200 ft) depth intributaries to the Bear River (Pettee in Whitney 1880, cited byJames 1994). Debris was redeposited throughout the chan-nels, but often formed tailings dams at confluences wherechannel gradients lessened (James 1994). Temporary reser-voirs formed behind these debris accumulations, which oc-casionally failed catastrophically, releasing large volumes ofsediment, perhaps as hyperconcentrated flows. In the earlyyears of hydraulic mining, the upper gravels of the Tertiaryriver channels were attacked first. After 1870, the lower grav-els, which were more strongly cemented than those above,were mined by more powerful methods that moved even moreof the landscape (Lindgren 1911). This second phase of hy-draulic mining produced coarser sediments and greater quan-tities of debris than the first period (James 1988).
As sediments moved downstream, valley rivers aggradeddramatically, and coarse sediments were deposited on farmsand fields. Thousands of acres of farmland became inoper-able under annual deposits of unnaturally coarse sediments(Hundley 1992). As the farmers of the Central Valley gainedeconomic and political power, they were able to successfullychallenge the mining interests (Kelley 1959). In 1884, aftereighteen months of deliberation in the case of Woodruff v. NorthBloomfield, Judge Lorenzo Sawyer of the Ninth U.S. CircuitCourt in San Francisco issued an injunction against furtherdischarge of mining debris. This decision held that release ofmining waste inevitably damaged the property of others anddestroyed the navigability of the Sacramento and Feather Riv-ers, violating both common and statutory law and interfer-ing with commerce (Hundley 1992).
After hydraulic mining was halted, some of the debris cre-ated earlier continued to move through the rivers, largely inpulses during peak flows. Debris that was not entrained dur-ing the phase of active stream incision continues to erode intochannels and perpetuates the enhanced sediment delivery ofthe affected streams (James 1988). Many of the small debrisdams intended to stabilize mining sediment failed and re-leased the stored material. Large competent dams have effec-tively stopped transport of upstream sediment to the lowerreaches of the main rivers. Even after a century, exposed sur-faces in the pits continue to erode through mass failures, gul-lying, rainsplash, and rill erosion and produce substantiallyelevated sediment concentrations downstream of the old minesites (i.e., Senter 1987).
The total volume of mining debris delivered to the CentralValley has been estimated at about 1.1 billion m3 (900,000 AF)from five rivers, with the Yuba contributing about 40% of thatquantity (Gilbert 1917; Mount 1995). Gilbert (1917) also esti-mated that mining sediment was produced at rates about tentimes greater than natural sediment yield from the SierraNevada, although these estimates of background rates werehighly uncertain.
Mercury used in ore processing is another legacy of the
mining era remaining in stream channels. The amount ofmercury used in gold extraction in the Sierra Nevada andlargely lost to soils and streams has been estimated at 3.4 mil-lion kg (7.6 million lb) (Central Valley Regional Water Qual-ity Control Board 1987). Much of this mercury has moveddownstream, and some of it may have contaminated mudflatsof San Francisco Bay. Large amounts of mercury are still foundin stream sediments throughout the Gold Country and arealso trapped in reservoir sediments (Slotten et al. 1995). Thecyanide process for extracting gold from powdered rock wasintroduced about 1896 (Clark 1970; Shoup 1988). The degreeof water pollution resulting from its use and the earlier chlo-rination process is unknown.
Underground mining, also called hard-rock, quartz, or lodemining, began shortly after the discovery of gold in stream-beds, with the Argonaut mine near Jackson opening in 1850.The Sixteen to One mine in the Yuba River Basin persisted asthe main gold mine in California until 1965 and was reopeneda few years ago. Hundreds of quartz mines were operatedthroughout the Mother Lode of the western slope (Jenkins1948; Clark 1970). The main mining districts of the easternSierra Nevada were at West Walker River, Bodie, Green Creek,Virginia Creek, Lundy Canyon, Tioga Pass, Mammoth Creek,Pine Creek, Bishop Creek, and Independence Creek (DeDecker 1966; Clark 1970). Both lode and placer deposits weremined in the Kern River drainage beginning in 1851 (Troxeland Morton 1962). Disposal of tailings, mine water, and ore-processing effluent were the main impacts of the undergroundmines on streams. Although perhaps significant locally, theseimpacts were minor compared with those of the surface op-erations.
Dredging was an important source of gold and a majorimpact on the lower reaches of the main rivers where the Si-erra Nevada meets the Central Valley. Large-scale river dredg-ing began in 1897 along the Yuba near Marysville (Logan 1948)and lasted until 1967 (Clark 1970). The largest dredging op-erations were at Hammonton on the lower Yuba and nearFolsom on the lower American. Dredging was also practicedon Butte Creek, Honcut Creek, the lower Feather, the Bearnear Lincoln, the Cosumnes at Michigan Bar, the Calaverasat Jenny Lind, the Mokelumne at Camanche, the Tuolumneat La Grange, and the Merced at Snelling (Aubury 1910; Clark1970). Between 1900 and 1910, dredge capacity increased fromabout 20,000 m3 (25,000 yd3) to 200,000 m3 (250,000 yd3) permonth (Aubury 1910). Reclamation and revegetation ofdredge spoils were concerns as early as 1910 (Aubury 1910).
The development of mining towns put great pressure onlocal resources, which probably had consequent impact onlocal streams. Towns sprang up quickly when new strikeswere rumored and were successively rebuilt after surprisinglyfrequent fires. Some towns like Elizabethville in Martis Val-ley and Summit City near Cisco grew to several thousandpeople before suddenly collapsing. Development of trails,roads, railroads, and agriculture to support the towns con-verted forests to bare and compacted soil, which was suscep-

864VOLUME I I , CHAPTER 30
tible to erosion. Overgrazing for food production further al-tered plant cover and degraded riparian zones. Harvestingof fish and mammals for food and loss of habitat decimatedwildlife populations and altered ecological processes (Hinkleand Hinkle 1949; Strong 1984). Demand for wood for shelterand fuel quickly depleted the forests closest to the new townsand then progressively expanded the circle of destruction.Lumber was also needed for underground mine supports,railroad ties, and flumes. In a few cases such as Bodie, lum-ber and fuel wood were imported from considerable distances.Forests of the Tahoe basin were cut extensively to supply woodfor the Comstock silver mines near Virginia City. The Bonanzamines alone consumed 28,000 m3 (12 million board feet) oflumber and 145,000 m3 (40,000 cords) of fuel wood per year.An extensive network of skid trails, haul roads, railroads, tugboats, and flumes efficiently removed the forests of much ofthe Tahoe basin. An estimated 600 million board feet of lum-ber were buried in the Comstock mines (Hinkle and Hinkle1949; Strong 1984). More than twenty sawmills in the Middleand South Forks of the American River produced lumber forbuildings and replacement flumes for those destroyed byannual floods (Lardner and Brock 1924, cited by James 1994).
The first known miner’s ditch was a V-shaped flume about3 km (2 mi) long built at Coyote Hill near Nevada City inMarch 1850 (Pagenhart 1969). Later that year, a 14 km (9 mi)long ditch was built by the Rock Creek Water Company, whichrecovered its investment in just six weeks from the sale ofwater (Wagner 1970). Natural lakes in the upper Yuba basinwere augmented and regulated with crude dams as early as1850 (Pagenhart 1969). Acquisition and delivery of water tomines became a huge industry that was probably more prof-itable than mining. If ditches were important to the mining ofsurficial placer gold, they became critical to the hydraulicmining industry. Large companies built vast networks of res-ervoirs and waterways acquired through purchase, filing onabandoned claims, court challenges to water rights, and realand implied violence (Hundley 1992).
The levels of investment, labor, and engineering skill de-voted to the miners’ ditches were impressive. The main sup-ply ditches were 2.4–4.6 m (8–15 ft) wide at the top, 1.2–1.8 m(4–6 ft) wide at the bottom and at least 1 m (3 ft) deep (Wagner1970). Water was conveyed across valleys and rock outcropsin wooden flumes or iron pipes mounted on trestles (Logan1948). By 1857, $13.5 million had been invested in mine watersystems, with $3 million of that total in Calaveras andTuolumne Counties (Langley 1862, cited by Shoup 1988). Inthe 1860s, more than 8,500 km (5,300 mi) of main canals andabout 1,280 km (800 mi) of branch ditches had been con-structed (Browne 1868; Logan 1948; McPhee 1993). By 1884,the total length of ditches, flumes, and pipelines built for min-ing purposes reached 12,800 km (8,000 mi) (Wagner 1970).(This figure was probably for all of California.) The South YubaCanal Company maintained 720 km (450 mi) of waterways atits peak, and the Auburn and Bear River Canal operation in-cluded 460 km (290 mi) of ditches. The dam at Meadow Lake
constructed by the South Yuba Canal Company in 1858 was12 m (42 ft) tall and 350 m (1,150 ft) long (Hinkle and Hinkle1949). By 1880, the California Water Company had twenty-one reservoirs and 400 km (250 mi) of flumes and ditches be-tween the Middle Fork and the South Fork of the AmericanRiver. At the peak of hydraulic mining activity, there weremore than 1,600 km (1,000 mi) of ditches in Nevada County(Kahrl 1978). By the 1870s, artificial reservoirs in the SierraNevada stored more than 185 million m3 (150,000 AF) of wa-ter (Pisani 1984). The Eureka Lake and Yuba Canal Companyoperated four high-elevation reservoirs to supply water tomines near North San Juan, 100 km (65 mi) away (Wagner1970). In the same region, the North Bloomfield Gravel Com-pany used 55 million m3 (45,000 AF) of water annually at upto 110,000 liters (30,000 gal) per minute (McPhee 1993) or227,000 m3 (184 AF) per day and had reservoir storage capac-ity of 28 million m3 (23,000 AF) (Pisani 1984). The company’sBowman Dam was 22 m (72 ft) tall in 1876 and was raisedanother 7 m (23 ft) to increase storage as the mine’s waterdemand increased. The Cherokee mine in Butte County usedup to 150,000 m3 (123 AF) of water per day (Hundley 1992).Abandoned ditches have become naturally revegetated butcan still affect runoff processes today (Pagenhart 1969). Occa-sional failure of both maintained and abandoned ditches cancause local debris flows and gully erosion.
Water Development
Water was also sold for domestic use and for water power forlumber and stamp mills, air compressors, and Pelton-wheelelectric generators after 1890. Increasing scarcity of wood forfuel led to the use of high-pressure water for mechanicalpower. By the mid-1880s, most of the large hard-rock mineswere using water power instead of steam power. The firstknown use of electrical generation for operation of miningand milling equipment in California occurred in El DoradoCounty in February 1890 (Logan 1948). After hydraulic min-ing was halted in 1884, many of the canals were acquired byirrigation districts and later by power companies. The Ne-vada Irrigation District still relies on reservoirs and canalsbuilt for mines in Nevada County. The Pacific Gas and Elec-tric Company eventually took over 520 separate ditch enter-prises and their water rights and facilities. By the 1890s, thelog-and-brush and earth-filled dams of the miners were re-placed by more substantial concrete structures (Pisani 1984).Irrigated agriculture in the foothills occupied about 36 km2
(14 mi2) around Auburn and Placerville in 1880 (Pisani 1984)and grew substantially in the following decades (see Momsen1996).
The vast network of artificial channels built for mining al-lowed the hydroelectric industry to take off as soon as water-powered generating technology became available. A dam onthe American River at Folsom begun in 1866 that was origi-nally intended for hydromechanical power later providedwater for the first transmission of hydroelectricity out of the

865Hydrology and Water Resources
Sierra Nevada. This project at Folsom began supplying powerfor an electric railroad in Sacramento in 1895 (Fowler 1923).After its first dam failed in 1892, a hydroelectric power planton the South Yuba was completed in 1896 and supplied elec-tricity for the Grass Valley and Nevada City area (Pacific Gasand Electric Company 1911). In the next two decades, dozensof hydroelectric facilities were completed throughout theSierra Nevada: Knight’s Ferry-Stanislaus, 1895; Electra-Mokelumne, 1897; Kern 1897; Newcastle-Bear, 1898; Colgate-Yuba, 1899; Farad-Truckee, 1899; Phoenix-Stanislaus, 1901;American, 1903; De Sabla-Butte 1903; Bishop Creek No. 4,1905; San Joaquin No. 3, 1906; Kittredge-Merced, 1906; LaGrange-Tuolumne, 1907; Big Creek No. 1, 1913; Kaweah No.3, 1913 (Pacific Gas and Electric Company 1911; Fowler 1923;Coleman 1952). Independent companies were quickly mergedand integrated, and multiunit projects were developed by thetwo companies that emerged from the consolidation battles,Pacific Gas and Electric and Southern California Edison. TheCrane Valley project involving Bass Lake and Willow Creekwas developed between 1900 and 1920. On the North Fork ofthe Feather, Pacific Gas and Electric was filling Lake Almanorand Bucks Lake by 1928 (Coleman 1952). The Big Creekproject, started in 1911 by the Pacific Power and Light Corpo-ration, was completed by Southern California Edison in 1929and included three large reservoirs, eight tunnels, and fivepowerhouses (Redinger 1949).
In addition to the dozens of hydroelectric projects takingadvantage of the mining waterways, three immense munici-pal-supply projects began as mining faded out. A scheme todevelop Lake Tahoe as a water supply for San Francisco wasproposed even earlier, in 1866, but failed to find support(Strong 1984). The city of San Francisco itself began prospect-ing for water in the Sierra Nevada as early as 1886 (Kahrl1978). The city remained focused on the Tuolumne River witha dam at Hetch Hetchy Valley despite other feasible alterna-tives (Freeman 1912; Jones 1965). Largely because the projectwas in a national park, the proposal generated enormous con-troversy; however, the city prevailed with congressional ap-proval of the Raker Act in 1913. Hydroelectric generation ona subsidiary portion of the project began in 1918, but waterdeliveries to San Francisco did not begin until 1934. TheOwens Valley project of the city of Los Angeles was con-structed more rapidly. After the general concept arose in the1890s, construction bonds were approved in 1907 and workbegan in 1908. The project was operational in 1913, whenOwens Valley water reached the San Fernando Valley. An ex-tension into the Mono basin was built between 1934 and 1940.A second aqueduct was completed in 1970, enabling greaterexport of surface water and pumped ground water. The con-troversies created by the Owens Valley diversions have beendescribed by dozens of authors (i.e., Chalfant 1922; Nadeau1950; Kahrl 1978; Hoffman 1981; Kahrl 1982; Reisner 1986;Walton 1992; Davis 1993; Sauder 1994). By comparison, po-litical conflict was almost absent in the Mokelumne project ofthe East Bay Municipal Utility District. Work began in 1923,
and Pardee Reservoir began filling in 1929, with water deliv-eries to Alameda and Contra Costa Counties that same year(Harding 1960). These systems deliver large volumes of waterto distant communities with a large net production of electric-ity. Hydroelectric power production has been a key source ofrevenue in the financing of water projects in the Sierra Nevada.
The federal government’s involvement with water in theSierra Nevada began with the Newlands Reclamation Act of1902, which authorized the Truckee-Carson Project. Preexist-ing dams that raised the level of Lake Tahoe were recon-structed to provide 1.8 m (6 ft) of controllable storage. Thenewly created Bureau of Reclamation assumed operation ofthe Tahoe dam in 1913 for irrigation of lands near Fallon,Nevada. The interstate and tribal conflicts created by thisproject have maintained a steady stream of litigation for eightdecades (Jackson and Pisani 1973; Jones 1991; Chisholm 1994).Early in the twentieth century, the state government beganconsidering large-scale water development (Kahrl 1993). Areport by the Conservation Commission (1913) devoted halfof its 500 pages to water resources. The first comprehensiveplan for water development in California was prepared byR. B. Marshall in 1919. A few years later, the California De-partment of Public Works (1923) released the first statewidehydrographic survey, which examined 1,270 potential reser-voir sites and recommended dams at 260 of them. That re-port led to another comprehensive development plan (Bailey1927). After California voters approved the concept in 1933as a state project, California was unable to sell the bonds re-quired for financing. The U.S. Congress stepped in, federal-ized the proposal, and authorized the Bureau of Reclamationto begin construction of the Central Valley Project in 1935(Harding 1960; Kelley 1989). Most of the project’s water origi-nates outside the Sierra Nevada in the upper Sacramento andTrinity Rivers. The main pieces of the Central Valley Projectin the Sierra Nevada, the Friant, Folsom, and New MelonesDams, took decades to complete.
After World War II, other big water projects got under wayin the Sierra Nevada, with major dams constructed on theSan Joaquin, Kern, Kings, and American before 1960. The big-dam era continued at full speed through the sixties, withprojects completed on the San Joaquin, Kaweah, Bear,Mokelumne, Calaveras, American, Merced, Tuolumne, andYuba Rivers (Kahrl 1978; California Department of Water Re-sources 1994). The Feather River Project (later named the StateWater Project) was approved by the California legislature in1959 and by the voters in 1960. The centerpiece of the project,Oroville Dam, was completed in 1967.
Although mining in stream channels and water develop-ment have been the overwhelming impacts on hydrologicprocesses in the Sierra Nevada, other human activities in thepast 150 years have also altered the hydrology and streams ofthe range. Unfortunately, there is relatively little informationabout the extent of these various impacts. We are left, there-fore, to a few broad inferences and generalizations.

866VOLUME I I , CHAPTER 30
Grazing
Grazing was perhaps the most ubiquitous impact, as cattleand sheep were driven virtually everywhere in the SierraNevada that forage was available (see Menke et al. 1996;Kinney 1996). Anecdotal accounts describe vast herds andsevere overgrazing (Sudworth 1900; Leiberg 1902). Overgraz-ing has been blamed for accelerated erosion beginning in thelate 1800s and massive gullying of meadows in the decadesthat followed (Wagoner 1886; Hughes 1934). Widespread de-terioration of meadows led to efforts by the U.S. Forest Ser-vice to reduce the degradation (Kraebel and Pillsbury 1934).However, continuing presence of large herds did not allowriparian vegetation to recover enough to reduce erosion ofstream banks.
Timber Harvesting
Timber harvesting in the nineteenth century certainly im-pacted local streams but perhaps mainly because of its typi-cal location: near streams. We can assume that riparian andnear-channel forests were targeted during the mining era be-cause they grew on gold-bearing stream deposits and woodwas needed where most of the activity was: along streams.Rivers were also used for log transport. As early loggers gotfarther away from streams, their impacts presumably dimin-ished. Because transportation of the logs was difficult, largeamounts of slash were apparently left in the woods. Suchmaterial could reduce erosion. In addition, loggers of the 1800ssimply lacked the heavy equipment that can grossly disturbhillsides. The advent of railroads had two major impacts onSierra Nevada forests. Railroad construction consumed vastquantities of lumber for ties, trestles, and snowsheds, and thesteam engines burned wood. Railroad logging caused achange in harvesting practices: economics favored removalof almost all trees near the tracks instead of taking individualtrees selected for wood quality and relative ease of transpor-tation. Where railway networks allowed large fractions of awatershed to be harvested, local yields of water and sedimentcould be expected to have increased. Because the degree ofground disturbance from these early logging operations isunknown, their hydrologic effects are difficult to infer. How-ever, because early harvests did not involve road construc-tion and persistent ground skidding to centralized landings,they may be assumed to have had lower impacts than thosefollowing World War II.
Wildfire
Fire suppression policies that began early in this century mayhave caused extensive and persistent changes in the waterbalance of the forest zone. If forest density significantly in-creased beyond that generally maintained under a pre-1850fire regime, then we may assume that evapotranspiration has
been maximized in the absence of harvesting. Therefore, thepresumably denser forests resulting from fire suppressionmay have reduced water yields in many basins of the west-ern slope. Quantifying such a reduction is not possible with-out knowing something about the water relations of forestsbefore the gold rush. Regionally, changes probably do notamount to more than a few centimeters (inches) of areal wa-ter depth at most. However, the local effects of denser standsin some instances could be sufficient to reduce the flow ofsprings and headwater creeks. The thick ground cover result-ing from the lack of fires has probably decreased surface ero-sion as well.
Roads
Following the Second World War, timber production increasedmarkedly, as did construction of forest roads necessary toserve emerging techniques of log removal. The road-buildingboom of the 1950s through the 1970s was the greatest distur-bance of the Sierra Nevada landscape since the gold rush.Initially, forest roads were just built, rather than properly en-gineered to minimize the risk of mass failure and surface ero-sion. Stream crossings were particular problems when fordsor cull-logs covered with dirt were the preferred means ofcrossing water. Inadequate road drainage and undersizedculverts were common causes of road failure and sedimentproduction. With time, road engineering improved, but totalmileage increased as well. At the extreme, up to a tenth of theland area of some catchments became road surface, with alarge number of stream crossings.
Point-Source Water Pollution
The first known water pollution by industry other than min-ing in the Sierra Nevada involved the sawmills near Truckee.Mill waste was disposed of in the nearest de facto sewer, theTruckee River. The large loads of sawdust filled pools in theriver, clogged the gravels, and probably removed oxygen fromthe water, killing fish in the river. Acts of both the Californiaand Nevada legislatures in 1890 and continued enforcementby the California Fish Commission were required to halt thepollution (Pisani 1977). Construction of a pulp and paper millat Floriston in 1899 added chemical pollutants to the Truckee.This pollution continued until the mill closed for economicreasons in the 1930s (Pisani 1977). Growth of communities inthe Sierra Nevada led to water quality problems relating tosolid waste and sewage disposal. All known problems werelocal and relatively minor. Technology for centralized sew-age treatment has been both improved and widely deployedthroughout the range. Bacteriological water quality aroundthe mining camps may have been poor, as inferred by com-mon intestinal ailments of Euro-American miners that sparedthe boiled-tea-drinking Chinese laborers (Johnson 1971).

867Hydrology and Water Resources
S U R FAC E W AT E R Q UA N T I T Y
The Sierra Nevada annually yields a large but variable amountof water. Continuous stream-flow records began to be main-tained in the mountains less than one hundred years ago andare of short duration with respect to longer-term natural vari-ability. Based on this recent historical record, the Sierra Ne-vada generates about 25 km3 (20 million AF) of runoff eachyear, on average, out of a total for California of about 88 km3
(71 million AF). Stream flow in the Sierra Nevada is gener-ated by seasonal rainfall and snowmelt. About half of aver-age annual precipitation occurs during winter, about a thirdin autumn, about 15% in spring, and generally less than 2%in summer (Smith 1982). About 50% of annual precipitationfalls as snow at 1,700 m (5,600 ft) at a latitude of 39° N (Kahrl1978). Stream flow generated below 1,500 m (4,900 ft) is usu-ally directly associated with storms, while stream flow above2,500 m (8,200 ft) is primarily a product of spring snowmelt.Between these approximate bounds, stream flow is generatedboth by warmer storms and by melt of snow cover in spring.Of course, the major rivers collect inputs throughout theirelevation range with a mix of events. Cayan and Riddle (1993)calculated the seasonal distribution of runoff of six SierraNevada rivers (table 30.1), which illustrates that snowmeltrunoff becomes more important and midwinter rainfall run-off becomes less important with increasing elevation. In theAmerican River Basin, less than half of annual runoff occursfrom April through July in the lower two-thirds of the basin.In small catchments of the American adjoining the SierraNevada crest, more than two-thirds of annual runoff occursduring this period (Elliott et al. 1978).
Disposition of Precipitation
Overall, about half the precipitation in the major river basinsof the west slope of the Sierra Nevada becomes stream flow(table 30.2) (Kattelmann et al. 1983). Stream flow, both inabsolute magnitude and as a proportion of precipitation,increases with elevation. In the American River Basin, stream-flow data from twenty-five subbasins (Armstrong and Stidd
1967) indicate an increase in stream flow of about 3 cm per100 m (3.6 in per 1,000 ft) gain in elevation. Also, in the Ameri-can River Basin, runoff efficiency increases from about 30%in the foothills to more than 80% near the crest (Elliott et al.1978). In four small catchments in the Kings River Basin at1,900 to 2,500 m (6,300 to 8,100 ft), about half the precipita-tion became stream flow on average. However, there was con-siderable variation among the nine years of record, dependingon total precipitation. Runoff efficiency in the four years withmore than 120 cm (47 in) of stream flow ranged from 63% to75%, while in the five years when stream flow was less than30 cm (12 in), runoff efficiencies ranged from 21% to 33%(Kattelmann 1989a). A stream gauge on the North Fork of theKings River at 2,480 m (8,130 ft) is the highest long-term sta-tion on the western slope of the Sierra Nevada. This basin of100 km2 (39 mi2) extends above 3,700 m (12,100 ft). The aver-age annual stream flow of 74 cm (29 in) is 70% to 80% of theestimated annual precipitation. About 85% of the annual flowin this basin occurs from April to July (Kattelmann and Berg1987). In a 1 km2 (250 acre) research basin in Sequoia NationalPark at 2,800–3,400 m (9,200–11,100 ft), 75% to 90% of the an-nual precipitation became stream flow (Kattelmann and El-der 1991). The high-elevation portion of the Sierra Nevada,which covers approximately 3% of California and producesan average of 90 cm (35 in) of annual runoff, contributes about13% of the state’s annual stream flow (Colman 1955). Thiscontribution amounts to an even higher proportion of thestate’s developed water supply because of its persistence intosummer.
Snow
Snow plays a dominant role in the overall hydrology of theSierra Nevada. Storage of frozen precipitation in winter assnow cover and its subsequent release during the spring snow-melt period controls the seasonal distribution of flow in mostmajor rivers. Snow cover is measured at about 400 index lo-cations (300 manually measured snow courses and 100
TABLE 30.1
Seasonal distribution of stream flow in selected rivers (fromCayan and Riddle 1993).
Mean Percentage of Mean Annual Stream FlowElevation
River Basin (m) Aug–Oct Nov–Jan Feb–Apr May–Jul
Cosumnes 1,120 1 21 59 18American 1,430 2 19 46 33Stanislaus 1,770 3 13 38 46San Joaquin 2,290 6 9 29 56East Carson 2,490 7 11 24 58Merced 2,740 4 5 21 70
TABLE 30.2
Approximate disposition of precipitation in major rivers(from Kattelmann et al. 1983).
Precipitation Stream Flow LossesRiver (Gauging Station) (cm) (cm) (cm)
Feather (Lake Oroville) 120 60 60Yuba (Smartville) 160 100 60American (Folsom Lake) 135 65 70Cosumnes (Michigan Bar) 105 35 70Mokelumne (Pardee Reservoir) 120 65 55Stanislaus (Melones Reservoir) 115 75 40Tuolumne (Lake Don Pedro) 110 55 55Merced (Exchequer Reservoir) 115 45 70San Joaquin (Millerton Lake) 110 50 60Kings (Pine Flat Reservoir) 95 50 45
Area weighted average 120 60 60

868VOLUME I I , CHAPTER 30
telemetered snow sensors) in the Sierra Nevada that are usedfor river forecasting. Basinwide means of April 1 water equiva-lence for snow courses above 2,500 m (8,200 ft) suggest thatpeak snowpack water equivalence for the high Sierra Nevadaaverages 75 to 85 cm (30 to 33 in), decreases from north tosouth, and is lower on the east side of the crest than on thewest side (Kattelmann and Berg 1987). Snow courses between1,800 m and 2,500 m (5,900 and 8,200 ft) have an average peakwater equivalence of about 60 cm (24 in).
Flow Variability
Flow in Sierra Nevada rivers is highly variable in time, bothwithin and between years. Peak flows can be up to five or-ders of magnitude greater than minimum flows. Annual vol-umes can be twenty times greater in very wet years than invery dry years. Some smaller streams cease flowing duringprolonged dry periods.
Floods
High water levels are an integral feature of Sierra Nevadarivers and have a variety of effects on aquatic biota as well aschannel morphology (Erman et al. 1988). Peak flows in theSierra Nevada result from snowmelt, warm winter storms,summer and early-autumn convective storms, and outburstsfrom storage (Kattelmann 1990). In rivers with headwaters inthe snowpack zone, snowmelt floods occur each spring asperiods of sustained high flow, long duration, and large vol-ume. However, they rarely produce the highest instantaneouspeaks. The magnitude of a snowmelt flood depends on thespatial distribution of both snow and energy input to thesnowpack. The largest volumes occur when all or almost allthe basin is contributing high rates of snowmelt runoff. Inbasins spanning hundreds of meters of elevation with variedaspects, such situations are rare. Snow usually disappearsfrom south-facing slopes and low elevations long before meltrates peak on north aspects and high elevations. Large snow-melt floods occurred in many river basins of the Sierra Ne-vada during 1906, 1938, 1952, 1969, and 1983. In all cases, snowdeposition was more than twice average amounts and per-sisted into April and May even at low elevations. In basins ofless than 100 km2 (39 mi2) within the snow zone, maximumspecific discharges during snowmelt have ranged from 0.2 to0.8 m3 per second per km2 (18 to 73 ft3/s/mi2) on the westernslope and 0.1 to 0.2 m3/s/km2 (9 to 18 ft3/s/mi2) on the east-ern slope.
Midwinter rainfall on snow cover has produced all the high-est flows in major Sierra Nevada rivers during this century(Kattelmann et al. 1991). The most important factor in rain-on-snow floods is probably their large contributing area.During these warm storms, most of a basin receives rain in-stead of snow, generating short-term runoff from a muchlarger proportion of the basin than during cold storms. How-ever, even during the warmest storms, snowpacks above 2,500
m (8,200 ft) rarely melt much because temperatures are closeto 0oC (32oF). If snow cover extends to low elevations priorto a warm storm, there can be a substantial snowmelt contri-bution from those areas. In basins that are largely above 2,000m (6,600 ft), the highest peaks also tend to be caused by rain-on-snow events. For example, in the Merced River in YosemiteNational Park, the four highest floods were caused by rainon snow and were 1.5 to 1.8 times greater than the maximumsnowmelt peak of record in 1983. In the past sixty years, sixlarge-magnitude floods (peak flows greater than twice themean annual flood) have occurred in almost all rivers drain-ing the snow zone: December 1937, November 1950, Decem-ber 1955, February 1963, December 1964, and February 1986.Specific discharges of these largest floods ranged from 0.2 to4 m3/s/km2 (18 to 360 ft3/s/mi2). The largest flood in Cali-fornia history occurred in January 1862. Following hundredsof millimeters (tens of inches) of antecedent rainfall and snow-fall down to the floor of the Central Valley, 250 to 400 mm (10to 16 in) of rain fell in Sacramento (and undoubtedly higheramounts in the Sierra Nevada) between January 9 and 12.High-water marks on the American River near Folsom were3.5 m (11 ft) above those observed in 1907, the third highestflood measured on the American. In the eastern SierraNevada, Owens Lake rose 3 to 4 m (10 to 13 ft) during that winter.
When subtropical air masses move into the Sierra Nevadain summer and early autumn, sufficient moisture is availableto generate extreme rainfall. Intense convective storms occur-ring over a period of three or four days can generate localflooding. These convective storms can generate the greatestfloods in some alpine basins that are high enough to avoidmidwinter rain-on-snow events. For example, the four high-est floods of Bear Creek (gauged near Lake Thomas A. Edison)were generated by summer rainfall. The peak discharge wasmore than twice that of the largest snowmelt flood in this basinof 136 km2 (52 mi2) with a mean elevation of about 2,850 m(9,300 ft). The greatest recorded floods in several east-sidestreams occurred in late September 1982 when 150 to 200 mm(6 to 8 in) of rain fell in two days.
In limited areas, the greatest floods occur during a suddenoutburst from storage because of avalanche-induced displace-ment of lake water or failure of a natural or man-made damor aqueduct. Peak flows generated by such mechanisms canbe several times greater than those produced by meteorologi-cal events.
Droughts
At the other extreme, stream flow in Sierra Nevada rivers canbecome quite low during intense and/or extended droughts.For example, during 1977 when average snow water equiva-lence in early April was only 25% of the long-term mean,stream flow as a proportion of average annual flow rangedfrom 0.08 to 0.26. Basins with most of their area at low eleva-tions generally had the lowest proportions of average vol-

869Hydrology and Water Resources
umes. Dry periods may last for several years. From 1928through 1937, runoff was below average in each year. The pasttwo decades have included record droughts for one year(1977), two years (1976–77), three years (1990–92), and sixyears (1987–92). The recent six-year drought was similar tothe 1929–34 dry period. Total stream flow averaged acrossmany rivers was about half of average in each case (Califor-nia Department of Water Resources 1994). Other indicationsof past climate suggest that severe droughts in the Sierrahave persisted for periods from decades to more than twocenturies (Graumlich 1993; Stine 1994, 1996; Millar 1996;Woolfenden 1996). The presence of tree stumps well belowmodern lake levels in Lake Tahoe and Lake Tenaya and else-where provides strong evidence for very arid conditions inthe past (Stine 1994). The period 1937 through 1986 was ananomalously wet period in a 1,000-year-long reconstructionof precipitation from dendrochronological evidence(Graumlich 1993). However, our water resources infrastruc-ture and institutions were largely developed during this pe-riod. Inferences about the climate of the past 100,000 years(e.g., Broecker 1995) suggest that great variability in tempera-ture has been common and the temperature of the last 10,000years was anomalously stable. Any resumption of such a vari-able climate would be challenging to California’s water re-source system and society in general. Dramatic shifts inclimate could alter the distribution of vegetation over decadesto centuries and could interact with a changed precipitationregime to alter runoff generation (Beniston 1994; Melack etal. in press).
Trends
In both extremes of wet and dry conditions, there do not ap-pear to be any strong trends in water becoming more or lessavailable in the recent past. Concern was raised a few yearsago that the proportion of annual runoff occurring in themonths of April through July in the Sacramento, Feather, Yuba,and American Rivers had declined since about 1910 (Roos1987). However, this trend appears to be a result of increasedrunoff for the remainder of the year and no change in abso-lute amounts during spring (Wahl 1991; Aguado et al. 1992).On the western slope of the Sierra Nevada, there have beenno obvious trends in flood magnitude or frequency over thehistorical period. In rivers of the eastern slope, clusters ofevents at both extremes have been evident in recent years(Kattelmann 1992). Five of the largest eight to eleven snow-melt floods (in terms of volume) since the 1920s occurred from1978 to 1986. Five of the smallest thirteen or fourteen snow-melt floods since the 1920s occurred from 1987 to 1991. In-stantaneous peak flows have a similar distribution. Forexample, in Rock Creek, four of the ten largest annual floodsand three of the six smallest annual floods occurred duringthe 1980s. These events support theories of some climatolo-gists that extreme events are becoming more common in thewestern United States (Granger 1979; Michaelson et al. 1987).
Variability in flow remains a defining characteristic of SierraNevada rivers.
Even the limited variability in precipitation and runoff thatoccurred in this century caused water managers to attemptto augment supplies through deliberate weather modifi-cation. Soon after the theoretical basis for cloud seeding toincrease precipitation was established, the world’s first op-erational program began in the eastern Sierra Nevada in 1948.Within the next few years, cloud seeding programs werestarted in the San Joaquin, Kings, Mokelumne, and FeatherRivers (Henderson 1995). A dozen programs were active inthe Sierra Nevada in 1994 and 1995. Despite dozens of stud-ies, the effectiveness of cloud seeding remains uncertain. Con-ventional wisdom suggests that a well-designed cloud seedingprogram may yield up to 6% additional stream flow (Ameri-can Meteorological Society 1992). Hundreds of papers havebeen written on environmental effects of cloud seeding (e.g.,Berg and Smith 1980; Parsons Engineering Science 1995), butmajor impacts have not been found, perhaps because of theuncertainty in the amount of precipitation augmentation. Theamounts of the primary seeding agent, silver iodide, releasedin a typical year (7–18 kg [15–40 lb]) over a large river basinare several orders of magnitude less than quantities naturallypresent in soil.
S U R FAC E W AT E R Q UA L I T Y
The Sierra Nevada is generally regarded as producing sur-face water of excellent quality, meaning the water is suitablefor almost any use and contains lower amounts of contami-nants than specified in state and federal standards. Most ofthe runoff would be suitable for human consumption exceptfor the risk of pathogens. Very little of the water of the SierraNevada can be considered highly polluted (i.e., contaminatedwith materials having potential adverse effects at concentra-tions above natural background). Areas of lower water qual-ity correspond to those areas with greater human activitiesand access. Headwater streams are particularly sensitive topollution because of low flow conditions and nutrient limita-tions. The relatively few point sources of pollution through-out the range are mostly associated with inactive mines,dumps, and towns. Many contaminants that enter SierraNevada streams can be considered non-point-source pollut-ants because they are generated over large areas. Livestockwaste is an example of non-point-source pollution. Sedimentis the most pervasive pollutant because its production maybe increased above natural background levels by almost anyhuman activity that disturbs the soil or reduces vegetationcover. Sediment augmented above natural levels usuallyimpairs some beneficial uses of streams. Erosion and sedi-ment are discussed separately in another section of this chap-ter. Ground-water quality is discussed in the section about
870VOLUME I I , CHAPTER 30
ground water. Water temperature is treated in Kondolf et al.1996.
Human activities in the watershed have the potential toalter nutrient cycling. A classic study in New England pro-vided some of the first measurements of changes in nutrientbudgets as a result of complete killing (but not removal) oftrees in a small catchment (Likens et al. 1970). This study atHubbard Brook found that loss of nitrates in stream flow in-creased by forty times in the first year following devegetation,and export of other nutrients increased several times. Studiesin Oregon (Fredriksen 1971; Brown et al. 1973) suggested thattypical harvesting procedures that impact less than half of awatershed with deep soils will not significantly contaminatesmall streams or risk serious declines in soil productivity(Brown 1980). However, frequent harvesting of large portionsof catchments with shallow soils and low cation exchangecapacity can result in substantial nutrient losses from soils tostreams. Elevated concentrations of nitrates and phosphatesmay be expected in catchments with agriculture, fish farms,and residences. Most of the work on nutrient cycling in theSierra Nevada has been done in the Lake Tahoe area (e.g.,Coats et al. 1976; Coats and Goldman 1993). In one catchmentin the Tahoe basin, biological processes effectively preventedrelease of nitrogen in nitrate form in surface water or groundwater (Brown et al. 1990). These authors cautioned that cre-ation of impervious surfaces allows nitrates to bypass poten-tial sinks. Human activities that decrease residence time ofwater in soils have potential to increase nitrate export. Ni-trate concentrations sampled in seventy-seven streams of theeastern Sierra Nevada were less than 1 mg/l in all cases andusually less than 0.1 mg/l, demonstrating that there is usu-ally little export of nitrates in streams (Skau and Brown 1990).
Point-Source Pollutants
There are very few known localized sources of water pollu-tion in the classic outfall-into-the-stream sense in the SierraNevada because of the virtual absence of industries that pro-cess chemicals and continuing abatement of the few existingsources. Point-source pollution has also been reduced veryeffectively under the Clean Water Act of 1972 and subsequentamendments. Municipal and industrial discharges are con-trolled through National Pollutant Discharge EliminationSystem permits. Most pollution of that general nature is as-sociated with active and abandoned mines and is discussedin the section on mining. Industrial-type pollutants may alsobe found in the vicinity of many cities and towns and aban-doned lumber mills. However, serious problems of this na-ture are not known to exist (Central Valley Regional WaterPollution Control Board 1957; Central Valley Regional WaterQuality Control Board 1991; Lahontan Regional Water Qual-ity Control Board 1993). Over the entire western slope, thereare only ten “municipal and industrial discharger groups”:Chester, Quincy, Paradise, Portola, Nevada City, Auburn,Placerville, Jackson, Sonora, and Bass Lake (Central Valley
Regional Water Quality Control Board 1991). Water qualitywas considered impaired in streams receiving wastewaterfrom Nevada City, Grass Valley, Placerville, Jackson, and theColumbia-Sonora area (Central Valley Regional Water Qual-ity Control Board 1991).
Sewage
Most communities with a centralized population in the Si-erra Nevada have common sewage collection and treatmentsystems. Discharges from treatment facilities are regulated bythe regional water quality control board; however, short-termfailures are a persistent difficulty. Disposal of treated waste-waters on land instead of directly into streams is encouragedwhere practicable (Central Valley Regional Water QualityControl Board 1991). An experiment in Tuolumne Countydemonstrated several problems with spraying treated efflu-ent on hillsides: the soil became overloaded with nutrients,salts, and water, and algal growth effectively sealed the soilsurface, minimizing infiltration (California Division of For-estry 1972). Effluent from a sewage treatment plant in the LakeTahoe Basin was sprayed over a 40 ha (100 acre) area from1960 to 1965. Even five years after application ceased, sub-stantial amounts of nitrates were entering a creek down-gradient from the site. A stand of Jeffrey pine at the site wasalso killed by the persistent high level of soil moisture (Perkinset al. 1975).
A significant fraction of the residences in the Sierra Ne-vada are too dispersed to allow connection to communitysewage facilities and rely on individual septic systems (Duane1996a). Septic systems in Nevada County have led to signifi-cant bacteriological contamination in streams below un-sewered subdivisions (California Department of WaterResources 1974). Septic tank and leach field systems on indi-vidual lots provide a good example of cumulative watershedeffects. The soils of a particular catchment have sufficient ca-pacity to treat a particular quantity of sewage under a par-ticular set of conditions. When the soil system is overloaded,some fraction of the waste or its derivatives is discharged tostreams. Each residential septic system contributes only asmall fraction of the total, but the community as a whole haspolluted the catchment. Recreational developments such asski areas and campgrounds also generate significant quanti-ties of sewage and may have their own treatment facilities ifgeographically isolated. In the 1950s, Yosemite Valley was themost significant wastewater source in the upper-elevationparts of the San Joaquin River Basin (Central Valley RegionalWater Pollution Control Board 1957).
Urban storm water runoff can add a variety of contami-nants directly to streams. Pet waste can be a significant sourceof fecal coliform bacteria in some areas. Street runoff in theLake Tahoe Basin is beginning to be routed into publiclyowned lots to allow for some pollutant removal.
Even in the backcountry, inadequate disposal of humanwaste from dispersed recreationists has contaminated enough

871Hydrology and Water Resources
of the streams in remote areas of the Sierra Nevada to makeconsumption of any untreated water somewhat risky. Al-though the level of risk is unknown, pathogens includingcoliform bacteria, campylobacter, and Giardia have been foundin many areas throughout the range (Hermann and McGregor1973; Suk et al. 1986). In a survey of seventy-eight backcountrylocations with varying levels of recreational use, Giardia cystswere found in 44% of water samples collected downstreamof heavily used areas and 17% of samples from areas of rela-tively low use (Suk et al. 1987). Giardia cysts have also beendetected in fecal matter of cattle grazing in backcountry ar-eas (Suk et al. 1985). Recreational pack stock contribute tonutrient and bacterial pollution. Heavily used trails (e.g., Mt.Whitney) have had sufficient problems with human waste towarrant the installation of backcountry toilets. Low-level re-lease of nutrients from wilderness campers have stimulatedincreased plant growth on lake bottoms (Taylor and Erman1979).
Non-Point-Source Pollution
When non-point-source pollution gained widespread recog-nition as a critical water quality problem in the 1970s, admin-istrative and regulatory approaches were lacking. Eventually,Congress (in the Clean Water Act of 1977 and Water QualityAct of 1987) and the Environmental Protection Agencyadopted the concept of best management practices (BMP).This general concept can be stated as doing the best one canto minimize water pollution and meet water quality standardswhile still conducting the intended activities. Different ap-proaches to developing and applying BMPs have been triedin different states. Ideally, BMPs should reflect the most cost-effective approach to minimizing water pollution in a spe-cific area using practical technology (Dissmeyer 1993; Brownand Binkley 1994). Determining what is most effective andefficient in a particular region should be an iterative processof applying a practice, monitoring its effectiveness, evaluat-ing the cost and impact, modifying the practice in its nextapplication, and so on. Unfortunately, monitoring has beenlimited, so there is often little basis for improving techniques.However, the learning and refinement process has led to con-tinual improvements in BMPs on national forests in Califor-nia and on all lands in the Lake Tahoe Basin (U.S. ForestService 1992; Tahoe Regional Planning Agency 1988). A re-cent review of forest management impacts on water qualityconcluded that the use of BMPs in forest operations was gen-erally effective in avoiding significant water quality problems(Brown and Binkley 1994) . However, this report cautionedthat proper implementation of BMPs was essential to mini-mizing non-point-source pollution and that ephemeral chan-nels were often overlooked in the application of BMPs.Additionally, further development work is necessary for BMPswith respect to grazing, maintenance of slope stability, andavoiding losses of nitrates from soils (Brown and Binkley1994). Much can be done to protect water quality simply by
avoiding activities in sensitive areas, such as riparian zones,areas susceptible to mass movement, and areas where soilsmay become saturated and produce overland flow (Megahanand King 1985). The Tahoe Keys development in a formermarsh on the upper Truckee River is an outstanding exampleof a major failure to respect such areas.
Forest Chemicals
Following the example of agriculture, forest management in-corporated the use of fertilizers, pesticides, and herbicides inits operations during the 1960s and 1970s. As concerns aboutthe environmental hazards of such chemicals have grown,their use appears to have decreased (Norris et al. 1991). Evenat its peak, the use of silvicultural chemicals was tiny com-pared with that of agricultural chemicals. On the average, lessthan 1% of commercial forest land in the United States re-ceived any chemical treatment in a year (Newton and Norgren1977). By contrast, most agricultural land receives multipletreatments every year.
Chemicals have been used in forest management for a va-riety of purposes (see Helms and Tappeiner 1996). Herbicideslimit competition from other species so as to enhance oppor-tunities for conifer regeneration and growth. Herbicide usehas declined markedly since the early 1980s, when legal deci-sions in the Pacific Northwest limited their use and Region 5of the U.S. Forest Service halted aerial applications of herbi-cides. However, chemical use now seems to be increasingagain under new regulations. The use of insecticides has var-ied widely between years, depending on insect outbreaks(Norris et al. 1991). Fungicides and soil fumigants can con-trol certain diseases and have been used mostly in tree nurs-eries. Rodenticides limit damage from gophers and otherrodents, and animal repellents have been used to reduce dam-age to trees from porcupines and rodents. Fertilizers are usedto enhance productivity by selectively compensating for nu-trient deficiencies (Allen 1987). Fire retardants are the onlyclass of forest chemicals that do not have a parallel in agricul-ture. They are used at margins of wildfires to slow the rate offire spread.
Because pesticides, by definition, are toxic to some organ-isms, they pose hazards to some components of ecosystems.They have long been regarded as a particular threat to waterquality and aquatic life (Brown 1980). Their use assumes thatmanagers have decided that the pest that is the object of con-trol efforts really should be eliminated or reduced in number.Therefore, the ecological risk associated with pesticides in-volves the consequences of that decision and the impacts onnontarget species. In general, the hazard to nontarget organ-isms depends on the exposure to significant doses and thetoxicity of the chemical (Brown 1980). However, some groupsof organisms, such as butterflies, are at risk from exposure tocertain chemicals (see Shapiro 1996). Toxicological studies offorest chemicals in common use are reviewed by Norris et al.(1991).
872VOLUME I I , CHAPTER 30
Pesticides have the greatest potential to contaminatestreams by direct (presumably unintentional) application andwind-borne drift into water courses. Toxicants used in fisher-ies management are applied intentionally to streams but mayhave a variety of unintended consequences (see Erman 1996).Spraying by ground crews is much more effective at placingall the pesticide where desired. The greatest potential for pes-ticides to appear in runoff exists when substantial precipita-tion occurs soon after the pesticide is applied. Opportunitiesfor a chemical to reach a stream via overland flow depend onthe distance from the stream to the closest point of chemicalapplication, infiltration properties of soil and litter, the rateof flow toward the stream, and adsorptive characteristics ofsoil and organic matter (Brown 1980). Chemicals that reachstreams may be removed through volatilization, adsorptionon sediments, adsorption by aquatic biota, degradation bychemical, photochemical, or biological processes, and simpledilution with downstream movement (Norris et al. 1991).
Current practice generally limits insecticide and fungicideuse to well-defined problems over relatively limited areas,such as insect-outbreak zones and nurseries. By contrast, her-bicides can have rather broad application in forestry, and thereis public concern about the potential for indiscriminate use.The Record of Decision on the California Region Final Envi-ronmental Impact Statement for Vegetation Management andReforestation (U.S. Forest Service 1988) contains languageprohibiting the use of hexazinone and similar herbicides“when they are expected to enter ground water or surfacewater, such as when soils are very sandy or have low clay ororganic matter contents.” A letter of October 30, 1990, to for-est supervisors from the regional forester suggested that amargin of safety be established so that expected dose levelsshould be 100 times less than the dose level for which no ad-verse effects have been detected by laboratory studies. Thestandard that the Central Valley Regional Water Quality Con-trol Board has established follows EPA practice as 200 partsper billion (ppb) for hexazinone (Stanislaus National Forest1993). Monitoring for hexazinone in streams has been con-ducted on the Eldorado National Forest and Sierra NationalForest after fall applications between 1991 and 1993. On theEldorado, fifteen samples out of ninety contained hexazinoneranging from 1 to 19 ppb. No hexazinone has been detectedand reported yet on the Sierra National Forest (StanislausNational Forest 1993). However, a news media account sug-gested that hexazinone had killed riparian vegetation down-stream of an application area on the Sierra National Forest in1993.
Glyphosphate and triclopyr are two other herbicides thatare being used more widely in the Sierra Nevada. Herbicidemonitoring programs (Frazier and Carlson 1991) on threenational forests in the Sierra Nevada in 1992 and 1993 foundtrace amounts of the two chemicals in only 3 of more than120 samples, and those samples testing positive were sus-pected of being contaminated (Stanislaus National Forest1993). In studies throughout the United States, chronic entry
of herbicides into streams has not been observed (Norris etal. 1991). Artificial alteration of vegetation composition andcover has some potential for alteration of nutrient cycling.We are not aware of research concerning this issue at an op-erational scale. Pesticides are also widely used in residentialareas in the Sierra Nevada and could cause localized contami-nation.
Fire retardants are applied during crisis situations withoutthe opportunity for careful planning or management. There-fore, their impacts must be considered well before the timethey are actually deployed. When aerial application of fireretardants was first used, the main active ingredient wassodium-calcium borate. After a few years, this material wasnoticed to have a tendency to sterilize the soil and restrictgrowth of new vegetation following the fire. In recent years,ammonium phosphate and ammonium sulfate have becomethe primary retardants in active use. Nitrogen in several formsis released as a breakdown product of these chemicals. Non-ionized ammonia (NH3) is the only reaction product that ishighly toxic to fish. A series of experiments relating to envi-ronmental impacts of ammonium fire retardants found thatthe compounds had little adverse effect on soil fertility, con-tributed a short-duration pulse of ammonia to streams, andmoderately elevated levels of nitrates in receiving waters(Norris et al. 1978). The quantity of nutrients released by burn-ing is likely to overwhelm any signal of those resulting fromretardant application.
Forest chemicals may have a variety of unintended indi-rect effects on ecosystems by performing more or less as in-tended but in the wrong places. Insecticides may kill aquaticinsects and reduce food supplies for fish. Herbicides can killaquatic plants and disrupt the food chain at higher levels.Herbicides can also kill riparian vegetation, thereby reduc-ing cover and shade benefits for fish and possibly increasingsediment yields. Death of riparian vegetation can add muchorganic debris to streams over a relatively short time andpossibly deplete dissolved oxygen as it decomposes and alsoreduce the longer-term supply of organic matter until veg-etation is reestablished on the banks. Fertilizers can contrib-ute to eutrophication if the receiving waters are nutrientlimited. To restate the obvious, minimizing the adverse im-pacts of forest chemicals on aquatic ecosystems requires thatthe chemicals be kept away from the streams and riparianzones.
Atmospheric Deposition
During the 1980s, concerns about the potential effects of at-mospherically derived pollutants on aquatic ecosystems(Roth et al. 1985; Schindler 1988) focused attention on high-elevation lakes of the Sierra Nevada (Tonnessen 1984; Melacket al. 1985). The California Air Resources Board initiated acomprehensive study of the sensitivity of a small alpine lakebasin in Sequoia National Park as part of a statewide acid-deposition program (Tonnessen 1991). This study explored

873Hydrology and Water Resources
the hydrochemical processes and biotic responses of this high-elevation system to possible shifts in precipitation chemistry(e.g., Williams and Melack 1991; Kratz et al. 1994). Hydrol-ogy and water chemistry of six other high-elevation lakes havebeen monitored over the past few years (Melack et al. 1993),and deposition has been monitored at several sites (Melacket al. 1995). These studies indicate that the loading rates ofhydrogen, sulfate, nitrate, and ammonia are relatively low inthe Sierra Nevada compared with rates in other parts of thecountry. However, snowpack processes can produce a distinctionic pulse in the early part of the snowmelt season that tem-porarily lowers the pH of streams and lakes in high-eleva-tion catchments with little buffering capacity (e.g., Williamsand Melack 1991). Such surface waters may be at risk of acidi-fication if air pollution and acidic deposition increase (seeCahill et al. 1996). A comprehensive state-of-knowledge re-view of aquatic impacts of acidic deposition by the Univer-sity of California at Santa Barbara and the California AirResources Board should be completed in 1996.
Monitoring
Obtaining adequate knowledge of water quality conditionsthroughout the Sierra Nevada on a continual basis is chal-lenging at best. Frequent and long-term sampling from doz-ens to hundreds of sites is necessary to respond to suddenevents, detect long-term trends, enforce regulations on dis-charges, improve the effectiveness of best management prac-tices, and assess overall status. Sampling methodologies andanalytical techniques are now fairly well developed (Stednick1991; MacDonald et al. 1991). Bioassessment techniques us-ing aquatic invertebrates as an integrative index or screeningtool of water quality conditions is gaining widespread accep-tance (U.S. Environmental Protection Agency 1989). However,broad strategies and philosophies for deciding what param-eters to measure in what locations for what purpose have yetto be refined. Interpretation of water quality data to providea sound basis for management or regulatory actions remainsproblematic (Ward et al. 1986). Most agencies and individu-als concerned with water issues probably find the scarcity ofmonitoring data frustrating and inadequate to meet theirneeds. Additions to the present monitoring network will re-quire implementation of creative mechanisms to provide sub-stantial funding. No single agency can accomplish all thenecessary monitoring independently. Interagency coordina-tion is needed to maximize efficiency from available funds.
Evaluations of Water Quality in Streams
Assessments of water quality are made by the Department ofWater Resources, the Central Valley and Lahontan RegionalWater Quality Control Boards, the Environmental ProtectionAgency, the U.S. Geological Survey, the U.S. Forest Service,reservoir operators and proponents, and various other agen-cies. Every other year, the State Water Resources Control Board
compiles water quality data from the regional water qualitycontrol boards and presents its findings to the Environmen-tal Protection Agency under section 305(b) of the federal CleanWater Act. The 1992 Water Quality Assessment listed twenty-one streams draining the west slope of the Sierra Nevada ashaving serious quality problems. The principal problems inmore than half these cases were degradation of fisheries habi-tat and inadequate flow. Mine drainage was noted in fourcases, and sedimentation was recognized as a problem intributaries of the Feather River and Little Butte Creek. Recre-ational impacts were mentioned as an additive problem insome cases (California State Water Resources Control Board1992a). More rigorous criteria were used on the eastern slope,where almost all streams had some impairment of water qual-ity, usually from water diversion or overgrazing. A subset ofthose streams (Blackwood Creek, Bryant Creek, Carson River,Heavenly Valley Creek, Monitor Creek, and Ward Creek) hadmore serious problems where violations of water quality ob-jectives had occurred either from sedimentation or mine drain-age. A list of thirty streams throughout the Sierra Nevada withvarious kinds of toxic contamination appeared in a compan-ion report (California State Water Resources Control Board1992b). Unfortunately, this listing does not rank the problemsin terms of severity, and some problems on the list are knownto be much more significant than others. What is worse, thereis no information available for the majority of streams in theSierra Nevada.
The Central Valley Basin plan summarizes water qualityin Sierra Nevada streams above 300 m (1,000 ft) as “excel-lent” in terms of mineral content (Central Valley RegionalWater Quality Control Board 1991). In general, concentrationsincreased from east to west (downslope and downstream).The Chowchilla and Fresno Rivers had the highest levels oftotal dissolved solids among western-slope rivers, but thoseamounts were still much lower than for streams in the Cen-tral Valley. A major assessment of water quality in the Sacra-mento River Basin was started by the U.S. Geological Surveyin 1994 and will continue through 1998.
An evaluation of water quality in ten rivers in the centralSierra Nevada was carried out from 1975 to 1987 (CaliforniaDepartment of Water Resources 1989). Nine of the rivershad very low levels of total dissolved solids (less than 150mg/l—adequate for most industrial applications and wellbelow a state criteria for drinking water of 500 mg/l). Thetenth river in the survey, the East Walker, occasionally hadhigh levels of total dissolved solids (up to 800 mg/l). High-elevation lakes in the Sierra Nevada as a group had the low-est ionic concentrations of any region sampled in the UnitedStates (Landers et al. 1987).
Several studies have focused on the Truckee River. Becauseof the high public value of the clarity of Lake Tahoe, waterquality in the Lake Tahoe Basin is more thoroughly monitoredthan that in any other river basin in the Sierra Nevada. Waterquality in most of the tributaries to the lake would be consid-ered fine if not for the high sensitivity of the lake to nutrient

874VOLUME I I , CHAPTER 30
additions. Downstream of Lake Tahoe, the Truckee River haslargely recovered from the intense insults to water quality ofthe 1870s to 1930s (log transportation on artificial floods, saw-dust dumping from lumber mills, and chemical waste from apulp and paper mill) (Pisani 1977). Today, the principal prob-lem in the Truckee River above Reno is elevated temperatureresulting from water storage in Martis Creek, Prosser, Boca,and Stampede Reservoirs (Bender 1994). Total dissolved sol-ids have been in the 6 to 210 mg/l range. Naturally occurringuranium is found in Sagehen Creek, and iron is high in a fewplaces within the Truckee River system (Bender 1994). Waterquality problems have been identified on Leviathan/BryantCreeks (bacteria, nutrients), Little Truckee (nutrients), andTrout Creek (total dissolved solids, suspended sediments)(California State Water Resources Control Board 1984).
Although the surface waters of the Sierra Nevada are nolonger pristine in terms of quality or other attributes, moststreams could rank as excellent or outstanding compared withconventional standards or water elsewhere in the state, na-tion, or world. However, water quality in the Sierra Nevada,as elsewhere, is intimately connected to water quantity. Re-duction in natural flows because of diversions is perhaps themost widespread water quality problem. Water remaining inthe stream must support the same habitat needs and dilutewhatever material and heat loads that arrive downstream ofthe points of diversion. For these reasons, what is usuallyconsidered a quantity problem is also a problem of quality.Additionally, there are persistent problems in different riverbasins. In the Lake Tahoe Basin, nutrient loads that would beconsidered small anywhere else are accelerating eutrophi-cation of the lake. Within many parts of the Feather RiverBasin, unstable stream banks resulting from long-term over-grazing and roads are producing sediment yields at the basinscale that are up to four times greater than natural yields.Throughout much of the Sierra Nevada, a few problem minescontinue to leach heavy metals into streams, and mercury re-mains in the beds of many streams from a century ago. Iso-lated problems such as poorly designed and located septicsystems and roads impact local portions of streams and shouldbe correctable by moderate investments for improved waterquality.
E RO S I O N A N D S E D I M E N TAT I O N
Soil erosion, mass wasting, channel erosion, and sedimenta-tion are natural processes that alter the landscape and streams.They are important disturbance mechanisms in terrestrial andaquatic ecosystems. These geomorphic processes are criticalin nutrient cycling, transport of organic matter, and creationof fresh surfaces for colonization (Naiman et al. 1992). Therates at which they occur are highly variable across the land-scape and over time. These processes operate most intensely
in association with major rainstorms and so can be consid-ered episodic in nature. Nevertheless, streams tend to adjusttheir form to accommodate the long-term sediment supply.Processes that detach and transport particles of soil and rockdownslope and downstream can be lumped together as ero-sion. Sedimentation occurs when these particles come to restin transitory or long-term storage.
Aquatic Effects
Alteration of stream sediments can seriously impact popula-tions of fish and other aquatic organisms. Aquatic ecosystemshave developed in response to a particular regime of waterand sediment flows and channel conditions. When conditionschange, such as when annual floods cease because of a damor the proportion of silt-size sediments increases because of aroad built next to the stream, some organisms will benefit andsome will suffer. Trout and other salmonids require streambeddeposits of gravel-size particles in which to prepare nests(redds) for their eggs where there is substantial flow of waterand dissolved oxygen. Until the fry emerge after two to sixmonths, the redds are vulnerable to scour and deposition ofother sediments that could block flow of water through theredd (Lisle 1989). When sediment inputs to a stream exceedthe transport capacity of the channel, fine sediments (clays,silts, and sands) tend to accumulate on the bed surface (Lisleand Hilton 1992). Fine sediments have been found to fill sub-stantial fractions of pools in streams on the Sierra NationalForest that were known to have high sediment yields, suchas Miami Creek (Hagberg 1993). These fine sediments oftensmother invertebrates, reduce permeability of streambedgravels and fish-egg nests (redds), impede emergence of fishfry, and cause poor health or mortality of fry at emergencebecause of reduced levels of dissolved oxygen (Burns 1970).Sedimentation also adversely impacts invertebrate habitat(Erman 1995). In many streams in the Sierra Nevada, suitablegravels for spawning are found only in isolated pockets andlower-gradient reaches (Kondolf et al. 1991; Barta et al. 1994).The limited extent of such areas increases their importancefor fisheries maintenance. Fortunately, scour and depositionprocesses are highly variable within and between streams, sothat some spawning areas are almost always available (Lisle1989). Sediment transport processes in streams of the SierraNevada have been the subject of few studies (e.g., Andrewsand Erman 1986), and even basic information is scarce. Muchof the sediment in mountain streams consists of large par-ticles known as bedload. In fourteen streams of the easternSierra Nevada, the proportion of bedload varied between 0%and 65% of the total sediment load (Skau et al. 1980).
Natural Sediment Yields
Natural surface erosion is generally regarded as small in theSierra Nevada because of high infiltration capacity of the soils,predominance of snowmelt as a water input to soils, rarity of

875Hydrology and Water Resources
overland flow, predominance of subsurface flow, and rela-tively continuous vegetation cover. The sources and pathwaysof sediments supplied to stream channels are not completelyunderstood. The channel system itself is an obvious candi-date as a source for most of the sediment (King 1993). Duringpersistent rainfall and peak snowmelt, the network of verysmall channels becomes rather extensive, mobilizing sedimentfrom a large fraction of a watershed. Such sediment probablydoes not move very far but may be made available for trans-port by a high-magnitude runoff event. The sequence of eventsof different magnitudes can determine the net sediment trans-port over long time periods (Beven 1981). In the Sierra Ne-vada, the greatest potential for overland flow to occur appearsto be below the snow zone in woodland-grassland communi-ties between 300 and 900 m (1,000 and 3,000 ft) (Helley 1966).The maximum rates of sediment production have been ob-served in this same altitude range (Janda 1966). The wood-land zone also was the primary sediment source in part ofthe American River Basin with annual erosion of about 150m3/km2 (0.3 AF/mi2) (Soil Conservation Service 1979).
Accelerated Erosion
Human activities often disrupt the natural geomorphic pro-cesses and accelerate erosion or destabilize hill slopes. Mod-eling erosion in the Camp and Clear Creek Basins suggeststhat disturbance, especially roads, can increase erosion manytimes above natural rates (McGurk et al. 1996). When soil lossand sediment transport occur at unusually high rates in re-sponse to some human disturbance, erosion and sedimen-tation become issues of concern. Accelerated soil loss isprimarily a problem in terms of losing productivity for grow-ing vegetation (Poff 1996). Excessive sedimentation can dam-age terrestrial plants and aquatic organisms. High levels ofsediment deposition can also reduce the utility of facilitiesfor water storage and diversion and hydroelectric produc-tion. At the extreme, hydraulic mining for gold on the westslope of the Sierra Nevada intentionally eroded entire hill-sides. The resulting sedimentation in downstream river chan-nels left deposits tens of meters thick. Sediment yield in theYuba River was up to twenty-five times greater than naturalrates (Gilbert 1917) and led to a legal decision effectively halt-ing hydraulic mining. Activities that purposefully move soil,such as construction of roads and structures, have the great-est potential for increasing erosion. Activities that reduce veg-etative cover and root strength can also increase erosion rates.Activities in and near stream channels have the greatest po-tential for altering sediment delivery and storage as well aschannel form. For example, destruction of riparian vegeta-tion can lead to massive streambank erosion, or dams can trapsediment from upstream while causing channel incision ornarrowing downstream.
Processes involving movement of large units of soil or rockrather than individual particles are collectively known as masswasting. Landslide activity is a typical mass failure in which
a portion of a slope fails all at once. Movement may be cata-strophic in seconds or progressive over years. Mass wastingmay be important in providing a material supply to channelsslowly through soil creep or suddenly when a debris flowreaches a stream, but it is not regarded as a major erosiveagent in most of the Sierra Nevada (Seidelman et al. 1986).Mass movement typically occurs when most of the pores inthe material become filled with water. The positive pressureof the pore water and its added mass may exceed the strengthof the material, and failure of part of the slope may occur.Unusually high rates of water input to previously wet soilscan lead to large numbers of landslides in the Sierra Nevada(De Graff et al. 1984). Disturbance of slopes accelerates thenatural occurrence of landslides (Sidle et al. 1985). Exca-vations across slopes for roads intercept water flowingdownslope through the soil and increase pore water pressureat the exposed seepage face. In granitic portions of the SierraNevada, ground-water flow is often at a maximum at the in-terface between the porous coarse-grained soils and underly-ing relatively impermeable bedrock (De Graff 1985). Exposureof this layer can bring large quantities of water to the surface(Seidelman et al. 1986). Such excavations also reduce the me-chanical support for adjacent parts of the slope. Tree roots areoften important in maintaining the integrity of a slope. Mini-mum strength occurs about ten years after fire or timberharvesting when roots from young trees have not yet com-pensated for the progressive loss of old roots (Ziemer 1981).Most opportunities to minimize mass wasting as a conse-quence of road construction and forest harvesting involvecommonsense approaches to avoiding accumulation of sub-surface water on steep slopes (Sidle 1980; McCashion and Rice1983).
In years of high precipitation with large individual storms,the number, extent, and size of mass movements increase wellabove those of years with modest precipitation. Landslideswere particularly active during the wet years of 1982 and 1983.In both those years, springs and seeps appeared in places theyhad not been noticed before, including many road cuts andfills. More than $2 million in damage occurred to roads onnational forests in the Sierra Nevada during 1982, and addi-tional damage estimated at more than $1 million occurred in1983 (De Graff 1987). A landslide in the American River can-yon blocked U.S. 50 for April, May, and June of 1983. Sus-tained high levels of soil moisture and ground water occurredthroughout the winter and spring of each year. Additionalwater input from rainfall, combined rainfall and snowmelt,and snowmelt alone triggered the unusual number of fail-ures (Bergman 1987; De Graff 1987). However, there seems tobe relatively little interaction between high flows and initia-tion of landslides within the inner gorges of Sierra Nevadastreams (Seidelman et al. 1986). Landslides can also be initi-ated by earthquakes (Harp et al. 1984) and summer thunder-storms (Glancy 1969). An extraordinarily intense stormoccurred in the headwaters of the South Fork of the Ameri-can River on June 18, 1982 (Kuehn 1987). About 100 mm (4 in)

876VOLUME I I , CHAPTER 30
of rain fell in 30 minutes and produced a peak flow of about200 m3/s/km2 (19,000 ft3/s/mi2). These values of precipita-tion intensity and specific runoff are records for the SierraNevada and well above values assumed to be the maximumpossible in the range (Kuehn 1987). The event also caused alarge debris torrent in a small basin that had been burned theprevious year.
Roads
Roads are considered the principal cause of accelerated ero-sion in forests throughout the western United States (Califor-nia Division of Soil Conservation 1971a; California Divisionof Forestry 1972; Reid and Dunne 1984; McCashion and Rice1983; Furniss et al. 1991; Harr and Nichols 1993). Roads de-stroy all vegetation and surface organic matter, minimize in-filtration and maximize overland flow, oversteepen adjacentcut-and-fill slopes to compensate for the flat roadbed, andintercept subsurface flow, directing more water across thecompacted surface (Megahan 1992). Stream crossings by roadsare particularly effective at increasing sediment yields becauseof their direct impact on the channel. Stream banks are exca-vated for bridges and filled for culverts. Failure of inad-equately designed and constructed culverts adds largeamounts of sediment to streams. Increases in fine sedimentand decreases in fish populations were associated with thenumber of culverts and roads near streams on the MedicineBow National Forest in Wyoming (Eaglin and Hubert 1993).A classic study in the granitic batholith of Idaho found thatsediment yields relative to an undisturbed forest increasedby 60% as a result of logging and by 220 times (22,000%) fromroad construction (Megahan and Kidd 1972). A compilationof studies in the Oregon Coast Range showed that the quan-tity of mass movements associated with roads was 30 to 300times greater than in undisturbed forest and was more than10 times greater than that associated with large clear-cuts(Sidle et al. 1985). Large highway projects also produce sig-nificant amounts of sediment, with fill slopes often provid-ing the most easily transported material (Howell et al. 1979).During major storms, highways are often damaged and pro-vide much sediment to streams. For example, during Febru-ary 1986, four serious debris flows in the Truckee River canyonclosed Interstate 80, and sixty-three road failures occurredalong 55 km (35 miles) of the Feather River Highway 70(McCauley 1986; Keller and King 1986).
Land Development
Construction activities also have the potential to increase ero-sion rates (California Division of Soil Conservation 1971a).Residential construction around Lake Tahoe has been a ma-jor contributing factor in accelerating erosion and increasingnutrient inputs to the lake (Tahoe Regional Planning Agency1988). In Nevada County, even by 1970, more than 35% of thelength of streams in the county had been damaged by silta-
tion and stream-bank erosion resulting from subdivision de-velopment (Gerstung 1970). Only a few examples of majorerosion are well documented. For example, erosion from asingle storm on freshly cleared land for a new subdivision inPlumas County killed 80% of the aquatic life in Big GrizzlyCreek (California Division of Soil Conservation 1971b). Sedi-ment from a failure of a channelization project for a new golfcourse largely filled Hunter’s Reservoir on Mill Creek (Cali-fornia Division of Soil Conservation 1971b).
Logging
Timber harvesting itself seems to have relatively little effecton soil erosion compared with the construction of roads usedfor log removal (see McGurk et al. 1996; Poff 1996). Althoughsoil disturbance associated with cutting trees and skiddinglogs exposes mineral soil to raindrop splash as well as to rilldevelopment where soils are compacted, in practice, compara-tively little soil leaves harvested areas. The California Divi-sion of Forestry (1972) has asserted that “timber harvesting,when done carefully with provisions made for future crops,has little adverse effect upon soil erosion, sedimentation, orwater quality.” During his evaluation of sedimentation fromhydraulic mining, Gilbert (1917) noted that erosional effectsof timber harvesting were minor compared to other, non-mining effects such as overgrazing and roads. Several factorsappear to mitigate potential adverse effects of harvesting: onlysmall and discontinuous areas are compacted to an appre-ciable extent; infiltration capacity is generally maintained overlarge areas; a lot of slash is left behind; and some type of veg-etation usually reoccupies the cutover land quickly. Anotherimportant factor to date has been the concentration of har-vests in the most productive sites and most accessible areas,which tend to be on relatively gentle slopes. As harvestingmoves to less desirable and steeper ground, risk of erosionand mass failure will increase. Avoidance of lands sensitiveto disturbance, such as slopes greater than 60%, streams withsoil-covered inner gorges, riparian areas, meadows, andknown landslides, will minimize erosion associated with tim-ber harvest (Seidelman et al. 1986).
Despite mitigating factors that can reduce logging-relatederosion, some harvest units lose large amounts of soil. Suchareas appear to be a minority, although their local effects canbe quite significant. The degree of soil compaction seems tobe a controlling influence on subsequent erosion (Adams andFroehlich 1981). Severe sedimentation in the West Fork of theChowchilla was noted after upstream areas were virtuallydenuded of vegetation to supply fuel for a smelter at theMariposa Mine about 1900 (Helley 1966). The headwaters ofLast Chance Creek on the Plumas National Forest had ero-sion rates from 150 to more than 300 m3/km2 (0.15 to 0.66AF/mi2) during a severe thunderstorm following a salvagesale in the Clark Fire area (Cawley 1991). A series of studiesof northern California streams, including some in the SierraNevada, found significantly greater amounts of fine sediments

877Hydrology and Water Resources
and altered benthic invertebrate communities downstream oflogged slopes (Erman et al. 1977; Newbold et al. 1980; Ermanand Mahoney 1983; Mahoney and Erman 1984). Some effectsof logging on streams were persistent for more than a decade(Erman and Mahoney 1983; O’Connor 1986; Fong 1991). Astudy of erosion rates from small plots recently started byRobert Powers of the Redding office of the Pacific SouthwestResearch Station of the U.S. Forest Service should improveour understanding of erosion processes and rates in the Si-erra Nevada.
Christmas tree plantations have been found to have veryhigh rates of erosion (Soil Conservation Service 1979). Man-agement for Christmas trees typically attempts to minimizeother ground cover that would compete for water and, there-fore, makes the plantations more vulnerable to erosion.
Measured Sediment Yields
Compared to other parts of California and the United States,the Sierra Nevada overall has relatively low sediment yields(Brown and Thorp 1947). A map of soil erodibility for Cali-fornia shows the absence of “very severe” ratings through-out the Sierra Nevada except for areas of western Plumas andeastern Butte Counties and in part of Yuba County, whereassuch ratings are common in the Coast Range (California Di-vision of Soil Conservation 1971a). General estimates shownon another statewide map show that the Sierra Nevada hasthe lowest sediment yield in California (generally less than100 m3/km2/yr [0.2 AF/mi2/yr]) (California Division of For-estry 1972). Sediment transport measurements in a variety ofstreams in the eastern Sierra Nevada were generally less than10 m3/km2 (0.02 AF/mi2), but there were exceptions of up to450 m3/km2 (0.9 AF/mi2) (Skau and Brown 1990). An esti-mate of annual sediment yield for the San Joaquin Basin abovethe San Joaquin valley based on a comprehensive geologicalinvestigation was about 38 m3/km2 (0.08 AF/mi2) (Janda1966). For comparison, an average value for the entire UnitedStates is 76 m3/km2 (0.16 AF/mi2) (Schumm 1963). The Colo-rado River Basin produces about 300 m3/km2/yr (0.6 AF/mi2/yr) and the Columbia River yields about 30 m3/km2/yr(0.06 AF/mi2/yr) (Holeman 1968). A compilation of sedimentstudies from forested regions provided an average rate ofabout 30 m3/km2/yr (0.06 AF/mi2/yr) from forest land inthe United States excluding the Pacific Coast Ranges (Patricet al. 1984). A Soil Conservation Service report classified sedi-ment yields below 150 m3/km2 as “low” with respect to na-tionwide rates (Terrell and Perfetti 1989).
The best means of determining sediment yields over longtime periods is with repeated bathimetric surveys of reser-voirs (Dunne and Leopold 1978; Hewlett 1982; Rausch andHeinemann 1984). Comparison of the bottom topography af-ter a span of a few years allows calculation of the change involume of sediment over the time interval (Rausch andHeinemann 1984; Jobson 1985; Mahmood 1987). Most of theinformation for the Sierra Nevada came from a Soil Conser-
vation Service study in the 1940s (Brown and Thorp 1947).This same data set has been republished many times (e.g.,Dendy and Champion 1978; U.S. Army Corps of Engineers1990; Kondolf and Matthews 1993), but there have been fewadditions to it. Until 1975, the Committee on Sedimentationof the Water Resources Council compiled data for reservoirsurveys throughout the United States (Dendy and Champion1978). Records of suspended sediment at water quality moni-toring stations reported by the U.S. Geological Survey werealso examined but did not prove to be useful. Almost all sta-tions are downstream of dams, and uncertainty resulting fromthe assumptions required to estimate annual totals wouldmask any trends over time.
Estimates of average annual sediment yields in the SierraNevada were compiled from all available sources (tables 30.3and 30.4). These values provide order-of-magnitude approxi-mations of sediment yield. The numbers should be consid-ered uncertain and may contain some serious errors resultingfrom the original measurements, assumption of inappropri-ate densities if reported as mass rather than volume, and con-version from some unusual units. The period of measurementvaries greatly between basins, resulting in different sedimentdelivery regimes depending on the inclusion of floods. Someof the values in tables 30.3 and 30.4 were based on total basinarea above the reservoir or measurement site, and others werebased only on the sediment contributing area not regulatedby upstream reservoirs and lakes. Tables 30.3 and 30.4 illus-trate that sediment yields vary considerably between riverbasins but that the generalizations mentioned above seemappropriate. Most reported values are less than 100 m3/km2/yr (0.2 AF/mi2/yr), which is the simple average of table 30.4.This value can be visualized as a tenth of a millimeter in depthover the entire contributing area, which is not how sedimentis produced, but the conversion is useful for illustration. Therelatively high sediment yields of the Kaweah and Tule aresomewhat surprising, especially in the Kaweah Basin, whichis largely in Sequoia National Park. However, this short pe-riod (1960–67) includes the massive floods of February 1963and December 1964, which would tend to bias the annual sedi-mentation rate.
Unfortunately, very few measurements of reservoir sedi-mentation have been reported in the past two decades. Theone-time measurements in isolation do not provide sufficientinformation or provide much confidence in using the valuesto infer differences between basins or over time. Comparisonof modern sedimentation rates with those summarized byBrown and Thorp (1947) would be very useful in determin-ing whether more intensive land management has alteredsediment yields at the basin scale. A highly detailed bathi-metric survey of Slab Creek Reservoir (in South Fork AmericanRiver Basin) in 1993 revealed less than 0.5 m of accumulationon the bed of the reservoir since 1968 but did not estimate thevolume of the deposit (Sea Surveyor, Inc. 1993). Crude esti-mates based on information provided in the report suggestan annual sediment yield less than 10 m3/km2 (0.02 AF/mi2).
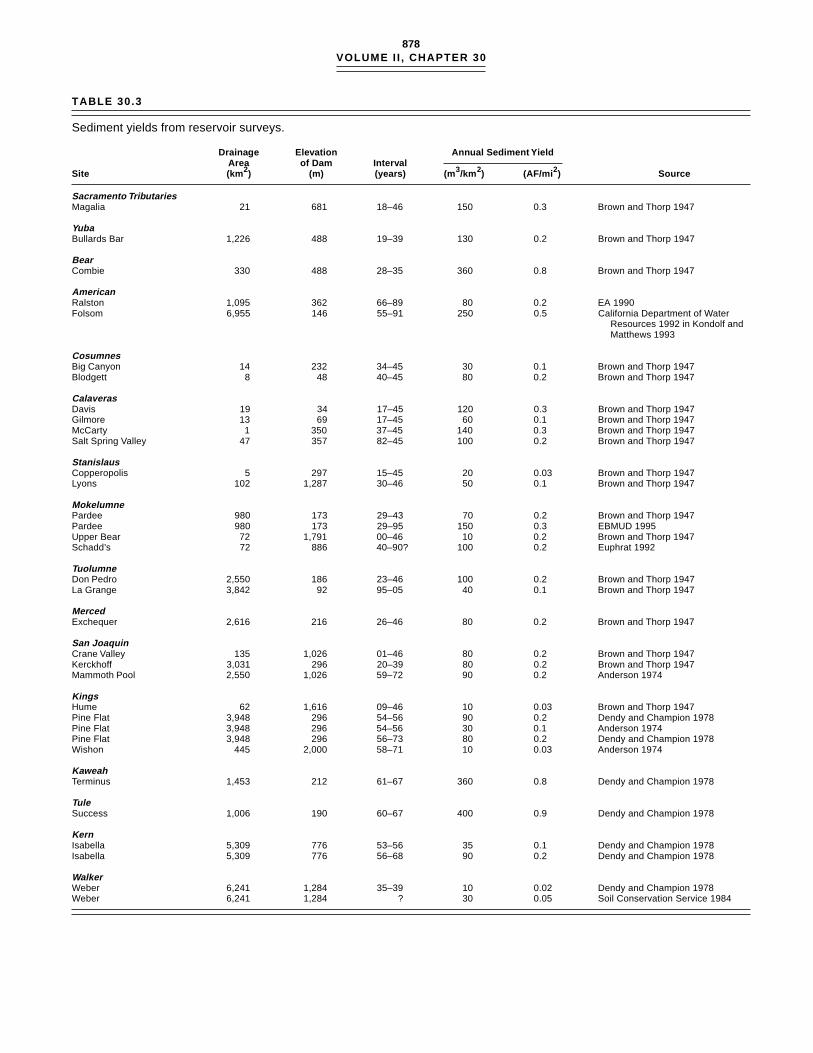
878VOLUME I I , CHAPTER 30
TABLE 30.3
Sediment yields from reservoir surveys.
Drainage Elevation Annual Sediment YieldArea of Dam Interval
Site (km 2) (m) (years) (m 3/km 2) (AF/mi 2) Source
Sacramento TributariesMagalia 21 681 18–46 150 0.3 Brown and Thorp 1947
YubaBullards Bar 1,226 488 19–39 130 0.2 Brown and Thorp 1947
BearCombie 330 488 28–35 360 0.8 Brown and Thorp 1947
AmericanRalston 1,095 362 66–89 80 0.2 EA 1990Folsom 6,955 146 55–91 250 0.5 California Department of Water
Resources 1992 in Kondolf andMatthews 1993
CosumnesBig Canyon 14 232 34–45 30 0.1 Brown and Thorp 1947Blodgett 8 48 40–45 80 0.2 Brown and Thorp 1947
CalaverasDavis 19 34 17–45 120 0.3 Brown and Thorp 1947Gilmore 13 69 17–45 60 0.1 Brown and Thorp 1947McCarty 1 350 37–45 140 0.3 Brown and Thorp 1947Salt Spring Valley 47 357 82–45 100 0.2 Brown and Thorp 1947
StanislausCopperopolis 5 297 15–45 20 0.03 Brown and Thorp 1947Lyons 102 1,287 30–46 50 0.1 Brown and Thorp 1947
MokelumnePardee 980 173 29–43 70 0.2 Brown and Thorp 1947Pardee 980 173 29–95 150 0.3 EBMUD 1995Upper Bear 72 1,791 00–46 10 0.2 Brown and Thorp 1947Schadd’s 72 886 40–90? 100 0.2 Euphrat 1992
TuolumneDon Pedro 2,550 186 23–46 100 0.2 Brown and Thorp 1947La Grange 3,842 92 95–05 40 0.1 Brown and Thorp 1947
MercedExchequer 2,616 216 26–46 80 0.2 Brown and Thorp 1947
San JoaquinCrane Valley 135 1,026 01–46 80 0.2 Brown and Thorp 1947Kerckhoff 3,031 296 20–39 80 0.2 Brown and Thorp 1947Mammoth Pool 2,550 1,026 59–72 90 0.2 Anderson 1974
KingsHume 62 1,616 09–46 10 0.03 Brown and Thorp 1947Pine Flat 3,948 296 54–56 90 0.2 Dendy and Champion 1978Pine Flat 3,948 296 54–56 30 0.1 Anderson 1974Pine Flat 3,948 296 56–73 80 0.2 Dendy and Champion 1978Wishon 445 2,000 58–71 10 0.03 Anderson 1974
KaweahTerminus 1,453 212 61–67 360 0.8 Dendy and Champion 1978
TuleSuccess 1,006 190 60–67 400 0.9 Dendy and Champion 1978
KernIsabella 5,309 776 53–56 35 0.1 Dendy and Champion 1978Isabella 5,309 776 56–68 90 0.2 Dendy and Champion 1978
WalkerWeber 6,241 1,284 35–39 10 0.02 Dendy and Champion 1978Weber 6,241 1,284 ? 30 0.05 Soil Conservation Service 1984

879Hydrology and Water Resources
Recent bathimetric surveys of Pardee Reservoir on theMokelumne River suggest that the average annual rate of sedi-ment deposition has more than doubled since the last surveyin 1943 (150 m3/km2 [0.3 AF/mi2]) (EBMUD 1995). Parts ofthe Mokelumne River Basin have been extensively roaded andlogged in the past few decades, and there has been much con-cern about apparent increases in sediment yield from someof the erodible soils (e.g., Euphrat 1992). These new resultsoffer evidence of a sedimentation response to large-scale dis-turbance of a forested basin. Much greater sedimentation ratesare apparent in Camanche Reservoir, downstream of Pardee.Additional studies are needed to determine the sources of
sediment trapped in Camanche. At rates of deposition sug-gested by the recent sediment surveys, half the original stor-age volume of Camanche would be lost in 380 years, and halfof the original storage volume of Pardee would be lost in 600years.
An Example of Disturbance Effects
The North Fork Feather River has perhaps the worst erosionand sediment problem of any large basin in the Sierra Ne-vada. Conditions were certainly much worse in several drain-ages during the hydraulic mining era and for following
TABLE 30.4
Sediment yields from suspended sediment records and other estimates.
Annual Sediment YieldDrainage
Site Area (km 2) (m3/km 2) (AF/mi 2) Source
FeatherOroville 9,244 90 0.2 Jansen 1956Oroville 9,244 100 0.2 U.S. Army Corps of Engineers 1990Oroville 9,244 120 0.3 Soil Conservation Service 1989East Branch North Fork 3,131 270 0.6 Soil Conservation Service 1989
YubaNonmining 160 0.3 Gilbert 1917Hydraulic mining 3,300 7 Gilbert 1917Castle Creek 10 70 0.1 Anderson 1979Castle Creek (logged) 10 220 0.5 Anderson 1979
AmericanAuburn dam site 2,485 130 0.3 U.S. Army Corps of Engineers 1990Cameron Park 70 0.2 Soil Conservation Service 1985Onion Creek 4 30 0.06 Dendy and Champion 1978
CosumnesMichigan Bar 1,098 30 0.06 Anderson 1979
StanislausNew Melones 2,314 60 0.1 U.S. Army Corps of Engineers 1990
MercedHappy Isles 463 3 0.01 Anderson 1979
ChowchillaBuchanan 40 0.1 Helley 1966
San JoaquinKerckhoff 40 0.1 Janda 1966
KingsTeakettle 7 10 0.02 Dendy and Champion 1978
Kern???? 2,613 150 0.3 Anderson 1979
TruckeeTahoe Basin 839 30–60 0.05–0.1 Tahoe Regional Planning Agency
1988Tahoe (in 1850) 839 3 0.01 Tahoe Regional Planning Agency
1988Upper Truckee 142 21 0.04 Hill and Nolan 1990General Creek 19 13 0.03 Hill and Nolan 1990Blackwood Creek 29 65 0.14 Hill and Nolan 1990Ward Creek 25 63 0.13 Hill and Nolan 1990Snow Creek 11 3 0.005 Hill and Nolan 1990Third Creek 16 20 0.04 Hill and Nolan 1990Trout Creek 95 12 0.03 Hill and Nolan 1990Squaw Creek 21 12, 93 0.03, 0.2 Woyshner and Hecht 1989Sagehen 28 2 0.005 Anderson 1979

880VOLUME I I , CHAPTER 30
decades until most of the debris was flushed into the lowerreaches of the river systems. Nevertheless, sediment produc-tion under current conditions in the North Fork Feather Rivercan be considered high compared with natural backgroundrates (Plumas National Forest 1988). A comprehensive evalu-ation of sediment sources in the basin found that about 90%of the erosion and about 80% of the sediment yield is acceler-ated (induced by human activities) (Soil Conservation Ser-vice 1989). That estimate and the current sediment yield ofabout 270 m3/km2 (0.6 AF/mi2) imply that under naturalconditions, sediment yield would be about 50 m3/km2 (0.1AF/mi2). The difference is caused mainly by bank erosionwhere riparian vegetation has been eliminated by overgraz-ing and erosion from road cut-and-fill slopes (Soil Conserva-tion Service 1989; Clifton 1992, 1994). Mining, logging, andovergrazing before 1900 initiated widespread changes in hy-drologic conditions of the land surface and channels. Gully-ing and channel erosion were noted by the 1930s (Hughes1934). After about 1940, stream channels widened rapidly withlittle reestablishment of riparian vegetation along new chan-nel banks. More than 75% of the stream length in the SpanishCreek and Last Chance Creek watersheds was found to beunstable and eroding (Clifton 1992). Bank erosion contributessediment directly into the streams, which in turn transport itto lower elevations. About one-third of the forest roads areeroding rapidly as well and often contribute sediment directlyinto streams where roads cross or run parallel (Clifton 1992).By contrast, sheet and rill erosion appear to produce very little(less than 2% of the total) of the sediment in the basin be-cause the nearly continuous vegetation cover protects the soil(Soil Conservation Service 1989). A cooperative effort amonglocal landowners, public agencies, Pacific Gas and ElectricCompany, and private individuals is attempting to reduceerosion throughout the basin (Wills and Sheehan 1994; Clifton1994). The Pacific Gas and Electric Company is involved be-cause it operates two small reservoirs in the canyon of theNorth Fork Feather River as part of its hydroelectric network.Sediment is rapidly filling the reservoirs, interfering withoperation of the control gates on the dams and acceleratingturbine wear (Harrison 1992). A costly program of dredgingand reconstruction of the dams to allow pass-through sluic-ing of sediment during high flows is being planned in addi-tion to participation in the upstream erosion control program(Pacific Gas and Electric Company 1994). A few other reser-voirs in the Sierra Nevada have filled with sediment and hadto be dredged. This topic is discussed further in the sectionon dams and diversions.
G RO U N D W AT E R
Ground-water storage is generally limited throughout theSierra Nevada compared with surface water resources. How-
ever, ground water is significant in providing small amountsof high-quality water for widely scattered uses, such as ruralresidences and businesses, campgrounds, and livestock wa-tering. Without ground water, the pattern of rural develop-ment in the Sierra Nevada would be quite different. Thegeology of the mountain range is not conducive to storage oflarge quantities of subsurface water. Ground water occurs infour general settings: large alluvial valleys; small deposits ofalluvium, colluvium, and glacial till; porous geologic forma-tions; and fractured rocks. The shallow aquifers tend to behighly responsive to recharge and withdrawals. The effectsof low precipitation in the recent drought cannot be readilyseparated from effects of increased pumping on decliningwater levels in some areas. Tens of thousands of wells tapground water throughout the Sierra Nevada for local and dis-tant municipal supply, individual residences, and recreationaldevelopments. Nearly one-quarter of all homes in the SierraNevada are supplied by private, on-site wells (Duane 1996a).More than 8,000 residents of Tuolumne County alone dependon wells for water supply. In 1982, there were about 5,800wells in Placer County, 6,100 in El Dorado County, 3,400 inAmador County, and 2,200 in Calaveras County (CaliforniaDepartment of Water Resources 1983a). Some of these wellswere west of the SNEP study area. Contamination appears tobe minimal overall (California State Water Resources ControlBoard 1992a).
Ground-Water Resources
A few ground-water basins in the Sierra Nevada store vastquantities of water, but they have limited recharge comparedwith some proposed exploitation plans. Honey Lake/LongValley has a capacity of about 20 billion m3 (16 million AF) inalluvial and lake sediments up to 230 m (750 ft) thick. Thequality is poor in some areas, with high concentrations ofboron, fluoride, sulfate, sodium, arsenic, and iron. Sierra Val-ley stores about 9 billion m3 (7.5 million AF) of water in sedi-ments up to 370 m (1,200 ft) deep. Hot springs occur in thecenter and southern part of the valley, and excessive amountsof boron, fluoride, and chloride have been found in somewells. Several schemes have been proposed for mining groundwater from both Sierra Valley and Long Valley for export toReno. Martis Valley contains about 1 billion m3 (1 million AF)of water, is an important water source for the Truckee area,and has the lowest concentration of total dissolved solids (60–140 mg/l) of any large ground-water basin in the state. Bycontrast, ground water in the 4 billion m3 (3.4 million AF)volume Mono basin is highly mineralized. The Owens Valleyis the largest ground-water basin partially within the SNEPstudy area, with a storage capacity of about 47 billion m3 (38million AF). Export of ground water from the Owens Valleyto southern California began in 1970. This ground-water de-velopment led to declines of ground water dependent veg-etation (e.g., Groeneveld and Or 1994) and continues (as of1995) to be the subject of negotiations between Inyo County

881Hydrology and Water Resources
and the City of Los Angeles. Smaller alluvial valleys includeIndian and American Valleys of the Feather River Basin, TahoeValley in the upper Truckee River Basin, Slinkard and Bridge-port Valleys of the Walker River Basin, and Long Valley inthe Owens River Basin.
Many wells in the Sierra Nevada are located in shallowdeposits of glacial till, alluvium, and colluvium. These surficialdeposits, which are often only a few tens of meters deep (Pageet al. 1984; Akers 1986), are fairly porous and convey water tostreams. Deeper deposits are capable of serving the needs ofsmall communities but may be sensitive to recharge condi-tions. Placer County (1994) has determined that ground wa-ter in the foothills is not a reliable source of water for futuregrowth.
Some rocks and other geologic formations, like buried riverchannels, are relatively porous and transmissive. Hydro-geologic properties of these formations are highly variable,as are well yields. Locating a well is often hit-or-miss, butdrillers familiar with an area can usually find sources of wa-ter adequate for residential use. Mixed results have been ob-tained in recent drilling through the complex layers of till,volcanic ash, and basalt found in the Mammoth Lakes area.Some wells have been highly productive, and others havequickly gone dry.
Granitic and metamorphic rocks of the Sierra Nevada areessentially impermeable except where fractured. In some lo-cations, the joint and fracture systems can transmit signifi-cant quantities of water. A recent study in the Wawona areaof Yosemite National Park investigated fracture systems andthe regional movement of deep ground water (Borchers et al.1993). Most wells in southwestern Nevada County, and pre-sumably in other parts of the foothills with similar geology,are located in areas of fractured rock (Page et al. 1984). Ofsome 13,000 wells drilled in Placer, El Dorado, Amador, andCalaveras Counties between 1960 and 1982, more than 90%were located in hard rock (California Department of WaterResources 1983). The size and frequency of fractures declinewith depth away from the surface, so the more productivewells in Nevada County have been less than 60 m (200 ft)deep. Mean yield in that study area was less than 70 l/min(18 gal/min) (Page et al. 1984), with about half the wells yield-ing less than 38 l/min (10 gal/min) (California Departmentof Water Resources 1974). Average well yields determinedfrom drillers’ logs were less than 80 l/min (20 gal/min) inboth Nevada and Amador Counties (Harland Bartholomewand Associates et al. 1992; California Department of WaterResources 1990a). Wells in Tuolumne County are often morethan 90 m (300 ft) deep and are adequate for domestic use.The drought between 1987 and 1992 limited recharge through-out the Sierra Nevada, and yields of many wells declinedthrough the period. There is insufficient information avail-able to determine whether the proliferation of wells through-out the foothills in the past decade has had a pronounced effecton preexisting wells.
Pumping of water for industrial uses has lowered water
tables in western Tuolumne County (comments by TuolumneUtility District in DEIS on Yosemite Estates). Ground-waterpumping can also impact local stream flow. Interactions be-tween ground water and streams are very complex in someareas of the Sierra Nevada where glacial till is interlayeredwith volcanic mudflows and ash and is dissected by oldstream courses and faults (Kondolf and Vorster 1992). Drill-ing of supplemental water-supply wells for Mammoth Lakesraised concerns that pumping could further reduce flows inMammoth Creek, which is already diverted as the principalwater source for the town (Kattelmann and Dawson 1994).
In a small lake basin in the alpine zone of Sequoia NationalPark, water released from short-term subsurface storage ac-counted for less than 15% of the annual stream-flow volume,but it controlled the chemistry of stream and lake water formore than two-thirds of the year (Kattelmann 1989b).
Springs are an important water source for small demandsthat require minimal development. Because springs are oftenfed by shallow aquifers, they are more susceptible to contami-nation than deep sources and often require protection of theircontributing areas. Dense vegetation resulting from decadesof fire suppression may maximize transpiration losses fromhill slopes above springs, thereby reducing spring flow. De-veloping springs as a water source usually alters or even elimi-nates riparian and aquatic habitat in the immediate area.Springs are one of the most threatened habitats in the SierraNevada (see Erman 1996). Springs as well as pumped waterare commercially developed for packaging as mineral water.Bottled water operations are present in the northern andsouthern Owens Valley.
Ground-Water Quality
The mineral content of ground water is generally much higherthan that of surface water. The long residence time of waterin the ground allows it to dissolve minerals and accumulateions. Nevertheless, total dissolved solids in ground water inthe Sierra Nevada are usually not an impediment for use.Deeper ground water in parts of the Honey Lake/Long Val-ley Basin and the Mono basin and below Mammoth Lakescontain substantial concentrations of various ions. Concen-trations of naturally occurring iron are sometimes too highfor domestic uses (Thornton 1992; Placer County 1994). Somewells in Kern Valley have very high levels of fluoride. Shal-low ground water may be contaminated with nutrients fromseptic and sewage disposal systems, livestock, and chemicalsapplied to farms and gardens. Nutrients found in groundwater in the Lake Tahoe Basin were relatively low in an abso-lute sense, but they still contributed to enrichment of the lakewaters (Loeb and Goldman 1979). Water quality problems ofthe larger ground-water basins in the Sierra Nevada identi-fied in the biennial state water quality assessment includeddrinking water impairment from heavy metals, fuel leaks,volatile organic compounds, naturally occurring radioactiv-ity, pesticides, and wastewater (California State Water Re-

882VOLUME I I , CHAPTER 30
sources Control Board 1992a). Some wells in the foothills ofthe southern west slope of the Sierra Nevada have been foundto contain concentrations of uranium, radon, and radiumabove state health standards (California Department of Wa-ter Resources 1990b). Water in certain hot springs has highlevels of natural radioisotopes. High levels of radionuclideshave also been found in wells of the Lake Tahoe Basin (Cali-fornia Department of Water Resources 1994).
The leaking underground storage tank problem has prob-ably introduced fuels to ground water in isolated spotsthroughout the Sierra Nevada. Gasoline contamination hasbeen documented in Bishop, Mammoth Lakes, Bridgeport,and Placer County. Tetrachloroethylene, a solvent used in drycleaning, was found in two municipal wells in East Sonora.The wells were removed from service, and an expensive ex-tension to surface water supply was installed. Old landfillsare another potential source of contamination.
M I N I N G
Historically, mining had the most intense impact on rivers ofthe Sierra Nevada. As discussed in the history section, hy-draulic mining for gold until 1884 truly wreaked havocthroughout the Gold Country. Affected streams and hill slopeshave been recovering ever since. In most cases, the degree ofrecovery is remarkable. Much of the region appears to havehealed over the past century. In terms of their more obvioushydrologic and biologic characteristics, the streams have im-proved dramatically compared to photographs and descrip-tions of the nineteenth century. Stream channels are nowlargely free of mining sediment, although large deposits re-main as terraces (James 1988). Riparian vegetation has becomereestablished. Aquatic biota have returned to the streams, atleast partially. Some fish species that would be expected arenot present in rivers heavily impacted by mining (Gard 1994).We can assume that the present form of the ecosystems is sim-plified compared to the pre–gold rush situation, but we re-ally do not know what the west slope of the Sierra Nevadamight have looked like had gold not existed in the range.Unfortunately, the Gold Country was so heavily mined that“natural” streams are not available for comparison. Portionsof streams that were lightly impacted could be compared tothose that were heavily impacted, but doubt would remainabout what constitutes “natural” conditions. The waterprojects initiated during the mining period and other associ-ated land uses have further modified the hydrologic system.
Legacy of Hydraulic Mining
After the 1884 Sawyer decision and the 1893 Caminetti Act,hydraulic mining continued on only a sporadic basis wherethe debris could be kept on-site. Mines in three old hydraulic
pits in the Yuba River Basin were active in the late 1960s: nearFrench Corral, Birchville, and North Columbia (Yeend 1974).A few such mines continue operation today. When the origi-nal mines closed, there was no attempt at site reclamation,and the mines were simply abandoned. A variety of damswere constructed in attempts to prevent further movementof mining debris downstream (Rollins 1931). Only the larger,better-engineered structures did not fail. Dams such asCombie on the Bear, Englebright on the Yuba, and North Forkon the American have restrained vast amounts of mining de-bris from washing downstream to the Sacramento valley. Anattempt to destroy a debris dam on Slate Creek with explo-sives was made in the 1960s by miners desiring another op-portunity to recover gold. The initial bombing failed, but thestructure is damaged and loses sediment during floods(Kondolf and Matthews 1993). Also along Slate Creek, awooden wall retaining a large volume of mining debris ap-peared ready to fail in 1994. The hydraulic mine pits are slowlybecoming revegetated, but they continue to release unnatu-rally high volumes of sediment as their walls continue to col-lapse until a stable slope angle is attained (Senter 1987). Theunnaturally high sediment loads continue to affect aquaticbiota (Marchetti 1994). A large open-pit gold mine that wasoperated at Jamestown until 1994 offers the first major op-portunity for modern reclamation technology to be appliedto a recently closed mine in the Sierra Nevada. The pit mayalso be used as a garbage dump. Current mineral potentialsare discussed in Diggles et al. 1996.
Dredging
Massive riverbed dredging operations at the lower marginsof the foothills persisted until 1967 (Clark 1970). The spoilpiles may remain as a peculiar landscape feature for centu-ries. Some of the tailings in the Feather River were used inconstruction of the Oroville Dam, and other uses of the mate-rial and the land may be found. Small-scale suction dredgingcontinues in many streams of the Gold Country. This activityhas become widespread wherever there is easy access to thestreams (McCleneghan and Johnson 1983). Powerful vacuumsmounted on rafts remove stream gravels from the bed forseparation of any gold particles, and the waste slurry is re-turned to the river, where the plume of sediment stratifies inthe flowing stream. Turbidity obviously increases, and thestructure of the bed is rearranged. The morphology of smalltributaries can be dramatically altered by suction dredging(Harvey 1986; Harvey et al. 1995). Where stream banks areillegally excavated, the potential for damage is much greater.A study of effects of suction dredging on benthic macro-invertebrates showed local declines in abundances and spe-cies richness, but biota rapidly recolonized the disturbed sitesafter dredging stopped (Harvey 1986). Although dredgingseems to have relatively little impact on adult fish, eggs andyolk-sac fry and amphibians within the gravel are usuallykilled by dredging (Johnston 1994). Dredging also has the

883Hydrology and Water Resources
potential to reintroduce mercury stored in sediments contami-nated by early mining (Harvey et al. 1995; Slotten et al. 1995).
Underground Mining
Hard-rock mining often releases hazardous materials toground water and streams. The nature and impacts of someof the typical mine effluents are reviewed by Nelson et al.(1991). Excavation of hard-rock mines exposes tunnel wallsand tailings to water and oxygen and vastly increases the re-active surface area of minerals, allowing chemical reactionsto occur at much faster rates than if undisturbed. If the minesor their waste piles contain sulfide minerals, oxidation in theflowing water can release sulfuric acid and metals into thedrainage water. Exposure as a result of mining also allowsreaction products to be leached from tailings piles or aban-doned mines. Contaminated water can be flushed into streamsin sudden pulses during storm runoff or slowly during baseflow. In some cases, these products are highly toxic, and therunoff is acidic. The downstream extent of impacts alongstreams seems to depend on interactions between source con-centrations, hydrologic characteristics of the mine or wasterock, storm characteristics, chemical behavior of the particu-lar constituents, bacterial influences, presence of other sub-stances as complexing agents, and dilution potential of thereceiving waters. Fortunately, the mineralogy and geochem-istry of most mines in the Sierra Nevada have resulted in rela-tively few serious surface-water problems (Montoya and Pan1992). However, exceptions such as the Leviathan, Walker,and Penn mines have seriously degraded downstream areas.The substrate of a housing development built on tailings ofthe Central Eureka mine near Sutter Creek contains arseniclevels about seventy-five times greater than average valuesfor soils in California. Discharge from mine dewatering andfrom rejuvenation of closed mines probably released toxicmaterials into nearby streams. Abandoned pits often fill withwater and attract waterfowl and other wildlife. If the watercontains toxic materials, these substances can enter the foodchain.
Water Quality Impacts
An inventory of mines causing water quality problems hasbeen developed by the Central Valley Regional Water Qual-ity Control Board (1975). Mines in the Sierra Nevada includedon that list appear in table 30.5. All except two are under-ground mines. The list is evenly split between gold minesand mines for other minerals, chiefly copper.
A more recent survey by the Central Valley Regional Wa-ter Quality Control Board (Montoya and Pan 1992) limited tothe Sacramento valley investigated thirty-nine inactive minesfrom Butte Creek to the American River. Water quality ofthe drainage from these mines and waste piles was highlyvariable between mines and over time. For example, copperconcentrations below the Spenceville mine on Dry Creek
southwest of Grass Valley were up to eight times higher thanEPA standards in the first hours of a rainfall-runoff event andthen decreased with time. Such sudden spikes in concentra-tions may be harmful to aquatic life but are rarely capturedin water quality sampling. Many of the adits of the differentmines were dry when visited and were not releasing contami-nants. Most of the mines studied in the Yuba River Basin werereleasing high levels of arsenic because the gold in this re-gion is associated with arsenopyrite minerals. Otherwise,mine runoff in this area was typically clear and was not acidic.Gold mines in the Bear River Basin were similar to those inthe Yuba, but copper mines had acidic discharge with highlevels of copper, zinc, cadmium, and other metals. Mines inthe lower American River Basin near Folsom Lake were dryand did not appear to have serious water quality problems.The study demonstrated that surface-water quality problemsassociated with mines are highly site specific. Insufficientground-water monitoring has been done in the vicinity ofmines in the Sierra Nevada to identify potential problems.
The amount of mercury used in gold extraction in the Si-erra Nevada and largely lost to soils and streams has beenestimated at 3.4 million kg (7.6 million lb) (Central ValleyRegional Water Quality Control Board 1987). Mercury isknown to exist in streams below gold-ore processing sites;however, the bioavailability of mercury in the Sierra Nevadais not well understood. A survey found elevated concentra-tions of mercury in the upper tributaries of the Yuba, Bear,Middle Fork Feather, and North Fork Cosumnes Rivers
TABLE 30.5
Mines cited by the Central Valley Regional Water QualityControl Board (1975) as degrading local water quality.
Mine Receiving Stream
Cherokee Sawmill Ravine / Dry Creek / Butte CreekMineral Slide Little Butte Creek / Butte CreekChina Gulch Lights Creek / Wolf Creek / North Fork Feather
RiverEngel Lights Creek / Wolf Creek / North Fork Feather
RiverIron Dyke Taylor Creek / Indian Creek / Wolf Creek / North
Fork Feather RiverWalker Little Grizzly Creek / Indian Creek / Wolf Creek /
North Fork Feather RiverKenton Kanska Creek / Middle Yuba RiverMalakoff Diggings Humbug Creek / North Fork Yuba RiverPlumbago Buckeye Ravine / Middle Yuba RiverSixteen to One Kanska Creek / Middle Yuba RiverDairy Farm Camp Far West Reservoir / Bear RiverLava Cap–Banner Little Clipper Creek / Greenhorn Creek / Rollins
Reservoir / Bear RiverAlhambra Shumway Rock Creek / South Fork American RiverCopper Hill Cosumnes RiverNewton Copper Creek / Sutter Creek / Dry Creek /
Mokelumne RiverArgonaut Jackson Creek / Dry Creek /Mokelumne RiverPenn Mokelumne RiverEmpire Copper Creek / Black Creek / Tulloch
Reservoir / Stanislaus RiverKeystone Penny Creek / Sawmill Creek / Black Creek /
Tulloch Reservoir / Stanislaus River

884VOLUME I I , CHAPTER 30
(Slotten et al. 1995). The heavy metal is readily trapped inreservoir sediments, and lower concentrations have beenmeasured below reservoirs than above (Slotten et al. 1995).Mercury concentrations exceeded 0.5 mg/kg in sedimentsamples obtained from Camp Far West Reservoir, Lake Wild-wood, Lake Amador, and Moccasin Reservoir (Central Val-ley Regional Water Quality Control Board 1987). Certainbacteria can convert metallic mercury to a methylated formthat can be incorporated in tissue. Mercury tends to accumu-late in the food chain. Although the opportunity for bacterialmercury methylation is minimized in cold, swift streams, theprocess can occur in the calm waters of reservoirs (Slotten etal. 1995). However, the reservoirs do not appear to be net ex-porters of bioavailable mercury. Instead, they seem to be sinksfor both bioavailable and inorganic mercury (Slotten et al.1995). Tissue samples of fish caught in the Yuba River con-tained more than 1 mg/kg, and samples exceeding 0.5 mg/kg were found in fish caught in Pardee, Don Pedro, andMcClure Reservoirs (Central Valley Regional Water QualityControl Board 1987). A National Academy of Sciences reportsuggests that mercury amounts in tissue exceeding 0.5 mg/kg may be injurious to animals.
The Penn mine near the lower Mokelumne River has beenconsidered one of the worst abandoned-mine problems in theSierra Nevada. The mine was opened in 1861 and operatedcontinuously until 1919 and then sporadically until the 1950s.Copper and zinc were the primary products of the mine (Heylet al. 1948). More than 16,000 m (55,000 ft) of tunnels and theassociated spoil provide the opportunity for percolatingground water to become acidic and leach zinc, copper, andcadmium from the mine. Flushing of some of the mine shaftsin 1937 killed fish for 100 km (60 mi) downstream. A series ofretention ponds were constructed and other attempts weremade to restrict movement of the contaminants into the riverin the 1980s, but they have had limited effectiveness (Califor-nia State Lands Commission 1993). Until 1929, water drain-ing from the mine into the Mokelumne River was diluted bythe large volume of discharge. However, after the construc-tion of Pardee Dam by the East Bay Municipal Utility Districtand export of up to one-third of the annual volume of theriver upstream of the mine, concentrations of contaminantsin the Mokelumne increased (Slotten et al. 1994). The dam forCamanche Reservoir just downstream of the mine was com-pleted in 1964. Toxic materials leached from the mine arestored in sediments trapped by the dam. The potential forresuspension of the metals is minimal as long as water levelsare kept relatively high (Slotten et al. 1994). In December 1993,the Environmental Protection Agency ordered the East BayMunicipal Utility District to control pollution from the mine.However, the utility contends that it is not responsible for themine, which was last operated by the federal governmentduring the Korean War.
The Leviathan mine provides another example of a waterquality problem resulting from an abandoned operation. Acopper and sulfur mine on Leviathan Creek in the Carson
River Basin near Monitor Pass was started by the AnacondaCopper Company in 1953. Overburden was dumped in thestream channel, causing the water to percolate through thematerial. Below the stream blockage, the water is highly acidicand polluted with toxic materials. The stream was sterile be-low the mine during the 1950s. In 1969, an isolated popula-tion of rainbow trout still existed in the unpolluted portion ofLeviathan Creek above the mine. Below the mine, fish andmacroinvertebrates were absent from 18 km (11 mi) of streamaffected by the mine drainage. The effects of the pollutioneven extend for 3 km (2 mi) in the East Fork of the CarsonRiver below the confluence with the contaminated creek(Davis 1969; Hammermeister and Walmsley 1985). Attemptsat revegetating the spoils began in the 1970s (Everett et al.1980).
Reclamation
California’s Surface Mining and Reclamation Act of 1975 andamendments should prevent future disasters (Pomby 1987),but remediation of past problems requires massive invest-ments. Even ascertaining the location of abandoned minesremains problematic (Desmarais 1977). Sealing of much of theWalker mine, a notorious problem in Plumas County, in 1987significantly lowered copper concentrations in receiving wa-ters and allowed partial recolonization of formerly sterilereaches by macroinvertebrates (Bastin et al. 1992). There isalso a major question of liability in cleanup efforts. Currentlaw holds those attempting remediation to be liable for anydamage caused by their activities or, presumably, failure ofthe project to solve the problem. Therefore, under the cloudof legal liability, little action is undertaken by private or pub-lic agencies (California State Lands Commission 1993). Scoresof small mines have been established under the terms of theantiquated 1872 Mining Act. In many cases, the propertiesare sources of sediment and toxic chemicals. Reform of por-tions of the Mining Act could finally alleviate some major landand water management problems associated with mining.Conversely, legislation has been introduced in California toweaken the state’s regulations regarding reclamation of minedland.
Future Prospects
Changes in mineral economics and technology and new dis-coveries may lead to new mines. Reactivation of a large un-derground gold mine near Grass Valley has been proposed.Water pumped out of that mine would probably require thor-ough treatment before it could be discharged. In the easternSierra Nevada, the tungsten mine in Mt. Morgan on Pine Creekhas been maintained on a standby basis awaiting an increasein the price of the metal. Reactivation of gold mines at Bodieand Independence Creek have been explored in recent years.A disseminated gold deposit in Long Valley near MammothLakes has been identified through exploratory drilling in
885Hydrology and Water Resources
1989–94. About one part per million of the ore is gold, whichcould be recovered through massive excavation and cyanideheap-leach processing.
Aggregate Mining
Sand and gravel are the most economically important nonfuelminerals mined in California. The $560 million value of sandand gravel produced in California in 1992 far surpassed thecombined total value of all metallic minerals mined in thestate (McWilliams and Goldman 1994). More aggregate is usedper capita in California than in any other state, and the StateDepartment of Transportation is the largest single consumer(California State Lands Commission 1993). Because aggre-gates are fundamental to most types of modern construction,they are used in almost every building and roadway project.The widespread demand and high transport costs of sand andgravel make aggregate production a highly dispersed min-ing activity (Poulin et al. 1994). Each 40 km (25 mi) of trans-port doubles the cost as delivered (California State LandsCommission 1993), so sources near the construction site arehighly desirable. Materials excavated from stream depositstend to be durable and have relatively few impurities and,therefore, are favored over hill slope deposits (Bull and Scott1974).
Excavation within stream channels will obviously havedirect effects on the fluvial system (Sandecki 1989; Kondolfand Matthews 1993). Removal of part of the streambed altersthe hydraulic characteristics of the channel and interrupts thenatural transport of bedload through the stream. The mostimmediate consequence is degradation of the bed both up-stream and downstream. Creation of a hole in the streambedmakes the channel locally steeper and thereby increases theshear stress on the bed. Erosion of the bed will propagateupstream as additional sections become steeper and erodeprogressively (Collins and Dunne 1990). The initial pit alsoserves as a bedload trap and relieves the stream of part of itsload. The flowing water will then have greater availability toerode the bed in the downstream direction (Kondolf andMatthews 1993). The downcutting reduces the proportion ofsmaller sediments and can produce a bed composed of cobblesand boulders. Some stream reaches can lose their deposits ofgravels that are suitable for fish spawning. The deeper chan-nel can lower the local water table and kill riparian vegeta-tion as the former floodplain dries out. Loss of the vegetationin turn makes the banks more susceptible to erosion. Incisionof the channel limits the opportunity for overbank floodingto deposit sediments on the floodplain. These combined ef-fects can result in dramatic changes in the overall form andstructure of the channel and dependent aquatic and riparianhabitat (Collins and Dunne 1990; Kondolf and Matthews1993). Human structures in the channel such as bridges, cul-verts, pipelines, and revetments may be damaged by the geo-morphic changes.
Gravel is also mined from streams by skimming a shallow
layer off of gravel bars. Depending on the flow regime, dis-tribution of particle sizes, and opportunities for establishmentof riparian vegetation, a variety of complex channel and veg-etation responses may occur (Kondolf and Matthews 1993).Mining of terrace deposits and abandoned channels can beproblematic if the channel shifts enough to reoccupy the ex-cavated areas. A swiftly flowing stream can be converted intoa series of giant ponds if the floodplain and terraces are ex-tensively excavated and then captured by the stream. Part ofthe lower Merced River suffered such a conversion in 1986with serious impacts on a salmon population (California StateLands Commission 1993). Abandoned gravel pits and quar-ries well above the stream channel can also act as majorsources of sediment input to streams (California Division ofSoil Conservation 1971a).
The number and location of in-stream gravel operations inthe Sierra Nevada is unknown, but large mines have beenidentified on the East Branch of the North Fork of the Feather,Middle Feather, North Yuba, Yuba near Camp Far West Res-ervoir, Bear, lower American, and Calaveras below NewHogan Dam (California State Lands Commission 1993). Amajor gravel mine operating on Blackwood Creek in the Tahoebasin increased sediment yield from the watershed about four-fold (Todd 1990). Smaller operations are assumed to be wide-spread throughout the Sierra Nevada. Reservoir deltas appearto be an environmentally benign source of aggregate, and re-moval would extend reservoir capacity. The delta of theCombie Reservoir on the Bear River has been mined for sandand gravel since 1946 (Dupras and Chevreaux 1984). Mininghas occurred on the delta of Rollins Reservoir upstream fromCombie (James 1988). Gold was recovered from sand andgravel operations during the construction of Friant Dam onthe San Joaquin River in 1940–42 (Clark 1970).
Geothermal Resources
Geothermal energy is another subsurface resource that haspotential adverse impacts on water resources when devel-oped. Heat can be extracted from portions of the earth’s crustthat are unusually warm and close to the surface by pump-ing out hot water and using its heat to vaporize another fluidthat drives turbines, which generate electricity. During the1970s, many parts of the Sierra Nevada were explored forgeothermal potential. Monache Meadows on the Kern Pla-teau was proposed for large-scale development. Geothermalenergy in the Sierra Nevada has been developed most exten-sively in Long Valley near Mammoth Lakes. The large com-plex of geothermal power plants, located at Casa Diablo nearthe junction of Highways 395 and 203, had a capacity of morethan 30 megawatts in 1991. The power plants operate as acompletely closed system, reinjecting the water after some ofits heat has been removed. After several years of operation,changes in nearby hot springs have been observed, and ef-fects are suspected but not proven at springs feeding a fishhatchery downgradient. Additional geothermal development

886VOLUME I I , CHAPTER 30
is being considered near Casa Diablo, Mono Craters, andBridgeport Valley in Mono County.
D A M S A N D D I V E R S I O N S
Impounding and diverting of streams are the principal im-pacts on the hydrologic system of the Sierra Nevada. Whileother resource management activities cause environmentalalterations that, in turn, may affect stream flow, water manage-ment activities avoid the intermediate steps and in-tentionally and directly alter the hydrologic regime. The thor-oughness of the hydraulic engineering in the Sierra Nevadathat has been developed over a century and a half is probablyunderestimated by most water users in California. However,one simple fact stands out: no rivers reach the valley floorunaltered. Only three Sierra Nevada rivers greater than 65km (40 mi) long flow freely without a major dam or diver-sion: Clavey, Middle Fork Cosumnes, and South Fork MercedRivers (figures 30.2–30.4). Selected segments of the North ForkAmerican, Middle Fork Feather, Kern, Kings, Merced, andTuolumne Rivers receive some protection from additionaldams under the National Wild and Scenic River System(Palmer 1993). Few streams get very far from their sourcebefore meeting some kind of structure. In the Mono Lake andOwens River Basins, about 730 km (460 mi) out of 850 km(530 mi) of streams are affected by water diversions (InyoNational Forest 1987). In California’s Mediterranean climate,water is most available in winter and spring. Dams are builtto reduce the peak flows of winter, provide irrigation waterduring the growing season, provide domestic and industrialwater on a semiconstant basis, allow optimum hydroelectricgeneration, and secure some interannual storage for protec-tion against drought. With so many uses of water, attemptsto manage it are found throughout the Sierra Nevada.
Structures
The total number of water management structures in the Si-erra Nevada is unknown but must be in the thousands. Thestorage capacity of all dams in the range is about 28 billionm3 (23 million AF), which is about the average annual streamflow produced in the range. The dozen largest reservoirs (eachwith capacity greater than 500 million m3 [400,000 AF]) ac-count for about three-fourths of the rangewide storage ca-pacity. The smallest dams in the Sierra Nevada are those builtfor minor domestic water supply on small creeks and mayimpound only a few cubic meters of water. Somewhat largerdams have augmented natural lakes and were often built forfisheries management purposes. Most of these dams were con-structed before World War II, but a few continued to be builtup to the 1960s. Their main purpose was to store water forreleases in late summer to maintain some stream flow for fish
survival. About thirty such dams were built on the EldoradoNational Forest (1980).
Dams are constructed in a great range of sizes for variouspurposes. Dams of a few meters’ height are found through-out the Sierra Nevada to improve hydraulic conditions fortunnel intakes diverting water for municipal supply or irri-gation or toward powerhouses. Such dams or weirs are notintended to have any effect on the seasonal pattern of streamflow. Dozens of small dams for small-scale hydroelectric pro-duction were proposed throughout the Sierra Nevada underthe favorable climate created by the Public Utility Regula-tory Policy Act of 1978 (California Energy Commission 1981).Many of these projects were ill conceived and were based onunrealistically high projections of future energy prices. Onlya small proportion of those proposed were ever built. Severalexisting and proposed hydroelectric projects are being recon-sidered by their owners or proponents because of currentlylow prices for electricity. The larger diversion dams can storestream flow accumulated over a few days. Dams intended toredistribute water over time have storage capacities equiva-lent to the stream flow of at least several weeks. A few of themegaprojects can hold more water than is produced in anaverage year. These massive structures account for most ofthe storage in an entire river basin. For example, the NewMelones Reservoir has 84% of the total storage capacity inthe Stanislaus River Basin, while the next largest forty damsin the basin represent only the remaining 16% (Kondolf andMatthews 1993). The dam at Lake Tahoe controls only 1.8 m(6 ft) of storage, but the vast area of the lake makes its storagevolume the ninth largest in the Sierra Nevada. The big damsin the Sierra Nevada cause many of the same problems asother large dams in the western United States (e.g., Haganand Roberts 1973). These dams prevent the further migrationof anadromous fish and completely change the water andsediment regimes downstream. The combined effects of allthe large dams on rivers tributary to the Sacramento Riverhave significantly modified the annual hydrograph of the larg-est river in the state (Shelton 1994).
The other critical structures in water management are theconduits and canals for transferring water between rivers orto powerhouses or users. The vast network of artificial wa-terways redistributes water over short and long distances. Awater molecule can take a very circuitous journey from themountainside to the valley through several pieces of theplumbing system. Many of the old ditches and canals origi-nally constructed during the mining era and that still supplywater for hydroelectric generation, municipal use, or irriga-tion have become a secondary channel system. They bothcollect water from and discharge water to soils and slopes. Ina 160 km (100 mi) long canal network in El Dorado County,about half of the initial water plus any gains en route are lostto seepage (Soil Conservation Service 1984). Water-supplyagencies have sought to increase the efficiency of their an-tique delivery systems by reducing seepage from the oldditches. Replacement of the open ditches with pipes avoids
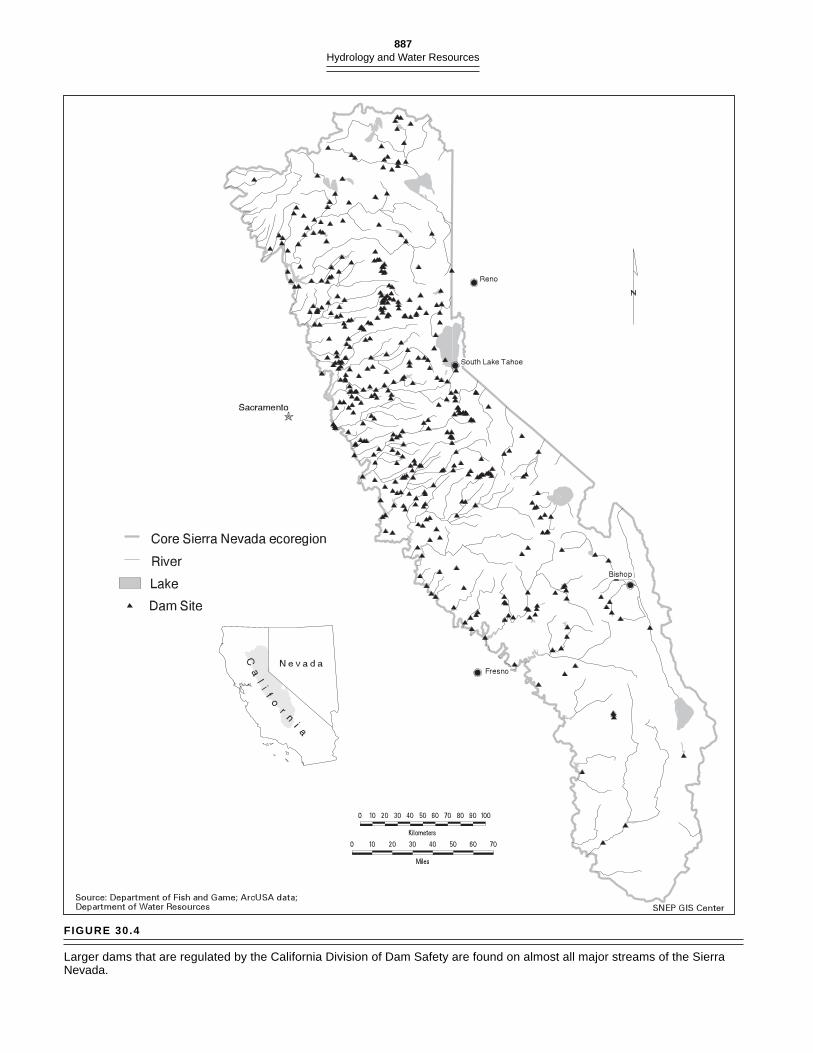
887Hydrology and Water Resources
FIGURE 30.4
Larger dams that are regulated by the California Division of Dam Safety are found on almost all major streams of the SierraNevada.

888VOLUME I I , CHAPTER 30
Mostly Snowmelt and Autumn Rain: Merced River at Happy Isles, 1200 m, 460 sq. km.,1967
0
500
1000
1500
2000
2500
3000
3500
4000
Snow and Glacier Melt Only: Maclure Creek, 3500 m, 0.9 sq. km.,1967
0
2
4
6
8
10
12
14
16
Rainfall and Snowmelt: South Fork Merced River, 1200 m, 250 sq. km., 1967
0
500
1000
1500
2000
2500
3000
3500
Rainfall Only: Maxwell Creek, 500 m, 44 sq. km., 1967
0
50
100
150
200
250
300
350
400
450
500
Combined Sources: Merced River Near Briceburg, 360 m, 1,800 sq. km., 1967
0
2000
4000
6000
8000
10000
12000
14000
O N D J F M A M J J A S
FIGURE 30.5
Watersheds with different elevation ranges and sources ofrunoff have different patterns of stream flow over a wateryear (October to September).
contamination of the enclosed water and provides greateroperational flexibility. However, a finding by the staff of theState Water Resources Control Board held that improvementseffectively constitute a new diversion that the ditch ownerdoes not hold rights to. Leakage currently provides water forimprovement of wildlife habitat and other uses. A decision ispending on this case involving the Crawford Ditch of the ElDorado Irrigation District (Borcalli and Associates 1993). Oc-casional failures of these (and more modern) canals result inserious erosion or debris flows. Four flume failures occurredalong the Tule River just between 1962 and 1965. In 1992, theCleveland fire in the South Fork of the American River Basindestroyed a large portion of the El Dorado Canal, which sup-plies about a third of the total water to the El Dorado Irriga-tion District. In November 1994, a fallen oak blocked the TigerCreek Canal, diverting water to the slope below and erodinghundreds of cubic meters of soil.
Environmental Consequences
The construction, existence, and operation of dams and di-versions have a variety of environmental effects. Inundationof a section of stream is the most basic impact. A river is trans-formed into a lake. The continuity of riverine and riparianhabitat is interrupted. To creatures that migrate along suchcorridors, this fragmentation has consequences ranging fromaltering behavior of individuals to devastating populations.Dams have the potential to alters downstream flows by or-ders of magnitude and, at the extreme, can simply turn offthe water and dry up a channel. Changing the natural trans-port of water and sediment fundamentally alters conditionsfor aquatic and riparian species. Changing stream flow alsohas dramatic impacts on chemical and thermal attributes ofdownstream water. The abundance of impoundments in theSierra Nevada is impressive when one realizes that virtuallyall flat water at the lower elevations of the west slope is man-made. The terrain is simply not conducive to the formationof natural lakes below about 1,500 m (5,000 ft).
An obvious impact of water management is alteration ofthe natural hydrograph (temporal pattern of stream flow). Forexample, during the snowmelt season, the daily cycle of run-off and recession may be transformed into a constant flow. Aseries of hydrographs from streams in and near YosemiteNational Park illustrate natural stream flow patterns gener-ated under various watershed and climatic conditions at dif-ferent elevations (figure 30.5). Dams are built to change thosepatterns (figure 30.6). Diversions not associated with largeimpoundments change the volume without much effect ontiming (figure 30.7). Large projects usually alter both volumeand timing (figure 30.8).
High Flows
The most obvious alterations in formerly natural hydrographsare decreases in peak flows. The size of an impoundment and

889Hydrology and Water Resources
its flood reservation (management rules to keep a portion ofthe reservoir unfilled depending on the risk of floods at dif-ferent times of the year) determine its ability to capture flood-waters and release them at a controlled rate. Small structuresmust pass the bulk of a flood without much influence. Largereservoirs can absorb large inflows by increasing the amountof water stored. Peak flows below some major reservoirs arereduced to essentially nothing as the dams perform their floodcontrol functions. In a simplistic sense, all dams have a thresh-old for flood control. They can eliminate floods immediatelydownstream up to the point at which their storage capacity isexceeded. After they are filled, they exert no further controlon stream flow. Of course, few reservoirs are operated in astatic mode except small recreational impoundments such asHume Lake. Most large reservoirs in the Sierra Nevada aremultipurpose facilities whose releases are carefully controlleddepending on inflows that are forecast, consequences of re-leases downstream, irrigation and power demands, and prob-ability of additional precipitation.
Low Flows
Reservoir management also determines the releases undernonflood conditions. In the most severe cases, no water is al-lowed to flow in the natural channel; the entire natural flowis diverted elsewhere. Many streams in the Sierra Nevada, asin the classic example of inflows to Mono Lake, were com-pletely dewatered below the points of diversion. In other
FIGURE 30.8
The largest reservoirs and associated diversions completelychange the availability of water downstream. Note theextreme difference in scale (thousands of cubic meters persecond in 1904 versus a constant 11 m3/sec in 1979) afterthe Oroville Dam was completed.
Feather River at Oroville, 1904
0
20000
40000
60000
80000
100000
120000
Feather River at Oroville, 1979
0
100
200
300
400
500
600
O N D J F M A M J J A S
Duncan Creek Above Diversion, 1967
0
50
100
150
200
250
300
350
400
Duncan Creek Below Diversion, 1967
0
50
100
150
200
250
300
350
400
O N D J F M A M J J A S
FIGURE 30.7
Diversions at small dams with minimal storage reduce thevolume of stream flow without eliminating the naturalpattern of fluctuations.
Middle Fork Stanislaus Above Reservoir, 1968
0
200
400
600
800
1000
1200
1400
1600
1800
Middle Fork Stanislaus Below Reservoir, 1968
0
200
400
600
800
1000
1200
1400
1600
1800
O N D J F M A M J J A S
FIGURE 30.6
Storage reservoirs without diversions can greatly modify thenatural hydrograph without reducing the annual volume.

890VOLUME I I , CHAPTER 30
cases, low flows are augmented, and the streams run at un-naturally high (and often constant) levels throughout the year.Below some hydroelectric powerhouses, discharges relatedto power demands can fluctuate wildly over a few hours.Afterbays allow regulation of the water released to the river.
Reservoir releases that partially resemble a naturalhydrograph probably have the least adverse impact on down-stream ecological processes. The minimum (and relativelyconstant) flow requirements on many water projects mayserve to keep fish alive, but they are quite different from theflow regime that the aquatic community evolved with. Greaterconsideration of downstream ecological needs could be in-corporated in the operations of many reservoirs without in-curring major costs. The opportunities for alterations in releasescheduling and their potential benefits and costs need to beexplored on a project-by-project basis.
Changes in the flow regime also impact water quality. Whenstream flow is diminished substantially, there is less volumeavailable to dilute contaminants entering downstream. In1994, the U.S. Supreme Court decided that states had the au-thority under the Clean Water Act to regulate reservoir re-leases in the context of managing water quality. In some cases,reservoirs can improve riverine quality by allowing contami-nants adsorbed on particles to settle out of the water column.However, this same process may be converting some reser-voir beds into storage deposits of heavy metals (Slotten et al.1994, 1995).
Water Temperature
Temperatures of streams below dams are affected by the vol-ume and temperature of reservoir releases. If little water isreleased from a dam in summer, streams can become unnatu-rally hot because the radiant energy of sunlight on the chan-nel is absorbed by a smaller volume of water than undernatural flow conditions. Dams may be designed to releasewater from different depths in the lake. Reservoirs becomethermally stratified like most natural lakes. In summer, storedwater tends to be warmer near the surface, so releases fromupper levels will result in higher temperatures than releasesnear the base.
Evaporation
The reservoirs behind the dams also export water to the at-mosphere. Lakes lose water by evaporation roughly in pro-portion to their surface area. Creation of large expanses ofopen water by damming a river can significantly increase theopportunities for water losses from a watershed. Up to a meterof annual evaporation can be expected from reservoirs in mostof the Sierra Nevada (Harding 1935; Longacre and Blaney1962; Myrup et al. 1979).
Sediment Storage and Transport
Reservoirs dramatically change the sediment transport regimeof a river. Virtually all bedload and most suspended load isdeposited when a river enters the still water of a reservoir.The coarser fraction of the sediments forms a delta at the up-per end. Deposits tend to be progressively finer toward thedam. When the water level is lowered, the streams cut throughthe deposits and relocate materials closer to the dam. Undersome conditions, this channel incision can progress upstream(Galay 1983). With the extensive water development in mostriver basins of the Sierra Nevada, changes in sediment deliv-ery should be considered throughout the basin. Each dam inthe network affects the channel below it. With the presence ofmany dams upstream, contributing areas for sediment areoften much smaller than contributing areas for water (in theabsence of exports out of the basin).
Most of the geomorphic adjustments to dams occur down-stream. These channel changes occur in response to shifts insediment delivery and flow regimes, especially peak flows.Whatever water is released has significantly less sedimentthan when it entered the reservoir. Unless releases are mini-mal, the sediment-free discharge has the capacity to entrainand transport particles from the bed and banks of the down-stream channel. Progressive lowering or degradation of theriverbed may occur after dam completion. Typical conse-quences of degradation include lowering of ground-waterlevels and consequent loss of riparian vegetation, reductionin overbank flooding and deposition of sediments and nutri-ents, bank erosion and loss of land, exposure of bridge foun-dations, and abandonment of diversion intakes (Galay 1983).The severity of channel incision depends on the size distri-bution of particles in the bed, characteristics of the channel,how the reservoir is operated and the sequence of flood eventsfollowing construction (Williams and Wolman 1984). Down-cutting seems to be greatest in rivers with fine-grained bedmaterials and where flood peaks are not greatly reduced bythe dam. However, larger dams usually reduce flood peakssubstantially and thereby limit the rate of degradation(Milhous 1982). Where channel incision occurs below dams,the finer particles are removed, and the larger cobbles andboulders are left behind. As the bed becomes coarser or “ar-mored,” it is more resistant to erosion and interferes withsalmonid spawning. Also, downcutting decreases the chan-nel gradient slightly, and degradation becomes somewhat self-limiting. The bed of the Yuba River below Englebright Damhas become armored with large cobbles and boulders but isstill susceptible to incision during the largest floods (Kondolfand Matthews 1993). Conversely, flood control is so effectivebelow both Pardee and Camanche Dams that channel degra-dation has not occurred and the gravels are immobile(BioSystems Analysis 1990, cited by Kondolf and Matthews1993). Unfortunately, we lack any information about the con-dition of channels before placer mining and dam construc-

891Hydrology and Water Resources
tion. Therefore, we are unable to make definitive statementsabout what constitutes natural channel conditions in most ofthe Sierra Nevada, although channels were unlikely to havebeen as armored as many are currently.
Where streambeds are not armored with large materialsand are not actively degrading, fine sediments can interferewith fish spawning. Salmonids require gravels with sufficientpore space to allow interstitial flow to bring oxygen to eggs.Fine particles may be deposited between the gravels and limitthe flow of water. Higher discharges are necessary on occa-sion to cleanse the gravels. Control of high flows by damseliminates the opportunity to flush the fine sediments out ofthe spawning gravels. Many studies have been conducted inthe past decade to define how much water is needed for thisflushing function, and many rules-of-thumb have been sug-gested. However, variability in fluvial processes amongstreams illustrates the need to actually observe flows thatbegin to entrain particles of a particular size rather than de-pend on generalized procedures to estimate flow releasesnecessary to remove fine sediments from spawning gravels(Kondolf et al. 1987).
Limiting the size and frequency of floods below dams hasalso altered conditions for riparian vegetation. As total dis-charge and scouring flows decrease, riparian vegetation is ableto become established in the former active channel (Williamsand Wolman 1984). Roots stabilize the bank materials, andthe plants slow overbank flows, which allows deposition ofadditional sediment. Gradually, the channel becomes nar-rower, and large trees occupy former parts of the channel. Ifallowed to become well established, mature riparian vegeta-tion can resist significant flows. Confining the stream to anarrower channel can increase hydraulic forces on the bedand lead to incision and loss of riparian vegetation. To somedegree, dams mimic the effects of long-term droughts onvegetation-channel interactions (Mount 1995). Depending oncharacteristics of the channel and plants, establishment of ri-parian vegetation can be enhanced by either higher or lowersummer flows than occurred before dam construction. En-croachment of vegetation into river channels has been notedbelow Tulloch, Don Pedro, La Grange, and McClure Reser-voirs (Pelzman 1973). Augmentation of flows at the receivingend of trans-basin diversion has widened channels and haspushed back riparian vegetation, as in the case of the upperOwens River.
Although larger dams seem to have sufficient space to storesediment for hundreds of years, at least at rates determinedin the 1940s, smaller structures can become overwhelmed withsediment in just a few years. Unusually large floods can com-pletely fill smaller diversion works, as occurred at Log CabinDam on Oregon Creek and Hour House Dam on the MiddleYuba in 1986 (Kondolf and Matthews 1993). Assuming thatthe dam is to remain in operation, the accumulated sedimentmust be removed. How that removal is accomplished can havean assortment of impacts. Dredging, trucking, and disposal
of the sediments in a stable location has been a costly approachto the problem. Ralston Afterbay on the Middle Fork Ameri-can River has had sediment removed on six occasions betweenits completion in 1966 and 1986 (Georgetown Ranger District1992). The average annual rate of filling of about 80 m3/km2
(0.2 AF/mi2) is not excessive compared with that of otherbasins, but the Ralston Afterbay has a capacity of only 3.4million m3 (2,782 AF) with 530 km2 (205 mi2) of unregulatedcontributing area above it (EA Engineering, Science, and Tech-nology 1990). Location of suitable sites for long-term storageof removed sediments within a short distance from the reser-voir has been difficult (Georgetown Ranger District 1992). Thesmall forebays on Southern California Edison’s Bishop Creeksystem have also required dredging of accumulated sedi-ments. Estimates of the costs of dredging and transportationdepend on access and distance to a disposal site and haveranged from $26/m3 ($20/yd3) (EA Engineering, Science, andTechnology 1990) to about $3,500/ m3 ($2,700/yd3) (Kondolfand Matthews 1993).
Another option for removal of accumulated sediments issluicing. Opening sluice gates or an outlet tunnel allows wa-ter levels to fall and sediment to be resuspended and flushedout with the water. This action creates a sudden pulse of sedi-ment downstream. Problems have arisen when sluicing hasbeen conducted during summer months, at times when flowsare inadequate to disperse the redeposited sediment. Sluic-ing of Forbestown Reservoir on the South Fork Feather Riverin 1986 left a thin layer of sand over the entire channel welldownstream of the dam. Another example was Democrat Damon the Kern River in 1986. In the years following sluicing,high flows did not occur, and sand remained within the chan-nel until scouring flows occurred in 1992 (Kondolf andMatthews 1993). Accidental releases of sediment occurred onthe Middle Yuba River from Hour House Reservoir in 1986and from Poe Dam on the North Fork of the Feather River in1988. More than $1 million was spent excavating sand out ofthe channel below Hour House Dam, but a flood during theearly stages of the North Fork Feather cleanup convenientlyflushed all the excess sediments out of the channel (Rameyand Beck 1990; Kondolf and Matthews 1993).
When sediment is flushed out of reservoirs at low flows, itwill be redeposited close to the dam; however, when it is in-troduced at higher flows, it will usually be carried down-stream and dispersed. Engineering approaches to lettingsediments pass through dams during high flows are beingconsidered at several sites. The Pacific Gas and Electric Com-pany (1994) is designing pass-through systems to retrofit twoof its dams on the North Fork Feather River. Sediment is rap-idly filling the reservoirs, complicating operation of the dams,and accelerating turbine wear (Harrison 1992). Such pass-through systems could allow reservoir operations to inter-fere less with natural sediment transport and could havegeomorphic benefits with regard to channel degradation be-low dams (Kondolf and Matthews 1993).

892VOLUME I I , CHAPTER 30
Failure
Catastrophic failure of impoundments is always a concern ofthose living below dams. Sudden releases of water also havegreat potential for dramatic environmental change. Duringthe gold-mining era, dam failures were fairly common, bothbecause of design flaws and because of intentional releasesto rearrange gold-bearing sediments in the practice knownas booming. Early debris dams were also intentionally de-stroyed to allow fresh access to impounded gravels and tocreate new storage space. Unintentional collapse of the En-glish Dam on the Middle Fork of the Yuba (Ellis 1939; McPhee1993) in June 1883 released almost 18 million m3 (15,000 AF)of water suddenly and cleaned out much of the stored min-ing debris in that channel (James 1994). Excessive water re-leases from an upstream dam washed out a small dam onBishop Creek in June 1909. Following failure of the SaintFrancis Dam in the Ventura River Basin in 1929, the Divisionof Dam Safety of the Department of Water Resources has regu-lated larger dams and inspected them at least annually. Damsthat are either more than 7.6 m (25 ft) tall and store more than62,000 m3 (50 AF) or, alternatively, more than 1.8 m (6 ft) tallregardless of capacity or impound more than 19,000 m3 (15AF) regardless of height are regulated by the Department ofWater Resources (1988). Modern dams have little risk of fail-ure; however, failures are not unknown. The best-known damcollapse in the Sierra Nevada in recent decades was that ofthe Hell Hole Dam on the Rubicon in December 1964 (Scottand Gravlee 1968). Failure of the North Lake Dam during astorm in September 1982 produced the largest flood of recordon Bishop Creek and severely damaged one of the power-houses. During the massive floods of February 1986, the cof-fer dam at the Auburn Dam site failed when diversion tunnelsbecame clogged and the dam was overtopped. Structural fail-ure of a penstock during high-pressure testing at the HelmsCreek pumped storage facility in 1982 resulted in massivescouring of Lost Canyon (Chan and Wong 1989). Even partialfailures, such as the gate damage on Folsom Dam in July 1995,can result in large releases of water and prolonged difficul-ties in project operation.
Eventually, some larger dams will become filled with sedi-ment and no longer worth operating. The Federal EnergyRegulatory Commission now has the authority to take damsout of service when they come up for relicensing. We have noreal experience with what to do about a dam filled with sedi-ment. Early debris dams on the Yuba and Bear Rivers justfailed or were intentionally destroyed, and the sedimentseventually moved downstream or became semistable terraces.However, that option probably won’t be acceptable in thefuture. Plans are being made to decommission a dam on theElwha River in Olympic National Park in Washington. Initialestimates suggest that removal of the dam could cost $60–80million and sediment removal could cost $150–300 million. Ifestimates of reservoir sedimentation rates made during the
1940s turn out to be conservative, society will have a longtime to think about what to do with the dams of the SierraNevada.
R OA D S
Roads provide the most intensive modification of land sur-face properties relevant to the hydrology of common land-management practices. All vegetation is removed andprevented from reestablishment. Dirt-surfaced roads are com-pacted to a near-impervious state, and sealed and paved roadsare completely impervious. Runoff from the surface is col-lected and discharged as potentially erosive flows at pointsbelow the road. Roads that are cut into slopes intercept sub-surface water flow and bring it to the surface. Fill materialscover additional portions of the slope and often contribute tosediment yields slowly over time or catastrophically if theybecome saturated from subsurface water entry and then fail.Erosion from the actual roadbed of unpaved roads may besignificant as well (Garland 1993; Adams 1993). Unauthorizeduse during wet surface conditions adds to the erosion of theroad. A principal side effect of an extensive road network isthe access that is provided to allow additional alterations. Fewadverse impacts occur in the absence of roads. Avoidance ofnew road construction can minimize other potential impactsin currently unroaded areas.
Stream Crossings
The most serious impacts of roads occur where roads are inclose proximity to streams or wetlands. Stream crossings byford, culvert, or bridge have direct effects on the channel andlocal sediment regime. Although virtually any stream cross-ing will have some impact on the channel, careful engineer-ing, construction, and maintenance can limit the severity. Thebasic problem just comes down to disturbing the bed, banks,floodplain, and terraces. Because the crossing is coincidentwith the channel, there is little opportunity to buffer the in-adequacies of design or construction. Also, roadside ditchesnear the crossing drain directly into the stream, often con-tributing sediment to the stream. In past decades, very littleattention was paid to stream crossings, and the cheapest al-ternative was usually chosen. Often, that choice was merelypushing a stack of cull logs into the channel and coveringthem with dirt. Installation of culverts sized only for summerflow, with anticipated reconstruction, was often a more cost-effective choice than a properly engineered crossing. Fortu-nately, engineering and construction practices have improveddramatically since crossings have become widely acceptedas a potential problem (Furniss et al. 1991).

893Hydrology and Water Resources
Forest Road Network
As with other disturbances, the proportion of a catchmentthat roads occupy greatly influences their net downstreamimpact. Sediment yield associated with roads has even beenclaimed to increase exponentially with their density in a wa-tershed (California Division of Soil Conservation 1971a).Within national forests of the Sierra Nevada, gross road den-sities range from 0.6 km/km2 (1.0 mi/mi2) on the Inyo to 2.3km/km2 (3.6 mi/mi2) on the Eldorado (U.S. Forest Service1995a). There are approximately 28,000 km (18,000 mi) ofroads on national forests of the Sierra Nevada. Constructionof new forest roads has declined markedly in recent years,and reconstruction and obliteration have varied among years(table 30.6).
Sediment Production
A variety of studies have examined sediment production andmass movement occurrence from forest roads. As usual, thereis little information from the Sierra Nevada. Studies of roadimpacts in northwestern California (e.g., Burns 1972;McCashion and Rice 1983), Oregon (e.g., Beschta 1978), Wash-ington (e.g., Reid and Dunne 1984), Idaho (e.g., Megahan andKidd 1972), and elsewhere have demonstrated increases inlocal erosion rates hundreds of times greater than natural ratesas well as severalfold increases in sediment yield at the catch-ment scale. Sediment yield from roads is usually greatest inthe first year following construction. Road construction andsome timber harvesting in the 10 km2 (4 mi2) Castle CreekBasin near Donner Summit resulted in a fivefold increase insuspended sediment during the first year. Sediment yieldsdecreased to twice the preconstruction levels during the sec-ond year (Rice and Wallis 1962; Anderson 1979). In a rapidlyurbanizing part of the Lake Tahoe Basin, roadways were foundto generate about half of the total sediment (California Divi-sion of Soil Conservation 1969). The presence of roads canincrease the frequency of slope failures compared with therate for undisturbed forest by up to hundreds of times (Sidleet al. 1985). Road location seems to be the most importantsingle factor because it determines the opportunity of mostother controlling influences to contribute to failure (Furnisset al. 1991; Rice and Lewis 1991). Road placement in topo-graphic hollows caused ground-water flow to be impeded,
leading to several major failures along a principal road in theTahoe National Forest (McKean 1987). In the past, there waslittle rational planning or design for inslope versus outsloperoad surfaces and associated drainage works as a means ofminimizing erosion.
Landslides and surface erosion can often be traced to hap-hazard road design, location, and construction (McCashionand Rice 1983). Forest roads constructed as part of a carefullyplanned system usually disturb much less ground, produceless sediment, and have lower construction and maintenancecosts (Brown 1980). Road stability is often jeopardized by in-frequent maintenance. A looming problem for the Forest Ser-vice is how to maintain some 28,000 km (18,000 mi) of roadsin the Sierra Nevada with budgets inadequate even at present.Declining budgets have decreased maintenance activitiesoverall and placed roads in lower maintenance categories thanspecified in the original design (Clifton 1992). If maintenanceis not improved, quality of both transportation and streamswill suffer. Lack of maintenance is often used as an excuse forfailures resulting from poor design or construction (Seidelmanet al. 1986). The road network must be acknowledged as bothan investment and a liability for the long term.
Rehabilitation
Casual examination of Watershed Improvement Needs Inven-tories on many of the national forests of the Sierra Nevadaillustrated that fixing road problems is an overwhelming pri-ority. The same engineering and construction skills neededto build roads can be used to repair, relocate, and obliterateroads that cause excessive water quality problems. Modernconcepts of road location and design that are currently usedto build new roads with minimal problems (Larse 1971) canbe applied to reducing the adverse effects of existing roads(Clifton 1992). Reshaping road cuts, pulling back side-castmaterial, ripping compacted surfaces, and removing streamcrossings were successfully employed in a watershed in north-western Washington (Harr and Nichols 1993). The decommis-sioned roads survived with little damage two major stormsthat caused widespread failures of active roads. Sources offunding must be identified to maintain and stabilize the roadnetwork; otherwise, forests will be left with an analog to toxicwaste dumps that get increasingly difficult to treat and causeadditional impacts with the passage of time. Public educa-tion is also necessary to build acceptance for closing roadsthat damage public resources. Closure of unsurfaced roadsduring the wet season can also help to reduce erosion.
Streets and Highways
Although unsurfaced forest and rural roads have receivedmost of the attention, urban streets and major highways canalso create severe problems of slope instability and waterquality (Scheidt 1967; Parizek 1971). Beyond sharing most ofthe impacts associated with forest roads, paved roads of higher
TABLE 30.6
Kilometers of road activities in national forests in the SierraNevada by fiscal year (U.S. Forest Service, Region 5,Engineering Section).
Activity 1990 1991 1992 1993 1994
Construction 113 83 75 53 11Reconstruction 620 326 323 453 307Obliteration NA 136 86 111 180

894VOLUME I I , CHAPTER 30
standard have additional effects. Primarily, they are simplywider and affect more area per unit of length. A four-lane high-way can occupy a substantial fraction of a small catchment.Their impervious surface can create overland flow over largeareas where it was nonexistent before construction. They aredesigned for more traffic at higher speeds and so tend to beforced through the landscape, minimizing curvature andchanges in grade instead of following the topography moreclosely. In partial compensation for the greater hill-slope al-teration, highways are better engineered than lightly usedroads. Large investments are made in adequate drainage struc-tures, slope reinforcement, and revegetation. Nevertheless,mitigation for the sheer size and location of the highwayprojects is difficult at best. Major highways are immediatelyadjacent to portions of the Feather, North Yuba, South Yuba,Truckee, South Fork American, Merced, Walker, Kaweah, Tule,and Kern Rivers. Within cities and towns, the storm waterdrainage system for the entire road grid is often inadequateduring large storms because communities tend to develop ina piecemeal fashion, rather than having a complete road anddrainage network planned from the start. Contaminants fromtire wear, fluid leaks, pet waste, and exhaust that accumulateon the roadway are washed off into the nearest waterway.Oils used for road dust abatement can also be problematic.For example, contamination of Ponderosa Reservoir on theSouth Fork Feather River with polychlorinated biphenyls(PCBs) was traced to the use of transformer oil on forest roads(Plumas National Forest 1988).
Deicing Agents
Chemicals used to remove snow and ice from roadways inwinter can affect local water quality and roadside vegetation(Hawkins and Judd 1972; Scharf and Srago 1975; Goldmanand Malyj 1990). During a heavy winter (1982/83), rock salt(sodium chloride) was applied to Interstate 80 near DonnerSummit in an average quantity of about 45 metric tons perkm (80 tons per mi) of roadway (Berg and Bergman 1984).Stream samples obtained about 0.5 km (0.3 mi) downstreamfrom the last highway crossing of the channel contained upto 100 times more chloride and 10 times more sodium thanwater obtained just upstream from the highway (Berg andBergman 1984).
F I R E S , F I R E S U P P R E S S I O N , A N DP O S T F I R E T R E AT M E N T S
Catastrophic fire can produce some of the most intensive andextensive changes in watershed conditions of any disturbance.Within areas of intense fire, most vegetation is killed and stopstranspiring, allowing soil moisture levels to remain high. Or-ganic matter in the litter layer is volatilized and often forms a
layer within the soil that reduces infiltration of water into thesoil (see Poff 1996). Riparian zones that would not be har-vested under current forest practices are often partially burnedin intense fires. The combined effect of these changes is toincrease total water yield and overland flow. As the propor-tion of overland flow increases, streams receive more waterin less time than under prefire conditions, and peak flowsmay be increased. If a nearly continuous water-repellent (hy-drophobic) layer is a few centimeters below the surface, thesoil above that layer may become saturated and form shal-low debris flows. With bare soil, increased overland flow, andlack of vegetation and litter, soil particles are more easily de-tached and transported. As with other impacts, the propor-tion of a catchment that is modified by fire and the locationof the burned area with respect to the channel largely deter-mine the effects on streams. A stream draining a watershedburned over 90% of its area will show much greater effectsthan a stream emanating from a similar watershed in whichonly the upper slopes and ridgetops were burned. Fire inten-sity is often highly variable over the landscape, and patchesof unburned or lightly burned vegetation (especially nearstreams) can reduce the adverse effects of upslope areas thatwere intensely burned.
Water Yield
Fires affect water yield primarily by killing vegetation. Inter-ception loss is decreased because of the loss of leaves, lowvegetation, and litter. Transpiration is virtually eliminatedwherever fire is intense. A daily cycle in stream flow reflect-ing transpiration demand during daylight hours in a catch-ment in Washington came to an abrupt halt following acatastrophic fire (Helvey 1980). Annual runoff in this com-pletely burned watershed increased by 10–47 cm during thefirst seven years after the fire. Water yields in a small catch-ment in British Columbia that was burned over about 60% ofits area increased by 25% on average for four years followingthe fire (Cheng 1980). Dramatic increases in flow of a smallspring and a creek in the Sierra Nevada were observed fol-lowing burning of riparian vegetation (Biswell 1989). A de-tailed modeling study for Pacific Northwest forests hassuggested that a reduction in leaf area or basal area of about50% is necessary before annual water-yield increases exceedabout 50 mm (2 in) (Potts et al. 1989). Snow accumulationand melt rates might be expected to increase from opening aforest canopy by fire, and such effects have been observed inWashington and British Columbia (Helvey 1980; Cheng 1980)but not in Idaho (Megahan 1983).
Peak Flows
Peak flows can be expected to increase following significantfires because of higher soil moisture resulting from reductionof transpiration, decreased infiltration, and higher rates ofsnowmelt. Infiltration is usually the most important influence,

895Hydrology and Water Resources
and it is decreased in two ways. Removal of vegetation andthe litter layer exposes bare mineral soil to raindrop impacts,which can physically force the soil particles closer togetherand disperse soil aggregates into surface pores, thereby re-ducing the infiltration capacity. Fires also vaporize organiccompounds in the litter layer, some of which move into thesoil until the vapor condenses and forms a layer that is waterrepellent, or hydrophobic (De Bano 1981). These layers tendto be more coherent in coarse-textured soils (e.g., decomposedgranitics), under very hot fires, and where a thick litter layerand/or organic horizon was present (De Bano 1981; Poff1989b). The continuity of such layers, which may be a func-tion of fire intensity and litter distribution, determines theiroverall impact on hill-slope water movement. Additionally,larger macropores from roots and animals allow some watermovement through the hydrophobic layers (Booker et al.1993). Although the water-repellent layers tend to break downwithin a year or two, those formed in soils that are somewhathydrophobic even without burning may be more persistent(Poff 1989b). Under some conditions, a hydrophobic layerforms on the surface of the soil and acts as a binder and seal-ant, maximizing overland flow while minimizing erosion (seePoff 1996). As usual, there is a lack of measured hydrologicresponse to fire in the Sierra Nevada. A variety of studies else-where in the western United States have demonstrated dra-matic increases in peak flows following wildfire (Tiedemannet al. 1979).
Sediment Yield
In general, sediment yields increase markedly after fires, par-ticularly if riparian vegetation was burned. Most of the sedi-ment response seems to be from the channels themselves. Inthe absence of streamside vegetation, soil particles move intothe channels from dry ravel erosion, and the banks becomeless stable. Increases in total discharge and peak flows resultin channel erosion. Debris torrents may scour streams if ex-treme climatic events follow the fire (Helvey 1980; Kuehn1987). If the fire is particularly hot, woody debris that helpedstabilize the channel may be destroyed. Erosion from the gen-eral land surface usually increases, but it may not always beas important a delivery mechanism as has been assumed(Booker et al. 1993). Erosion from plots in brushland nearNorth Fork in the San Joaquin River Basin increased by 200to 400 times after repeated burning (Lowdermilk and Rowe1934). In Dog Valley in the eastern Sierra Nevada near Reno,a single storm produced about 600 m3/km2 (1.3 AF/mi2) ofsediment from a burned catchment while an adjacent un-burned area yielded only a trace of sediment (Copeland 1965).Under extraordinary rainfall, gully erosion, sheet erosion, anda debris torrent removed more than 19,000 m3 (15 AF) of ma-terial from a burned catchment of about 0.8 km2 (0.3 mi2) inthe headwaters of the South Fork of the American River in1982 (Kuehn 1987).
Nutrient Yield
Fires provide an opportunity for nutrients that have beenstored in vegetation and soils to move into streams. Materi-als that are not volatilized and lost to the atmosphere are leftin ash on and near the soil surface in forms that are readilymobile. A variety of studies throughout the West have dem-onstrated that concentrations of nitrates and other ions instreams usually increase dramatically after fires (Tiedemannet al. 1979). However, the background concentrations of theseconstituents in streams draining healthy forests are typicallyso low that the relative increases following fires appear to behuge even though the absolute amounts often remain almostnegligible or at least below water quality standards. Never-theless, there is potential for a nutrient flush to dramaticallyincrease algae in streams, which can have additional conse-quences. There is also the potential for large nutrient lossesassociated with physical erosion of soil particles that oftencarry nutrients with them (Tiedemann et al. 1979). A study ofthe chemistry of Sagehen Creek north of Truckee followingthe Donner Burn in 1960 did not detect any change in theionic composition of the stream relating to the fire, which didnot burn the riparian zone (Johnson and Needham 1966). Theinevitable fires in urban intermix zones have the potential torelease a variety of chemicals and combustion products intothe aquatic environment. Reconstruction can keep soils bareand disturbed for years.
Aquatic Effects
Studies of the aquatic effects of a fire on the Plumas NationalForest demonstrate how both physical and biological featuresof the stream change over time (Roby 1989; Roby and Azuma1995). The lower two-thirds of this catchment, including ri-parian vegetation, was thoroughly burned. Initially, the chan-nel widened in response to presumed higher flows of waterand sediment. However, as vegetation became established andthe watershed recovered, the cross sections of the channelreturned to their prefire areas within six years of the burn.Partial recovery of the invertebrate community seemed tohave occurred relatively quickly. No differences in commu-nity similarity were noted between burned and unburnedreaches one year after the fire, and density and taxa richnesswere comparable within three years. However, significant(though declining) differences in a species-diversity indexbetween the burned and unburned reaches remained through-out eleven years of monitoring (Roby and Azuma 1995).
Fire Suppression
Fire suppression during this century has created forests withgreater density of vegetation than in the past (Chang 1996;Skinner and Chang 1996; Weatherspoon 1996). This foreststructure has current and potential hydrologic consequences.

896VOLUME I I , CHAPTER 30
The present situation may decrease yields of water and sedi-ment somewhat compared to a natural fire regime (if impactsof other activities, such as residential development and roadconstruction, are ignored). Although these changes cannot bequantified, transpiration from the dense forests should be ator near maximum, and a more open forest structure resultingfrom more frequent fire could be assumed to use less water.The dense vegetation also increases the opportunity for in-tense conflagrations (Chang 1996; McKelvey et al. 1996; Skin-ner and Chang 1996) that could produce major increases inwater and sediment yields. There is a basic contrast betweenmoderately higher stream flow and sedimentation on asemiconstant basis with relatively frequent low-intensity firesand the other extreme of lower stream flow with less sedi-ment for now with the looming possibility of damaging floodsand sediment loads from less-than-perfect fire suppression.
Actual on-the-ground fire-fighting activities, as opposedto the general policy of fire suppression mentioned above,also have impacts on water resources (California Division ofForestry 1972). In general, the net effect of such actions is prob-ably less than doing nothing, given current fuel loads. Theprincipal impacts of the past, which presumably are rare un-der current practices, involved operation of heavy equipmentin streams and riparian zones and down the fall line of slopes.In some large fires, an extensive network of fire breaks maybe bulldozed and require rehabilitation. Aerial application ofretardants can also have adverse aquatic impacts (Norris andWebb 1989).
Postburn Activities
Following fires, there is usually a strong desire by landown-ers, agencies, and the public to react quickly. Hastily con-structed fire lines often require obliteration or drainage;otherwise, allowing natural recovery processes to functionmay often be the best policy (Beschta et al. 1995). For example,natural regrowth on north-facing slopes virtually stoppederosion within three years of a fire in Idaho that initially pro-duced more than 1,000 m3/km2 (2.3 AF/mi2) of sediment(Megahan and Molitor 1975). Unfortunately, the state of theart in postfire rehabilitation remains poorly developed. De-spite vigorous implementation of various actions over vastareas of the western United States, there has been minimalmonitoring of the effectiveness of those actions. We thereforehave very little collective experience or documentation ofwhat works and what doesn’t work. There are a lot of differ-ent treatments recommended in rehabilitation handbooks, butthere is little apparent basis for the recommendations mea-sured as success or failure in years following the prescrip-tion. There is active debate among fire specialists, soilscientists, hydrologists, and ecologists about some very basicissues. For example, rye grass seeding has been encouragedfor years as a means of getting some vegetation cover in placeas quickly as possible. Despite evidence compiled over thirtyyears that it inhibits establishment of native vegetation, re-
sults in less total cover after a couple of years than in non-seeded areas, and may even enhance net soil loss or have otheradverse effects (Krammes and Hill 1963; Booker et al. 1993;Roby and Azuma 1995), many people seem to view it as apanacea. Contour felling of logs and straw-bale check damsto trap sediment are other widely accepted practices that maybe less effective than generally assumed. These techniquesappear to meet certain objectives in some situations (e.g., DeGraff 1982), but their indiscriminate use is ineffective at bestand may be counterproductive. One of the lessons of the cata-strophic fire in Oakland in 1991 was that we simply didn’tknow what erosion control measures would be appropriate.
In the past decade, salvage logging of dead and dying treeshas become quite controversial, with some people feeling itis just an excuse to cut trees while others feel it is the onlything maintaining their business. Postfire salvage operationsinfluence aquatic recovery in a variety of ways. Perhaps mostimportant in the present economic climate, salvage sales havepotential to generate revenue for watershed rehabilitation,which unfortunately seems to be underutilized. Culverts areoften replaced with larger structures in anticipation of largerflows; the soil disturbance from reconstruction is much lessthan what would occur if the road were to fail. The replace-ments are probably better designed than the original andshould be more stable in the long term. Some roads may bedecommissioned. Logging slash can be used to provide somephysical protection for soils. Cutting shallow-rooted treesavoids the displacement of their root masses if they were tobe blown over. On the negative side, logging operations dis-turb soils when the soil is particularly sensitive to compac-tion and erosion in the absence of cover and organic matter.Significant ground disturbance during a salvage sale of theClark Burn in the Last Chance Creek watershed of PlumasCounty led to severe erosion during a thunderstorm (Cawley1991). Where strong hydrophobic layers have developed, suchdisturbance might be valuable in promoting infiltration (Poff1989b). However, on slopes subject to deeper mass failure,hydrophobic layers may be desirable as a means of limitingaccumulation of water in the soil. If postfire treatments ofsalvage logging and site preparation prevent rapid reestab-lishment of low vegetation, resulting erosion can be greaterthan that directly produced by the fire. Timing of major stormsrelative to the amount of bare soil is a dominant influence. Afire in the Tuolumne River Basin in 1973 was not immedi-ately followed by any major erosion-producing events (Frazier1984). However, widespread ground disturbance associatedwith salvage operations prolonged susceptibility of soils toerosion. Eventually, substantial rain-on-snow events providedthe energy for serious rill, gully, and bank erosion, which re-sulted in significant soil losses (Frazier 1984).
The principal objectives of postfire rehabilitation workshould be to avoid making things worse; repair potential prob-lems from fire-fighting activities (e.g., bulldozed fire breaks);enhance establishment of native vegetation to provide soilcover, organic matter, stream-bank stability, and shade as

897Hydrology and Water Resources
quickly as possible; attempt to stabilize channels by non-structural means; minimize removal of large woody debrisfrom streams; minimize adverse effects from the existing roadnetwork; schedule operations to minimize exposure of baresoil; and allow natural processes to heal the landscape.
Fuels Reduction
A major program of fuels reduction could increase gross wa-ter yields, peak flows, and sediment yields, depending on howextensively particular treatments are applied. As part of theinvestment in such a program, a team of soil scientists, hy-drologists, and aquatic ecologists must actively participate tominimize the adverse effects on soil productivity and theaquatic environment. Although we have created forests thatcarry a high risk of damage to aquatic resources, pursuit ofquick fixes in an atmosphere of crisis carries substantial risksas well (Beschta et al. 1995).
T I M B E R H A RV E S T I N G
Harvesting of trees, especially in large clear-cut blocks, is com-monly perceived as a major impact on the hydrology of riverbasins. Although timber removal has dramatic effects on thewater balance of the immediate site, consequences at the catch-ment scale are not so obvious. As with many of the land man-agement activities discussed in this chapter, the proportionof the catchment that is treated and the proximity of the treat-ment to water courses are critical in determining the impactson water quantity, timing, and quality. In addition, associ-ated activities such as road construction, yarding, slash treat-ment, and site preparation usually have much greater impactsthan just the cutting of the trees. Hydrologic effects of selec-tion harvests are generally considered to be less problematicthan those of clear-cutting because the remaining trees removesoil moisture and provide some protection to the soil surface(Anderson et al. 1976). Harvest effects must also be consid-ered with respect to time. Fortunately, trees and other plantsquickly reoccupy most harvested areas, reestablishing pro-tection from raindrop impact, uptake of soil moisture, depo-sition of organic matter to the soil, and support of soil massesby roots. Slopes are most vulnerable to surface erosion andgeneration of excess water immediately after harvest or sitepreparation, but they have minimal root strength about a de-cade after harvest (Ziemer 1981).
Water Yield
Harvesting timber has the potential to increase annual wateryields via several mechanisms. Removal of all trees removesthe possibility of any interception losses over the former areaof the canopy. However, evaporative loss from rain and snow
detained in tree canopies may be a relatively small compo-nent of the water balance of forests in the Sierra Nevadaand has been estimated at about 30 mm (1.2 in) per year(Kattelmann et al. 1983). Removing trees also terminates tran-spiration in rough proportion to the extent of removal andthe ability of remaining plants to use the water. The depthand moisture storage capacity of forest soils largely controlthe amount of reduction in evapotranspiration from harvest-ing (Zinke 1987). When trees are harvested at the base of aslope near a stream, a large fraction of the soil water formerlyused by those trees will enter the stream. If trees are cut nearthe top of a slope, residual trees below the area harvestedmay use much of the “excess” water not transpired in theharvest unit, and relatively little of this water may reach thestream. More than one hundred studies of stream-flow re-sponse to forest harvesting have been conducted around theworld. These studies have been reviewed by many authors(e.g., Anderson et al. 1976; Bosch and Hewlett 1982; Ponce1983; Kattelmann 1987; Reid 1993; Marvin 1995, 1996). In al-most all cases, stream flow increases as basal area (and evapo-transpiration) declines. As vegetation regrows on the site,evapotranspiration increases and stream flow declines corre-spondingly (e.g., Troendle and King 1985). Intensive timberharvesting under the usual constraints of national forest man-agement could increase stream flow in most Sierra Nevadarivers by 1%–1.5% (6–9 mm [0.24–0.35 in]) (Kattelmann et al.1983; Rector and MacDonald 1987).
Peak Flows
Although most work to date has been done on changes in theseasonal water balance, short-term changes with respect tostorm response and flood augmentation are also important.Timber harvesting can affect peak flows through two princi-pal mechanisms: maintenance of high soil moisture in theabsence of evapotranspiration and higher rates of snowmeltduring rain events. In a simplistic sense, less rainfall is re-quired before runoff is produced if trees are not using storedsoil moisture than if trees occupy the site. Creation of open-ings in the forest alters energy exchange and snow storage.During warm storms, most snowmelt occurs through turbu-lent exchange processes (condensation and convection), whichare more effective at higher wind speeds. The greater windspeeds in forest clearings compared with dense forests in-crease the rate of snowmelt in the clearings relative to thatunder tree cover (Harr 1981; Berris and Harr 1987). Consider-ably more snow is found in forest openings than under forestcanopies because wind deposition of snow is favored in open-ings and much of the canopy-intercepted snow drips off asliquid water and enters the soil. In the intermittent snowpackzone, this difference in deposition can result in an absence ofsnow under trees while several centimeters of snow waterequivalence is available in openings to add water to stormrunoff.
Potential effects of land management on flood generation
898VOLUME I I , CHAPTER 30
are most pronounced during small and moderate storm eventsand in small catchments (Hewlett 1982). During rare, intensestorms, the differences in soil moisture storage or snow avail-able for melt are almost incidental compared to tens of centi-meters of rainfall (Ziemer 1981). At the river basin scale, floodpeaks in the main river depend on synchronization of floodpeaks from tributaries, which could be affected by drasticchanges in land cover either positively or negatively.
Sediment Yield
Mass movements can be enhanced by timber harvesting bymaintaining higher levels of soil moisture in the absence ofevapotranspiration and loss of the reinforcement of the soilmass provided by roots (Sidle et al. 1985). On the average,the structural integrity of hill slopes is at a minimum aboutnine years after harvest, when the decay of old roots is notyet compensated for by the growth of new roots (Ziemer 1981).Roads tend to cause far more problems with respect to massmovement than does timber harvesting, and documentationof logging as a direct cause of mass failure in the Sierra Ne-vada has not been found.
Brushland Management
Conversion of brush fields to grass could increase stream flowand probably sediment yields at lower elevations (Andersonand Gleason 1960; Turner 1991). A proposal to manage about130 km2 (50 mi2) of chaparral in the lower Feather River Ba-sin with prescribed burning and some conversion to grassestimated that annual stream flow would increase by morethan 3 million m3 (2,500 AF) (California Department of WaterResources 1983b). Risks of increased erosion from such a pro-gram (e.g., Pitt et al. 1978) would need to be balanced againstthose from catastrophic fire. Conversion of brush fields toconiferous forest at higher elevations could delay snowmelt(Anderson 1963).
Observed Impacts
From a mechanistic point of view, forest harvesting in the pastcouple of decades has had limited opportunity to cause ma-jor changes in stream-flow volume, peak discharges, or sedi-ment yield. In most river basins, the fraction of the basin areaharvested per decade does not seem sufficient to cause majorhydrologic responses. Nevertheless, peak flows in the SouthFork Tule River appear to have increased in recent decadescoincident with extensive road building and logging (seeMarvin 1996). The level of harvesting since World War II hasprobably increased water yield somewhat in smallercatchments, but any increase may have been partially com-pensated for by increases in total vegetation density result-ing from effective fire suppression over the same period.Unfortunately, neither influence can be quantified with anyconfidence. Similarly, we lack the appropriate data to observe
whether modest changes have actually occurred. Except inthe Tule River case (see Marvin 1996), no changes in thestream-flow record that clearly exceed natural variability havebeen noticed. With respect to sediment yield, data are not cur-rently available to show any change over the past few de-cades at larger scales except in the Mokelumne River, wheresediment yield has increased dramatically (EBMUD 1995). Ap-propriate baseline data in reservoir surveys could be used todetermine if sediment yields have increased as a cumulativeresult of all types of land disturbance. Carefully performedfollow-up surveys are needed to find out if land-managementactivities have made a significant difference.
At the smaller watershed scale, there is at least some ob-servational evidence to suggest that land management affectsthe hydrology of small streams in the Sierra Nevada. Again,the impacts are the result of all activities associated with har-vesting, such as road construction, skidding, and site prepa-ration. Landslides that begin at roads and that are the onlyoccurrences of mass movement in a catchment can be attrib-uted to management activities. Similarly, when the only poolsin a channel reach that are filled with silt are those immedi-ately below clear-cuts that included the riparian zone, we caninfer some cause and effect. However, even when impacts areoverwhelming at the local scale, they are quickly maskeddownstream because few other contributing catchments weretreated in the same way. A few studies in the Sierra Nevadahave indicated impacts at the small watershed scale. Sus-pended sediment increased in the 10 km2 (4 mi2) Castle CreekBasin near Donner Summit during the first year followingroad construction and timber harvesting (Rice and Wallis1962). Sediment captured in weir ponds below a catchment1.2 km2 (0.5 mi2) in area on the Sequoia National Forest in-creased severalfold after road construction and harvesting(McCammon 1977). Stream reaches in twenty-four smallstreams in the Sierra Nevada and Klamath Mountains hadsignificantly higher indices of stored sediment than corre-sponding control reaches (Mahoney and Erman 1984). Wateryields from Berry Creek (20 km2 [7.5 mi2]) near Yuba Passseemed to have increased substantially following harvests onless than half the basin (Kattelmann 1982). Peak flows mayhave increased in part of the Mokelumne River Basin as aresult of extensive harvesting (Euphrat 1992). Unfortunately,long-term paired-catchment studies have never been per-formed in the Sierra Nevada, so we are left attempting to in-fer impacts from experiments elsewhere.
Aquatic Effects
Studies that began in the 1970s on several streams in the north-ern Sierra Nevada and Klamath Mountains demonstrated thatcommunities of aquatic invertebrates changed significantlyin response to upstream logging (Erman et al. 1977; Newboldet al. 1980; Erman and Mahoney 1983; O’Connor 1986; Fong1991). Some of the aquatic effects have persisted for two de-cades (Fong 1991). The aquatic communities are particularly

899Hydrology and Water Resources
sensitive to logging-related disturbance within 30 m of thechannel (Erman and Mahoney 1983) and perhaps within 100m (McGurk and Fong 1995). In a recent study of forest man-agement effects on aquatic habitat in the Sierra Nevada, datawere collected on channel characteristics, aquatic habitat, fishabundance and health, aquatic invertebrate abundance, largewoody debris, water chemistry, and management history intwenty-eight different basins in the Sierra Nevada (Hawkinset al. 1994). In general, natural variability in the measuredattributes masked effects of management activity. Responseof aquatic organisms to disturbance in the watersheds tendedto be small compared with response to natural factors. Ob-served increases in nutrient loading and temperature ap-peared to enhance abundance of some taxa without anynoticeable adverse impacts on others. Most of the communi-ties in the observed streams appeared to be limited by foodresources. The study noted, “We cannot at this time eithermeasure or predict with any degree of reliability or confidencethe cumulative effects most types of land use practices willhave on natural ecosystems” (Hawkins et al. 1994, 1).
G R A Z I N G
Grazing of domestic livestock has probably affected more areain the Sierra Nevada than any other management practice(Menke et al. 1996). Over the past century and a half, cattleand sheep have been virtually everywhere in the mountainrange that provides forage. The near-ubiquitous presence ofgrazing animals has left few reference sites that we can becertain were never used by livestock. The best approxima-tions to ungrazed conditions are those areas that have beenrested for a few decades. Even Sequoia National Park wasgrazed until 1930 (Dilsaver and Tweed 1990). The absence ofreference sites leaves us uncertain about what an ungrazedstream looks like and how it functions. This uncertainty isnot merely an academic concern. Major questions of grazingmanagement depend on our confidence in our understand-ing of how natural systems function without human-inducedperturbations. For example, we can hypothesize that over-grazing on the Kern Plateau in the 1800s contributed to thewidespread arroyo development and conversion of wet mead-ows to dry terraces. There are several lines of evidence thatsupport that hypothesis. However, we would have more con-fidence if one of the early shepherds had invested a couple ofsummers in fencing off an entire watershed and preventingentry just to satisfy the curiosity of future generations. Thisproblem of uncertainty exists to some degree with all impacts,but there are many areas that were not mined, dammed,logged, roaded, or urbanized. There just are not many thatwere not grazed.
In 1924, Aldo Leopold wrote, “Grazing is the prime factorin destroying watershed values,” in reference to an overgrazed
site in Arizona. Since then, debate has continued about thevalidity of similar statements applied to watersheds through-out the West. The impacts of grazing that relate to hydrologydepend primarily on the behavior of the animals: feeding,drinking, producing waste, and traveling. If the animals re-main in one place too long and consume much more thanabout half the available forage, vegetative recovery may beimpaired and an excessive amount of bare soil may be ex-posed to erosive rainfall (Fleischner 1994; Committee onRangeland Classification 1994). Although the amount of con-sumption that constitutes “overgrazing” depends on vegeta-tion and site characteristics (Menke et al. 1996), half of theinitial forage is a useful, though admittedly crude, rule ofthumb (California Division of Forestry 1972). When insuffi-cient vegetation remains after grazing, raindrop impact canchange surface conditions and consequently reduce infiltra-tion and increase erosion (Ellison 1945). Soil can become com-pacted by the repeated pressure of moving animals, especiallyif the soil is wet. The combination of soil exposure and com-paction can decrease infiltration and increase surface runoff.If infiltration capacity is severely limited on a large fractionof a catchment, the extra runoff can quickly enter streams andgenerate higher peak flows (e.g., Davis 1977).
Surface and Channel Erosion
Exposure of mineral soil and enhanced overland flow alsoaccelerate erosion. A variety of studies around the West havefound dramatic increases in sheet erosion and gullying inovergrazed sites compared with ungrazed areas (Fleischner1994). Severe gully erosion in the uplands of the North ForkFeather River has been caused by decades of overgrazing(Soil Conservation Service 1989). Nevertheless, the worst ero-sion problems associated with grazing typically occur nearstreams. Cattle tend to congregate in riparian areas for obvi-ous reasons: abundant food, water, shade, and lower tempera-tures. Consequently, riparian vegetation is overgrazed, banksare trampled and eroded back, and bed deposits are disturbed.All this activity adds significant amounts of sediment directlyto the stream. Dislocation of sediments in the streambed bymoving animals augments suspended sediment. Degradationof riparian vegetation permits bank erosion to accelerate un-der the more frequent peak flows that are caused by the de-crease in infiltration capacity. About half of the channels inthe Meiss allotment in the Upper Truckee River watershedwere identified as being in fair or poor condition as a resultof overgrazing (Lake Tahoe Basin Management Unit 1993).Changes in channel morphology have been related to over-grazing in headwater streams tributary to the Carson River(Overton et al. 1994). Elimination of riparian vegetation byovergrazing in the broad alluvial valleys of the North ForkFeather River has led to rapid channel widening and massivesediment loads (Hughes 1934; Soil Conservation Service 1989).In other areas, such as meadows of the Kern Plateau and SanJoaquin River Basin, downcutting has followed overgrazing

900VOLUME I I , CHAPTER 30
(e.g., Hagberg 1995). Development of these deep arroyos haslowered the local ground-water table and transformed wetmeadows into dry terraces supporting sagebrush. The possi-bly compensatory effects of less bank storage and less tran-spiration by vegetation determine whether low flows insummer are decreased or increased by the downcutting. Arecent study of channel characteristics between pairs of cur-rently grazed areas on national forests and long-rested areasin national parks in the Sierra Nevada found significant dif-ferences in bank angle, unstable banks, bed particle size, andpool frequency (U.S. Forest Service 1995b). Significant differ-ences in undercut and unstable banks were also observedbetween grazed areas and adjacent fenced exclosures with afew years of rest.
Water Temperature
Removal of riparian vegetation and channel widening bygrazing expose the stream to much more sunlight. Therefore,stream temperatures in summer may be several degreeshigher than if shade remained. In winter, the absence of ri-parian vegetation may allow wind scour of snow in exposedcreeks in high-elevation meadows. With less snow serving asinsulation, ice formation may be greater than in creeks withvegetation capable of trapping more snow, which providesinsulation itself. These artificial changes in temperature im-pact aquatic organisms that rely on a more natural tempera-ture regime.
Water Pollution
Congregation of cattle in and around streams provides a di-rect pathway for nutrients and pathogens to degrade waterquality (Springer and Gifford 1980; Kunkle 1970). High nu-trient loads promote the growth of aquatic algae, which canvirtually clog streams at low flow. An example of prolifera-tion of aquatic plants apparently augmented by cattle is foundin the Owens River above the Benton Crossing road. Highlevels of coliform and other bacteria have been found instreams heavily used by livestock (Lake Tahoe Basin Man-agement Unit 1993; Central Valley Regional Water QualityControl Board 1995). Cattle grazing in backcountry areas pro-vides a source of Giardia cysts (Suk et al. 1985).
Associated Impacts
There are a variety of ancillary effects of grazing. Road con-struction to provide access to range improvements has simi-lar impacts to those of roads in general, depending on thelocation and design. Springs are extensively developed forstock watering, at the expense of native biota. Irrigated pas-ture consumes immense quantities of water for a low-valueproduct (Romm et al. 1988).
Improved Practices
Improved grazing practices as applied to the Sierra Nevadahave the potential for limiting many of the possible adverseimpacts (Albin-Smith and Raguse 1984). Major changes ingrazing practices in some parts of the eastern Sierra Nevadahave recently occurred. A study is currently under way moni-toring the response of macroinvertebrates and fish to ripar-ian fencing and rest-rotation management (Herbst and Knapp1995a, 1995b). Degraded channels in the Meiss allotment atthe south end of the Lake Tahoe Basin led to a decision by theForest Service to rest the allotment for five to fifteen yearsuntil stream-bank vegetation has recovered (Lake Tahoe Ba-sin Management Unit 1993). However, this decision was over-turned on appeal by the regional forester in 1995.
U R BA N , S U B U R BA N , A N DE X U R BA N D E V E L O P M E N T
The population of the Sierra Nevada foothills is expected toincrease rapidly in the next few decades (see Duane 1996a).Conversion of forests and woodlands to residential and com-mercial land uses has several serious hydrologic effects onlocal streams (Lull and Sopper 1969). Such conversions dra-matically alter the disposition of rainfall or snowmelt on thelandscape by reducing infiltration capacity of the surface tozero or near zero. Land that was formerly well vegetated andrarely, if ever, produced overland flow is converted to an im-pervious zone where virtually all precipitation becomes im-mediate runoff. The extent of such changes and the ability ofadjacent land to absorb the additional runoff determines theresponse of streams. Gutters, ditches, drains, channels, cul-verts, and storm sewers are intended and designed to conveyrunoff as rapidly as possible to streams. The combination ofgreater volume of runoff, faster generation of runoff, andgreater channel efficiency moves more water downstreamfaster than under natural conditions. This convergence of largevolumes of water in short periods of time produces frequentfloods downstream from even modest rainfall (Leopold 1968).The more frequent floods lead to channel enlargement by ero-sional processes (Dunne and Leopold 1978; Booth 1990). Un-fortunately, stream gauging stations have not been placed instrategic locations to actually record changes in stream-flowregimes in response to development in the Sierra Nevada.
Impervious Surfaces
The proportion of impervious area created by residential con-struction is a rapidly decreasing function of lot size. Smallurban lots can be effectively sealed over three-quarters of theirsurface area, while lots of 0.4 ha (1 acre) might be imperviouson only 10%–15% of the area. So-called low-density residen-
901Hydrology and Water Resources
tial lots can be 20%–30% impervious surface (California Divi-sion of Soil Conservation 1971b). Larger parcels would havemuch smaller proportions rendered impermeable by construc-tion. Although impervious area is a small fraction of dispersed“ranchette” development, the amount and intensity of con-version of natural vegetation to other uses, such as orchards,vineyards, pasture, ostrich ranches, and Christmas tree farms,will determine the hydrologic impacts. The area occupied byroads is closely associated with the density of structures. Inaddition, the quality of road location and construction willinfluence the potential for adverse effects. Poorly designedroads for subdivisions are a principal source of sediment inNevada County (Gerstung 1970).
Channelization
Channelization (forcing streams into engineered waterways)has been practiced in the Sierra Nevada since the first min-ers’ ditches for water supply were constructed and rivers wereconfined in wooden flumes while their gravels were exca-vated. During the mining era and subsequent developmentof water resources for hydropower, municipal, and agricul-tural uses, streams were put into artificial channels to get thewater to another place where it was wanted. Around roadsand towns, the usual objective of channelization is to get wateraway from a place where it is not wanted. Creeks of all typesand sizes have been relocated, smoothed, and straightenedto get water away from roads and homes as quickly as pos-sible. These ditches, canals, and storm sewers enhance theflood-producing effects of general land conversion by rout-ing the extra runoff away from the town or road much morequickly than under natural conditions. Peak flows are aug-mented downstream, but that is typically beyond the con-cern of the local channelization project. Flooding in Rosevilleduring January 1995 was a classic example of this phenom-enon. Failure of artificial drainageways and streets to performas expected can also cause damage within the communityattempting to control the runoff, as occurred in Cameron Parkin 1982 and 1983 (Soil Conservation Service 1985). At higherelevations, runoff rates from snowmelt may also be acceler-ated where infiltration is limited in significant fractions of awatershed (Buttle and Xu 1988).
Vegetation Removal
Other hydrologic impacts of conversion to residential andcommercial land uses include reduction of interception andtranspiration functions of trees and other vegetation via theirremoval. All plants intercept and store some proportion ofthe precipitation received. Water retained in the canopy even-tually evaporates. Continuous vegetation cover can reducethe amount of water reaching the ground substantially, de-pending on storm amounts and frequency. Removing the veg-etation largely eliminates this function. Whatever replaces theplants usually has some interception capacity. However, roofs,
latticework, and other structures do not transpire. So, veg-etation conversion eliminates the active removal of soil mois-ture and its transfer to the atmosphere. Soil moisture wouldremain higher in the absence of transpiration if soil moisturerecharge could take place through whatever covers the soilinstead of vegetation. Where impervious areas are con-structed, recharge of shallow and deep ground water is mini-mized. If the total area of limited infiltration is a significantfraction of a catchment, ground-water levels will decline.Stream flow during nonstorm periods that was formerly gen-erated by seepage from ground water will also decline.Ground-water pumping for domestic and irrigation supplycan exacerbate the problems of restricted recharge. In somecases, irrigation return flows may augment summer streamflow.
Water Pollution
The changes in runoff are closely related to declines in waterquality associated with urban development. Enhanced run-off washes various contaminants off roofs, streets, parkinglots, gutters, horse corrals, and golf courses and into streams.Diminished base flow increases the concentration of residualpollution entering after the floods. Urban pollutants includesoil particles, nutrients, heavy metals, toxic organic chemi-cals such as pesticides, oil and grease, fertilizers, oxygen-demanding materials such as yard waste, and bacteria andother pathogens (Terrene Institute 1994). The diversity ofsources makes control difficult, but best management prac-tices are being developed and applied to control urban run-off. Development of riparian areas limits opportunities forfiltering, uptake, and assimilation of contaminants. The com-bined effects of changes in runoff regime, water quality, andchannel structure resulting from urbanization have profoundeffects on aquatic life. Eliminating infiltration on as little as atenth of the catchment area led to declines in population offish and amphibians near Seattle (Booth and Reinelt 1993).
Accelerated Erosion
Removal of vegetation, grading, and exposure of bare groundallows erosion to increase dramatically, especially during con-struction. Freshly cleared land for a new subdivision inPlumas County produced enough sediment in a single intensestorm to kill 80% of the aquatic life in Big Grizzly Creek (Cali-fornia Division of Soil Conservation 1971b). In NevadaCounty, more than a third of the total length of streams hasbeen damaged by siltation and stream-bank erosion result-ing from subdivision development (Gerstung 1970). Erosionrates in the Middle Creek watershed near Shasta City in-creased more than twentyfold following urban development(Soil Conservation Service 1993). Residential constructionaround Lake Tahoe has been a major contributing factor inaccelerating erosion and increasing nutrient inputs to the lake(Tahoe Regional Planning Agency 1988).

902VOLUME I I , CHAPTER 30
Sewage
Effluents from wastewater treatment facilities and leachatesfrom dispersed septic systems add nutrients to ground waterand streams. Breakdowns and spills from sewage facilitiescan introduce pathogens to receiving waters. Leaks fromsewer lines have been recognized as an important source ofnutrients in the Lake Tahoe Basin (Tahoe Regional PlanningAgency 1988). Wastes from domestic animals and pets canalso contaminate streams. Organic wastes can deplete dis-solved oxygen in streams as well. Water quality was consid-ered impaired in streams receiving wastewater from NevadaCity, Grass Valley, Placerville, Jackson, and the Columbia-Sonora area (Central Valley Regional Water Quality ControlBoard 1991). Small sewage treatment plants serving recre-ational developments often suffer from inadequate financing,technology, and management (Duane 1996a). A facility atCalifornia Hot Springs alternately released excessive amountsof barely treated sewage or chlorine for several years. GiantForest Village in Sequoia National Park was largely closedduring the winter of 1994/95 because of poor performance ofthe wastewater treatment facility. Disposal of solid waste alsohas the potential to contaminate ground water and streams.Older landfills were probably not carefully located or de-signed and may be producing hazardous leachates. Locationof new landfill sites is so difficult that Tuolumne County isplanning to export its garbage to Lockwood, Nevada.
Water Supply
Supplying water for new development is problematic in manyparts of the Sierra Nevada, which is ironic given the high run-off production of the mountain range. Coping with the sea-sonal distribution of runoff usually involves construction ofstorage reservoirs when large numbers of users are involved.Beyond the seasonal availability, most of the difficulties arelegal and financial rather than physical. Surface waters arealready overappropriated in many watersheds. Newcomersmay find that all the local water is already claimed. Also, thereseems to be a widespread belief that water should be sup-plied free or for a minimal charge—that somebody else (i.e.,“the Government”) should subsidize water supplies. Com-munities are often in favor of augmenting their water sup-plies for new development until they find that they areexpected to share the cost. The Calaveras County Water Dis-trict has financed its water development through the sale ofhydroelectricity. Tuolumne County is faced with large costsand potentially high water rates from its redevelopment ofthe Lyons Reservoir system, acquired from the Pacific Gasand Electric Company.
The California Department of Water Resources (1990a) iden-tified several generic problems facing rural water supply inthe Sierra Nevada, which remain pertinent today:
• Rapid growth and development will burden existing wa-ter supplies and sewage treatment.
• Ground-water sources are not reliable in terms of quantityand quality.
• Water distribution systems are inefficient.
• Communities located on ridges are gravitationally disad-vantaged.
• The best locations for impoundments have already beenexploited by others.
• The revenue base is not sufficient to support water facili-ties at low rates per customer.
• Local funding sources are limited.
• Developing new water projects is economically and envi-ronmentally costly.
• Construction of new conveyance systems is expensive be-cause of dispersed users and terrain.
Water companies and water-supply service districts in theSierra Nevada vary in size from a few dozen customers totens of thousands (Department of Water Resources 1983a;Harland Bartholomew et al. 1992). The nature of their sources,delivery and treatment systems, and demands are highly vari-able as well (e.g., Thornton 1992; Borcalli and Associates 1993).There are more than 160 separate water purveyors in PlacerCounty alone (Placer County 1994). Water demands for indi-vidual households in the foothills have been estimated at 600–1,200 m3/yr (0.5–1 AF/yr) (Page et al. 1984; HarlandBartholomew et al. 1992). Supplying new customers with ex-isting water supplies may place current consumers at risk ofshortfall during dry periods. Legislation was passed in Cali-fornia in 1995 (SB 901) to limit the ability of cities and coun-ties to allow new developments unless local water purveyorscertify that adequate water supplies exist for both present andexpected residents. Sources of water for large proposed de-velopments in the foothills, such as Yosemite Estates nearSonora, Las Mariposas near Mariposa, and Promontory nearPlacerville, are uncertain. Excessive water withdrawals fromlocal streams can threaten recreational fisheries that form partof the economic base supporting the communities seeking theextra water for more development (Kattelmann and Dawson1994). Development of additional water supplies is likely tobecome increasingly costly in both financial and environmen-tal terms.
The projected demand for additional water in the foothillsin the next few decades is staggering (see Duane 1996a). TheGeorgetown Divide Public Utilities District expects a 50% in-crease in water use in the next thirty years, and the El DoradoIrrigation District anticipates demand to double in the sameperiod (Borcalli and Associates 1993). In Amador County,domestic water use was forecast to rise by between 2.6 timesand 3.6 times between 1983 and 2020, depending on which

903Hydrology and Water Resources
population projections were used (Department of Water Re-sources 1990a). Tuolumne County expects to add 14,000people in the next twenty years, who will need about 8.6 mil-lion m3 (7,000 AF) of water each year to support them. Thelargest expected increase has been postulated for the servicearea of the Nevada Irrigation District, where annual domes-tic use could go from about 15 million m3 (12,000 AF) to about40 million m3 (33,000 AF) between 1992 and 2010 (HarlandBartholomew et al. 1992). Nevada County is in perhaps thebest position to meet the expected demands. The Nevada Ir-rigation District currently has rights to more water than isused and has a vast base of agricultural use that is expectedto decline. Calaveras County also appears to have a relativelysecure water supply. Some streams that have been dewateredbelow diversions may receive some flow for instream needsas older contracts expire and are reviewed. Other regions mustfind new sources of water and presumably will want to buildnew storage facilities or acquire existing hydroelectric projects.
S K I A R E A S
As the major industrial/commercial development in thehigher-elevation parts of the Sierra Nevada, ski areas havegenerated public concern about impacts of the resorts on waterresources. Because of their extensive marketing campaignsand their location along the major access roads of the range,one could get the impression that there are ski areas all overthe Sierra Nevada. However, the twenty-five alpine resortsoccupy a tiny fraction of the land area in the mountain range.Only a few of the larger resorts, such as Squaw Valley, AlpineMeadows, Heavenly Valley, and Kirkwood, occupy a majorproportion of the immediate watershed they are situated in.Most of the more significant impacts of ski resort develop-ment are associated with base facilities, roads, and parkinglots. Such facilities are usually located in a valley bottom andimpact streams and wetlands. For example, the parking lotof Boreal Ridge converted a large subalpine meadow into anexpanse of impermeable asphalt and channelized CastleCreek. Because of the need for flat ground at the base of skiareas, many streams have been rerouted or even put under-ground. Access roads are often located in riparian zones. Run-off from roads and parking lots is usually polluted. The basefacilities, lodging, and recreational residences generate sub-stantial amounts of wastewater, which has usually requireda local sewage treatment plant. Sewage system failures occa-sionally occur under harsh winter conditions. Most of theimpacts of small urban areas can be applied to resort devel-opment. Ensuring an adequate water supply for all uses (resi-dential, commercial, snow making, landscaping, erosioncontrol plantings, and golf courses) for a major resort com-munity can be problematic even in prolific source areas ofsnowmelt runoff (Kattelmann and Dawson 1994).
Vegetation Conversion
Impacts related to the ski slopes themselves begin with treeremoval for runs and lift access. Such clearing constitutes apermanent conversion of vegetation type, as opposed to for-est harvesting, which implies hydrologic recovery. When runsare cleared, deep-rooted trees are replaced with shallow-rooted grasses, greatly reducing evapotranspiration and in-creasing soil moisture storage. Because ski runs are typicallyoriented down the fall line, there is little opportunity for treesdownslope to use the extra soil water in transit. Type conver-sion on ski runs can generate at least 7–15 cm (3–6 in) per unitarea harvested of additional stream flow (Hornbeck and Stuart1976; Huntley 1992). In some situations, subsurface drainagepipes and new surface channels may need to be installed toaccommodate the additional water and avoid saturated con-ditions that could lead to mass movement. In some areas, thereis extensive excavation and shaping of the natural terrain.Maintenance of sufficient ground coverage for adequate ero-sion control may require artificial irrigation and fertilizers insummer. Excessive use of fertilizers can contribute to highnitrate levels in local ground water (Goldman et al. 1984).Erosion from ski areas seems to be fairly well controlled andlargely in compliance with rules from the regional water qual-ity control boards, especially in the Lahontan Region. Gen-eral construction always has the potential for acceleratingerosion, but best management practices for minimizing soilloss at ski areas are becoming fairly thorough (i.e., CalaverasRanger District 1991). In general, ski areas can afford to in-vest in erosion control and slope stability techniques that arenot possible outside of major engineering projects. Somewhatanalogous to abandoned mines, abandoned ski areas havepotential for severe erosion problems, as occurred at Pla-Vada,where high sediment loads from gullies on the ski slopes dam-aged fish habitat in the nearby South Yuba River (CaliforniaDivision of Soil Conservation 1971a).
Snow Compaction
Grooming operations, avalanche control, and skiing compactthe snow and move some of it downhill. A study of effects ofcompacted snow near Donner Summit found that snow wa-ter equivalence on the narrow ski runs was up to 50% greaterthan that on adjacent uncompacted slopes and that ski runsremained snow covered for up to two weeks longer than ad-jacent uncompacted slopes (Kattelmann 1985). Chemicals,such as ammonium nitrate, sodium chloride, and calciumchloride, have been used at a few ski areas to prepare racecourses and improve skiing conditions in spring and sum-mer. In general, only small areas are treated with relativelysmall quantities of chemicals. Degradation of water qualityis a concern and has been reported in Europe.

904VOLUME I I , CHAPTER 30
Artificial Snow
Snow making has become widespread among the ski areas ofthe Sierra Nevada because skier demand seems to be greatestin November and December, when natural snow cover maybe marginal. Artificial snow is produced by mixing water andair under high pressure through a nozzle. The sudden expan-sion cools the water and forms ice particles, which provide areasonably good skiing surface and base for natural snow.Typical depths of applied water range from 20 to 50 cm (8–20in), so the area covered is the main determinant of the totalvolume of water used. Most of the water used is returned tothe stream it was originally withdrawn from, but delayed by5 to 8 months. Evaporative losses of 2%–5% occur at thenozzle, and sublimation losses from artificial snow on theground (and not covered by natural snow) range from 10 to50 mm depending on how long the snow is exposed (Eisel etal. 1988; Huntley 1992). If water diversions for snow makingwill seriously deplete stream flows during the low-flow partof the year, off-channel storage capturing one season’s snow-melt runoff to artificially initiate the following season’s snowcover, such as is practiced at Mammoth Mountain, may bewarranted.
Prospects for Expansion
Despite seemingly flat skier demand and the failure of abouta quarter of the nation’s smaller ski areas in the past decade,future prospects appear good enough to the ski industry toadd additional capacity (see Duane 1996b). For example, rev-enues at Northstar-at-Tahoe and Sierra-at-Tahoe grew by 4%in the first quarter of 1995. Major expansion occurred at SugarBowl in 1994 and is planned at Kirkwood. Squaw Valley hasproposed construction of a new base complex and has plansfor year-round skiing. An entirely new ski area has been ap-proved by the Forest Service in the Mammoth Lakes area, but$50 million in financing for construction may be difficult toobtain. Various large-scale development schemes have beenproposed in the Royal Gorge/Devil’s Peak region near SodaSprings.
I N T E R P R E TAT I O N S
Historic and Current Conditions
The most significant impacts to the hydrologic system of theSierra Nevada started almost immediately with the boom inEuro-American entry into the mountains during the gold rush.The effects of riverbed and hydraulic mining were devastat-ing to the rivers of the western slope. Substantial recovery ofthe obvious features of channel morphology and riparianvegetation provides the appearance of natural rivers, but theaquatic and riparian ecosystems may remain quite simplified
compared to the pre-1848 conditions. However, we will neverknow. As mining subsided, water development quickly tookits place as an overwhelming, though less intensively destruc-tive, impact. Although the severity of overgrazing may havepeaked between about 1890 and 1930, continued grazing pres-sure has prevented thorough recovery of many degradedstreams, and some (e.g., North Fork Feather River) continueto deteriorate. Early logging probably denuded larger ex-panses of the Sierra Nevada but may have applied less in-tense hydrologic disturbance to the soil than the road-buildingand tractor-skidding era that began after World War II. Thevarious impacts of residential development have acceleratedin the past decade. Impacts of fire and the legacy of fire sup-pression have yet to play out.
Water resources of the Sierra Nevada are highly controlledfor various social purposes. That management causes thegreatest current impacts to other social and ecological uses.The degree of alteration of natural stream flows generally in-creases in the downstream direction where the water passesthrough or is withdrawn by successive projects. However, theamount of unregulated flow from hydrologically intact tribu-taries also increases downstream, helping to “dilute” the ef-fects of river engineering, at least until the big dams on themain rivers are reached. The dilution effect is also importantin ameliorating changes in land use, which are most obviousclose to their point of occurrence. The addition of water fromrelatively unimpacted watersheds helps offset the adversecumulative impacts of assorted disturbances. Downstream ofpoints of diversion, streams may lack the capacity to trans-port natural and accelerated sediment yields. Overall, waterquality remains high compared with other rivers of the UnitedStates, but many problems exist locally. Alterations in the flowregime may be the most widespread degradation of waterquality.
The primary trends related to water resource conditionsat the scale of the entire mountain range have been recoveryfrom gold mining and increasing regulation of streamflow via water developments. Both trends have diminishedthrough time after the main geomorphic adjustments to min-ing debris and early dams occurred and the optimum damsites and water rights were acquired and developed. Impactsfrom forest road building may have peaked as most of thepotential road network would seem to be in place (see McGurkand Davis 1996); however, the high road density in somecatchments ensures continued sediment yields at high rates.Impacts from residential road building and associated activi-ties seem to keep increasing as the development of the foot-hills continues. An important question for planners is how tomeet growing water demand while minimizing the environ-mental impacts of additional water development.
Some Implications
The overwhelming impacts on the water-resource system ofthe Sierra Nevada are those that directly modify the flow re-

905Hydrology and Water Resources
gime and the channel. Landscape impacts are secondary inthose river basins of the Sierra Nevada with substantial wa-ter development. Even among land-use activities, those adja-cent to or near a channel have far greater impacts thanactivities distant from water. Improvement of land-manage-ment practices and restoration should focus on issues closestto the streams if amelioration of aquatic impacts is a primarygoal. Similarly, stream health will not suffer so much if dis-turbances are positioned well away from streams. Through-out this discussion of stream health, there is a presumptionthat fully functional aquatic ecosystems are inherently valu-able and that attributes of streams beneficial to aquatic life(natural flow regime, low sediment transport, stable chan-nel, good chemical quality, etc.) are also beneficial to thehuman uses of water. Aquatic ecosystems in headwatercatchments are at greatest risk of damage from land dis-turbance. Combined effects of water engineering and landmanagement may be particularly harmful to some aquaticcommunities.
Time Significance
Although there is no absolute urgency in changing the waysociety treats streams, the sooner damaging practices are im-proved or avoided, the sooner streams will benefit. Takingcare of existing problems sooner rather than later and avoid-ing new mistakes will reduce the total impact (e.g., less sedi-ment into stream pools or reservoirs) and may cost far less inthe long run. Lake Tahoe is the best example of a system thatneeds urgent attention to slow the rate of deterioration of aparticular resource or value (i.e., lake clarity). At Lake Tahoe,human activities have clearly altered a critical component ofthe ecosystem (nutrient cycling), and because the lake is ex-traordinarily sensitive in that regard, ecological responses areobvious and rapid. Although there are few real parallels tothe Tahoe situation in terms of urgency, there are many otherimportant problems to address. For example, reducing stream-bank erosion in the North Fork Feather River is clearly animportant goal. As long as comprehensive action is delayed,productive alluvial land will continue to be lost, streams willcontinue to carry high sediment loads, and downstream res-ervoirs will continue to fill with sediment at unnaturally highrates. The most urgent problems are those where continueddegradation could be irreversible or extremely expensive tomitigate if allowed to persist.
Perceptions
The adverse impacts of water management are probably over-looked by the public at large because of the obvious, personalbenefits of that management. Perception of water-related im-pacts from residential development in the foothills is prob-ably mixed depending on whether the individual has livedin a foothill community for decades, is a newcomer, relies oncontinued growth for personal income, or does not live in the
area. Water-related problems associated with land manage-ment may be perceived by some people as more serious thanthey really are because of the visual impacts and media at-tention. The degree of destruction and subsequent recoveryfrom placer and hydraulic mining are not widely recognized.
Gaps
Obviously, the operational difficulties lie in site-specific de-tails. The assessment in this chapter is a very broad treatmentof an entire mountain range. The problems are in particularstreams. Every watershed has a story that is critical to its ownstream. Management is conducted at that scale. The broadgeneralizations made here only provide the regional contextfor individual catchments and streams. The absence of infor-mation on recent sediment yields and limited stream-flowrecords from unregulated streams prevent any quantitativeconclusions about how much land management has alteredyields of water and sediments in the Sierra Nevada. Impactson aquatic biota are also difficult to quantify because of scarcebaseline data (see Erman 1996; Moyle 1996; Moyle and Randall1996; Moyle et al. 1996).
Ecosystem Sustainability and Management
The physical recovery of streams from the gold mining erademonstrates the resiliency of rivers. Although recovery isprobably to a more simplified state, with some lingering at-tributes of the original disturbance, this recovery illustratesan inherent long-term sustainability of the fluvial and aquaticsystems, even in response to catastrophic impacts. On land,vegetation seems to reclaim favorable sites (i.e., riparian ar-eas, north-facing slopes) very quickly after fire or logging.Drier sites and areas with special problems may require ac-tive intervention to reestablish ground cover in the short termor the avoidance of such sites in the first place. Recovery ofother ecosystem properties and processes following distur-bance requires much more time and possibly some manage-ment if we are impatient with nature’s schedule. Ecosystemmanagement must avoid impeding natural recovery processesafter a fire or other disturbance, incorporate such processesin planning management programs, and augment them whennecessary to accelerate ecological change in a desired direc-tion, especially on difficult sites.
Remaining Questions
Among many important questions about hydrologic impactsof land management, three stand out:
1. How much has sediment yield been altered by human ac-tivities?
2. How much has the stream-flow regime (annual wateryield, peak flows, low flows) been altered?

906VOLUME I I , CHAPTER 30
3. How do changes in water quantity and quality relate todeclines in aquatic biota?
Reservoir sediment surveys on a 10- to 20-year cycle couldbe very informative about the first unknown. Establishmentof a long-term network of stream gauges in strategic loca-tions, such as actively managed headwater catchments, couldbe very informative about the magnitude of changes in hy-drologic processes resulting from changes in land use. Thepresent network informs us about water management andneeds to be supplemented to inform us about land manage-ment. An aquatic research program, such as that suggestedby Naiman et al. (1995), would help address many of the gapsin knowledge regarding streams of the Sierra Nevada.
C O N C L U S I O N S
From a hydrologic perspective, the Sierra Nevada seems tobe functioning adequately as the preeminent water source forCalifornia society, agriculture, and industry. However, thehydrotechnical structures that facilitate exploitation of streamsfor social uses create the greatest impacts to those very usesas well as to aquatic ecosystems. This highly managed watersystem has created artificial patterns of stream flow in thelower reaches of most rivers and their principal tributaries.There are not many opportunities for further development ofwater resources in the mountain range, given existing infra-structure and water rights. Financing additions to commu-nity water supplies without subsidies from hydroelectricgeneration will be difficult at best. Existing ground-waterdevelopment near foothill communities limits the availabil-ity of subsurface water as a dependable supply for futuregrowth. The managed flows and physical barriers to move-ment of water, sediment, and biota have substantially alteredaquatic and riparian ecosystems to something other thannatural.
Compared with the intentional alteration of stream flowthrough water management, hydrologic side effects ofchanges in land use are difficult to measure but are still be-lieved to be significant. Major changes in water and sedimentregimes have not been observed in the main rivers and theirlarger tributaries as a result of shifts in land use. There maybe a signal, but it is not obvious or well quantified. Hydro-logic changes resulting from land management are most likelyto be found in headwater areas, where a large fraction of thecatchment has been affected. Diversion of water from a streamwill limit transport of excess sediment loads and thereby com-pound the impacts of land disturbance. Roads are believed tohave increased sediment yields substantially, but the inferredchanges have not been measured in the Sierra Nevada. Over-grazing has probably altered channel conditions extensively,but the scarcity of ungrazed reference sites limits research-
ers’ ability to quantify impacts. Rapid expansion of foothillcommunities has theoretically altered runoff and erosion pro-cesses enough to cause noticeable impacts in downstreamchannels, but quantitative and documentary evidence out-side the Tahoe basin is lacking. Conversion of forestlands toroads associated with timber harvesting may have increasedannual water yields and peak flows somewhat at the smallwatershed scale. However, decades of successful fire suppres-sion may have increased evapotranspiration relative to a pre-1850 fire regime and partially compensated for the flowincreases attributed to roads and harvests. The offsetting mag-nitudes of either impact cannot be quantified at this time. Thelegacy of fire suppression creates substantial risks of serioushydrologic impacts from potential conflagrations.
Overall, chemical water quality remains high, but watercannot be considered pristine. Because of widespread biologi-cal contamination, surface waters throughout the range can-not be assumed to be drinkable. A few local problems are veryserious: Lake Tahoe, some abandoned mines, and some com-munities. Quality of receiving waters from the larger cities inthe foothills has been degraded. These aquatic systems arenot as sensitive to nutrient loading as Lake Tahoe. Excessivesediment production is the most widespread non-point-sourceproblem, but its extent and severity are unknown. Studies inother areas suggest that roads are the overwhelming sourceof sediments that end up in wildland streams. Disturbance inand near stream channels generates the vast majority of sedi-ment transported by the streams. Existing information aboutsediment yields in Sierra Nevada rivers is largely obsolete,and new reservoir sediment surveys are necessary to deter-mine whether changing land use has accelerated sedimenta-tion in the past few decades. Because of the importance offlowing water in diluting and dispersing pollution, alterationof stream flow by storage and diversion may be the funda-mental water quality problem in the Sierra Nevada.
M A N AG E M E N T I M P L I C AT I O N S
The ecological health of a stream is affected by all activities inits watershed. Those activities that directly control the flowregime or occur within the riparian zone usually have thegreatest potential impacts. Changes in reservoir managementpractices may offer the best hope for improving aquatic eco-systems where they are known to be influenced by artificialflow regimes. In general terms, some shifts back toward anatural hydrograph, such as seasonally fluctuating flows,occasional flushing flows, maintenance of adequate low flows,or whatever is appropriate to a particular situation, will bebeneficial to the local biota. Simply maintaining constant mini-mum flows is rarely sufficient. Stream habitat conditions andaquatic biota have developed in response to a highly variablenatural flow regime. Restoring some aspects of that variabil-

907Hydrology and Water Resources
ity in managed streams should have ecological benefits inmost cases. In some cases, changes in reservoir releases tobenefit downstream organisms and water quality may havefew adverse impacts on economics of the project. In othercases, there may be substantial costs, which may not be justi-fied for the intended benefits. The tradeoffs between in-streamimpacts and operational impacts must be carefully evaluatedin the context of each water project, the watershed it is lo-cated in, and the ultimate downstream uses. There could becontinued realignments in water rights as a result of applica-tion of the public trust doctrine, hydropower relicensing re-quirements, and regulation of reservoir releases by theregional water quality control boards for water quality man-agement. The State Water Resources Control Board could easelegal and administrative matters by improving their water-rights database. An efficient, geographically referenced data-base for water rights could allow examination of in-streamflow conditions in a cumulative context for each stream andriver system. Designation of additional wild and scenic riv-ers could help maintain ecological values of selected segments.
Major reconstruction of smaller dams to allow sedimentpass-through under high-flow conditions could help restoresome semblance of a natural sediment regime to manystreams. Such work is a serious challenge in hydraulic engi-neering and reservoir management, but it would be an im-portant contribution of technology to restoring naturalprocesses in the managed rivers of the Sierra Nevada. Provi-sion for flushing flows is particularly important where landdisturbance may have augmented natural sedimentation andregulated flows encourage sediment deposition.
Recent actions by the State of California and the U.S. For-est Service to use watersheds as a geographic basis for plan-ning and management are encouraging. As local agencies andcitizens begin to incorporate a watershed basis into their ownactivities, overall conservation of aquatic resources shouldgreatly improve. Continued public education about basicwatershed concepts can only help. Application of watershedanalysis methodologies developed in the Pacific Northwest(e.g., Montgomery et al. 1995) to the Sierra Nevada would bea worthwhile step toward improved management of wild-lands at the landscape scale (see Berg et al. 1996). Watershedanalysis can provide managers with better information aboutresource capabilities, existing problems, and sensitive areasbefore plans are made and projects are proposed. This analy-sis develops a logical foundation for decision making.
Reform of the 1872 Mining Act and greater application ofCalifornia’s Surface Mining and Reclamation Act to smallerclaims could improve many isolated problems associated withmining and prevent future adverse impacts. Laws relating toliability that prevent rehabilitation of abandoned mines needto be modified, and funding must be generated to clean upproblem mines. Mining of sand and gravel in streams of theSierra Nevada should be directed toward reservoir deltas,despite the increase in transportation cost. Public agenciesshould set an example by using reservoir sediments as a
source of aggregate whenever possible and avoiding chemi-cal use in surface waters. The Department of Fish and Game(which administers streambed alteration agreements) mightbe able to negotiate agreements between reservoir operatorsand aggregate miners and users.
Modern information on sediment yields is needed to de-termine whether sedimentation has increased as a result ofland-management activities. The California Department ofWater Resources’ Division of Dam Safety, the U.S. GeologicalSurvey, and the U.S. Natural Resources Conservation Servicemight be the appropriate agencies to cooperatively adminis-ter a program of routine reservoir sediment surveys.
More efficient means of monitoring hydrologic impactsfrom land-management activities need to be explored at theoperational field level and at the institutional level. Existingprograms do not seem to provide the information necessaryto evaluate how stream-flow regimes or water quality at-tributes are changing as a result of changes in land use. Cur-rent monitoring is also not adequate to determine whetherrestoration activities, including postfire treatments, are effec-tive and appropriate. Maintenance and improvement of thesnow survey, snow sensor, and climate station network is es-sential to management of water resources and detection ofclimate trends. Basic data collection programs to generatestream-flow, water quality, and climate information need tohave long-term support to be worthwhile.
Now that the forest road network is largely complete, moreattention should be focused on maintenance, relocation, up-grading, and decommissioning of roads by the engineeringstaffs of the national forests. Resource staffs have already iden-tified many of the specific problems in the road network thatneed attention. Road construction budgets have been high inthe past, and adequate funding is necessary to maintain, im-prove, and reduce the existing road system to minimize itsaquatic impacts.
As foothill communities continue to grow, conversion fromindividual septic systems (and individual wells, in some cases)to community systems will be necessary to avoid cumulativeimpacts on local water quality. Construction of treatment fa-cilities and collector systems is extremely expensive, especiallywhere houses are far apart. The issue of who pays for suchimprovements is problematic. The community systems wouldnot be necessary if not for the growth in potential pollutionsources. At the same time, a community system is necessarybecause the capacity of the soil and ground-water system totreat household sewage is at or near its limit. Except for theservice area of the Nevada Irrigation District, CalaverasCounty Water District, and a few others, foothill communi-ties will need to develop major new sources of water or dras-tically reduce existing demand if they wish to continue theirgrowth. Unless hydroelectric generating capacity is addedwhen developing new sources of supply, project financing andend-user water rates may be serious constraints on newprojects. Purchase of existing facilities (now largely ownedby the Pacific Gas and Electric Company) by small communi-

908VOLUME I I , CHAPTER 30
ties and water agencies may be an increasing trend in attemptsto augment community water supplies.
With all changes in land use and other disturbances, prox-imity to streams is a critical influence on the aquatic impactsof the activity. Simply minimizing disturbance of vegetationand soils near streams and conscientious application of bestmanagement practices for erosion control have the potentialfor reducing sediment problems. This locational emphasis isespecially important with respect to grazing. Overgrazed ri-parian areas need substantial rest to adequately recover frompast problems. Allowing such recovery means minimizing thepresence of livestock and other disturbances in riparian zoneson a continuing basis.
Management of forest fuels to reduce the risk of catastrophicfire must include thorough consideration of aquatic impactsand mitigation measures. If a major program of fuels treat-ment is started, a dedicated team of soil scientists, hydrolo-gists, and aquatic ecologists should be involved in theplanning and execution of such a program on local adminis-trative units. A team of specialists, on either a zone or regionallevel, is also needed to monitor and evaluate the long-termeffects of postfire treatments. Their experience could developa rational set of best management practices for dealing withburned landscapes.
Prevention of further degradation and correction of exist-ing water-related problems is expensive, as the Lake Tahoeexperience has demonstrated. Rehabilitation of forest roadsand restoration of degraded streams will require substantialinvestment. The forests of the Sierra Nevada contain threeresources of substantial economic value to society: water, tim-ber, and recreational opportunities. Some of their value in themarketplace could be returned to their sources and used toimprove the conditions favorable to their production. Becausethe benefits of water from the Sierra Nevada contribute to somany aspects of California’s economy, creative means of re-investing a portion of those benefits into the watersheds needto be explored.
A C K N OW L E D G M E N T S
Most members and associates of the SNEP team contributedto this chapter through comments, discussions, suggestions,contacts, reviews of drafts, and material in their own chap-ters. In particular, I wish to thank Peter Moyle, Don Erman,Bruce McGurk, Neil Berg, Jeff Dozier, Susan Ustin, LarryCostick, Debbie Elliott-Fisk, Rowan Rowntree, Bill Stewart,Jeff Romm, Roger Poff, Mike Diggles, Hap Dunning, MattKondolf, Roland Knapp, Doug Leisz, and Connie Millar fortheir help and insights. Karen Gabriel, Lian Duan, SteveBeckwitt, Paul Randall, and Russ Jones provided much ana-lytical assistance with geographic information. Jen Lucas, ErinFleming, Mike Oliver, Cindy Seaman, and Sue Enos kept theproject going with their behind-the-scenes logistics. MignonMoskowitz, Virginia Rich, and Zipporah Collins greatly im-
proved the readability of the manuscript. Sarah Marvin andMaureen Davis obtained data that I was unable to access.
Beyond the greater SNEP team, hydrologists and other re-source professionals on all the national forests of the SierraNevada were very helpful in providing suggestions, infor-mation, and access to their files. Ken Roby, Jim Frazier, LuciMcKee, Terry Kaplan-Henry, and Bob Gecy were particularlyhelpful in this regard. Many other people involved with wa-ter issues in the Sierra Nevada provided information and as-sistance. The following list includes only a sample of thosewho were most helpful: Jane Baxter, Clay Brandow, Bob Curry,Gayle Dana, Gary Freeman, George Ice, Donna Lindquist,Brett Matzke, Sally Miller, John Munn, Robert Nuzum,Randall Osterhuber, Doug Powell, Terry Russi, Tom Suk,Darrell Wong, and Sue Yee.
R E F E R E N C E S
Adams, P. W. 1993. Maintaining woodland roads. Extension Circular1137. Corvallis: Oregon State University, Extension Service.
Adams, P. W., and H. A. Froehlich. 1981. Compaction of forest soils.Pacific Northwest Extension Publication 217. Corvallis: OregonState University.
Aguado, E. D., D. Cayan, L. Riddle, and M. Roos. 1992. Climaticfluctuations and the timing of west coast streamflow. Journal ofClimate 5:1468–83.
Akers, J. P. 1986. Ground water in the Long Meadow area and its relationwith that in the General Sherman Tree area, Sequoia National Park,California. Water-Resources Investigations Report 85-4178.Sacramento, CA: U.S. Geological Survey.
Albin-Smith, T., and C. A. Raguse. 1984. Environmental effects of landuse and intensive range management: A northern California example.Contribution 187 ISSN 0575-4941. Davis: University of California,Water Resources Center.
Allen, H. L. 1987. Forest fertilizers. Journal of Forestry 85:37–46.American Meteorological Society. 1992. Planned and inadvertent
weather modification—a policy statement. Bulletin of the AmericanMeteorological Society 73 (3): 1–4.
Anderson, H. W. 1963. Managing California’s snow zone lands for water.Research Paper PSW-6. Berkeley, CA: U.S. Forest Service, PacificSouthwest Forest and Range Experiment Station.
———. 1974. Sediment deposition in reservoirs associated with ruralroads, forest fires, and catchment attributes. In Proceedings of thesymposium on man’s effect on erosion and sedimentation, 87–95.Publication 113. Wallingford, England: International Associationof Hydrological Sciences.
———. 1979. Sources of sediment induced reduction in water qualityappraised from catchment attributes and land use. In Third WorldCongress on Water Resources. Urbana, IL: International WaterResource Association.
Anderson, H. W., and C. H. Gleason. 1960. Logging and brush removaleffects on runoff from snow cover, 478–89. Publication 51. Wallingford,England: International Association of Scientific Hydrology.
Anderson, H. W., M. D. Hoover, and K. G. Reinhart. 1976. Forests andwater: Effects of forest management on floods, sedimentation, and watersupply. General Technical Report PSW-18. Berkeley, CA: U.S. ForestService, Pacific Southwest Forest and Range Experiment Station.
909Hydrology and Water Resources
Andrews, E. D., and D. C. Erman. 1986. Persistence in the sizedistribution of surficial bed material during an extreme snowmeltflood. Water Resources Research 22:191–97.
Armstrong, C. F., and C. K. Stidd. 1967. A moisture balance profileon the Sierra Nevada. Journal of Hydrology 5:258–68.
Aubury, L. E. 1910. Gold dredging in California. Bulletin 57. SanFrancisco: California State Mining Bureau.
Averill, C. V. 1946. Placer mining for gold in California. Bulletin 135.San Francisco: California Division of Mines.
Bailey, P. 1927. Summary report of the water resources of Californiaand a coordinated plan for their development. Bulletin 12.Sacramento: California Division of Irrigation and Engineering.
Barta, A. F., P. R. Wilcock, and C. C. C. Shea. 1994. The transport ofgravels in boulder-bed streams. In Hydraulic engineering ’94, editedby G. V. Cotroneo and R. R. Rumer, vol. 2, 780–84. New York:American Society of Civil Engineers.
Bastin, E. W., K. J. Maier, and A. W. Knight. 1992. The recovery of astream benthic community due to the Walker mine remediationproject. In Proceedings of the fourth biennial conference on watershedmanagement, 71. Davis: University of California, Water ResourcesCenter and Watershed Management Council.
Bender, M. D. 1994. Summary of information for estimating water qualityconditions downstream of Lake Tahoe for the TROA DEIS/DEIR.Denver: U.S. Bureau of Reclamation, Earth Sciences Division,Water Quality Section.
Beniston, M., ed. 1994. Mountain environments in changing climates.London: Routledge.
Berg, N. H., and J. A. Bergman. 1984. Roadway salting effects onsnowmelt water quality. In Water: Today and tomorrow, 237–46. NewYork: American Society of Civil Engineers, Irrigation and DrainageDivision.
Berg, N. H., and J. L. Smith. 1980. An overview of societal andenvironmental responses to weather modification. Vol. 5 of The Sierraecology project. Denver: U.S. Bureau of Reclamation, Office ofAtmospheric Water Resources Research.
Berg, N. H., K. B. Roby, and B. J. McGurk. 1996. Cumulative watershedeffects: Applicability of available methodologies to the SierraNevada. In Sierra Nevada Ecosystem Project: Final report to Congress,vol. III. Davis: University of California, Centers for Water andWildland Resources.
Bergman, J. A. 1987. Rain-on-snow and soil mass failure in the SierraNevada of California. In Landslide activity in the Sierra Nevada during1982 and 1983, edited by J. V. De Graff, 15–26. San Francisco: U.S.Forest Service.
Berris, S. N., and R. D. Harr. 1987. Comparative snow accumulationand melt during rainfall in forested and clear-cut plots in thewestern Cascades of Oregon. Water Resources Research 23:135–42.
Beschta, R. L. 1978. Long-term patterns of sediment productionfollowing road construction and logging in the Oregon coast range.Water Resources Research 14:1011–16.
Beschta, R. L., et al. 1995. Wildfire and salvage logging: Recommendationsfor ecologically sound post-fire salvage logging and other post-firetreatment on federal lands in the West. Corvallis: Oregon StateUniversity.
Beven, K. 1981. The effects of ordering on the geomorphic effective-ness of hydrologic events. In Erosion and sediment transport in Pa-cific Rim steeplands, 510–15. Wallingford, England: InternationalAssociation of Hydrological Sciences.
BioSystems Analysis, Inc. 1990. Base-line analysis of riparian vegetation:
Mill Creek, Mono County, California. Rosemead: Southern CaliforniaEdison Company.
Biswell, H. H. 1989. Prescribed burning in California wildlands vegetationmanagement. Berkeley and Los Angeles: University of CaliforniaPress.
Booker, F. A., W. E. Dietrich, and L. M. Collins. 1993. Runoff anderosion after the Oakland firestorm: Expectations and observa-tions. California Geology 46 (6): 159–73.
Booth, D. B. 1990. Stream-channel incision following drainage-basinurbanization. Water Resources Bulletin 26:407–17.
Booth, D. B., and L. E. Reinelt. 1993. Consequences of urbanizationon aquatic systems—measured effects, degradation thresholds,and corrective strategies. In Watershed ’93: A national conference onwatershed management, 545–50. Report EPA 840-R-94-002. Washing-ton, DC: U.S. Environmental Protection Agency.
Borcalli and Associates. 1993. Draft county water resources developmentand management plan. Placerville, CA: El Dorado County WaterAgency.
Borchers, J. W., S. Hickman, and G. J. Nimz. 1993. In-situ stress andground-water flow in fractured granite at Wawona, YosemiteNational Park, California: A model for the west-central SierraNevada. EOS, Transactions American Geophysical Union 74 (43): 581.
Bosch, J. M., and J. D. Hewlett. 1982. A review of catchment experi-ments to determine the effect of vegetation changes on water yieldand evapotranspiration. Journal of Hydrology 55:3–23.
Bowen, E. 1972. The High Sierra. New York: Time-Life Books.Broecker, W. S. 1995. Chaotic climate. Scientific American 267:62–68.Brown, C. B. 1945. Rates of sediment production in the southwestern United
States. Report SCS-TP-S8. Washington, DC: Soil ConservationService.
Brown, C. B., and E. M. Thorp. 1947. Reservoir sedimentation in theSacramento–San Joaquin drainage basins, California. Special Report10. Washington, DC: Soil Conservation Service, SedimentationSection, Office of Research.
Brown, D. L., C. M. Skau, J. Rhodes, and W. Melgin. 1990. Nitratecycling in subalpine watershed near Lake Tahoe. In Proceedings,international mountain watershed symposium: Subalpine processes andwater quality, edited by I. G. Poppoff, C. R. Goldman, S. L. Loeb,and L. B. Leopold, 147–59. South Lake Tahoe, CA: Tahoe ResourceConservation District.
Brown, G. W. 1980. Forestry and water quality. Corvallis, OR: OSU BookStores.
Brown, G. W., A. R. Gahler, and R. B. Marston. 1973. Nutrient lossesafter clear-cut logging and slash burning in the Oregon coast range.Water Resources Research 9:1450–53.
Brown, T. C., and D. Binkley. 1994. Effect of management on water qualityin North American forests. General Technical Report RM-248. FortCollins, CO: U.S. Forest Service, Rocky Mountain Research Station.
Browne, J. R. 1868. Mineral resources of the West. Cited by Coleman1952.
Bull, W. B., and K. M. Scott. 1974. Impact of gravel mining from urbanstreambeds in the southwestern United States. Geology 2:171–78.
Burgess, S. O. 1992. The water king Anthony Chalfant: His life and times.Davis, CA: Panorama West Publications.
Burns, J. W. 1970. Spawning bed sedimentation surveys in northernCalifornia streams. California Fish and Game 56 (4): 253–270.
———. 1972. Some effects of logging and associated road constructionon northern California streams. Transactions of the American FisheriesSociety 101 (1): 1–17.

910VOLUME I I , CHAPTER 30
Buttle, J. M., and F. Xu. 1988. Snowmelt runoff in suburban environ-ments. Nordic Hydrology 19:19–40.
Cahill T. A., J. J. Carroll, D. Campbell, and T. E. Gill, 1996. Air quality.In Sierra Nevada Ecosystem Project: Final report to Congress, vol. II,chap. 48. Davis: University of California, Centers for Water andWildland Resources.
Calaveras Ranger District. 1991. Environmental assessment forsnowmaking system development, Bear Valley Ski Area. Sonora, CA:U.S. Forest Service, Stanislaus National Forest.
California Department of Public Works. 1923. Flow in Californiastreams. Sacramento: California Department of Public Works.
California Department of Water Resources. 1974. Water qualityinvestigation of western Nevada County. Sacramento: CaliforniaDepartment of Water Resources, Central District.
———. 1983a. Status of Sierra foothills water management studies. Sac-ramento: California Department of Water Resources, Central Dis-trict.
———. 1983b. Potential for salvaging water through vegetation manage-ment in the lower Feather River watershed. Sacramento: CaliforniaDepartment of Water Resources.
———. 1989. Surface water quality data evaluation for selected streams inCentral District. Sacramento: California Department of WaterResources.
———. 1990a. Mountain counties water management studies: AmadorCounty. Sacramento: California Department of Water Resources,Central District.
———. 1990b. Natural radioactivity in groundwater of the western SierraNevada. Fresno: California Department of Water Resources, SanJoaquin District.
———. 1994. California water plan update. Bulletin 160-93. Sacramento:California Department of Water Resources.
California Division of Forestry. 1972. Wildland soils, vegetation, andactivities affecting water quality. Report for the State Water ResourcesControl Board. Sacramento: California Division of Forestry.
California Division of Soil Conservation. 1969. Sedimentation anderosion in the upper Truckee River and Trout Creek watersheds, LakeTahoe, California. Sacramento: California Resources Agency,Division of Soil Conservation.
———. 1971a. Problems of the soil mantle and vegetative cover of the stateof California. Sacramento: California Resources Agency, Divisionof Soil Conservation.
———. 1971b. Environmental impact of urbanization of the foothill andmountainous land of California. Sacramento: California ResourcesAgency, Division of Soil Conservation.
California Division of Water Resources. 1955. Survey of mountainousareas. Bulletin 56. Sacramento: California Resources Agency, Divi-sion of Water Resources.
California Energy Commission. 1981. Small scale hydro: Environmentalassessment of small hydroelectric development at existing sites inCalifornia. Sacramento: California Energy Commission.
California Rivers Assessment. 1995. Rivers assessment progress report.Davis: University of California.
California State Lands Commission. 1993. California’s rivers: A publictrust report. Sacramento: California State Lands Commission.
California State Water Resources Control Board. 1984. Water qualityassessment for water years 1982 and 1983. Water Quality MonitoringReport 84-3T5. Sacramento: California State Water ResourcesControl Board.
———. 1992a. Water quality assessment. Sacramento: California StateWater Resources Control Board.
———. 1992b. California report on water quality. Sacramento: CaliforniaState Water Resources Control Board.
Cawley, K. 1991. Cumulative watershed effects in the Last Chance Creekwatershed. Milford, CA: U.S. Forest Service, Plumas National Forest,Milford Ranger District.
Cayan, D. R., and L. G. Riddle. 1993. A multi-basin seasonalstreamflow model for the Sierra Nevada. In Proceedings of the ninthPacific climate workshop, edited by K. T. Redmond and V. L. Tharp,141–52. Sacramento: California Department of Water Resources,Interagency Ecological Studies Program.
Central Valley Regional Water Pollution Control Board. 1957. Waterpollution study, San Joaquin River watershed. Sacramento, CA: CentralValley Regional Water Pollution Control Board.
Central Valley Regional Water Quality Control Board. 1975. CentralValley basin plan. Sacramento, CA: Central Valley Regional WaterQuality Control Board.
———. 1987. Regional mercury assessment. Sacramento, CA: CentralValley Regional Water Quality Control Board.
———. 1991. The water quality control plan (basin plan) for the CentralValley region. Sacramento, CA: Central Valley Regional WaterQuality Control Board.
———. 1995. Water quality monitoring of livestock grazing areas,summer 1994. Internal report. Central Valley Regional WaterQuality Control Board, Sacramento, CA.
Chalfant, W. A. 1922. The story of Inyo. Bishop, CA: Chalfant Press.Chan, F. J., and R. M. Wong. 1989. Reestablishment of native riparian
species at an altered high elevation site. In Proceedings of the Cali-fornia riparian systems conference, edited by D. L. Abell, 428–35.General Technical Report PSW-110. Berkeley, CA: U.S. Forest Ser-vice, Pacific Southwest Forest and Range Experiment Station.
Chang, C. 1996. Ecosystem responses to fire and variations in fireregimes. In Sierra Nevada Ecosystem Project: Final report to Congress,vol. II, chap. 39. Davis: University of California, Centers for Waterand Wildland Resources.
Chang, C. C. Y., J. S. Kuwabara, and S. P. Pasilis. 1990. Trace metalconcentrations of three tributaries to Lake Tahoe, California andNevada. In Proceedings, international mountain watershed symposium:Subalpine processes and water quality, edited by I. G. Poppoff, C. R.Goldman, S. L. Loeb, and L. B. Leopold, 103–15. South Lake Tahoe,CA: Tahoe Resource Conservation District.
Chang, H. H., L. L. Harrison, W. Lee, and S. Tu. 1994. Numericalmodeling for sediment-pass-through operations of reservoirs. InHydraulic engineering ’94, edited by G. V. Cotroneo and R. R. Rumer,1014–19. New York: American Society of Civil Engineers.
Cheng, J. D. 1980. Hydrologic effects of a severe forest fire. InSymposium on watershed management, 1980, 240–51. New York:American Society of Civil Engineers.
Chisholm, G. 1994. Building consensus for environmental restora-tion: The case of the Truckee-Carson Settlement Act. In Effects ofhuman induced changes on hydrologic systems, edited by R. Marstonand V. R. Hasfurther, 299–304. Bethesda, MD: American WaterResources Association.
Clark, W. B. 1970. Gold districts of California. Bulletin 193. San Francisco:California Division of Mines and Geology.
Clark, W. B., and P. A. Lydon. 1962. Mines and mineral resources ofCalaveras County, California. County Report 2. San Francisco:California Division of Mines and Geology.
Clifton, C. 1992. Stream classification and channel condition survey, withan inventory of sediment sources from roads and stream crossings

911Hydrology and Water Resources
conducted in the Last Chance and Spanish Creek watersheds. Quincy,CA: U.S. Forest Service, Plumas National Forest.
———. 1994. East Branch North Fork Feather River erosion control strat-egy. Quincy, CA: East Branch North Fork Feather River Coordi-nated Resource Management Group.
Coats, R., and C. Goldman. 1993. Nitrate transport in subalpinestreams, Lake Tahoe Basin, California-Nevada, U.S.A. AppliedGeochemistry, Supplemental Issue 2, 17–21.
Coats, R. N., R. L. Leonard, and C. R. Goldman. 1976. Nitrogen uptakeand release in a forested watershed, Lake Tahoe Basin, California.Ecology 57:995–1004.
Coleman, C. M. 1952. Pacific Gas and Electric of California: The centennialstory of Pacific Gas and Electric Company 1852–1952. New York:McGraw-Hill.
Collins, B., and T. Dunne. 1990. Fluvial geomorphology and river-gravelmining: A guide for planners. Special Publication 98. Sacramento:California Division of Mines and Geology.
Colman, E. A. 1955. Operation wet blanket: Proposed research insnowpack management in California. Paper presented at the meet-ing of the American Geophysical Union, San Francisco, 5 Febru-ary.
Committee on Rangeland Classification. 1994. Rangeland health: Newmethods to classify, inventory, and monitor rangelands. Washington,DC: National Research Council, National Academy of Sciences.
Conservation Commission. 1913. Report of the Conservation Commissionof the State of California. Sacramento: California ConservationCommission.
Copeland, O. L. 1965. Land use and ecological factors in relation tosediment yields. In Proceedings, federal interagency sedimentationconference, 1963, 72–84. Washington, DC: U.S. Department ofAgriculture.
Davis, G. A. 1977. Management alternatives for the riparian habitatin the Southwest. In Importance, preservation, and management of theriparian habitat: A symposium, edited by R. R. Johnson and D. A.Jones, 59–67. General Technical Report RM-43. Fort Collins, CO:U.S. Forest Service, Rocky Mountain Forest and Range ExperimentStation.
Davis, M. L. 1993. Rivers in the desert: William Mulholland and theinventing of Los Angeles. New York: Harper-Collins.
Davis, S. P. 1969. Pollution of Leviathan and Bryant Creeks, and East ForkCarson River, caused by Leviathan mine, Alpine County. Sacramento:California Department of Fish and Game.
De Bano, L. F. 1981. Water repellent soils: A state-of-the-art. GeneralTechnical Report PSW-46. Berkeley, CA: U.S. Forest Service, PacificSouthwest Forest and Range Experiment Station.
De Decker, M. 1966. Mines of the eastern Sierra. Glendale, CA: La SiestaPress.
De Graff, J. V. 1982. Final evaluation of felled trees as a sediment retainingmeasure, Rock Creek Burn, Kings River RD. Fresno, CA: U.S. ForestService, Sierra National Forest.
———. 1985. Using isopleth maps of landslide deposits as a tool intimber sale planning. Bulletin of Association of Engineering Geologists22:445–53.
———. 1987. An overview of landslide hazard on national forests inthe Sierra Nevada. In Landslide activity in the Sierra Nevada during1982 and 1983, edited by J. V. De Graff, 1–14. San Francisco: U.S.Forest Service.
De Graff, J. V., J. McKean, P. E. Watanabe, and W. F. McCaffrey. 1984.Landslide activity and groundwater conditions: Insights from a
road in the central Sierra Nevada, California. TransportationResearch Record 965:32–37.
Dendy, F. E., and W. A. Champion. 1978. Sediment deposition in U.S.reservoirs, summary of data reported through 1975. Miscellaneouspublication 1362. Oxford, MS: U.S. Department of Agriculture,Agriculture Research Service.
Dendy, F. E., W. A. Champion, and R. B. Wilson. 1973. Reservoirsedimentation surveys in the United States. In Man-made lakes: Theirproblems and environmental effects, edited by W. C. Ackermann,G. F. White, E. B. Worthington, and J. L. Ivens, 349–57. Washington,DC: American Geophysical Union.
Desmarais, S. 1977. Locational research inventory of historic and inactivemines. Placerville, CA: Sierra Planning/Sierra Economic Devel-opment District.
Diggles, M. F. , J. R. Rytuba, B. C. Moring, C. T. Wrucke, D. P. Cox,S. Ludington, R. P. Ashley, W. J. Pickthorn, C. T. Hillman, andR. J. Miller. 1996. Geology and minerals issues. In Sierra NevadaEcosystem Project: Final report to Congress, vol. II, chap. 18. Davis:University of California, Centers for Water and Wildland Re-sources.
Dilsaver, L. M., and W. C. Tweed. 1990. Challenge of the big trees. ThreeRivers, CA: Sequoia Natural History Association.
Dissmeyer, G. E. 1993. The economics of silvicultural best manage-ment practices. In Watersheds ’93: A national conference on water-shed management, 319–23. Report EPA 840-R-94-002. Washington,DC: U.S. Environmental Protection Agency.
Doppelt, B., M. Scurlock, C. Frissell, and J. Karr. 1993. Entering thewatershed: A new approach to save America’s river ecosystems.Washington, DC: Pacific Rivers Council/Island Press.
Duane, T. P. 1996a. Human settlement, 1850–2040. In Sierra NevadaEcosystem Project: Final report to Congress, vol. II, chap. 11. Davis:University of California, Centers for Water and Wildland Re-sources.
———. 1996b. Recreation in the Sierra. In Sierra Nevada EcosystemProject: Final report to Congress, vol. II, chap. 19. Davis: Universityof California, Centers for Water and Wildland Resources.
Dunne, T., and L. B. Leopold. 1978. Water in environmental planning.San Francisco: W. H. Freeman.
Dupras, D., and J. Chevreaux. 1984. Lake Combie specialty sandsand gravels. California Geology 37:255–57.
EA Engineering, Science, and Technology. 1990. Preliminary feasibilityanalysis of alternative sediment management option for Ralston AfterbayReservoir. Report for Placer County Water Agency. Lafayette, CA:EA Engineering, Science, and Technology.
Eaglin, G. S., and W. A. Hubert. 1993. Effects of logging and roads onsubstrate and trout in streams of the Medicine Bow National Forest,Wyoming. North American Journal of Fisheries Management 13:844–46.
East Bay Municipal Utility District (EBMUD). 1995. Letter from R. C.Nuzum to Mokelumne River Joint Ownership Protocol Group,October 10. East Bay Municipal Utility District, Oakland, Cali-fornia.
Eisel, L. M., K. D. Mills, and C. F. Leaf. 1988. Estimated consumptiveloss from man-made snow. Water Resources Bulletin 24:815–20.
Eldorado National Forest. 1980. Status report on the stream flowmaintenance dams. Placerville, CA: U.S. Forest Service, EldoradoNational Forest.
Elliott, R. D., D. A. Griffith, J. F. Hannaford, and J. A. Flueck. 1978.Special report on background and supporting material for the Sierra
912VOLUME I I , CHAPTER 30
cooperative pilot project. Report 78-22, vol. 2. Salt Lake City: NorthAmerican Weather Consultants.
Ellis, W. T. 1939. Memories: My seventy-two years in the romantic countyof Yuba. Eugene: University of Oregon.
Ellison, W. D. 1945. Some effects of raindrops and surface flow onsoil erosion and infiltration. Transactions American GeophysicalUnion 26:415–30.
Erman, D. C., E. D. Andrews, and M. Yodler-Williams. 1988. Effectsof winter floods on fishes in the Sierra Nevada. Canadian Journal ofFisheries and Aquatic Sciences 45:2195–200.
Erman, D. C., and V. M. Hawthorne. 1976. The quantitative impor-tance of an intermittent stream in the spawning of rainbow trout.Transactions of the American Fisheries Society 105:675–81.
Erman, D. C., and D. Mahoney. 1983. Recovery after logging in streamswith and without bufferstrips in northern California. Contribution 186.Berkeley: University of California, Water Resources Center.
Erman, D. C., J. D. Newbold, and K. B. Roby. 1977. Evaluation ofstreamside bufferstrips for protecting aquatic organisms. Contribution165. Davis: University of California, Water Resources Center.
Erman, N. A. 1996. Status of aquatic invertebrates. In Sierra NevadaEcosystem Project: Final report to Congress, vol. II, chap. 35. Davis:University of California, Centers for Water and Wildland Re-sources.
Euphrat, F. D. 1992. Cumulative impact assessment and mitigationfor the Middle Fork of the Mokelumne River, Calaveras County,California. Ph.D. diss., University of California, Berkeley.
Everett, R. L., R. O. Meeuwig, and R. I. Buttefield. 1980. Revegeta-tion of untreated acid spoils, Leviathan mine, Alpine County, Cali-fornia. California Geology 32 (1): 8–10.
Farquhar, F. 1965. History of the Sierra Nevada. Berkeley and LosAngeles: University of California Press.
Federal Energy Regulatory Commission. 1990. Environmental assess-ment of potential cumulative impacts associated with hydropowerdevelopment in the Mono Lake Basin, California. Washington, DC: Fed-eral Energy Regulatory Commission, Public Reference Branch.
Fleischner, T. L. 1994. Ecological costs of livestock grazing in westernNorth America. Conservation Biology 8:629–44.
Fong, D. R. 1991. Long-term logging-related influences on streamhabitat and macroinvertebrate communities in northern Califor-nia. Master’s thesis, Department of Forestry and Resource Man-agement, University of California, Berkeley.
Fowler, F. H. 1923. Hydroelectric systems of California and their extensionsinto Oregon and Nevada. Water Supply Paper 493. Washington, DC:U.S. Geological Survey.
Franklin, J. F., W. H. Moir, G. W. Douglas, and C. Wiberg. 1971.Invasion of subalpine meadows by trees in the Cascade Range,Washington and Oregon. Arctic and Alpine Research 3 (3): 215–24.
Frazier, J. W. 1984. The Granite Burn: The fires and the years following, awatershed history, 1974–1984. Sonora, CA: U.S. Forest Service,Stanislaus National Forest.
Frazier, J., and J. Carlson. 1991. Surface and ground water qualitymonitoring protocol for herbicide application. Appendix G, Grovelandconifer release environmental assessment. Sonora, CA: U.S. ForestService, Stanislaus National Forest.
Fredriksen, R. L. 1971. Comparative chemical water quality—naturaland disturbed streams following logging and slash burning. InProceedings of a symposium on forest land uses and stream environment,125–37. Corvallis: Oregon State University.
Freeman, J. R. 1912. On the proposed use of a portion of the Hetch Hetchy,Eleanor and Cherry Valleys. San Francisco: Board of Supervisors.
Furniss, M. J., T. D. Roelofs, and C. S. Yee. 1991. Road constructionand maintenance. In Influences of forest and rangeland managementon salmonid fishes and their habitats, edited by W. R. Meehan, 297–323. Bethesda, MD: American Fisheries Society.
Galay, V. 1983. Causes of river bed degradation. Water ResourcesResearch 19:1057–90.
Gard, M. F. 1994. Biotic and abiotic factors affecting native fishes inthe South Yuba River, Nevada County, California. Ph.D. diss.,University of California, Davis.
Garland, J. J. 1993. Designing woodland roads. Extension Circular 1137.Corvallis: Oregon State University, Extension Service.
Georgetown Ranger District. 1992. Placer County Water Agencysediment storage site environmental assessment. Placerville, CA: U.S.Forest Service, Eldorado National Forest.
Gerstung, E. 1970. A brief survey of the impact of subdivision activity onthe fish and wildlife resources of Nevada County. Sacramento:California Department of Fish and Game.
Gilbert, G. K. 1917. Hydraulic-mining debris in the Sierra Nevada.Professional Paper 105. Washington, DC: U.S. Geological Survey.
Glancy, P. A. 1969. A mudflow in the Second Creek drainage, Lake TahoeBasin, Nevada, and its relation to sedimentation and urbanization.Professional Paper 650-C. Carson City, NV: U.S. Geological Survey.
Gleick, P. H., P. Loh, S. V. Gomez, and J. Morrison. 1995. Californiawater 2020: A sustainable vision. Oakland, CA: Pacific Institute.
Goldman, C. R. 1974. Eutrophication of Lake Tahoe emphasizing waterquality. Report EPA–660/3-74-034. Washington, DC: U.S. Govern-ment Printing Office.
———. 1990. Long-term limnological research at Lake Tahoe. InProceedings, international mountain watershed symposium: Subalpineprocesses and water quality, edited by I. G. Poppoff, C. R. Goldman,S. L. Loeb, and L. B. Leopold, 464–77. South Lake Tahoe, CA: TahoeResource Conservation District.
Goldman, C. R., R. Gersberg, and S. Loeb. 1984. Water quality conditionsof Kirkwood Basin. Davis, CA: Ecological Research Associates.
Goldman, C. R., and G. J. Malyj. 1990. The environmental impact ofhighway deicing. Davis: University of California, Institute ofEcology.
Goldman, H. B. 1968. Sand and gravel in California. Bulletin 180.Sacramento: California Division of Mines and Geology.
Granger, O. 1979. Increasing variability in California precipitation.Annals of the Association of American Geographers 69:533–43.
Graumlich, L. 1993. A 1000-year record of temperature and precipi-tation in the Sierra Nevada. Quaternary Research 39:249–55.
Groeneveld, D. P., and D. Or. 1994. Water table induced shrub-herbaceous ecotone: Hydrologic management implications. WaterResources Bulletin 30:911–20.
Hagan, R. M., and E. B. Roberts. 1973. Ecological impacts of waterstorage and diversion projects. In Environmental quality and waterdevelopment, edited by C. R. Goldman, J. McEvoy, and P. J.Richerson, 196–215. San Francisco: W. H. Freeman.
Hagberg, T. 1993. Sierra National Forest preliminary V* findings. Fresno,CA: U.S. Forest Service, Sierra National Forest, Kings River RangerDistrict.
———. 1995. Relationships between hydrology, vegetation, and gul-lies in montane meadows of the Sierra Nevada. Master’s thesis,Humboldt State University, Arcata, CA.
Hall, W. H. 1881. The irrigation question in California, report of the StateEngineer. Sacramento, CA: Office of the State Engineer.
Hammermeister, O. P., and S. J. Walmsley. 1985. Hydrologic data for

913Hydrology and Water Resources
Leviathan mine and vicinity, Alpine County, California, 1981–83. OpenFile Report 85-160. Carson City, NV: U.S. Geological Survey.
Harding, S. T. 1935. Evaporation from large water-surfaces based onrecords in California and Nevada. Transactions American GeophysicalUnion 16:507–11.
———. 1960. Water in California. Palo Alto: N-P Publications.Harland Bartholomew and Associates, Engineering-Science, and
James R. Jones and Associates. 1992. Public and private water systemsand groundwater for the Nevada County General Plan. Nevada City,CA: Nevada County.
Harp, E. L., K. Tanako, J. Sarmiento, and D. K. Keefer. 1984. Landslidesfrom the May 25–27, 1980, Mammoth Lakes, California, earthquakesequence. Miscellaneous Investigations Map I-1612. Menlo Park,CA: U.S. Geological Survey.
Harr, R. D. 1981. Some characteristics and consequences of snowmeltduring rainfall in western Oregon. Journal of Hydrology 53:277–304.
Harr, R. D., and R. A. Nichols. 1993. Stabilizing forest roads to helprestore fish habitats: A northwest Washington example. Fisheries18 (4): 18–22.
Harrison, L. L. 1992. Rock Creek–Cresta sediment management project.San Francisco: Pacific Gas and Electric Company.
Harvey, B. C. 1986. Effects of suction dredging on fish and inverte-brates in two California streams. American Journal of Fisheries Man-agement 6:401–9.
Harvey, B. C., T. E. Lisle, T. Vallier, and D. C. Fredley. 1995. Effects ofsuction dredging on streams: A review and evaluation strategy.Washington, DC: U.S. Forest Service.
Hawkins, C. P., et al. 1994. Cumulative watershed effects: An extensiveanalysis of responses by stream biota to watershed management. Finalreport on cooperative agreement PSW-88-0011CA. Albany, CA:U.S. Forest Service, Pacific Southwest Research Station.
Hawkins, R. H., and J. H. Judd. 1972. Water pollution as affected bystreet salting. Water Resources Bulletin 17:1246–52.
Helley, E. J. 1966. Sediment transport in the Chowchilla River Basin:Mariposa, Madera, and Merced Counties, California. Ph.D. diss.,University of California, Berkeley.
Helms, J. A., and J. C. Tappeiner. 1996. Silviculture in the Sierra. InSierra Nevada Ecosystem Project: Final report to Congress, vol. II, chap.15. Davis: University of California, Centers for Water and WildlandResources.
Helvey, J. D. 1980. Effects of a north central Washington wildfireon runoff and sediment production. Water Resources Bulletin 16:627–34.
Henderson, T. J. 1995. Benefits from historic cloud seeding programsin California. Proceedings of the western snow conference 63:88–97.
Herbst, D., and R. Knapp. 1995a. Biomonitoring of rangeland streamsunder differing livestock grazing practices. Bulletin of the NorthAmerican Benthological Society 12 (1): 176.
———. 1995b. Evaluation of rangeland stream condition and recoveryusing physical and biological assessments of nonpoint source pollution.Technical Completion Report UCAL-WRC-W-818. Davis: Univer-sity of California, Water Resources Center.
Hermann, C., and F. R. McGregor, eds. 1973. Water quality andrecreation in the Mammoth Lakes Sierra. Los Angeles: University ofCalifornia, Department of Environmental Science and Engineering.
Herschy, R. W. 1985. Streamflow measurement. London: Elsevier.Hewlett, J. D. 1982. Principles of forest hydrology. Athens: University
of Georgia Press.Heyl, G. R., M. W. Cox, and J. H. Eric. 1948. Penn zinc-copper mine,
Calaveras County, California. California Division of Mines Bulletin144:61–84.
Hill, B. R., and K. M. Nolan. 1990. Suspended-sediment factors: LakeTahoe Basin, California-Nevada. In Proceedings, internationalmountain watershed symposium: Subalpine processes and water quality,edited by I. G. Poppoff, C. R. Goldman, S. L. Loeb, and L. B.Leopold, 179–89. South Lake Tahoe, CA: Tahoe ResourceConservation District.
Hinkle, G., and B. Hinkle. 1949. Sierra Nevada lakes. Indianapolis:Bobbs-Merrill.
Hoffman, A. 1981. Vision or villainy: Origins of the Owens Valley–LosAngeles water controversy. College Station: Texas A and M UniversityPress.
Holeman, J. E. 1968. The sediment yield of major rivers of the world.Water Resources Research 4:737–47.
Hollett, K. J., W. R. Danskin, W. F. McCaffrey, and C. L. Walti. 1991.Geology and water resources of Owens Valley, California. Water SupplyPaper 2370-B. Washington, DC: U.S. Geological Survey.
Hornbeck, J., and G. Stuart. 1976. When ski trails are cut throughforest land, what happens to streamflow? Ski Area Management,fall, 34–36.
Howell, R. B., D. I. Nakao, and J. L. Gidley. 1979. Analysis of short andlong-term effects on water quality for selected highway projects. ReportFHWA/CA/TL-79/17. Sacramento: California Department ofTransportation.
Hughes, J. E. 1934. Erosion control progress report. Quincy, CA: U.S.Forest Service, Plumas National Forest, Milford Ranger District.
Hundley, N., Jr. 1992. The great thirst: Californians and water, 1770s–1990s. Berkeley and Los Angeles: University of California Press.
Huntley, D. 1992. Update of estimates of snowmaking water use/loss, LakeTahoe and Truckee River Basins. Davis, CA: West Yost and Associates.
Inyo National Forest. 1987. Land and resource management plan. Bishop,CA: U.S. Forest Service, Inyo National Forest.
———. 1993. Interagency motor vehicle use plan revision—draft environ-mental impact statement. Bishop, CA: U.S. Forest Service and Bu-reau of Land Management.
Jackson, W. T., and D. J. Pisani. 1973. A core study in interstate resourcemanagement: The California-Nevada water controversy. Contribution142. Berkeley: University of California, Water Resources Center.
James, L. A. 1988. Historical transport and storage of hydraulic miningsediment in the Bear River, California. Ph.D. diss., University ofWisconsin, Madison.
———. 1994. Channel changes wrought by gold mining: NorthernSierra Nevada, California. In Effects of human-induced changes onhydrologic systems, edited by R. Marston and V. R. Hasfurther, 629–38. Bethesda, MD: American Water Resources Association.
Janda, R. J. 1966. Pleistocene history and hydrology of the upper SanJoaquin River. Ph.D. diss., University of California, Berkeley.
Jansen, R. N. 1956. Sedimentation problems related to the design ofthe Feather River Project. In Proceedings, conference on sedimentproblems in California, edited by H. A. Einstein and J. W. Johnson,44–46. Berkeley: University of California, Water Resources Center,Committee on Research on Water Resources.
Jenkins, O. P. 1948. Geologic guidebook along Highway 49—Sierran goldbelt, the Mother Lode country. Bulletin 141. San Francisco: CaliforniaDivision of Mines.
Jennings, M. R. 1996. Status of amphibians. In Sierra Nevada EcosystemProject: Final report to Congress, vol. II, chap. 31. Davis: Universityof California, Centers for Water and Wildland Resources.

914VOLUME I I , CHAPTER 30
Jobson, H. E. 1985. Field measurements. In Methods of computingsedimentation in lakes and reservoirs, edited by S. Bruk, 41–64. Paris:UNESCO.
Johnson, C. M., and P. R. Needham. 1966. Ionic composition ofSagehen Creek, California, following an adjacent fire. Ecology47:636–39.
Johnson, P. C. 1971. Sierra album. Garden City: Doubleday.Johnston, D. 1994. Wildlife and suction dredging. Outdoor California,
July-August, 11–13.Johnston, V. R. 1970. Sierra Nevada. Boston: Houghton Mifflin.Jones, H. R. 1965. John Muir and the Sierra Club: The battle for Yosemite.
San Francisco: Sierra Club.Jones, J. 1991. Truckee River atlas. Sacramento: California Department
of Water Resources.Kahrl, W., ed. 1978. California water atlas. Sacramento: California
Governor’s Office of Planning and Research.———. 1982. Water and power. Berkeley and Los Angeles: University
of California Press.———. 1993. Acquisitions and aqueducts: How California’s water
system evolved. Pacific Discovery 46 (1): 21–6.Kattelmann, R. 1982. Water yield improvement in the Sierra Nevada
snow zone: 1912–1982. Proceedings, western snow conference 50:39–48.
———. 1985. Snow management at ski areas: Hydrological effects.In Watershed management in the eighties, 264–72. New York:American Society of Civil Engineers.
———. 1987. Feasibility of more water from Sierra Nevada forests. Report16. Berkeley: University of California, Wildland Resources Center.
———. 1989a. Hydrology of four headwater basins in the SierraNevada. In Proceedings of the headwaters hydrology symposium, 141–47. Bethesda, MD: American Water Resources Association.
———. 1989b. Groundwater contributions in an alpine basin in theSierra Nevada. In Proceedings of the headwater hydrology symposium,361–69. Bethesda, MD: American Water Resources Association.
———. 1990. Floods in the high Sierra Nevada, California, USA. InArtificial reservoirs: Water and slopes, edited by R. O. Sinniger andM. Monbaron, 311–18. Vol. 2 of Hydrology in mountainous regions.Publication 194. Wallingford, England: International Associationof Hydrological Sciences.
———. 1992. Historical floods in the eastern Sierra Nevada. In Thehistory of water in the eastern Sierra Nevada, Owens Valley and WhiteMountains, edited by C. A. Hall, V. Doyle-Jones, and B. Widawski,74–86. Berkeley and Los Angeles: University of California Press.
Kattelmann, R., and N. Berg. 1987. Water yields from high elevationbasins in California. In Proceedings, California watershed managementconference, edited by R. Z. Callaham and J. J. DeVries, 79–85. Report11. Berkeley: University of California, Water Resources Center.
Kattelmann, R., N. Berg, and B. McGurk. 1991. A history of rain-on-snow floods in the Sierra Nevada. Proceedings, western snowconference 59:138–41.
Kattelmann, R., N. Berg, and J. Rector. 1983. The potential forincreasing streamflow from Sierra Nevada watersheds. WaterResources Bulletin 19:395–402.
Kattelmann, R., and D. Dawson. 1994. Water diversions and with-drawal for municipal supply in the eastern Sierra Nevada. In Ef-fects of human-induced changes on hydrologic systems, edited by R. A.Marston and V. R. Hasfurther, 475–83. Bethesda, MD: AmericanWater Resources Association.
Kattelmann, R., and J. Dozier. 1991. Environmental hydrology of the
Sierra Nevada, California, USA. Hydrological Science and Technology7 (1–4): 73–80.
Kattelmann, R., and K. Elder. 1991. Hydrologic characteristics andwater balance of an alpine basin in the Sierra Nevada. WaterResources Research 27:1553–62.
Keller, G., and A. King. 1986. 1986 storm impacts on the Feather Rivercountry. Association of Engineering Geologists Newsletter 29:21–22.
Kelley, R. 1959. Gold vs. grain: The hydraulic mining controversy inCalifornia’s Central Valley—a chapter in the decline of laissez-faire.Glendale, CA: Arthur H. Clark.
———. 1989. Battling the inland sea: American political culture, publicpolicy, and the Sacramento Valley, 1850–1986. Berkeley and LosAngeles: University of California Press.
King, J. G. 1993. Sediment production and transport in forestedwatersheds in the northern Rocky Mountains. In Proceedings of thetechnical workshop on sediments, 13–18. Washington, DC: TerreneInstitute.
Kinney, W. C. 1996. Conditions of rangelands before 1905. In SierraNevada Ecosystem Project: Final report to Congress, vol. II, chap. 3.Davis: University of California, Centers for Water and WildlandResources.
Kondolf, G. M. 1989. Stream-groundwater interactions along streamsof the eastern Sierra Nevada, California: Implications for assessingpotential impacts of flow diversions. In Proceedings of the Californiariparian systems conference: Protection, management, and restorationfor the 1990s, edited by D. L. Abell, 352–59. Berkeley, CA: U.S. ForestService.
———. 1993. Lag in stream channel adjustment to livestock exclosure,White Mountains, California. Restoration Ecology 4:226–30.
Kondolf, G. M., G. F. Cada, and M. J. Sale. 1987. Assessing flushing-flow requirement for brown trout spawning gravels in steepstreams. Water Resources Bulletin 23:927–35.
Kondolf, G. M., G. F. Cada, M. J. Sale, and T. Felando. 1991.Distribution and stability of potential salmonid spawning gravelsin steep boulder-bed streams of the eastern Sierra Nevada.Transactions of the American Fisheries Society 120:177–86.
Kondolf, G. M., R. Kattelmann, M. Embury, and D. C. Erman. Statusof riparian habitat. In Sierra Nevada Ecosystem Project: Final reportto Congress, vol. II, chap. 36. Davis: University of California, Centersfor Water and Wildland Resources.
Kondolf, G. M., and W. V. G. Matthews. 1993. Management of coarsesediment on regulated rivers. Report 80. Davis: University ofCalifornia, Water Resources Center.
Kondolf, G. M., and P. Vorster. 1992. Management implications ofstream/groundwater interactions in the eastern Sierra Nevada,California. In The history of water in the eastern Sierra Nevada, OwensValley and White Mountains, edited by C. A. Hall, V. Doyle-Jones,and B. Widawski, 324–38. Berkeley and Los Angeles: Universityof California Press.
Kraebel, C. J., and A. F. Pillsbury. 1934. Handbook of erosion control inmountain meadows in the California region. Berkeley: U.S. ForestService California Forest and Range Experiment Station.
Krammes, J. S., and L. W. Hill. 1963. “First aid” for burned watersheds.Research Note PSW-29. Berkeley, CA: U.S. Forest Service, PacificSouthwest Forest and Range Experiment Station.
Kratz, K. W., S. D. Cooper, and J. M. Melack. 1994. Effects of singleand repeated experimental acid pulses on invertebrates in a highaltitude Sierra Nevada stream. Freshwater Biology 32:161–83.
Kuehn, M. H. 1987. The effects of exceeding “probable maximumprecipitation” on a severely burned watershed in the Sierra Nevada

915Hydrology and Water Resources
of California. In Landslide activity in the Sierra Nevada during 1982and 1983, edited by J. V. De Graff, 27–40. San Francisco: U.S. ForestService.
Kunkle, S. H. 1970. Sources and transport of bacterial indicators inrural streams. In Proceedings of the symposium on interdisciplinaryaspects of watershed management, 105–32. New York: AmericanSociety of Civil Engineers.
Lahontan Regional Water Quality Control Board. 1993. Draft waterquality control plan for the Lahontan Region. South Lake Tahoe, CA:California Regional Water Quality Control Board, LahontanRegion.
Lake Tahoe Basin Management Unit. 1993. Environmental assessmentfor the Meiss grazing allotment. South Lake Tahoe, CA: U.S. ForestService, Lake Tahoe Basin Management Unit.
Landers, D. H., et al. 1987. Western lake survey phase 1, characteristicsof lakes in the western United States. EPA/600/3-86-054a. Washing-ton, DC: Environmental Protection Agency.
Lardner, W. B., and M. J. Brock. 1924. History of Placer and NevadaCounties, California, with biographical sketches. Los Angeles:Historical Records Co. Cited by James (1994).
Larse, R. W. 1971. Prevention and control of erosion and streamsedimentation from forest roads. In Proceedings of a symposium onforest land uses and stream environment, 76–83. Corvallis: OregonState University.
Lawton, H. W., Wilke, P. J., and W. M. Mason. 1976. Agriculture amongthe Paiute of Owens Valley. Journal of California Anthropology 3:13–50.
Lee, W. S. 1962. The Sierra. New York: G. P. Putnam’s Sons.Leiberg, J. B. 1902. Forest conditions in the northern Sierra Nevada,
California. Professional Paper 8, Series H, Forestry 5. Washington,DC: U.S. Geological Survey.
Leopold, A. 1924. Grass, brush, timber, and fire in southern Arizona.Journal of Forestry 22:1–10.
Leopold, L. B. 1968. Hydrology for urban land planning: A guide book.Circular 554. Washington, DC: U.S. Geological Survey.
———. 1994. A view of the river. Cambridge: Harvard University Press.Leopold, L. B., and D. L. Rosgen. 1990. Natural morphology—key to
stream channel stability. In Proceedings, international mountainwatershed symposium: Subalpine processes and water quality, editedby I. G. Poppoff, C. R. Goldman, S. L. Loeb, and L. B. Leopold, 42–49. South Lake Tahoe, CA: Tahoe Resource Conservation District.
Likens, G. E., F. H. Bormann, N. M. Johnson, D. W. Fisher, and R. S.Pierce. 1970. Effects of forest cutting and herbicide treatment onnutrient budgets in the Hubbard Brook watershed-ecosystem.Ecological Monographs 40 (1): 23–47.
Lindgren, W. 1911. Tertiary gravels of the Sierra Nevada, California.Professional Paper 73. Washington, DC: U.S. Geological Survey.
Lindstrom, S. G. 1994. Great basin fisherfolk: Optimal diet breadthmodeling to Truckee River aboriginal subsistence fishery. Ph.D.diss., Department of Anthropology, University of California, Davis.
Lisle, T. E. 1989. Sediment transport and resulting deposition inspawning gravels, north coastal California. Water ResourcesResearch 25:1303–19.
Lisle, T. E, and S. Hilton. 1992. The volume of fine sediment in pools:An index of sediment supply in gravel-bed streams. WaterResources Bulletin 28:371–83.
Littleworth, A. L., and E. L. Garner. 1995. California water. Point Arena,CA: Solano Press Books.
Loeb, S. L., and C. R. Goldman. 1979. Water and nutrient transport
via groundwater from Ward Valley into Lake Tahoe. Limnologyand Oceanography 24:1146–54.
Logan, C. A. 1948. History of mining and milling methods inCalifornia. In Geologic guidebook along Highway 49—Sierran gold belt,the Mother Lode country, edited by O. P. Jenkins, 31–34. SanFrancisco: California Division of Mines.
Longacre, L. L., and H. F. Blaney. 1962. Evaporation at high elevationsin California. Journal of the Irrigation and Drainage Division of theAmerican Society of Civil Engineers 88:33–54.
Lowdermilk, W. C., and P. B. Rowe. 1934. Still further studies onabsorption of rainfall in its relation to surficial runoff and erosion.Transactions American Geophysical Union, part II:509–15.
Lull, H. W., and W. E. Sopper. 1969. Hydrologic effects from urbanizationof forested watersheds. Research Paper NE-146. Radnor, PA: U.S.Forest Service, Northeastern Forest and Range Experiment Station.
MacDonald, L. H., A. W. Smart, and R. L. Wissmar. 1991. Monitoringguidelines to evaluate effects of forestry activities on streams in the PacificNorthwest and Alaska. EPA/910/9-91-001. Washington, DC:Environmental Protection Agency.
Madej, M. A., W. E. Weaver, and D. K. Hagans. 1994. Analysis of bankerosion on the Merced River, Yosemite Valley, Yosemite NationalPark, California, USA. Environmental Management 18:235–50.
Mahmood, K. 1987. Reservoir sedimentation: Impact, extent andmitigation. Technical Paper 71. Washington, DC: World Bank.
Mahoney, D. L., and D. C. Erman. 1984. An index of stored finesediment in gravel bedded streams. Water Resources Bulletin 20:343–48.
Marchetti, M. P. 1994. Suspended sediment effects on the stream faunaof Humbug Creek. Master’s thesis, University of California, Davis.
Marvin, S. 1996. Possible changes in water yield and peak flows inresponse to forest management. In Sierra Nevada Ecosystem Project:Final report to Congress, vol. III. Davis: University of California,Centers for Water and Wildland Resources.
Marvin, S. J. 1995. Water yield in forest planning: A case study of theSequoia National Forest. Master’s thesis, Department of LandscapeArchitecture, University of California, Berkeley.
May, P. R. 1970. Origins of hydraulic mining in California. Oakland, CA:Holmes Book Company.
McCammon, B. P. 1977. Salmon Creek administrative study. Porterville,CA: U.S. Forest Service, Sequoia National Forest.
McCashion, J. D., and R. M. Rice. 1983. Erosion on logging roads innorthwestern California: How much is avoidable? Journal ofForestry 81 (1): 23–26.
McCauley, M. L. 1986. The effect of February 1986 storms on highwaysin central and northern California. Association of EngineeringGeologists Newsletter 29 (4): 24–25.
McCleneghan, K., and R. E. Johnson. 1983. Suction dredge gold miningin the Mother Lode region of California. Administrative Report 83-1.Sacramento: California Department of Fish and Game, Environ-mental Services Branch.
McGurk, B. J., N. H. Berg, and M. L. Davis. 1996. Camp and ClearCreeks, El Dorado County: Predicted sediment production fromforest management and residential development. In Sierra NevadaEcosystem Project: Final report to Congress, vol. II, chap. 53. Davis:University of California, Centers for Water and Wildland Re-sources.
McGurk, B. J., and M. L. Davis. 1996. Camp and Clear Creeks, ElDorado County: Chronology and hydrologic effects of land-usechange. In Sierra Nevada Ecosystem Project: Final report to Congress,

916VOLUME I I , CHAPTER 30
vol. II, chap. 52. Davis: University of California, Centers for Waterand Wildland Resources.
McGurk, B. J., and D. R. Fong. 1995. Equivalent roaded area as ameasure of cumulative effect of logging. Environmental Management19:609–21.
McKean, J. 1987. Landslide damage to the Mosquito Ridge road,Tahoe National Forest. In Landslide activity in the Sierra Nevadaduring 1982 and 1983, edited by J. V. De Graff, 56–62. San Francisco:U.S. Forest Service.
McKelvey, K. S., C. N. Skinner, C. Chang, D. C. Erman, S. J. Husari,D. Parsons, J. W. van Wagtendonk, and C. P. Weatherspoon. 1996.An overview of fire in the Sierra Nevada. In Sierra Nevada EcosystemProject: Final report to Congress, vol. II, chap. 37. Davis: Universityof California, Centers for Water and Wildland Resources.
McPhee, J. 1993. Assembling California. New York: Farrar, Straus, andGiroux.
McWilliams, B., and G. Goldman. 1994. The mineral industries inCalifornia: Their impact on the state economy. Publication CNR 003.University of California, Division of Agriculture and NaturalResources.
Megahan, W. F. 1983. Hydrologic effects of clearcutting and wildfireon steep granitic slopes in Idaho. Water Resources Research 19:811–19.
———. 1992. An overview of erosion and sedimentation processeson granitic soils. In Decomposed granitic soils: Problems and solutions,edited by S. Sommarstrom. Davis: University of California,University Extension.
Megahan, W. F., and W. J. Kidd. 1972. Effects of logging and loggingroads on erosion and sediment deposition from steep terrain.Journal of Forestry 7:136–41.
Megahan, W. F., and P. N. King. 1985. Identification of critical areason forest lands for control of nonpoint sources of pollution.Environmental Management 9:7–18.
Megahan, W. F., and D. C. Molitor. 1975. Erosional effects of wildfireand logging in Idaho. In Watershed management symposium, 423–44. New York: American Society of Civil Engineers.
Melack, J. M., J. Dozier, C. R. Goldman, D. Greenland, A. M. Milner,and R. J. Naiman. In press. Effects of climate change on inlandwaters of the Pacific coastal mountains and western Great Basinof North America. Hydrological Processes.
Melack, J., and J. Sickman. 1995. Snowmelt induced chemical changesin seven streams in the Sierra Nevada, California. In Biogeochemis-try of seasonally snow-covered catchments, edited by K. A. Tonnessen,M. W. Williams, and M. Tranter, 221–34. Publication 228.Wallingford, England: International Association of HydrologicalSciences.
Melack, J., J. Sickman, F. Setaro, and D. Dawson. 1995. Monitoring ofwet deposition in alpine areas of the Sierra Nevada. Final report,contract A932-081. Sacramento: California Air Resources Board.
Melack, J., J. Sickman, F. Setaro, and D. Engle. 1993. Long-term studiesof lakes and watersheds in the Sierra Nevada: Patterns andprocesses of surface-water acidification. Final report, contractA932-060. Sacramento: California Air Resources Board.
Melack, J. M., J. L. Stoddard, and C. A. Ochs. 1985. Major ion chemistryand sensitivity to acid precipitation of Sierra Nevada lakes. WaterResources Research 21 (1): 27–32.
Menke, J. W., ed. 1977. Proceedings of the workshop on livestock andwildlife-fisheries relationships in the Great Basin. Davis: Universityof California.
Menke, J. W., C. Davis, and P. Beesley. 1996. Rangeland assessment.
In Sierra Nevada Ecosystem Project: Final report to Congress, vol. III.Davis: University of California, Centers for Water and WildlandResources.
Michaelson, J., L. Haston, and F. W. Davis. 1987. 400 years of centralCalifornia precipitation variability reconstructed from tree rings.Water Resources Bulletin 23:809–18.
Milhous, R. T. 1982. Effect of sediment transport and flow regulationon the ecology of gravel-bed rivers. In Gravel-bed rivers, edited byR. D. Hey, J. C. Bathurst, and C. L. Thorne, 819–42. New York:John Wiley.
Millar, C. I. 1996. Tertiary vegetation history. In Sierra Nevada Ecosys-tem Project: Final report to Congress, vol. II, chap. 5. Davis: Univer-sity of California, Centers for Water and Wildland Resources.
Momsen, J. H. 1996. Agriculture in the Sierra. In Sierra Nevada Eco-system Project: Final report to Congress, vol. II, chap. 17. Davis: Uni-versity of California, Centers for Water and Wildland Resources.
Montgomery, D. R., G. E. Grant, and K. Sullivan. 1995. Watershedanalysis as a framework for implementing ecosystem manage-ment. Water Resources Bulletin 31:369–86.
Montoya, B. L., and X. Pan. 1992. Inactive mine drainage in theSacramento valley, California. Sacramento: California Regional WaterQuality Control Board, Central Valley Region.
Mount, J. F. 1995. California rivers and streams: The conflict between fluvialprocesses and land use. Berkeley and Los Angeles: University ofCalifornia Press.
Moyle, P. B. 1996. Status of aquatic habitat types. In Sierra NevadaEcosystem Project: Final report to Congress, vol. II, chap. 32. Davis:University of California, Centers for Water and Wildland Re-sources.
Moyle, P. B., and P. J. Randall. 1996. Biotic integrity of watersheds. InSierra Nevada Ecosystem Project: Final report to Congress, vol. II, chap.34. Davis: University of California, Centers for Water and Wild-land Resources.
Moyle, P. B., R. M. Yoshiyama, and R. Knapp. 1996. Status of fish andfisheries. In Sierra Nevada Ecosystem Project: Final report to Congress,vol. II, chap. 33. Davis: University of California, Centers for Waterand Wildland Resources.
Myrup, L. O., T. M. Powell, D. A. Godden, and C. R. Goldman. 1979.Climatological estimate of the average monthly energy and waterbudgets of Lake Tahoe, California-Nevada. Water ResourcesResearch 15:1499–508.
Nadeau, R. A. 1950. The water seekers. Bishop, CA: Chalfant Press.Naiman, R. J., D. G. Lonzarich, T. J. Beechie, and S. C. Ralph. 1992.
General principles of classification and the assessment of conser-vation potential in rivers. In River conservation and management,edited by P. J. Boon, P. Calow, and G. E. Petts, 93–123. Chichester,England: John Wiley and Sons.
Naiman, R. J., J. J. Magnuson, D. M. McKnight, and J. A. Stanford.1995. The freshwater imperative: A research agenda. Washington, DC:Island Press.
Nelson, R. L., M. L. McHenry, and W. S. Platts. 1991. Mining. InInfluences of forest and rangeland management on salmonid fishes andtheir habitats, edited by W. R. Meehan, 425–57. Bethesda, MD:American Fisheries Society.
Newbold, J. D., D. C. Erman, and K. B. Roby. 1980. Effects of loggingon macroinvertebrates in streams with and without buffer strips.Canadian Journal of Fisheries and Aquatic Sciences 37:1076–85.
Newton, M., and J. A. Norgren. 1977. Silvicultural chemicals and pro-tection of water quality. EPA Report 910/9-77-036. Seattle: Environ-mental Protection Agency, Region X.

917Hydrology and Water Resources
Norris, L. A., C. L. Hawkes, W. L. Webb, D. G. Moore, W. B. Bollen,and E. Holcombe. 1978. A report of research on the behavior and impactof chemical fire retardants in forest streams. Corvallis, OR: U.S. ForestService, Forestry Sciences Laboratory.
Norris, L. A., H. W. Lorz, and S. V. Gregory. 1991. Forest chemicals.In Influences of forest and rangeland management on salmonid fishesand their habitats, edited by W. R. Meehan, 207–96. Bethesda, MD:American Fisheries Society.
Norris, L. A., and W. L. Webb. 1989. Effects of fire retardant on waterquality. In Proceedings of the symposium on fire and watershedmanagement, edited by N. H. Berg, 79–86. General Technical ReportPSW-109. Berkeley, CA: U.S. Forest Service, Pacific SouthwestForest and Range Experiment Station.
O’Connor, M. D. 1986. Effects of logging on organic debris dams infirst order streams in northern California. Master ’s thesis,University of California, Berkeley.
Overton, K. C., G. L. Chandler, and J. A. Pisano. 1994. Northern/intermountain regions’ fish habitat inventory: Grazed, rested, andungrazed reference stream reaches, Silver King Creek, California.General Technical Report INT-311. Ogden, UT: U.S. Forest Service,intermountain Research Station.
Pacific Gas and Electric Company. 1911. Properties owned and operated,territories served. San Francisco: Pacific Gas and Electric Company.
———. 1994. Project description: Rock Creek–Cresta sediment managementproject. San Francisco: Pacific Gas and Electric Company.
Page, R. W., P. W. Antilla, K. L. Johnson, and M. J. Pierce. 1984. Ground-water conditions and well yields in fractured rocks, southwestern NevadaCounty, California. Water-Resources Investigations Report 83-4262.Sacramento: U.S. Geological Survey.
Pagenhart, T. H. 1969. Water use in the Yuba and Bear River Basins,California. Ph.D. diss., University of California, Berkeley.
Palmer, T. 1988. The Sierra Nevada. Washington, DC: Island Press.———. 1993. The wild and scenic rivers of America. Washington, DC:
Island Press.———. 1994. Lifelines: The case for river conservation. Washington, DC:
Island Press.Parizek, R. R. 1971. Impacts of highways on the hydrogeologic
environment. In Environmental geomorphology, edited by D. R.Coates, 151–99. Binghamton: State University of New York.
Parsons Engineering Science. 1995. Environmental assessment for thePacific Gas and Electric Company Mokelumne weather modifica-tion project. Parsons Engineering Science, Alameda, California.
Patric, J. H., J. O. Evans, and J. D. Helvey. 1984. Summary of sedimentyield data from forested land in the United States. Journal of Forestry82:101–4.
Peattie, R., ed. 1947. The Sierra Nevada: The range of light. New York:Vanguard Press.
Pelzman, R. J. 1973. Causes and possible prevention of riparian plantencroachment on anadromous fish habitat. Administrative Report73-1. Sacramento: California Department of Fish and Game,Environmental Services Branch.
Perkins, M. A., C. R. Goldman, and R. L. Leonard. 1975. Residualnutrient discharge in stream waters influenced by sewage effluentspraying. Ecology 56:453–60.
Pisani, D. J. 1977. The polluted Truckee: A study in interstate wa-ter quality 1870–1934. Nevada Historical Society Quarterly 20 (3):151–66.
———. 1984. From the family farm to agribusiness. Berkeley and LosAngeles: University of California Press.
Pitt, M. D., Burgy R. H., and H. F. Heady. 1978. Influences of brushconversion and weather patterns on runoff from a northernCalifornia watershed. Journal of Range Management 31 (1): 23–27.
Placer County. 1994. Placer County General Plan, background report,vol. 2. Auburn, CA: Placer County.
Plumas National Forest. 1988. Land and resources management plan.U.S. Forest Service, Plumas National Forest, Quincy, CA.
Poff, R. J. 1989a. Compatibility of timber salvage operations withwatershed values. In Proceedings of the symposium on fire andwatershed management, edited by N. H. Berg, 137–40. GeneralTechnical Report PSW-109. Berkeley, CA: U.S. Forest Service,Pacific Southwest Forest and Range Experiment Station.
———. 1989b. Distribution and persistence of hydrophobic soil layerson the Indian Burn. In Proceedings of the symposium on fire andwatershed management, edited by N. H. Berg, 153. General TechnicalReport PSW-109. Berkeley, CA: U.S. Forest Service, PacificSouthwest Forest and Range Experiment Station.
———. 1996. Effects of silvicultural practices and wildfire onproductivity of forest soils. In Sierra Nevada Ecosystem Project: Finalreport to Congress, vol. II, chap. 16. Davis: University of California,Centers for Water and Wildland Resources.
Pomby, J. 1987. Mined land reclamation program. California Geology40 (1): 3–6.
Ponce, S. L., ed. 1983. The potential for water yield augmentation throughforest and range management. Bethesda, MD: American WaterResources Association.
Postel, S. 1992. Last oasis: Facing water scarcity. New York: World WatchInstitute/W. W. Norton.
Potts, D. F., D. L. Peterson, and H. R. Zuuring. 1989. Estimating postfire water production in the Pacific Northwest. Research Paper PSW-197. Berkeley, CA: U.S. Forest Service, Pacific Southwest Forestand Range Experiment Station.
Poulin, R., R. C. Pakalris, and K. Sindling. 1994. Aggregate resources:Production and environmental constraints. Environmental Geology23:221–27.
Ramey, M. P., and S. M. Beck. 1990. Flushing flow evaluation: The NorthFork of the Feather River below Poe Dam. Environment, Health, andSafety Report 009.4-89.9. San Ramon, CA: Pacific Gas and ElectricCompany, Research and Development.
Rausch, D. L., and H. G. Heinemann. 1984. Measurement of reservoirsedimentation. In Erosion and sediment yield: Some methods ofmeasurement and modeling, edited by D. F. Hadley and D. E. Walling,179–200. Norwich, England: Geo Books.
Rector, J. R., and L. H. MacDonald. 1987. Water yield opportunitieson national forest lands in the Pacific Southwest Region. InProceedings of the California watershed management conference, editedby R. Z. Callaham and J. J. DeVries, 68–73. Report 11. Berkeley:University of California, Wildland Resources Center.
Redinger, D. H. 1949. The story of Big Creek. Los Angeles: AngelesPress.
Reid, L. M. 1993. Research and cumulative watershed effects. GeneralTechnical Report PSW-141. Albany, CA: U.S. Forest Service, PacificSouthwest Research Station.
Reid, L. M., and T. Dunne. 1984. Sediment production from forestroad surfaces. Water Resources Research 20:1753–61.
Reisner, M. 1986. Cadillac desert. New York: Viking Press.Rice, R. M., and J. Lewis. 1991. Estimating erosion risks associated
with logging and forest roads in northwestern California. WaterResources Bulletin 27:809–18.

918VOLUME I I , CHAPTER 30
Rice, R. M., and J. R. Wallis. 1962. How a logging operation can affectstreamflow. Forest Industries 89 (11): 38–40.
Roby, K. B. 1989. Watershed response and recovery from the WillFire: Ten years of observation. In Proceedings of the symposium onfire and watershed management, edited by N. H. Berg, 131–36. GeneralTechnical Report PSW-109. Berkeley: U.S. Forest Service, PacificSouthwest Forest and Range Experiment Station.
Roby, K. B., and D. L. Azuma. 1995. Changes in a reach of a northernCalifornia stream following wildfire. Environmental Management19:591–600.
Rollins, J. L. 1931. Shall the hydraulic mines within the Bear RiverBasin, Placer and Nevada Counties, California, be rehabilitatedor shall they be abandoned? Paper presented to California DebrisCommission, Sacramento.
Romm, J., R. Z. Callaham, and R. Kattelmann. 1988. Toward managingSierra Nevada forests for water supply. Report 17. Berkeley: Universityof California, Wildland Resources Center.
Roos, M. 1987. Possible changes in California snowmelt runoffpatterns. In Proceedings of the fourth Pacific climate workshop, 22–31.
Roth, P., C. Blanchard, J. Harte, H. Michaels, and M. T. El-Ashry. 1985.The American West’s acid rain test. Washington, DC: World ResourcesInstitute.
Sandecki, M. 1989. Aggregate mining in river systems. CaliforniaGeology 42 (4): 88–94.
Sauder, R. A. 1994. The last frontier: Water diversion in the growth anddestruction of Owens Valley agriculture. Tucson: University ofArizona Press.
Scharf, R. F., and M. Srago. 1975. Conifer damage and death associatedwith the use of deicing salt in the Lake Tahoe Basin of California andNevada. Forest Pest Control Report 1. San Francisco: U.S. ForestService, California Region.
Scheidt, M. E. 1967. Environmental effects of highways. Journal of theSanitary Engineering Division, Proceedings of the American Society ofCivil Engineers 93 (SA5): 17–25.
Schindler, D. W. 1988. Effects of acid rain on freshwater ecosystems.Science 239:149–57.
Schumm, S. A. 1963. The disparity between present rate of denudationand orogeny. Professional Paper 4544. Washington, DC: U.S.Geological Survey.
Scott, K. M., and G. C. Gravlee. 1968. Flood surge on the Rubicon River,California—hydrology, hydraulics, and boulder transport. ProfessionalPaper 422-M. Washington, DC: U.S. Geological Survey.
Sea Surveyor, Inc. 1993. Results from a bathymetric/geophysical surveyof Slab Creek Reservoir performed for the Sacramento Municipal UtilityDistrict. Benicia, CA: Sacramento Municipal Utility District.
Seckler, D., ed. 1971. California water: A study in resource management.Berkeley and Los Angeles: University of California Press.
Seidelman, P., J. Borum, R. Coats, and L. Collins. 1986. Land distur-bance and watershed processes in Sierrian [sic] granitic terrain. EarthResources Monograph 9. San Francisco: U.S. Forest Service, Re-gion 5.
Senter, E. 1987. Erosion control at Malakoff Diggings State Historical Park.Sacramento: California Department of Water Resources, CentralDistrict.
Shapiro, A. M. 1996. Status of butterflies. In Sierra Nevada EcosystemProject: Final report to Congress, vol. II, chap. 27. Davis: Universityof California, Centers for Water and Wildland Resources.
Shelton, M. L. 1994. Reservoir storage and irrigation influences onthe hydrologic system in the Sacramento River Basin, California.
In Effects of human-induced changes on hydrologic systems, edited byR. A. Marston and V. R. Hasfurther, 679–88. Bethesda, MD:American Water Resources Association.
Shoup, L. H. 1988. Historical overview of the New Melones locality,1806–1942. In Culture change in the central Sierra Nevada 8000 B.C.–A.D. 1950, edited by M. J. Moratto, J. D. Tordoff, and L. H. Shoup,Fresno: Infotec Research, Inc.
Sidle, R. C. 1980. Slope stability on forest land. Publication 209. Corvallis:Oregon State University, Pacific Northwest Extension.
Sidle, R. C., A. J. Pearce, and C. L. O’Loughlin. 1985. Hillslope stabilityand land use. Water Resources Monograph Series II. Washington,DC: American Geophysical Union.
Silva, M. 1986. Placer gold recovery methods. Special Publication 87.Sacramento: California Division of Mines and Geology.
Skau, C. M., and J. C. Brown. 1990. A synoptic view of nutrients andsuspended sediments in natural waters of forested watershed ineast-central Sierra Nevada. In Proceedings international mountainwatershed symposium: Subalpine processes and water quality, editedby I. G. Poppoff, C. R. Goldman, S. L. Loeb, and L. B. Leopold,South Lake Tahoe, CA: Tahoe Resource Conservation District.
Skau, C. M., J. C. Brown, and J. A. Nadolski. 1980. Snowmelt sedimentfrom Sierra Nevada headwaters. In Symposium on watershedmanagement, 418–29. New York: American Society of CivilEngineers.
Skinner, C. N., and C. Chang. 1996. Fire regimes, past and present. InSierra Nevada Ecosystem Project: Final report to Congress, vol. II, chap.38. Davis: University of California, Centers for Water and WildlandResources.
Slotten, D. G., S. M. Ayers, J. E. Reuter, and C. R. Goldman. 1995.Gold mining impacts on food chain mercury in northwestern SierraNevada streams. Technical Completion Report W-816. Davis: Uni-versity of California, Water Resources Center .
Slotten, D. G., J. E. Reuter, C. R. Goldman, R. Jepson, and W. Lick.1994. Camanche Reservoir bottom sediment study: Heavy metaldistribution and resuspension characteristics. Contribution No. 40.Davis: University of California, Institute of Ecology.
Smith, J. L. 1982. The historical climatic regime and projected impact ofweather modification upon precipitation and temperature at CentralSierra Snow Laboratory. The Sierra Ecology Project, vol. 3. Denver:U.S. Bureau of Reclamation, Office of Atmospheric ResourcesResearch.
Soil Conservation Service. 1979. Sources of sediment: Georgetown,Camino-Fruitridge pilot study area, El Dorado County, California.Placerville, CA: U.S. Soil Conservation Service.
———. 1984. Foothills watershed area study, El Dorado unit. Placerville,CA: U.S. Soil Conservation Service.
———. 1985. Cameron Park watershed area study, El Dorado County,California. Davis, CA: U.S. Soil Conservation Service, River BasinPlanning Staff.
———. 1989. East Branch North Fork Feather River erosion inventoryreport, Plumas County, California. Davis, CA: U.S. Soil ConservationService, River Basin Planning Staff.
———. 1993. Erosion and sediment control study, Middle Creekwatershed, Shasta County, California. Redding, CA: U.S. SoilConservation Service.
Springer, E. P., and G. F. Gifford. 1980. Unconfined grazing andbacterial water pollution: A review. In Symposium on watershedmanagement 1980, 578–87. New York: American Society of CivilEngineers.

919Hydrology and Water Resources
Stanislaus National Forest. 1993. Domingo reforestation environmentalassessment. Sonora, CA: U.S. Forest Service, Stanislaus NationalForest.
Stanley, O. G. 1965. Brief history of hydraulic mining, gold dredging,creation of the California Debris Commission, and birth of theSacramento District of the Corps of Engineers. Manuscript on fileat Water Resources Center Archives, University of California,Berkeley.
Stednick, J. D. 1991. Wildland water quality sampling and analysis. SanDiego: Academic Press.
Steward, J. 1934. Ethnography of the Owens Valley Paiute. AmericanArchaeology and Ethnology 33:233–324.
Stewart, W. C. 1996. Economic assessment of the ecosystem. In SierraNevada Ecosystem Project: Final report to Congress, vol. III. Davis:University of California, Centers for Water and WildlandResources.
Stine, S. 1994. Extreme and persistent drought in California andPatagonia during mediaeval time. Nature 369:546–49.
———. 1996. Climate, 1650–1850. In Sierra Nevada Ecosystem Project:Final report to Congress, vol. II, chap. 2. Davis: University ofCalifornia, Centers for Water and Wildland Resources.
Strong, D. H. 1984. Tahoe, an environmental history. Lincoln: Universityof Nebraska Press.
Sudworth, G. B. 1900. Stanislaus and Lake Tahoe Forest Reserves,California, and adjacent territory. In Annual reports of the Departmentof the Interior, 21st annual report of the U.S. Geological Survey, 505–61. Washington, DC: Government Printing Office.
Suk, T. J., J. L. Riggs, and B. C. Nelson. 1985. Water contaminationwith Giardia in back-country areas. In Proceedings of the nationalwilderness research conference, 237–40. Fort Collins, CO: n.p.
Suk, T. J., S. K. Sorenson, and P. D. Dileanis. 1986. Map showing thenumber of Giardia cysts in water samples from 69 stream sites in theSierra Nevada, California. Open File Report 86-404. Menlo Park, CA:U.S. Geological Survey.
———. 1987. The relation between human presence and occurrenceof Giardia cysts in streams of the Sierra Nevada, California. Journalof Freshwater Ecology 4 (1): 71–75.
Tahoe Regional Planning Agency. 1988. Water quality management planfor the Lake Tahoe Region. Zephyr Cove, NV: Tahoe RegionalPlanning Agency.
Taylor, T. P., and D. C. Erman. 1979. The response of benthic plants topast levels of human use in high mountain lakes in Kings CanyonNational Park, California, U.S.A. Journal of Environmental Manage-ment 9:271–78.
Terrell, C. R., and P. B. Perfetti. 1989. Water quality indicators guide:Surface waters. Washington, DC: U.S. Soil Conservation Service.
Terrene Institute. 1994. Urbanization and water quality. Washington,DC: Terrene Institute.
Thornton, M. V. 1992. A history of the Groveland Community ServicesDistrict. Groveland, CA: Groveland Community Services District.
Tiedemann, A. R., et al. 1979. Effects of fire on water: A state-of-knowledgereview. General Technical Report WO-14. Washington, DC: U.S.Forest Service.
Todd, A. H. 1990. Watershed restoration and erosion control: Makingit work in subalpine areas. In Proceedings, international mountainwatershed symposium: Subalpine processes and water quality, editedby I. G. Poppoff, C. R. Goldman, S. L. Loeb, and L. B. Leopold,290–99. South Lake Tahoe, CA: Tahoe Resource ConservationDistrict.
Tonnessen, K. 1984. Potential for aquatic ecosystem acidification inthe Sierra Nevada, California. In Early biotic responses to advancinglake acidification, edited by G. Hendrey, 147–69. Boston:Butterworth.
———. 1991. The Emerald Lake watershed study. Water ResourcesResearch 27:1537–39.
Troendle, C. A., and R. M. King. 1985. The effect of timber harvest onthe Fool Creek watershed, 30 years later. Water Resources Research21:1915–22.
Troxel, B. W., and P. K. Morton. 1962. Mines and mineral resources ofKern County, California. County Report 1. San Francisco: CaliforniaDivision of Mines and Geology.
Turner, K. M. 1991. Annual evapotranspiration of native vegetationin a Mediterranean-type climate. Water Resources Bulletin 27:1–6.
U.S. Army Corps of Engineers. 1990. American River and Sacramentometropolitan investigations, California. Appendix K. Sacramento, CA:U.S. Army Corps of Engineers.
U.S. Environmental Protection Agency. 1989. Rapid bioassessment pro-tocol for use in streams and rivers: Benthic macroinvertebrates and fish.EPA/444/4-89-001. Washington, DC: Environmental ProtectionAgency, Office of Water Regulations and Standards.
———. 1993. Monitoring protocols to evaluate water quality effects ofgrazing management on western rangeland streams. EPA 910/R-93-017. Washington, DC: Environmental Protection Agency, WaterDivision, Surface Water Branch.
U.S. Forest Service. 1988. Record of decision on the California region finalenvironmental impact statement for vegetation management andreforestation. San Francisco: U.S. Forest Service.
———. 1992. Investigating water quality in the Pacific Southwest Region,best management practices evaluation program: A user’s guide. SanFrancisco: U.S. Forest Service, Region 5.
———. 1995a. Draft environmental impact statement: Managing Califor-nia spotted owl habitat in the Sierra Nevada national forests of Califor-nia, an ecosystem approach. San Francisco: U.S. Forest Service, Pa-cific Southwest Region.
———. 1995b. Results of stream condition inventory of grazed andungrazed meadow streams. Unpublished report, U.S. ForestService, Pacific Southwest Region, San Francisco.
U.S. Geological Survey. 1984. National water summary 1983—hydrologicevents and issues. Water Supply Paper 2250. Reston, VA: U.S.Geological Survey.
Wagner, J. R. 1970. Gold mines of California. Berkeley, CA: Howell-North Books.
Wagoner, L. 1886. Report on forests of the counties of Amador,Calaveras, Tuolumne, and Mariposa. In First biennial report of theCalifornia State Board of Forestry for the years 1885–1886, 39–44.Sacramento: California State Board of Forestry.
Wahl, K. L. 1991. Is April to July runoff really decreasing in the westernUnited States? Proceedings of the western snow conference 59:67–78.
Walton, J. 1992. Western times and water wars: State, culture, and rebellionin California. Berkeley and Los Angeles: University of CaliforniaPress.
Ward, R. C., J. C. Loftis, and G. B. McBride. 1986. The “data rich butinformation poor” syndrome in water quality monitoring. Envi-ronmental Management 10:291–97.
Weatherspoon, C. P. 1996. Fire-silviculture relationships in Sierraforests. In Sierra Nevada Ecosystem Project: Final report to Congress,vol. II, chap. 44. Davis: University of California, Centers for Waterand Wildland Resources.

920VOLUME I I , CHAPTER 30
Webster, P. 1972. The mighty Sierra: Portrait of a mountain world. PaloAlto, CA: American West Publishing.
Whitney, J. D. 1880. The auriferous gravels of the Sierra Nevada. Vol. 6 ofMemoir of the Museum of Comparative Zoology. Cambridge: HarvardUniversity, Museum of Comparative Zoology.
Williams, G. P., and M. G. Wolman. 1984. Downstream effects of damsand alluvial rivers. Professional Paper 1286. Reston, VA: U.S.Geological Survey.
Williams, M. W., and J. M Melack. 1991. Solute chemistry of snowmeltand runoff in an alpine basin, Sierra Nevada. Water ResourcesResearch 27:1575–88.
Wills, L., and J. C. Sheehan. 1994. East Branch North Fork Feather River,Spanish Creek, and Lost Chance Creek non-point source water pollutionstudy. Quincy, CA: Plumas Corporation.
Woolfenden, W. B. 1996. Quaternary vegetation history. In SierraNevada Ecosystem Project: Final report to Congress, vol. II, chap. 4.Davis: University of California, Centers for Water and WildlandResources.
Woyshner, M., and B. Hecht. 1990. Sediment, solute, and nutrienttransport from Squaw Creek, Truckee River Basin, California. InProceedings, international mountain watershed symposium: Subalpineprocesses and water quality, edited by I. G. Poppoff, C. R. Goldman,S. L. Loeb, and L. B. Leopold, 190–219. South Lake Tahoe, CA:Tahoe Resource Conservation District.
Yeend, W. 1974. Gold-bearing gravel of the ancestral Yuba River, SierraNevada, California. Professional Paper 772. Menlo Park, CA: U.S.Geological Survey.
Ziemer, R. R. 1981. Storm flow response to road building and partialcutting in small streams of northern California. Water ResourcesResearch 17:907–17.
Zinke, P. 1987. Soil moisture budget: An example of effects of timberharvest and regrowth. In Proceedings of the California watershedmanagement conference, edited by R. Z. Callaham and J. J. DeVries,86–88. Report 11. Berkeley: University of California, WildlandResources Center.