users manual audio precision system one
TRANSCRIPT

USERS MANUAL
AUDIO PRECISION SYSTEM ONE
November, 1992
Software Version 2.10
Fifteenth Revision, User’s Manual
Copyright 1992 by Audio Precision, Inc.P.O. Box 2209, Beaverton, Oregon 97075 U.S.A.
Telephone (503) 627-0832U.S. Toll-free Telephone 1-800-231-7350
FAX (503) 641-8906Telex 283957 AUDIO UR


System One User’s Manual, Table of Contents
UNPACK AND INVENTORY . . . . . . . . . . . . . . . . . . . . . . . . . . . . . . . . . . . . . . . . . . . . . . . . 1-1
COMPUTER SYSTEM REQUIREMENTS . . . . . . . . . . . . . . . . . . . . . . . . . . . . . . . . . . . . . . 2-1
INSTALLING THE INTERFACE CARD . . . . . . . . . . . . . . . . . . . . . . . . . . . . . . . . . . . . . . . 3-1Card Preparation Before Installation . . . . . . . . . . . . . . . . . . . . . . . . . . . . . . . . . . . . . . . . . 3-1
PCI-2 Card Preparation . . . . . . . . . . . . . . . . . . . . . . . . . . . . . . . . . . . . . . . . . . . . . . . . 3-1PCI-1 Card Preparation . . . . . . . . . . . . . . . . . . . . . . . . . . . . . . . . . . . . . . . . . . . . . . . . 3-2
PCI-2 and PCI-1 Interface Card Installation . . . . . . . . . . . . . . . . . . . . . . . . . . . . . . . . . . . 3-3Installation, IBM PC . . . . . . . . . . . . . . . . . . . . . . . . . . . . . . . . . . . . . . . . . . . . . . . . . . . 3-3
IBM PS/2 Microchannel Bus Installation . . . . . . . . . . . . . . . . . . . . . . . . . . . . . . . . . . . . . . 3-4
POWER AND CABLE CONNECTIONS . . . . . . . . . . . . . . . . . . . . . . . . . . . . . . . . . . . . . . . 4-1Generator-Only and Analyzer-Only Models. . . . . . . . . . . . . . . . . . . . . . . . . . . . . . . . . . . . 4-1
LOADING THE SOFTWARE . . . . . . . . . . . . . . . . . . . . . . . . . . . . . . . . . . . . . . . . . . . . . . . . 5-1Two Forms of Software . . . . . . . . . . . . . . . . . . . . . . . . . . . . . . . . . . . . . . . . . . . . . . . . . . . 5-1Hard Disk Operation . . . . . . . . . . . . . . . . . . . . . . . . . . . . . . . . . . . . . . . . . . . . . . . . . . . . . 5-1
Upgrading From Earlier Versions . . . . . . . . . . . . . . . . . . . . . . . . . . . . . . . . . . . . . . . . . 5-2Making Sub-Directories. . . . . . . . . . . . . . . . . . . . . . . . . . . . . . . . . . . . . . . . . . . . . . . . . 5-2DOS PATH Command . . . . . . . . . . . . . . . . . . . . . . . . . . . . . . . . . . . . . . . . . . . . . . . . . 5-4DOS APPEND Command . . . . . . . . . . . . . . . . . . . . . . . . . . . . . . . . . . . . . . . . . . . . . . 5-4
Diskette-Based Computers . . . . . . . . . . . . . . . . . . . . . . . . . . . . . . . . . . . . . . . . . . . . . . . . 5-5DOS . . . . . . . . . . . . . . . . . . . . . . . . . . . . . . . . . . . . . . . . . . . . . . . . . . . . . . . . . . . . . . . . . . 5-5Diskette Copying . . . . . . . . . . . . . . . . . . . . . . . . . . . . . . . . . . . . . . . . . . . . . . . . . . . . . . . . 5-5Bootable Disks . . . . . . . . . . . . . . . . . . . . . . . . . . . . . . . . . . . . . . . . . . . . . . . . . . . . . . . . . . 5-5Starting System One . . . . . . . . . . . . . . . . . . . . . . . . . . . . . . . . . . . . . . . . . . . . . . . . . . . . . 5-6
Two-Drive Operation. . . . . . . . . . . . . . . . . . . . . . . . . . . . . . . . . . . . . . . . . . . . . . . . . . . 5-6Single Drive Operation . . . . . . . . . . . . . . . . . . . . . . . . . . . . . . . . . . . . . . . . . . . . . . . . . 5-6Graphic System Compatibility. . . . . . . . . . . . . . . . . . . . . . . . . . . . . . . . . . . . . . . . . . . . 5-7
Mouse Programs . . . . . . . . . . . . . . . . . . . . . . . . . . . . . . . . . . . . . . . . . . . . . . . . . . . . . . . . 5-7More Automated Startup . . . . . . . . . . . . . . . . . . . . . . . . . . . . . . . . . . . . . . . . . . . . . . . . . . 5-7
GETTING STARTED QUICKLY. . . . . . . . . . . . . . . . . . . . . . . . . . . . . . . . . . . . . . . . . . . . . . 6-1Running Stored Procedures. . . . . . . . . . . . . . . . . . . . . . . . . . . . . . . . . . . . . . . . . . . . . . . . 6-1Viewing and Running Tests . . . . . . . . . . . . . . . . . . . . . . . . . . . . . . . . . . . . . . . . . . . . . . . . 6-3Panel . . . . . . . . . . . . . . . . . . . . . . . . . . . . . . . . . . . . . . . . . . . . . . . . . . . . . . . . . . . . . . . . . 6-3Making Your First Test Graph . . . . . . . . . . . . . . . . . . . . . . . . . . . . . . . . . . . . . . . . . . . . . . 6-3Graphic Cursors . . . . . . . . . . . . . . . . . . . . . . . . . . . . . . . . . . . . . . . . . . . . . . . . . . . . . . . . . 6-3Panel Cursors . . . . . . . . . . . . . . . . . . . . . . . . . . . . . . . . . . . . . . . . . . . . . . . . . . . . . . . . . . 6-4Changing Contents of Fields . . . . . . . . . . . . . . . . . . . . . . . . . . . . . . . . . . . . . . . . . . . . . . . 6-4Multiple Choice Fields . . . . . . . . . . . . . . . . . . . . . . . . . . . . . . . . . . . . . . . . . . . . . . . . . . . . 6-4Numeric Entry Fields . . . . . . . . . . . . . . . . . . . . . . . . . . . . . . . . . . . . . . . . . . . . . . . . . . . . . 6-4Blanked Fields . . . . . . . . . . . . . . . . . . . . . . . . . . . . . . . . . . . . . . . . . . . . . . . . . . . . . . . . . . 6-5
1

QUICK REFERENCES . . . . . . . . . . . . . . . . . . . . . . . . . . . . . . . . . . . . . . . . . . . . . . . . . . . . 7-1Menu System . . . . . . . . . . . . . . . . . . . . . . . . . . . . . . . . . . . . . . . . . . . . . . . . . . . . . . . . . . 7-1Generator Panel . . . . . . . . . . . . . . . . . . . . . . . . . . . . . . . . . . . . . . . . . . . . . . . . . . . . . . . . 7-3Analyzer Panel . . . . . . . . . . . . . . . . . . . . . . . . . . . . . . . . . . . . . . . . . . . . . . . . . . . . . . . . . 7-4Sweep (F9) Definitions Panel . . . . . . . . . . . . . . . . . . . . . . . . . . . . . . . . . . . . . . . . . . . . . . 7-5Software Start-Up Options . . . . . . . . . . . . . . . . . . . . . . . . . . . . . . . . . . . . . . . . . . . . . . . . 7-6
Print-out Options . . . . . . . . . . . . . . . . . . . . . . . . . . . . . . . . . . . . . . . . . . . . . . . . . . . . . 7-6Memory Control Options . . . . . . . . . . . . . . . . . . . . . . . . . . . . . . . . . . . . . . . . . . . . . . . 7-6Display Related . . . . . . . . . . . . . . . . . . . . . . . . . . . . . . . . . . . . . . . . . . . . . . . . . . . . . . 7-6Miscellaneous . . . . . . . . . . . . . . . . . . . . . . . . . . . . . . . . . . . . . . . . . . . . . . . . . . . . . . . 7-7
Function Keys . . . . . . . . . . . . . . . . . . . . . . . . . . . . . . . . . . . . . . . . . . . . . . . . . . . . . . . . . . 7-7General Information Screens . . . . . . . . . . . . . . . . . . . . . . . . . . . . . . . . . . . . . . . . . . . . . . 7-9Procedures . . . . . . . . . . . . . . . . . . . . . . . . . . . . . . . . . . . . . . . . . . . . . . . . . . . . . . . . . . . 7-10
UNITS. . . . . . . . . . . . . . . . . . . . . . . . . . . . . . . . . . . . . . . . . . . . . . . . . . . . . . . . . . . . . . . . . . 8-1Amplitude Units . . . . . . . . . . . . . . . . . . . . . . . . . . . . . . . . . . . . . . . . . . . . . . . . . . . . . . . . . 8-1Relative vs Absolute Distortion Units . . . . . . . . . . . . . . . . . . . . . . . . . . . . . . . . . . . . . . . . 8-4Relative Frequency Units . . . . . . . . . . . . . . . . . . . . . . . . . . . . . . . . . . . . . . . . . . . . . . . . . 8-4Phase and Polarity Units . . . . . . . . . . . . . . . . . . . . . . . . . . . . . . . . . . . . . . . . . . . . . . . . . 8-5Sine Burst Units . . . . . . . . . . . . . . . . . . . . . . . . . . . . . . . . . . . . . . . . . . . . . . . . . . . . . . . . 8-6DSP Units . . . . . . . . . . . . . . . . . . . . . . . . . . . . . . . . . . . . . . . . . . . . . . . . . . . . . . . . . . . . . 8-6
GENERATOR PANEL. . . . . . . . . . . . . . . . . . . . . . . . . . . . . . . . . . . . . . . . . . . . . . . . . . . . . 9-1Waveform Selection . . . . . . . . . . . . . . . . . . . . . . . . . . . . . . . . . . . . . . . . . . . . . . . . . . . . . 9-1Amplitude Control . . . . . . . . . . . . . . . . . . . . . . . . . . . . . . . . . . . . . . . . . . . . . . . . . . . . . . . 9-2Frequency Control. . . . . . . . . . . . . . . . . . . . . . . . . . . . . . . . . . . . . . . . . . . . . . . . . . . . . . . 9-3Output Section Control . . . . . . . . . . . . . . . . . . . . . . . . . . . . . . . . . . . . . . . . . . . . . . . . . . . 9-4
Bal/Unbal/Cmtst . . . . . . . . . . . . . . . . . . . . . . . . . . . . . . . . . . . . . . . . . . . . . . . . . . . . . . 9-6600/150/50 . . . . . . . . . . . . . . . . . . . . . . . . . . . . . . . . . . . . . . . . . . . . . . . . . . . . . . . . . . 9-7Float/Gnd . . . . . . . . . . . . . . . . . . . . . . . . . . . . . . . . . . . . . . . . . . . . . . . . . . . . . . . . . . . 9-7
Tone Burst Control . . . . . . . . . . . . . . . . . . . . . . . . . . . . . . . . . . . . . . . . . . . . . . . . . . . . . . 9-7Interactions . . . . . . . . . . . . . . . . . . . . . . . . . . . . . . . . . . . . . . . . . . . . . . . . . . . . . . . . . . . . 9-7
ANALYZER PANEL . . . . . . . . . . . . . . . . . . . . . . . . . . . . . . . . . . . . . . . . . . . . . . . . . . . . . 10-1Channel Selection and Principal Voltmeter Function . . . . . . . . . . . . . . . . . . . . . . . . . . . 10-2Reading Meter Range Control . . . . . . . . . . . . . . . . . . . . . . . . . . . . . . . . . . . . . . . . . . . . 10-4Other Measurement Functions . . . . . . . . . . . . . . . . . . . . . . . . . . . . . . . . . . . . . . . . . . . . 10-4Filter Frequency Control . . . . . . . . . . . . . . . . . . . . . . . . . . . . . . . . . . . . . . . . . . . . . . . . . 10-5Detector Selection. . . . . . . . . . . . . . . . . . . . . . . . . . . . . . . . . . . . . . . . . . . . . . . . . . . . . . 10-6Reading Rate . . . . . . . . . . . . . . . . . . . . . . . . . . . . . . . . . . . . . . . . . . . . . . . . . . . . . . . . . 10-6Bandwidth Control. . . . . . . . . . . . . . . . . . . . . . . . . . . . . . . . . . . . . . . . . . . . . . . . . . . . . . 10-7Optional Filters . . . . . . . . . . . . . . . . . . . . . . . . . . . . . . . . . . . . . . . . . . . . . . . . . . . . . . . . 10-7Input Configuration . . . . . . . . . . . . . . . . . . . . . . . . . . . . . . . . . . . . . . . . . . . . . . . . . . . . . 10-8Reference Values . . . . . . . . . . . . . . . . . . . . . . . . . . . . . . . . . . . . . . . . . . . . . . . . . . . . . . 10-8Range . . . . . . . . . . . . . . . . . . . . . . . . . . . . . . . . . . . . . . . . . . . . . . . . . . . . . . . . . . . . . . . 10-9
2 Audio Precision System One User's Manual

SWEEP (F9) DEFINITIONS PANEL . . . . . . . . . . . . . . . . . . . . . . . . . . . . . . . . . . . . . . . . . 11-1Stimulus and Horizontal Axis Control . . . . . . . . . . . . . . . . . . . . . . . . . . . . . . . . . . . . . . . 11-1
Source-1 Generator . . . . . . . . . . . . . . . . . . . . . . . . . . . . . . . . . . . . . . . . . . . . . . . . . . 11-1Source-1 Analyzer . . . . . . . . . . . . . . . . . . . . . . . . . . . . . . . . . . . . . . . . . . . . . . . . . . . 11-2Source-1 Switcher. . . . . . . . . . . . . . . . . . . . . . . . . . . . . . . . . . . . . . . . . . . . . . . . . . . . 11-2Source-1 DCX. . . . . . . . . . . . . . . . . . . . . . . . . . . . . . . . . . . . . . . . . . . . . . . . . . . . . . . 11-2Source-1 DSP. . . . . . . . . . . . . . . . . . . . . . . . . . . . . . . . . . . . . . . . . . . . . . . . . . . . . . . 11-2Source-1 External . . . . . . . . . . . . . . . . . . . . . . . . . . . . . . . . . . . . . . . . . . . . . . . . . . . . 11-2Other Source-1 Parameters . . . . . . . . . . . . . . . . . . . . . . . . . . . . . . . . . . . . . . . . . . . . 11-2
Generator Sweeps and Analyzer Filter Sweeps . . . . . . . . . . . . . . . . . . . . . . . . . . . . . . . 11-3System-Computed Sweeps . . . . . . . . . . . . . . . . . . . . . . . . . . . . . . . . . . . . . . . . . . . . 11-3Table-Based Sweeps . . . . . . . . . . . . . . . . . . . . . . . . . . . . . . . . . . . . . . . . . . . . . . . . . 11-4Measurements Versus Time. . . . . . . . . . . . . . . . . . . . . . . . . . . . . . . . . . . . . . . . . . . . 11-5
Measurement Parameters and Vertical Axis Control . . . . . . . . . . . . . . . . . . . . . . . . . . . 11-6Graphic and Tabular Display . . . . . . . . . . . . . . . . . . . . . . . . . . . . . . . . . . . . . . . . . . . . . . 11-7Running Tests . . . . . . . . . . . . . . . . . . . . . . . . . . . . . . . . . . . . . . . . . . . . . . . . . . . . . . . . . 11-9Graphic Cursors . . . . . . . . . . . . . . . . . . . . . . . . . . . . . . . . . . . . . . . . . . . . . . . . . . . . . . . . 11-9Re-Plotting to Improve the Graph . . . . . . . . . . . . . . . . . . . . . . . . . . . . . . . . . . . . . . . . . 11-10Dual Sensitivity for Same Variable . . . . . . . . . . . . . . . . . . . . . . . . . . . . . . . . . . . . . . . . 11-10Multiple Sweeps . . . . . . . . . . . . . . . . . . . . . . . . . . . . . . . . . . . . . . . . . . . . . . . . . . . . . . . 11-10Repeated Sweeps . . . . . . . . . . . . . . . . . . . . . . . . . . . . . . . . . . . . . . . . . . . . . . . . . . . . . 11-11Stereo Mode, Nested Sweeps, and Measurements on the Horizontal Axis . . . . . . . . . 11-11
Stereo Mode . . . . . . . . . . . . . . . . . . . . . . . . . . . . . . . . . . . . . . . . . . . . . . . . . . . . . . . 11-12Generator-Based Stereo Sweeps . . . . . . . . . . . . . . . . . . . . . . . . . . . . . . . . . . . . 11-12External Stereo Sweeps . . . . . . . . . . . . . . . . . . . . . . . . . . . . . . . . . . . . . . . . . . . 11-13Channel Balance Adjustments . . . . . . . . . . . . . . . . . . . . . . . . . . . . . . . . . . . . . . 11-15
Plotting Measurements on the Horizontal Axis . . . . . . . . . . . . . . . . . . . . . . . . . . . . 11-16Nested Sweeps. . . . . . . . . . . . . . . . . . . . . . . . . . . . . . . . . . . . . . . . . . . . . . . . . . . . . 11-16
Overlaying Graphs . . . . . . . . . . . . . . . . . . . . . . . . . . . . . . . . . . . . . . . . . . . . . . . . . . . . . 11-17External Sweeps . . . . . . . . . . . . . . . . . . . . . . . . . . . . . . . . . . . . . . . . . . . . . . . . . . . . . . 11-19
SWEEP SETTLING . . . . . . . . . . . . . . . . . . . . . . . . . . . . . . . . . . . . . . . . . . . . . . . . . . . . . . 12-1The Settled Reading Problem . . . . . . . . . . . . . . . . . . . . . . . . . . . . . . . . . . . . . . . . . . . . . 12-1Sweep Settling Control Panel . . . . . . . . . . . . . . . . . . . . . . . . . . . . . . . . . . . . . . . . . . . . . 12-2
Recommended Values . . . . . . . . . . . . . . . . . . . . . . . . . . . . . . . . . . . . . . . . . . . . . . . . 12-3Averaging for Noisy Signals. . . . . . . . . . . . . . . . . . . . . . . . . . . . . . . . . . . . . . . . . . . . . . . 12-3Timeout . . . . . . . . . . . . . . . . . . . . . . . . . . . . . . . . . . . . . . . . . . . . . . . . . . . . . . . . . . . . . . 12-4Settling Delay . . . . . . . . . . . . . . . . . . . . . . . . . . . . . . . . . . . . . . . . . . . . . . . . . . . . . . . . . . 12-4
Testing for Delay Through the Device . . . . . . . . . . . . . . . . . . . . . . . . . . . . . . . . . . . . 12-5Auto and Fixed Sampling Rates . . . . . . . . . . . . . . . . . . . . . . . . . . . . . . . . . . . . . . . . . . . 12-6External Sweeps and Sweep Settling . . . . . . . . . . . . . . . . . . . . . . . . . . . . . . . . . . . . . . . 12-6
MENUS . . . . . . . . . . . . . . . . . . . . . . . . . . . . . . . . . . . . . . . . . . . . . . . . . . . . . . . . . . . . . . . . 13-1Panel, Xdos, Dos, Quit . . . . . . . . . . . . . . . . . . . . . . . . . . . . . . . . . . . . . . . . . . . . . . . . . . 13-3Run Menu. . . . . . . . . . . . . . . . . . . . . . . . . . . . . . . . . . . . . . . . . . . . . . . . . . . . . . . . . . . . . 13-3Load Menu . . . . . . . . . . . . . . . . . . . . . . . . . . . . . . . . . . . . . . . . . . . . . . . . . . . . . . . . . . . . 13-5Save Menu . . . . . . . . . . . . . . . . . . . . . . . . . . . . . . . . . . . . . . . . . . . . . . . . . . . . . . . . . . . . 13-6
TABLE OF CONTENTS 3

Append Menu . . . . . . . . . . . . . . . . . . . . . . . . . . . . . . . . . . . . . . . . . . . . . . . . . . . . . . . . . 13-8Edit Menu . . . . . . . . . . . . . . . . . . . . . . . . . . . . . . . . . . . . . . . . . . . . . . . . . . . . . . . . . . . . 13-9
General Edit Capabililty . . . . . . . . . . . . . . . . . . . . . . . . . . . . . . . . . . . . . . . . . . . . . . 13-11Help Menu. . . . . . . . . . . . . . . . . . . . . . . . . . . . . . . . . . . . . . . . . . . . . . . . . . . . . . . . . . . 13-14Names Menu. . . . . . . . . . . . . . . . . . . . . . . . . . . . . . . . . . . . . . . . . . . . . . . . . . . . . . . . . 13-14If Menu . . . . . . . . . . . . . . . . . . . . . . . . . . . . . . . . . . . . . . . . . . . . . . . . . . . . . . . . . . . . . 13-17Util Menu . . . . . . . . . . . . . . . . . . . . . . . . . . . . . . . . . . . . . . . . . . . . . . . . . . . . . . . . . . . . 13-18Compute Menu . . . . . . . . . . . . . . . . . . . . . . . . . . . . . . . . . . . . . . . . . . . . . . . . . . . . . . . 13-20: (Colon) Line Label Symbol . . . . . . . . . . . . . . . . . . . . . . . . . . . . . . . . . . . . . . . . . . . . . 13-25
BARGRAPH DISPLAY . . . . . . . . . . . . . . . . . . . . . . . . . . . . . . . . . . . . . . . . . . . . . . . . . . . 14-1Analog Indicators for Adjustments . . . . . . . . . . . . . . . . . . . . . . . . . . . . . . . . . . . . . . . . . 14-1Stimulus Control with Bargraphs . . . . . . . . . . . . . . . . . . . . . . . . . . . . . . . . . . . . . . . . . . 14-2
Simultaneous Amplitude and Frequency Control . . . . . . . . . . . . . . . . . . . . . . . . . . . 14-3Three Parameter Bargraphs . . . . . . . . . . . . . . . . . . . . . . . . . . . . . . . . . . . . . . . . . . . . . . 14-3Bargraphs in Procedures . . . . . . . . . . . . . . . . . . . . . . . . . . . . . . . . . . . . . . . . . . . . . . . . 14-5Printing Bargraphs . . . . . . . . . . . . . . . . . . . . . . . . . . . . . . . . . . . . . . . . . . . . . . . . . . . . . 14-5
HARD COPY PRINTOUT . . . . . . . . . . . . . . . . . . . . . . . . . . . . . . . . . . . . . . . . . . . . . . . . . 15-1Introduction . . . . . . . . . . . . . . . . . . . . . . . . . . . . . . . . . . . . . . . . . . . . . . . . . . . . . . . . . . . 15-1Pixel-Limited Screen Dump Graphs and Comments . . . . . . . . . . . . . . . . . . . . . . . . . . . 15-3
/F Option . . . . . . . . . . . . . . . . . . . . . . . . . . . . . . . . . . . . . . . . . . . . . . . . . . . . . . . . . . 15-3Graph Size Selection and Printer Compatibility . . . . . . . . . . . . . . . . . . . . . . . . . . . . 15-4Graph Quality vs Size, Printer Mode, and Display System . . . . . . . . . . . . . . . . . . . 15-4Landscape and Portrait Orientation Graphs . . . . . . . . . . . . . . . . . . . . . . . . . . . . . . . 15-5Graphs Without Grids . . . . . . . . . . . . . . . . . . . . . . . . . . . . . . . . . . . . . . . . . . . . . . . . 15-6Tabular Data Printout. . . . . . . . . . . . . . . . . . . . . . . . . . . . . . . . . . . . . . . . . . . . . . . . . 15-6Panel Printout . . . . . . . . . . . . . . . . . . . . . . . . . . . . . . . . . . . . . . . . . . . . . . . . . . . . . . 15-6
High Resolution Plotter and Laser Printer Output . . . . . . . . . . . . . . . . . . . . . . . . . . . . . 15-6Plotter and HP LaserJet Laser Printer Output . . . . . . . . . . . . . . . . . . . . . . . . . . . . . 15-7
Interactive Mode . . . . . . . . . . . . . . . . . . . . . . . . . . . . . . . . . . . . . . . . . . . . . . . . . . 15-8Position Panel. . . . . . . . . . . . . . . . . . . . . . . . . . . . . . . . . . . . . . . . . . . . . . . . . . . . 15-8Attributes Panel . . . . . . . . . . . . . . . . . . . . . . . . . . . . . . . . . . . . . . . . . . . . . . . . . 15-10HP LaserJet Printer Line Attributes . . . . . . . . . . . . . . . . . . . . . . . . . . . . . . . . . . 15-12Saving Configurations. . . . . . . . . . . . . . . . . . . . . . . . . . . . . . . . . . . . . . . . . . . . . 15-12Making the Plot. . . . . . . . . . . . . . . . . . . . . . . . . . . . . . . . . . . . . . . . . . . . . . . . . . 15-12Color Separations . . . . . . . . . . . . . . . . . . . . . . . . . . . . . . . . . . . . . . . . . . . . . . . . 15-13Define Now, Print Later . . . . . . . . . . . . . . . . . . . . . . . . . . . . . . . . . . . . . . . . . . . 15-13Batch Mode Operation . . . . . . . . . . . . . . . . . . . . . . . . . . . . . . . . . . . . . . . . . . . 15-13Printing Comments to HP LaserJet III . . . . . . . . . . . . . . . . . . . . . . . . . . . . . . . . 15-15LaserJet Output via “Laser Plotter” . . . . . . . . . . . . . . . . . . . . . . . . . . . . . . . . . . 15-15
PostScript Laser Printer Output. . . . . . . . . . . . . . . . . . . . . . . . . . . . . . . . . . . . . . . . 15-16Position Panel. . . . . . . . . . . . . . . . . . . . . . . . . . . . . . . . . . . . . . . . . . . . . . . . . . . 15-17Attributes Panel . . . . . . . . . . . . . . . . . . . . . . . . . . . . . . . . . . . . . . . . . . . . . . . . . 15-18Saving Configurations. . . . . . . . . . . . . . . . . . . . . . . . . . . . . . . . . . . . . . . . . . . . . 15-19Making the Printout. . . . . . . . . . . . . . . . . . . . . . . . . . . . . . . . . . . . . . . . . . . . . . . 15-19
4 Audio Precision System One User's Manual

Color Separations . . . . . . . . . . . . . . . . . . . . . . . . . . . . . . . . . . . . . . . . . . . . . . . . 15-19Saving to Disk . . . . . . . . . . . . . . . . . . . . . . . . . . . . . . . . . . . . . . . . . . . . . . . . . . . 15-20Desktop Publishing . . . . . . . . . . . . . . . . . . . . . . . . . . . . . . . . . . . . . . . . . . . . . . . 15-20Batch Mode Operation . . . . . . . . . . . . . . . . . . . . . . . . . . . . . . . . . . . . . . . . . . . . 15-20
INTERMODULATION DISTORTION . . . . . . . . . . . . . . . . . . . . . . . . . . . . . . . . . . . . . . . . . 16-1Theory of Operation . . . . . . . . . . . . . . . . . . . . . . . . . . . . . . . . . . . . . . . . . . . . . . . . . . . . . 16-1Setting Up the Generator Panel . . . . . . . . . . . . . . . . . . . . . . . . . . . . . . . . . . . . . . . . . . . 16-2Setting Up the Analyzer Panel. . . . . . . . . . . . . . . . . . . . . . . . . . . . . . . . . . . . . . . . . . . . . 16-2Bandpass Filter Use During IMD Testing . . . . . . . . . . . . . . . . . . . . . . . . . . . . . . . . . . . . 16-3Intermodulation Distortion Sweep Testing . . . . . . . . . . . . . . . . . . . . . . . . . . . . . . . . . . . . 16-4Amplitude Measurements of IMD Signals . . . . . . . . . . . . . . . . . . . . . . . . . . . . . . . . . . . . 16-4
WOW AND FLUTTER . . . . . . . . . . . . . . . . . . . . . . . . . . . . . . . . . . . . . . . . . . . . . . . . . . . . 17-1Theory of Operation . . . . . . . . . . . . . . . . . . . . . . . . . . . . . . . . . . . . . . . . . . . . . . . . . . . . . 17-1Measurement Standards . . . . . . . . . . . . . . . . . . . . . . . . . . . . . . . . . . . . . . . . . . . . . . . . . 17-1Scrape Flutter. . . . . . . . . . . . . . . . . . . . . . . . . . . . . . . . . . . . . . . . . . . . . . . . . . . . . . . . . . 17-1Making Wow and Flutter Measurements . . . . . . . . . . . . . . . . . . . . . . . . . . . . . . . . . . . . . 17-2Spectrum Analysis of Wow & Flutter . . . . . . . . . . . . . . . . . . . . . . . . . . . . . . . . . . . . . . . . 17-3Standards and Test Methods. . . . . . . . . . . . . . . . . . . . . . . . . . . . . . . . . . . . . . . . . . . . . . 17-4Display Types. . . . . . . . . . . . . . . . . . . . . . . . . . . . . . . . . . . . . . . . . . . . . . . . . . . . . . . . . . 17-5
SWITCHER MODULES . . . . . . . . . . . . . . . . . . . . . . . . . . . . . . . . . . . . . . . . . . . . . . . . . . . 18-1Introduction. . . . . . . . . . . . . . . . . . . . . . . . . . . . . . . . . . . . . . . . . . . . . . . . . . . . . . . . . . . . 18-1Functional Description . . . . . . . . . . . . . . . . . . . . . . . . . . . . . . . . . . . . . . . . . . . . . . . . . . . 18-1
Input Switcher . . . . . . . . . . . . . . . . . . . . . . . . . . . . . . . . . . . . . . . . . . . . . . . . . . . . . . . 18-1Output Switcher . . . . . . . . . . . . . . . . . . . . . . . . . . . . . . . . . . . . . . . . . . . . . . . . . . . . . 18-1Patch Point Switcher. . . . . . . . . . . . . . . . . . . . . . . . . . . . . . . . . . . . . . . . . . . . . . . . . . 18-2Terminal Strip Switcher. . . . . . . . . . . . . . . . . . . . . . . . . . . . . . . . . . . . . . . . . . . . . . . . 18-5
Jumper Selection . . . . . . . . . . . . . . . . . . . . . . . . . . . . . . . . . . . . . . . . . . . . . . . . . . 18-5Input/Output Connections . . . . . . . . . . . . . . . . . . . . . . . . . . . . . . . . . . . . . . . . . . . 18-5
Installation . . . . . . . . . . . . . . . . . . . . . . . . . . . . . . . . . . . . . . . . . . . . . . . . . . . . . . . . . . . . 18-6Control of Switchers. . . . . . . . . . . . . . . . . . . . . . . . . . . . . . . . . . . . . . . . . . . . . . . . . . . . . 18-8
Switcher Control Panel . . . . . . . . . . . . . . . . . . . . . . . . . . . . . . . . . . . . . . . . . . . . . . . . 18-8Driving All But One Channel. . . . . . . . . . . . . . . . . . . . . . . . . . . . . . . . . . . . . . . . . . . . 18-8Sweep (F9) Definitions Panel . . . . . . . . . . . . . . . . . . . . . . . . . . . . . . . . . . . . . . . . . . . 18-9Nested Switcher Scans. . . . . . . . . . . . . . . . . . . . . . . . . . . . . . . . . . . . . . . . . . . . . . . 18-10
Typical Switcher Applications . . . . . . . . . . . . . . . . . . . . . . . . . . . . . . . . . . . . . . . . . . . . 18-11Stereo Control Preamplifier . . . . . . . . . . . . . . . . . . . . . . . . . . . . . . . . . . . . . . . . . . . 18-11Multi-track Tape Recorder . . . . . . . . . . . . . . . . . . . . . . . . . . . . . . . . . . . . . . . . . . . . 18-12Audio Chain or Mixing Console Channel . . . . . . . . . . . . . . . . . . . . . . . . . . . . . . . . . 18-16
DIGITAL SIGNAL PROCESSOR. . . . . . . . . . . . . . . . . . . . . . . . . . . . . . . . . . . . . . . . . . . . 19-1Typical DSP Applications. . . . . . . . . . . . . . . . . . . . . . . . . . . . . . . . . . . . . . . . . . . . . . . . . 19-3DSP Architecture . . . . . . . . . . . . . . . . . . . . . . . . . . . . . . . . . . . . . . . . . . . . . . . . . . . . . . . 19-5Downloading DSP Programs . . . . . . . . . . . . . . . . . . . . . . . . . . . . . . . . . . . . . . . . . . . . . . 19-5DSP Input Operation . . . . . . . . . . . . . . . . . . . . . . . . . . . . . . . . . . . . . . . . . . . . . . . . . . . . 19-6
Rate vs Bandwidth . . . . . . . . . . . . . . . . . . . . . . . . . . . . . . . . . . . . . . . . . . . . . . . . . . . 19-6
TABLE OF CONTENTS 5

Dither . . . . . . . . . . . . . . . . . . . . . . . . . . . . . . . . . . . . . . . . . . . . . . . . . . . . . . . . . . . . . 19-7AES/EBU Status Bytes . . . . . . . . . . . . . . . . . . . . . . . . . . . . . . . . . . . . . . . . . . . . . . . 19-7
BURST-SQUAREWAVE-NOISE GENERATOR. . . . . . . . . . . . . . . . . . . . . . . . . . . . . . . . 20-1Tone Burst Waveforms . . . . . . . . . . . . . . . . . . . . . . . . . . . . . . . . . . . . . . . . . . . . . . . . . . 20-1
Triggered Bursts . . . . . . . . . . . . . . . . . . . . . . . . . . . . . . . . . . . . . . . . . . . . . . . . . . . . 20-3Gated Sinewaves. . . . . . . . . . . . . . . . . . . . . . . . . . . . . . . . . . . . . . . . . . . . . . . . . . . . 20-4
Squarewaves. . . . . . . . . . . . . . . . . . . . . . . . . . . . . . . . . . . . . . . . . . . . . . . . . . . . . . . . . . 20-5Noise Waveforms . . . . . . . . . . . . . . . . . . . . . . . . . . . . . . . . . . . . . . . . . . . . . . . . . . . . . . 20-5
Pseudo and Random Noise. . . . . . . . . . . . . . . . . . . . . . . . . . . . . . . . . . . . . . . . . . . . 20-5White Noise . . . . . . . . . . . . . . . . . . . . . . . . . . . . . . . . . . . . . . . . . . . . . . . . . . . . . . . . 20-5Pink Noise . . . . . . . . . . . . . . . . . . . . . . . . . . . . . . . . . . . . . . . . . . . . . . . . . . . . . . . . . 20-6Bandpass Noise. . . . . . . . . . . . . . . . . . . . . . . . . . . . . . . . . . . . . . . . . . . . . . . . . . . . . 20-6Equalized Bandpass Noise . . . . . . . . . . . . . . . . . . . . . . . . . . . . . . . . . . . . . . . . . . . . 20-6USASI Noise . . . . . . . . . . . . . . . . . . . . . . . . . . . . . . . . . . . . . . . . . . . . . . . . . . . . . . . 20-6
DCX-127 DC AND DIGITAL I/O MODULE. . . . . . . . . . . . . . . . . . . . . . . . . . . . . . . . . . . . 21-1Voltage and Resistance Measurements . . . . . . . . . . . . . . . . . . . . . . . . . . . . . . . . . . . . . 21-1
Dc Voltage Measurements . . . . . . . . . . . . . . . . . . . . . . . . . . . . . . . . . . . . . . . . . . . . 21-2Resistance Measurements . . . . . . . . . . . . . . . . . . . . . . . . . . . . . . . . . . . . . . . . . . . . 21-2Offset and Scaling . . . . . . . . . . . . . . . . . . . . . . . . . . . . . . . . . . . . . . . . . . . . . . . . . . 21-2
DC Voltage Outputs . . . . . . . . . . . . . . . . . . . . . . . . . . . . . . . . . . . . . . . . . . . . . . . . . . . . 21-3Digital Input . . . . . . . . . . . . . . . . . . . . . . . . . . . . . . . . . . . . . . . . . . . . . . . . . . . . . . . . . . 21-3Digital Output . . . . . . . . . . . . . . . . . . . . . . . . . . . . . . . . . . . . . . . . . . . . . . . . . . . . . . . . . 21-4Program Control Input. . . . . . . . . . . . . . . . . . . . . . . . . . . . . . . . . . . . . . . . . . . . . . . . . . . 21-5Program Control Outputs . . . . . . . . . . . . . . . . . . . . . . . . . . . . . . . . . . . . . . . . . . . . . . . . 21-6Digital Control Output Ports . . . . . . . . . . . . . . . . . . . . . . . . . . . . . . . . . . . . . . . . . . . . . . 21-7
REMOTE MODE FOR TRANSMISSION TESTING AND LAPTOPCOMPUTER OPERATION . . . . . . . . . . . . . . . . . . . . . . . . . . . . . . . . . . . . . . . . . . . . . . 22-1Introduction . . . . . . . . . . . . . . . . . . . . . . . . . . . . . . . . . . . . . . . . . . . . . . . . . . . . . . . . . . . 22-1System Architecture, Testing at Two Locations with Two Computersand “A” Version Systems . . . . . . . . . . . . . . . . . . . . . . . . . . . . . . . . . . . . . . . . . . . . . . . . 22-1System Architecture, Testing at Two Locations with “S” Version System . . . . . . . . . . 22-2System Architecture, Laptop/Notebook Computers . . . . . . . . . . . . . . . . . . . . . . . . . . . . 22-3Master and Slave; General Concepts. . . . . . . . . . . . . . . . . . . . . . . . . . . . . . . . . . . . . . . 22-3Control Computer Operation. . . . . . . . . . . . . . . . . . . . . . . . . . . . . . . . . . . . . . . . . . . . . . 22-4Remote System Operation . . . . . . . . . . . . . . . . . . . . . . . . . . . . . . . . . . . . . . . . . . . . . . . 22-4
Laptop Computers with “S” Version Systems . . . . . . . . . . . . . . . . . . . . . . . . . . . . . . 22-5Transmission Testing with “S” Version System. . . . . . . . . . . . . . . . . . . . . . . . . . . . . 22-6
Modem Usage with “S” Version System One . . . . . . . . . . . . . . . . . . . . . . . . . . . 22-6Transmission Testing with Two Computers . . . . . . . . . . . . . . . . . . . . . . . . . . . . . . . 22-8
“S” Version System One, General Information. . . . . . . . . . . . . . . . . . . . . . . . . . . . . . . . 22-9“S” Version Switch Settings . . . . . . . . . . . . . . . . . . . . . . . . . . . . . . . . . . . . . . . . . . . 22-10“S” Version Technical Details . . . . . . . . . . . . . . . . . . . . . . . . . . . . . . . . . . . . . . . . . 22-11
DOS Mode Command. . . . . . . . . . . . . . . . . . . . . . . . . . . . . . . . . . . . . . . . . . . . . . . . . . 22-11Command Line Options . . . . . . . . . . . . . . . . . . . . . . . . . . . . . . . . . . . . . . . . . . . . . . . . 22-12Error Messages. . . . . . . . . . . . . . . . . . . . . . . . . . . . . . . . . . . . . . . . . . . . . . . . . . . . . . . 22-13
6 Audio Precision System One User's Manual
Creating, Running, Viewing, and Editing Remote Test Files . . . . . . . . . . . . . . . . . . . . 22-13
EQUALIZATION . . . . . . . . . . . . . . . . . . . . . . . . . . . . . . . . . . . . . . . . . . . . . . . . . . . . . . . . . 23-1Equalization Concepts and Applications . . . . . . . . . . . . . . . . . . . . . . . . . . . . . . . . . . . . . 23-1Using Furnished EQ Files . . . . . . . . . . . . . . . . . . . . . . . . . . . . . . . . . . . . . . . . . . . . . . . . 23-1Creating Equalization Files from Formulas . . . . . . . . . . . . . . . . . . . . . . . . . . . . . . . . . . . 23-3Entering and Editing Equalization Files . . . . . . . . . . . . . . . . . . . . . . . . . . . . . . . . . . . . . . 23-4Creating EQ Files from Measured Data . . . . . . . . . . . . . . . . . . . . . . . . . . . . . . . . . . . . . 23-4
ACCEPTANCE TEST LIMITS . . . . . . . . . . . . . . . . . . . . . . . . . . . . . . . . . . . . . . . . . . . . . . 24-1Creating A Limit File . . . . . . . . . . . . . . . . . . . . . . . . . . . . . . . . . . . . . . . . . . . . . . . . . . . . 24-1Creating the Test for Use With Limits Files. . . . . . . . . . . . . . . . . . . . . . . . . . . . . . . . . . . 24-2Creating Limits Files By Actual Tests . . . . . . . . . . . . . . . . . . . . . . . . . . . . . . . . . . . . . . . 24-3Running Tests With Limits . . . . . . . . . . . . . . . . . . . . . . . . . . . . . . . . . . . . . . . . . . . . . . . . 24-3Master Error Files . . . . . . . . . . . . . . . . . . . . . . . . . . . . . . . . . . . . . . . . . . . . . . . . . . . . . . 24-4
PROCEDURES. . . . . . . . . . . . . . . . . . . . . . . . . . . . . . . . . . . . . . . . . . . . . . . . . . . . . . . . . . 25-1Loading and Running Procedures . . . . . . . . . . . . . . . . . . . . . . . . . . . . . . . . . . . . . . . . . . 25-1Generating Procedures . . . . . . . . . . . . . . . . . . . . . . . . . . . . . . . . . . . . . . . . . . . . . . . . . . 25-2
Generating Procedures by Learning Keystrokes . . . . . . . . . . . . . . . . . . . . . . . . . . . . 25-2Learn Mode Procedure Example. . . . . . . . . . . . . . . . . . . . . . . . . . . . . . . . . . . . . . 25-2
Creating or Modifying Procedures in Edit Mode . . . . . . . . . . . . . . . . . . . . . . . . . . . . 25-3Adding to Existing Procedures. . . . . . . . . . . . . . . . . . . . . . . . . . . . . . . . . . . . . . . . . . . . . 25-4Program Flow Control . . . . . . . . . . . . . . . . . . . . . . . . . . . . . . . . . . . . . . . . . . . . . . . . . . . 25-5
Jumping to Another Location: UTIL GOTO. . . . . . . . . . . . . . . . . . . . . . . . . . . . . . . . 25-6Conditional Branching: IF . . . . . . . . . . . . . . . . . . . . . . . . . . . . . . . . . . . . . . . . . . . . . 25-6Conditional Branching Upon Operator Input . . . . . . . . . . . . . . . . . . . . . . . . . . . . . . . 25-6Sub-Procedures . . . . . . . . . . . . . . . . . . . . . . . . . . . . . . . . . . . . . . . . . . . . . . . . . . . . . 25-6
Sub-Procedure Example: Printing Only Upon Error . . . . . . . . . . . . . . . . . . . . . . 25-7Example: Looping On Error. . . . . . . . . . . . . . . . . . . . . . . . . . . . . . . . . . . . . . . . . . . . 25-8Sub-Procedure Example: Test Menu . . . . . . . . . . . . . . . . . . . . . . . . . . . . . . . . . . . . 25-8
Changes in Panel Setup During a Procedure . . . . . . . . . . . . . . . . . . . . . . . . . . . . . . . . . 25-9Two-Character Codes to Jump to Panel Fields . . . . . . . . . . . . . . . . . . . . . . . . . . . . 25-10
Partial Loads (Overlays) to Protect Panel Fields . . . . . . . . . . . . . . . . . . . . . . . . . . . . . 25-10Creating Overlays . . . . . . . . . . . . . . . . . . . . . . . . . . . . . . . . . . . . . . . . . . . . . . . . . . . 25-11Appearance of Blanked Fields . . . . . . . . . . . . . . . . . . . . . . . . . . . . . . . . . . . . . . . . . 25-11
Interrupting or Pausing Procedures . . . . . . . . . . . . . . . . . . . . . . . . . . . . . . . . . . . . . . . . 25-12Prompts, Pauses, and Delays . . . . . . . . . . . . . . . . . . . . . . . . . . . . . . . . . . . . . . . . . . . . 25-12De-Bugging Procedures by Single Stepping . . . . . . . . . . . . . . . . . . . . . . . . . . . . . . . . 25-13Creating a Form to be Filled In . . . . . . . . . . . . . . . . . . . . . . . . . . . . . . . . . . . . . . . . . . . 25-13Control of External Devices . . . . . . . . . . . . . . . . . . . . . . . . . . . . . . . . . . . . . . . . . . . . . . 25-14Inserting DOS Commands in a Procedure . . . . . . . . . . . . . . . . . . . . . . . . . . . . . . . . . . 25-15Limits, Error Files, and Data Management . . . . . . . . . . . . . . . . . . . . . . . . . . . . . . . . . . 25-15
Storing Data in Subdirectories . . . . . . . . . . . . . . . . . . . . . . . . . . . . . . . . . . . . . . . . . 25-16System Startup With Procedure Running . . . . . . . . . . . . . . . . . . . . . . . . . . . . . . . . . . . 25-17Continuously-Running Procedures . . . . . . . . . . . . . . . . . . . . . . . . . . . . . . . . . . . . . . . . 25-18Signal-to-Noise Ratio Tests in Procedures . . . . . . . . . . . . . . . . . . . . . . . . . . . . . . . . . . 25-18
TABLE OF CONTENTS 7
REGULATION . . . . . . . . . . . . . . . . . . . . . . . . . . . . . . . . . . . . . . . . . . . . . . . . . . . . . . . . . . 26-1Introduction . . . . . . . . . . . . . . . . . . . . . . . . . . . . . . . . . . . . . . . . . . . . . . . . . . . . . . . . . . . 26-1Regulation Concept. . . . . . . . . . . . . . . . . . . . . . . . . . . . . . . . . . . . . . . . . . . . . . . . . . . . . 26-1Regulation Panel. . . . . . . . . . . . . . . . . . . . . . . . . . . . . . . . . . . . . . . . . . . . . . . . . . . . . . . 26-1Regulation Algorithms . . . . . . . . . . . . . . . . . . . . . . . . . . . . . . . . . . . . . . . . . . . . . . . . . . . 26-2Success In Regulation . . . . . . . . . . . . . . . . . . . . . . . . . . . . . . . . . . . . . . . . . . . . . . . . . . 26-4Setting Up A Regulation Test . . . . . . . . . . . . . . . . . . . . . . . . . . . . . . . . . . . . . . . . . . . . . 26-5Data Display . . . . . . . . . . . . . . . . . . . . . . . . . . . . . . . . . . . . . . . . . . . . . . . . . . . . . . . . . . 26-6
TESTING SPEED . . . . . . . . . . . . . . . . . . . . . . . . . . . . . . . . . . . . . . . . . . . . . . . . . . . . . . . 27-1Time Per Step . . . . . . . . . . . . . . . . . . . . . . . . . . . . . . . . . . . . . . . . . . . . . . . . . . . . . . . . . 27-1Sweep Time . . . . . . . . . . . . . . . . . . . . . . . . . . . . . . . . . . . . . . . . . . . . . . . . . . . . . . . . . . 27-2Limits and Speed . . . . . . . . . . . . . . . . . . . . . . . . . . . . . . . . . . . . . . . . . . . . . . . . . . . . . . 27-2Equalization and Speed . . . . . . . . . . . . . . . . . . . . . . . . . . . . . . . . . . . . . . . . . . . . . . . . . 27-2Graphics Save Mode and Speed . . . . . . . . . . . . . . . . . . . . . . . . . . . . . . . . . . . . . . . . . . 27-3Disk Types and Testing Speed. . . . . . . . . . . . . . . . . . . . . . . . . . . . . . . . . . . . . . . . . . . . 27-3
Virtual Disks . . . . . . . . . . . . . . . . . . . . . . . . . . . . . . . . . . . . . . . . . . . . . . . . . . . . . . . . 27-3Computer Types and Speed. . . . . . . . . . . . . . . . . . . . . . . . . . . . . . . . . . . . . . . . . . . . . . 27-4FASTEST.DSP and Speed . . . . . . . . . . . . . . . . . . . . . . . . . . . . . . . . . . . . . . . . . . . . . . . 27-4Software and Speed . . . . . . . . . . . . . . . . . . . . . . . . . . . . . . . . . . . . . . . . . . . . . . . . . . . . 27-4
CREATING YOUR CUSTOM SOFTWARE START-UP PROCESS . . . . . . . . . . . . . . . . 28-1Making A Bootable Diskette . . . . . . . . . . . . . . . . . . . . . . . . . . . . . . . . . . . . . . . . . . . . . . 28-1Creating an AUTOEXEC.BAT File . . . . . . . . . . . . . . . . . . . . . . . . . . . . . . . . . . . . . . . . . 28-1Testing The Startup Process . . . . . . . . . . . . . . . . . . . . . . . . . . . . . . . . . . . . . . . . . . . . . 28-2STD.TST File to Set Initial Conditions . . . . . . . . . . . . . . . . . . . . . . . . . . . . . . . . . . . . . . 28-3Command Line Options . . . . . . . . . . . . . . . . . . . . . . . . . . . . . . . . . . . . . . . . . . . . . . . . . 28-3
Starting With a Specific Test or Procedure . . . . . . . . . . . . . . . . . . . . . . . . . . . . . . . . 28-4Starting Up With the Last Test . . . . . . . . . . . . . . . . . . . . . . . . . . . . . . . . . . . . . . . . . 28-4Graphics System Compatibility . . . . . . . . . . . . . . . . . . . . . . . . . . . . . . . . . . . . . . . . . 28-4Interface Card Locations . . . . . . . . . . . . . . . . . . . . . . . . . . . . . . . . . . . . . . . . . . . . . . 28-5Controlling Memory Usage . . . . . . . . . . . . . . . . . . . . . . . . . . . . . . . . . . . . . . . . . . . . 28-5
System One Memory Requirements . . . . . . . . . . . . . . . . . . . . . . . . . . . . . . . . . . 28-5Memory Reserved for Programs to Run Under XDOS or DOS Exit . . . . . . . . . . 28-6Screen Display Memory . . . . . . . . . . . . . . . . . . . . . . . . . . . . . . . . . . . . . . . . . . . . 28-6Internal Buffers of S1.EXE . . . . . . . . . . . . . . . . . . . . . . . . . . . . . . . . . . . . . . . . . . 28-7Data Point Buffer . . . . . . . . . . . . . . . . . . . . . . . . . . . . . . . . . . . . . . . . . . . . . . . . . 28-7Limit/Sweep/EQ File Buffer . . . . . . . . . . . . . . . . . . . . . . . . . . . . . . . . . . . . . . . . . 28-7Edit Data Buffer . . . . . . . . . . . . . . . . . . . . . . . . . . . . . . . . . . . . . . . . . . . . . . . . . . 28-7Edit Procedure Buffer . . . . . . . . . . . . . . . . . . . . . . . . . . . . . . . . . . . . . . . . . . . . . . 28-7Edit Comment Buffer . . . . . . . . . . . . . . . . . . . . . . . . . . . . . . . . . . . . . . . . . . . . . . 28-7Edit Macro Buffer . . . . . . . . . . . . . . . . . . . . . . . . . . . . . . . . . . . . . . . . . . . . . . . . . 28-8Buffer Size Control . . . . . . . . . . . . . . . . . . . . . . . . . . . . . . . . . . . . . . . . . . . . . . . . 28-8Buffer Swap to Disk . . . . . . . . . . . . . . . . . . . . . . . . . . . . . . . . . . . . . . . . . . . . . . . 28-9
Screen Appearance of Punched-Out Fields . . . . . . . . . . . . . . . . . . . . . . . . . . . . . . . 28-9Printer Mode and Printed Graph Size Selection . . . . . . . . . . . . . . . . . . . . . . . . . . . 28-9
8 Audio Precision System One User's Manual

Formatting of Graph Printout . . . . . . . . . . . . . . . . . . . . . . . . . . . . . . . . . . . . . . . . . . 28-10Plotter and Laser Printer Compatibility . . . . . . . . . . . . . . . . . . . . . . . . . . . . . . . . . . . 28-10Command Line Query. . . . . . . . . . . . . . . . . . . . . . . . . . . . . . . . . . . . . . . . . . . . . . . . 28-10Batch Files for Loading S1.EXE . . . . . . . . . . . . . . . . . . . . . . . . . . . . . . . . . . . . . . . . 28-10Using the Environment to Control Start-Up . . . . . . . . . . . . . . . . . . . . . . . . . . . . . . . 28-11
MOUSE OPERATION. . . . . . . . . . . . . . . . . . . . . . . . . . . . . . . . . . . . . . . . . . . . . . . . . . . . . 29-1Introduction. . . . . . . . . . . . . . . . . . . . . . . . . . . . . . . . . . . . . . . . . . . . . . . . . . . . . . . . . . . . 29-1Mouse Compatibility, PCI-1 Card . . . . . . . . . . . . . . . . . . . . . . . . . . . . . . . . . . . . . . . . . . 29-1Mouse Compatibility, PCI-2 Card . . . . . . . . . . . . . . . . . . . . . . . . . . . . . . . . . . . . . . . . . . 29-1
PCI-2 Installation with Bus Mouse . . . . . . . . . . . . . . . . . . . . . . . . . . . . . . . . . . . . . . . 29-1PCI-2 Installation with Serial Mouse. . . . . . . . . . . . . . . . . . . . . . . . . . . . . . . . . . . . . . 29-1
PCI-3 Installation with Mouse . . . . . . . . . . . . . . . . . . . . . . . . . . . . . . . . . . . . . . . . . . . . . 29-2Mouse Software Installation. . . . . . . . . . . . . . . . . . . . . . . . . . . . . . . . . . . . . . . . . . . . . . . 29-2Mouse Usage . . . . . . . . . . . . . . . . . . . . . . . . . . . . . . . . . . . . . . . . . . . . . . . . . . . . . . . . . . 29-2
COMPUTER MONITOR NOISE FIELDS . . . . . . . . . . . . . . . . . . . . . . . . . . . . . . . . . . . . . . 30-1
AUDIO TESTING . . . . . . . . . . . . . . . . . . . . . . . . . . . . . . . . . . . . . . . . . . . . . . . . . . . . . . . . 31-1Introduction. . . . . . . . . . . . . . . . . . . . . . . . . . . . . . . . . . . . . . . . . . . . . . . . . . . . . . . . . . . . 31-1Amplitude or Level Measurements . . . . . . . . . . . . . . . . . . . . . . . . . . . . . . . . . . . . . . . . . 31-1
Frequency Response . . . . . . . . . . . . . . . . . . . . . . . . . . . . . . . . . . . . . . . . . . . . . . . . . 31-1Frequency Response at Constant Output Amplitude. . . . . . . . . . . . . . . . . . . . . . . . . 31-2
Testing Pre-Emphasized Transmitters . . . . . . . . . . . . . . . . . . . . . . . . . . . . . . . . . 31-3Frequency Response of Compact Disc Players. . . . . . . . . . . . . . . . . . . . . . . . . . . . . 31-3Frequency Response of Tape Recorders and Players . . . . . . . . . . . . . . . . . . . . . . . 31-4
Three Head Machines . . . . . . . . . . . . . . . . . . . . . . . . . . . . . . . . . . . . . . . . . . . . . . 31-4Determining Tape Recorder Delay . . . . . . . . . . . . . . . . . . . . . . . . . . . . . . . . . . . . 31-4Two Head Machines . . . . . . . . . . . . . . . . . . . . . . . . . . . . . . . . . . . . . . . . . . . . . . . 31-5Recording a Test Tape . . . . . . . . . . . . . . . . . . . . . . . . . . . . . . . . . . . . . . . . . . . . . 31-5Playback Frequency Response. . . . . . . . . . . . . . . . . . . . . . . . . . . . . . . . . . . . . . . 31-5
Gain and Loss. . . . . . . . . . . . . . . . . . . . . . . . . . . . . . . . . . . . . . . . . . . . . . . . . . . . . . . 31-6Signal to Noise Ratio . . . . . . . . . . . . . . . . . . . . . . . . . . . . . . . . . . . . . . . . . . . . . . . . . 31-6Absolute Noise Tests . . . . . . . . . . . . . . . . . . . . . . . . . . . . . . . . . . . . . . . . . . . . . . . . . 31-7
Non-Linearity Tests . . . . . . . . . . . . . . . . . . . . . . . . . . . . . . . . . . . . . . . . . . . . . . . . . . . . . 31-7Harmonic Distortion Concepts . . . . . . . . . . . . . . . . . . . . . . . . . . . . . . . . . . . . . . . . . . 31-7SMPTE/DIN Intermodulation Concepts . . . . . . . . . . . . . . . . . . . . . . . . . . . . . . . . . . . 31-7CCIF Intermodulation Concepts . . . . . . . . . . . . . . . . . . . . . . . . . . . . . . . . . . . . . . . . . 31-8DIM/TIM Intermodulation Concepts . . . . . . . . . . . . . . . . . . . . . . . . . . . . . . . . . . . . . . 31-8Distortion Versus Amplitude . . . . . . . . . . . . . . . . . . . . . . . . . . . . . . . . . . . . . . . . . . . . 31-8Distortion Versus Frequency . . . . . . . . . . . . . . . . . . . . . . . . . . . . . . . . . . . . . . . . . . . 31-8Distortion at Constant Power Tests . . . . . . . . . . . . . . . . . . . . . . . . . . . . . . . . . . . . . . 31-9Tape Recorder Non-Linearity . . . . . . . . . . . . . . . . . . . . . . . . . . . . . . . . . . . . . . . . . . . 31-9
Distortion Versus Frequency of Tape Recorders . . . . . . . . . . . . . . . . . . . . . . . . . 31-9Compact Disc Player Non-Linearity . . . . . . . . . . . . . . . . . . . . . . . . . . . . . . . . . . . . . 31-10
CD Player THD+N Versus Frequency . . . . . . . . . . . . . . . . . . . . . . . . . . . . . . . . 31-10Quantization Distortion . . . . . . . . . . . . . . . . . . . . . . . . . . . . . . . . . . . . . . . . . . . . 31-10
Phase Measurements . . . . . . . . . . . . . . . . . . . . . . . . . . . . . . . . . . . . . . . . . . . . . . . . . . 31-12
TABLE OF CONTENTS 9

Input-Output Phase Measurements. . . . . . . . . . . . . . . . . . . . . . . . . . . . . . . . . . . . . 31-12Interchannel Phase Measurements . . . . . . . . . . . . . . . . . . . . . . . . . . . . . . . . . . . . . 31-12Tape Recorder Azimuth Adjustments . . . . . . . . . . . . . . . . . . . . . . . . . . . . . . . . . . . 31-13
ANALYZER AND GENERATOR HARDWARE . . . . . . . . . . . . . . . . . . . . . . . . . . . . . . . . 32-1Analyzer Block Diagram . . . . . . . . . . . . . . . . . . . . . . . . . . . . . . . . . . . . . . . . . . . . . . . . . 32-1Generator Block Diagram . . . . . . . . . . . . . . . . . . . . . . . . . . . . . . . . . . . . . . . . . . . . . . . . 32-4
Intermodulation Test Signal Generation Hardware . . . . . . . . . . . . . . . . . . . . . . . . . . 32-4BUR Option Hardware . . . . . . . . . . . . . . . . . . . . . . . . . . . . . . . . . . . . . . . . . . . . . . . . 32-4Auxiliary Generator Connectors. . . . . . . . . . . . . . . . . . . . . . . . . . . . . . . . . . . . . . . . . 32-5
S1.EXE ERROR REPORTING DESCRIPTIONS . . . . . . . . . . . . . . . . . . . . . . . . . . . . . . . 33-1
FURNISHED DISK FILE DESCRIPTIONS . . . . . . . . . . . . . . . . . . . . . . . . . . . . . . . . . . . . 34-1S1.EXE version: 2.10 Diskette . . . . . . . . . . . . . . . . . . . . . . . . . . . . . . . . . . . . . . . . . . . . 34-1Test and Procedures Diskette . . . . . . . . . . . . . . . . . . . . . . . . . . . . . . . . . . . . . . . . . . . . 34-1Utilities and Equalization Diskette. . . . . . . . . . . . . . . . . . . . . . . . . . . . . . . . . . . . . . . . . . 34-6
INDEX . . . . . . . . . . . . . . . . . . . . . . . . . . . . . . . . . . . . . . . . . . . . . . . . . . . . . . . . . . . . . . . . 35-1
10 Audio Precision System One User's Manual

1. UNPACK AND INVENTORY
Your new System One comes packed in a cartonwhich also contains the interface card, cable, soft-ware, and documentation. Check to be sure that youhave received:
a. System One enclosure with all modules andoptions which you ordered installed (check the pack-ing list for specific options)
b. PCI plug-in interface card for installation incomputer (unless you ordered the “S” or “G” ver-sions of System One)
c. cable with 25-pin connectors to connect Sys-tem One to computer interface card (unless you or-dered the “S” or “G” versions of System One)
d. ac power line cord
e. two training videotapes in the appropriatevideo standard for your area. The basic operator’straining videotape is APV-1 and the advanced train-ing videotape is APV-2
f. this User’s Manual, with diskettes containingSystem One software
If your order also included the DCX-127 moduleor SWR-122 family of switchers, each of these mod-ules will be shipped in a separate carton with a 0.5meter digital interface cable and an ac power linecord.
It is recommended that you save the carton(s) incase it is ever necessary to ship System One.
1-1

1-2 Audio Precision System One Operator's Manual

2. COMPUTER SYSTEM REQUIREMENTS
System One requires an IBM PC or fully compat-ible computer in order to operate. System One hasbeen successfully operated with computers using8088, 8086, 80286, 80386, and 80486 microproces-sors. With well over 2,000 units of System One inoperation, there have been no reports of incompati-bility between System One and any PC-compatiblecomputer with either the original PC bus or the Mi-crochannel bus. The PCI-3 interface card is re-quired for Microchannel bus computers.
The computer must have a minimum of 640 kbof memory. It must be operating with DOS (diskoperating system) Version 2.2 or later. It must con-tain a color graphics card (CGA), enhanced graphicscard (EGA), video graphics array card (VGA),Toshiba 3100 display system, or a Hercules(TM)
monochrome graphics card or equivalent, driving amonochrome or color monitor which is compatiblewith the graphics card.
A minimum of one diskette drive is required.Two diskette drives or one diskette drive and onehard disk drive are recommended for the most con-venient operation. The hard disk, or configuringpart of the computer memory as virtual disk (ramdisk) is particularly recommended for applicationswhere procedures will be used (see PROCEDURESchapter) or where data or error file information fromtests will be saved. It is strongly recommended thata math co-processor be installed (8087 for 8088 and8086-based computers; 80287 for 80286-based com-puters). System One will operate without it, but op-erating speed is greatly enhanced by the co-proces-sor.
IBM PC and Microchannel are trademarks of theIBM Corporation.Hercules is a trademark of Hercules Computer Tech-nology, Inc.
2-1

2-2 Audio Precision System One Operator's Manual

3. INSTALLING THE INTERFACE CARD
An interface card must be installed in the com-puter for operation of of the original and “A” ver-sions of System One. Neither the “S” (serial, or RS-232) version nor the “G” (GPIB) version requires aninterface card. See the special operator’s manualsupplement furnished with “S” version systems forinformation on preparation of the computer.
Audio Precision has manufactured three versionsof interface card. All contain a 25-pin female con-nector for the digital interface cable to System One.The PCI-1 card (no longer in production) contains asecond connector , a 9-pin female subminiature Dtype connector for connection to an original versionMicrosoft bus (parallel) mouse. The PCI-1 card iscompatible only with this original version busmouse; it is not compatible with the later versionbus mouse which has a round DIN style connector.
The PCI-2 interface card contains a 9-pin malesubminiature D type connector for use as a serialport. The PCI-2 card is compatible with either a se-
rial mouse, or a parallel mouse with its own inter-face card. The bottom edge of either the PCI-1 orPCI-2 card consists of gold-plated contacts to pluginto the computer “mother board”.
The PCI-3 card is designed for the IBM Micro-channel bus in the more powerful models of thePS/2 series; it contains neither mouse nor RS-232port.
3.1. Card Preparation BeforeInstallation
3.1.1. PCI-2 Card Preparation
If the PCI-2 card serial port is not required and abus mouse will not be installed, the PCI-2 card canbe installed without further preparation.
Figure 3-1 Jumper Locations, PCI-2 Card
3-1

If the PCI-2 card is to be installed in the com-puter along with a bus (parallel) mouse interfacecard, address conflict may occur. If so, a jumpermust be moved on the PCI-2 card to place it at a dif-ferent I/O address in the computer to avoid conflictwith the mouse interface card. Once the jumper ismoved, however, only version 1.60 or later softwaremay be used with this card.
The PCI-2 card is shipped with the address set to238 hexadecimal. All PCI-1 cards were fixed at thissame address, and all software versions through 1.50use this address. Figure 3-3 and Figure 3-1 showthe relationship between jumper position on the PCI-2 and the computer I/O address at which SystemOne will be located. Software versions 1.60 andlater will automatically determine which address thePCI-2 card is set to and will then communicate withit properly. See page 28-5 for information on forc-ing the software to work only with a specific ad-dress via the /I option at startup.
The PCI-2 card contains a serial port which is notenabled when the card is shipped. This port may beenabled and used for a serial mouse or any other se-rial port application with System One or other soft-ware applications. Note, however, that the IBM-PCand compatible architecture limits the number of se-rial ports to a maximum of two. If the serial port isto be enabled, jumpers must be moved at the P121location and the P421 location to configure the portas COM1: or COM2:. Figure 3-2 shows the pinswhich must be jumpered together at P121 and P421.
Figure 3-1 shows the location of these pins. Notealso that the DOS MODE command must then beexecuted after booting the computer to define com-munications via this port.
The remaining jumpers which may be noted onthe PCI-2 card are related to possible future DMAoperation of the interface. They should not be usedat this time.
3.1.2. PCI-1 Card Preparation
If an original PCI-1 interface card is being in-stalled or re-installed and you do not have a Mi-crosoft Mouse, be sure the Mouse circuitry is dis-abled by removing the jumper from positions 2-5.Store the jumper by plugging it onto the top horizon-tal row of pins (D1 or D3) at the bottom of the PCI-1 interface card, near the gold-plated connector pins.These two pins are already connected together onthe foil side of the card.
If the PCI-1 is used with the original version ofthe bus mouse (9-pin subminiature D connector), thejumper should normally be on position 2 for theIBM-PC, XT, and their “clones”, and on position 5for the IBM-AT and AT “clones”. The PCI-1 inter-face card duplicates the Microsoft Mouse’s use of in-terrupts including the jumper-selectable interruptnumber. If the original mouse is used with the PCI-1 card, the interrupt number may be set from 2 to 5.These numbers are etched on the board underneaththe four possible jumper pin locations, just belowthe large integrated circuit, where 2 is the positionclosest to the cable connectors. In each case, thejumper must connect a center-row pin to the bottom-row pin immediately below it. The XT and most af-ter-market hard disks use interrupt 5, thus making in-terrupt 2 the correct position for the mouse. TheAT uses interrupt 2 internally, making 5 the correctposition; however, interrupt 5 may also be associ-ated with a parallel port 2 if present. Interruptnumber 3 is normally associated with serial port 2;interrupt number 4 is normally associated with serialport 1.
MODE P121 P421COM2: pins 4-5 pins 1-2COM1: pins 1-2 pins 2-3
OFF pins 3-4 no jumper
Figure 3-2 PCI-2 Card Serial Port Configuration
JUMPER ADDRESSP321 238HP322 298HP323 2B8HP324 2D8H
Figure 3-3 PCI-2 I/O Address Jumper Location
3-2 Audio Precision System One Operator's Manual

If the PCI-1 interface card has the jumper in-stalled at the same interrupt location as another de-vice on the computer bus, the result would be mal-function of some portion of the computer system. Ifyou detect an operational problem which was notpreviously present when you first re-start your com-puter after installing the interface card, move thejumper.
3.2. PCI-2 and PCI-1 Interface CardInstallation
Every different model of computer is likely tohave variations in the process necessary to gain ac-cess to its mother board sockets for installation ofthe interface card. This manual contains installationinstructions for the IBM PC. Installation in manydesktop units is similar to the IBM PC. In all cases,disconnect the power cable and all peripheral equip-ment cables from the computer before starting.
3.2.1. Installation, IBM PC
Remove the cover mounting screws from the rearof the computer housing (see Figure 3-4), and re-move the cover by sliding it off to the front. Locatethe expansion card plug-in area at the rear of thecomputer, near the left end. Select a slot into whichyou plan to install the System One interface card.In a computer with a mixture of short and full-sizeslots, you may wish to install the System One cardin a short slot. This allows later installation of otheraccessories which require long slots. The PCI cardsare not compatible, however, with slot 8 (the lastshort slot in PC/XTs) and with the short slot in theCompaq Deskpro.
Remove the screw which holds in place the blankoption adapter cover plate (Figure 3-5) immediatelybehind the selected slot, and retain the screw. Insertthe interface card into the slot (Figure 3-6) by align-ing its gold-plated contact with the computer mother-board socket and pressing the card firmly down intothe socket. Line up the slot in the top edge of the
Figure 3-4 IBM PC Cover Removal
INSTALLING THE INTERFACE CARD 3-3

bracket with the screw hole and replace and tightenthe screw. Re-install the cover and tighten thescrews.
3.3. IBM PS/2 Microchannel BusInstallation
Remove the computer cover and select an emptyoption slot. Loosen the thumb screws that hold theoption cover plate in place and remove the coverplate. Insert the PCI-3 card, making sure that thePCI-3 board is firmly seated in the connector.Tighten thumb screws at the back of the option slotand replace the computer cover.
Put your backup copy of the IBM Reference disk-ette into drive A: and turn the computer on. TheReference diskette will boot the computer and putan IBM logo on the screen. Press <E> to get to themain menu and select “Copy An Option Diskette”from the menu.
Follow the prompts as they are given. When youare prompted to “Remove the backup copy of theReference diskette and insert your option diskette inthe drive A” insert the System One SoftwareS1.EXE diskette. The file, @6064.ADF, used bythe Reference diskette to configure the computer forthe System One option, is included on the S1.EXEdiskette.
When System One has been installed as an op-tion and the backup Reference diskette updated, youwill be prompted to remove the Reference disketteand restart the computer.
Figure 3-5 Option Adapter Mounting Area
3-4 Audio Precision System One Operator's Manual

Figure 3-6 Mounting The Interface Card
INSTALLING THE INTERFACE CARD 3-5

3-6 Audio Precision System One Operator's Manual

4. POWER AND CABLE CONNECTIONS
System One and the computer must both be con-nected to an appropriate ac mains supply. SystemOne and the DCX-127 can operate from 100 volts,120 volts, 220 volts, or 240 volts ac (+5/-10% ineach case), 48-63 Hz ac. The ac mains connec-tor/fuse holder assembly on the chassis rear containsan adapter card which selects the transformer tapsfor the line voltage. It must be inserted in the cor-rect one of four possible positions, depending on theac line voltage with which System One will be used.At the same time, a fuse of the proper current ratingmust be installed. For 100 or 120 volts, SystemOne requires a two ampere fuse must be used; for220 or 240 volts, System One needs a one amperefuse. The DCX-127 uses an 0.2 ampere slow blowfuse on all line voltages. After installing the correctfuse, hold the adapter card so that the desired linevoltage is upright and readable as you start to insertthe card into the connector assembly while facingthe System One enclosure from the rear. Slide thecard fully into place. Slide the transparent protec-tive cover over the card/fuse area. Connect an ap-propriate ac mains cable between the connector andthe source of power.
System One is designed with a protective ground(earth) connection by way of the grounding connec-tor in the power cord. This is essential for safe op-eration. Do not attempt to defeat its purpose. Foroptimum performance, it is recommended that bothSystem One and the computer be connected to thesame ac mains circuit to minimize ground loopnoise.
The SWR-122 module contains a rear-panel 2-po-sition ac mains voltage range switch. It must be setto the correct range (100-120 V or 220-240 V) forthe mains power. Connect the appropriate ac mainscables from the SWR modules to the source ofpower.
Connect the computer (assuming that it has alsobeen set for the correct voltage) to the ac powersource.
Connect the male end of the cable furnished withSystem One to the interface card installed in thecomputer. If no DCX-127 or SWR-122 moduleswill be part of the system, connect the female end ofthe digital interface cable to the connector on therear of the System One enclosure. If DCX or SWRmodules are present, the long cable from the com-puter should connect to one of them. Short digitalinterface cables may then be used to connect addi-tional modules in daisy-chain fashion, with SystemOne the last unit in the chain. This is necessarywith earlier models of the “A” version of SystemOne and all “G” or “S” versions when operating in“A” version mode, since they have only one digitalinterface connector. The DCX and SWR modulesand recent “A” version System Ones have both maleand female connectors to permit daisy chaining.
4.1. Generator-Only andAnalyzer-Only Models
System One can be provided as a generator-onlypackage (SYS-20) and an analyzer-only package(SYS-02). These units are commonly used in test-ing broadcast transmission links. When the twounits are used at the same location, two audio cableconnections are required between them so that thegenerator monitor (GEN-MON) function will work.The generator monitor function permits the analyzerto measure the exact, loaded output voltage from thegenerator. It is required for self-test proceduressuch as SYS22CK.PRO (included on the Tests andUtilities diskette) to function. Connect a shieldedaudio cable with XLR connectors between the Chan-nel A Generator Monitor connectors of the SYS-20and SYS-02 packages. Connect another shielded ca-ble between the Channel B Generator Monitor con-nectors on the two units.
Turn on System One, the DCX-127, and thecomputer. The SWR-122 switchers have no powerswitch.
4-1

4-2 Audio Precision System One Operator's Manual

5. LOADING THE SOFTWARE
5.1. Two Forms of Software
System One may be software-controlled from anIBM-PC or compatible in two fashions:
• The large majority of System One users findit most efficient and convenient to control thesystem from the panels and menus providedby the standard software furnished, S1.EXE.S1.EXE provides instant graphic results, ana-log bar graph indications for adjustments, sup-ports impromptu, unstructured testing, pro-vides structured tests through procedures, sup-ports acceptance test limits for go/no-go test-ing, and can be operated without prior experi-ence in a programming language. S1.EXEsupports virtually all types of audio testing.The balance of this User’s Manual (except forthe COMPUTER MONITOR NOISE FIELDSchapter and ANALYZER AND GENER-ATOR HARDWARE chapter) deals exclu-sively with S1.EXE operation.
System One software is furnished on severaldiskettes. The principal operating softwarefor System One is contained in a file namedS1.EXE. Other diskettes contain a number ofexample test (.TST) files, procedure (.PRO)files, equalization (.EQ) files, and limit (.LIM)files, performance checks, DSP programs ifthe unit purchased has DSP capability, plus anumber of general utility programs for useduring non-audio-testing applications of yourcomputer. Usage of some of the exampletests and procedures will be discussed in thenext chapter.
• Certain users find it necessary to write theirown code. Examples of applications whichhave required user-written programs includesimultaneous control and audio testing oflarge audio routing switchers, extensive inter-action with robots or device handlers, or test-ing plus significant post processing such asstatistical computations. Audio Precision of-
fers for sale two libraries which act as exten-sions to two common Microsoft programminglanguages. The LIB-BASIC library is an ex-tension to the Microsoft BASIC ProfessionalDevelopment System v7.10. The MicrosoftQuickBASIC Extended Environment is in-cluded as part of their Professional Develop-ment System v7.10. The LIB-C library is anextension to the Microsoft C language, v5.1or later. These libraries of call functions al-low control of all aspects of System One in-cluding the DSP functions, SWR-122 switch-ers, and DCX-127 hardware from user-writtenprograms in the language specified. Well-written programs in these languages, usingthese function libraries, typically operate sub-stantially faster than when the same set oftests is performed with the standard S1.EXEsoftware, partially due to the reduction in com-puter disk accesses.
If the user-written program approach to testing isrelevant, contact Audio Precision or your Audio Pre-cision distributor for information on how to pur-chase the LIB-C or LIB-BASIC library and docu-mentation. LIB-C and LIB-BASIC replace the ear-lier LIB-MIX, APBASIC library, and “C” languagefunctions. The remainder of this manual will dealwith S1.EXE.
5.2. Hard Disk Operation
Most computers in use today have a hard disk(fixed disk) in addition to one or more diskette(floppy disk) drives. This section for software instal-lation assumes that your computer is hard-disk-based, that DOS has been installed and the machineboots from the hard disk, and that proper operationof all portions of the system (monitor, keyboard,etc.) has been verified. If your computer does nothave a hard disk, see the “Diskette-Based Comput-ers” section below for instructions.
5-1

Audio Precision recommends that a specific setof sub-directories as described below be created onthe hard disk for operation of System One, and thatspecific files from the furnished diskettes be copiedinto specific hard disk directories.
5.2.1. Upgrading From EarlierVersions
If earlier versions of S1.EXE, test, procedures,etc. have already been installed on your computerand you wish to preserve them for any reason, it isrecommended that you copy them into some archivesub-directory or onto diskettes. Then, remove thesub-directories which held the older tests and followthe installation instructions below. After completingthe installation of the new software, you may copyback from the archive sub-directories or diskettesany older procedures and tests which you wish tocontinue using. This process will avoid the risk of anew file in this release over-writing a valuable olderfile of the same name and thus destroying yourunique set-up or data. S1.EXE v2.10 will directlyload and use tests from v2.00 and v1.60. If the testis loaded and saved from v2.10, it will save as av2.10 test. Procedures from earlier versions musthave the header changed to PROCEDUREv2.10.No other changes should be required for non-DSPprocedures written under v2.00. Procedures fromv1.60 or earlier may also require changes if they in-volved panel cursor movements or if they used cer-tain menu commands which were changed fromv1.60 to v2.00.
5.2.2. Making Sub-Directories
To make a new first-level sub-directory on a harddisk (assuming the computer has been booted, type:
CD C:\ <Enter> (CD is the DOS command forchange directory; this command will place you inthe “root”, or top level, directory)
MD dirname <Enter> (MD is the DOS com-mand for make directory; dirname is your desirednew subdirectory name such as AUDIO.
Audio Precision recommends the name AUDIOfor the top-level directory of the group which willhold all distribution software from Audio Precision.Thus, the specific command from DOS after chang-ing to the root is:
MD AUDIO <Enter>
To then change the current directory from theroot directory to this new subdirectory, type:
CD AUDIO <Enter>
If the DOS PROMPT command has been exe-cuted with the proper arguments (typically done inthe AUTOEXEC.BAT file), you should see theprompt
:\AUDIO
You may then copy the entire contents of three ofthe distribution diskettes into this C:\AUDIO direc-tory. These are the “S1.EXE” diskette, the “Tests &Procedures” diskette, and the “Utilities & Equaliza-tion” diskette. To copy a diskette, place it in the A:drive and type
COPY A:*.* <Enter>
All files from the diskette will then be copiedinto the current sub-directory, which is C:\AUDIO.For the second and third diskette, it is not necessaryto type this command again. The <F3> functionkey, when in normal DOS command mode, repeatsthe last-typed DOS command which is then exe-cuted by the <Enter> key.
After copying these three diskettes intoC:\AUDIO, made a new sub-directory below thissub-directory for the contents of the PerformanceChecks diskette. With the :\AUDIO prompt visible,type
MD PERFCHEK <Enter>
This will create a new second-level subdirectorybelow the C:\AUDIO directory. To move into thisnew directory, type
5-2 Audio Precision System One Operator's Manual

CD PERFCHEK <Enter>
The DOS PROMPT should now read
\AUDIO\PERFCHEK
You can now place the Performance Checks disk-ette in the A: drive and type
COPY A:*.* <Enter>
If you have other System One-related software, itis recommended that additional sub-directories un-der C:\AUDIO be created for each of these. For ex-ample, make a sub-directory named COMPDISC un-der AUDIO for the contents of the Compact DiscPlayer testing Applications Note companion disk-ette. Make a sub-directory named LOUDSPKR un-
der AUDIO for the contents of the diskette fur-nished upon request with the Loudspeaker Testing(by swept sinewave techniques) Applications Note.
If your System One is a DSP unit, make addi-tional sub-directories under AUDIO named DSP,FASTEST, MLS, DSPCHEK, and CALIBWAV asdescribed in the DSP User’s Manual and copy theappropriate diskettes into each. See Figure 5-1 for aschematic representation of the “tree” directory struc-ture with the recommended sub-directory names andthe diskettes which should be copied into each.
As you build up your own collection of custom-ized tests, procedures, and test data files from manydevices under test, you will probably wish to createadditional sub-subdirectories and locate your filesamong them according to some organizational planappropriate for your work. In general, it is desirableto never allow more than 88 files of any one type
C:\(ROOT)
\UTIL\AUDIO
\PERFCHEK \DSP \COMPDISC \LOUDSPKR
PERFORMCHECKS
DSP FILES CD APPNOTE
SPEAKERAPP NOTE
UTIL & EQTEST &PROCEDURE
S1.EXE
\DOS etc.
Figure 5-1 Recommended Hard Disk Directory Structure and Location of Distribution Files
LOADING THE SOFTWARE 5-3

(.TST, .PRO, etc.) to exist in one sub-directory sincethe S1.EXE “LOAD” command will only displaythe first 88 files in the sub-directory.
5.2.3. DOS PATH Command
If the DOS PATH command is not used and thename of an executable file (.EXE, .COM, or .BATfile) is typed, DOS looks for that file in the currentdirectory. If it cannot locate the file, DOS responds
Bad command or file name
In order to be able to run S1.EXE and some ofthe other utility programs furnished from any sub-di-rectory, it is highly desirable to use the facililty ofthe DOS PATH command. The PATH command isnormally placed in your AUTOEXEC.BAT file, sothat it is executed each time your computer isbooted. The PATH command simply contains a listof all the specific subdirectories you would like tohave DOS look through in an attempt to find the ex-ecutable file if it is not in the current directory.With the directory structure and file locations recom-mended above, only the C:\AUDIO sub-directorycontains any of the furnished executable files. Theform of the PATH command which should be addedto your AUTOEXEC.BAT file is as follows:
PATH C:\AUDIO;
You may find that a PATH command already ex-ists in your AUTOEXEC.BAT file, containing a listof sub-directories. If so, simply append
C:\AUDIO;
at the end. The semi-colon “;” must be used as a de-limiter between consecutive sub-directory names.For example, if the C:\DOS; and C:\UTIL; sub-direc-tories were already listed in your path command, thecomplete list after you have added C:\AUDIO; willread:
PATH C:\DOS;C:\UTIL;C:\AUDIO
After adding this sub-directory to the PATH com-mand in AUTOEXEC.BAT, re-boot your computerfor it to take effect. You will then find that you cantype
S1 <Enter>
from any sub-directory on your hard disk and Sys-tem One software will load.
5.2.4. DOS APPEND Command
The APPEND command of DOS has a similar ef-fect for non-executable files (often called data files)to what the PATH command does for executablefiles. Whenever an application requires a specificdata file (and the APPEND command is not in use),the application software looks for the data file in thecurrent directory. For example, when you run a Sys-tem One procedure, it expects to find the test files inthe same directory. When a test file is loaded, it ex-pects to find any related limit files, sweep tables,etc. in the same directory. If a required file cannotbe found in the current directory, the error message
File not found
results. In order that the commonly-used SystemOne files such as .EQ files, .SWP files, and .DSPprograms (if you have a DSP unit) be usable fromany sub-directory without having to copy them intoevery sub-directory which will be used, the AP-PEND command should be employed. The AP-PEND command has been part of DOS since DOSversion 3.1. The APPEND command is again typi-cally placed in the AUTOEXEC.BAT file so that itis executed each time the computer is booted. Thesimplest form of the command is:
APPEND C:\dirname1;C:\dirname2;
where dirname1 and dirname2 represents sub-direc-tory names. Execution of this command at the timethe computer is booted will cause DOS to search thespecified directories for any requested data file notfound in the current directory; in effect, those otherspecified directories are appended to the current di-
5-4 Audio Precision System One Operator's Manual

rectory. If it is desired to suppress the searchthrough appended directories when a complete pathname is supplied for the file, the additional “switch”
/PATH:OFF
should be added to the APPEND command. This isfrequently desirable when saving tests to a specificdirectory or diskette, to avoid getting the “Filenamealready exists; Y to overwrite” message if the sup-plied file name exists in any of the appended directo-ries. With this “switch” added, the recommendeduse of the APPEND command for the sub-directorystructure and file location described above is
APPEND C:\AUDIO; /PATH:OFF
which will allow all the furnished .EQ, .TST, .LIM,and .SWP files to be used from any sub-directory onthe disk. If your unit is a DSP unit, it is recom-mended that additionally the directories
C:\AUDIO\DSP;C:\AUDIO\MLS;C:\AUDIO\FASTEST;C:\AUDIO\CALIBWAV; /PATH:OFF
be added onto the APPEND command so that allDSP programs can be run from anywhere on thehard disk.
5.3. Diskette-Based Computers
If your computer does not have a hard (fixed)disk, the following sections describe how to preparethe furnished software for use.
5.4. DOS
Before S1.EXE can be run, the computer must bestarted (booted) with a suitable version of disk oper-ating system, or DOS. DOS is normally purchasedat the same time as the computer. There are differ-ent versions of DOS for different computers, andthere may be several versions with progressivelyhigher revision numbers (DOS 2.2, DOS 2.11, DOS3.1, etc.) which are all compatible with a given com-
puter. System One software requires a DOS versionof 2.2 or later. DOS is not furnished with SystemOne due to copyright restrictions.
5.5. Diskette Copying
System One software is not copy-protected. It isgood practice to copy the System One diskettes anduse the copies in everyday applications, saving thedistribution disks from Audio Precision in a safeplace. The distribution disks have an adhesive tabover the notch near the diskette label, to preventthem from being written on or erased. Your work-ing disk with test and procedure files should nothave a write-protect tab, since you are likely to befrequently saving new files or modified versions ofold files.
The distribution disks can each be copied ontoworking disks with the DISKCOPY command ofDOS. With your DOS diskette in drive A, type
DISKCOPY A: B: <Enter>
You must then remove the DOS diskette fromdrive A and follow the computer prompt to placethe source diskette (System One distribution disk-ette) in drive A:, a target (blank) diskette in driveB:, and strike a key when ready. The DISKCOPYcommand of DOS formats and copies in one opera-tion. Diskettes can also be copied on single-diskette-drive computers by the same command. The singledrive is treated alternately as both drive A: anddrive B: by the operating system during this opera-tion. The computer will prompt you on when to in-sert and re-insert the source and target diskettes dur-ing the copying process.
5.6. Bootable Disks
A “bootable” disk is one which can be used tostart your computer. It must thus have DOS, includ-ing COMMAND.COM, on it. For computers withtwo diskette drives, the most convenient operationrequires that a disk with the test, procedure, etc.files on it be bootable and remain in the A: drive.The diskette with S1.EXE need not be bootable, andwill be used in the B: drive each time the software
LOADING THE SOFTWARE 5-5

is started. It may then be replaced with another disk-ette for test data storage or access to additional testand procedures files, since S1.EXE remains in mem-ory until the computer is re-booted or until theQUIT command is executed from within S1.EXE
Single diskette drive computers will first use aDOS diskette in drive A: to start the computer. TheS1.EXE diskette will then be loaded into memoryfrom the A: drive. Finally, a diskette with tests, pro-cedures, etc., plus COMMAND.COM will finally re-side in the A: drive for continuing operation.
You can make bootable disks and format blankdisks by use of the DOS FORMAT command; seeyour DOS manual for details. With your DOS diskin the A: drive, a bootable disk is made with thecommand:
FORMAT B:/S <Enter>
then place a blank diskette in drive B, press “Y” and<Enter>.
At the conclusion of this action, the bootable diskwill have two hidden files (IBMBIO.COM andIBMDOS.COM) plus COMMAND.COM on it.
The “Tests and Procedures” files can be copiedfrom the distribution disk in the A: drive onto a boo-table diskette in the B: drive by the command
COPY A:*.* B: <Enter>
If your computer uses 360k diskettes, it may notbe possible to copy all files from the Test and Utili-ties diskette onto a single bootable diskette since thehidden files and COMMAND.COM take up space.If your computer uses 720k, 1.2 Mb, or 1.44 Mbdiskettes, you can also copy the files from the “Utili-ties and Equalization” distribution diskette on thebootable diskette in drive B: by repeating the lastcommand above.
5.7. Starting System One
5.7.1. Two-Drive Operation
If you have a two-diskette-drive computer, placethe bootable diskette with the test, procedure, limit,etc. files in the A drive and the diskette withS1.EXE in drive B. Turn the power on to the com-puter. The computer will go through a memorycheck operation which may take from half a minuteto a minute, depending on how much memory is in-stalled. It will then load DOS into memory fromthe bootable diskette in the A: drive and normallyhalts with the screen message A> , meaning that theA diskette drive is the selected (“default”) drive andthe system is awaiting further instructions. Type
B:S1 <Enter>
This will load S1 into memory from the B: drive,but keeps A: (where the sample test and procedurefiles are located) as the default drive. Approxi-mately 30 seconds of disk drive activity should re-sult, followed by the appearance of the Audio Preci-sion logo on screen. Press any key to go to the toplevel (COMMAND) menu across the bottom of thescreen.
5.7.2. Single Drive Operation
If your computer has only one diskette drive,start the computer with any bootable diskette.When the A> prompt is obtained, remove the diskwith which you booted, place the disk with S1.EXEon it in the drive, and type
S1 <Enter>
Approximately 30 seconds of disk drive activityshould result, followed by the logo. Remove thedisk with S1 from the drive, since S1 is now resi-dent in memory, and replace it with the bootabledisk containing the test and procedure files.
5-6 Audio Precision System One Operator's Manual

5.7.3. Graphic System Compatibility
System One S1.EXE software is compatible withmost of the different graphic display systems foundin PC-compatible computers. In most cases, the soft-ware is able to detect which graphics display systemis installed in the computer and chooses the appropri-ate mode. It is unable, however, to detect certainsituations such as CGA with monochrome monitor,EGA with monochrome monitor, or the Toshiba3100 plasma display system. In these cases, the /D#command line option must be used when the soft-ware is started to force the correct mode. A com-mand line option is simply a series of characterstyped in following the characters S1 when startingthe software from DOS. For example, to obtain theproper mode for a monochrome monitor drivenfrom a CGA adapter card, type:
S1 /D2 <Enter>
For the Toshiba 3100 computer, type:
S1 /D13 <Enter>
See Figure 5-2 for a complete list of the available/D# options for various display systems.
5.8. Mouse Programs
If you plan to use a mouse with System One, asoftware program furnished with the mouse must berun prior to starting S1. This program is usuallynamed MOUSE.COM or MOUSE.SYS.
5.9. More Automated Startup
After your initial familiarization with SystemOne, you may wish to add automatic start-up proce-dures to your bootable diskette. Such autostart pro-cedures can set aside a portion of memory as a vir-tual disk for faster operation, set the computer timeand date according to a battery-backed clock-calen-dar card (if you have one), load other utility pro-grams including MOUSE.COM, cause System Onesoftware to start automatically, and even select yourown standard set of default conditions for the panelsof System One. The CREATING YOUR CUSTOMSOFTWARE START-UP PROCESS chapter start-ing on page 28-1 gives some ways to do that.
GRAPHIC SYSTEMS (VIDEO DISPLAY ADAPTERS)
/D CODE DISPLAY ADAPTER RESOLUTION (H x V)
/D0 No Display/D1 Hercules Monochrome 720 x 348/D2 CGA, Color-Compatible Monochrome Monitor 640 x 200/D3 CGA, Color Monitor 320 x 200/D4 MCGA, Analog Monochrome Monitor 640 x 480
/D5 MCGA, Analog Color Monitor 640 x 480/D6 EGA, Monochrome Monitor 640 x 350
/D7 EGA, Color-Compatible Monochrome Monitor 640 x 200/D8 EGA, Color Monitor 640 x 200/D9 EGA, Enhanced Monitor 64k 640 x 350/D10 EGA, Enhanced Monitor >64k 640 x 350/D11 VGA, Analog Monochrome Monitor 640 x 480/D12 VGA, Analog Color Monitor 640 x 480
/D13 Toshiba 3100 Plasma 640 x 400
Figure 5-2 Command Line /D Codes for Various Video Display Adapters
LOADING THE SOFTWARE 5-7

5-8 Audio Precision System One Operator's Manual

6. GETTING STARTED QUICKLY
Assuming a hard-disk-based computer, boot thecomputer and use the CD (change directory) com-mand to move into the AUDIO subdirectory whereS1.EXE and most furnished tests and procedures arelocated. To start the software, type
S1 <Enter>
The Audio Precision logo should appear on yourscreen. Touching the <Esc> key will replace thelogo with the COMMAND menu across the bottomof the screen as shown in Figure 6-1 below.
If S1.EXE software fails to load and an error mes-sage is displayed saying that insufficient memory isavailable, this is normally due to memory occupiedby other programs called TSR (terminate and stayresident) programs which have previously loadedand stayed resident. The loading of such programsis typically controlled by the AUTOEXEC.BAT filewhich runs each time the computer is booted. Thisfile must be modified to remove some of these pro-grams in order to leave sufficient memory forS1.EXE to operate. Approximately 475k bytes ofmemory must be available (assuming a VGA dis-play system) for S1.EXE software to load normally.Even with 475k, the automatic assignment of mem-ory space within S1.EXE will not be adequate formost audio testing. It is possible to over-ride thisautomatic assignment process by use of the /B, /R,and /8 command line options. It is also possible toload S1.EXE into even smaller available memory(potentially as small as about 400k) and still accom-plish useful testing by use of the /B, /R, and /8 com-mand line options. See the “Controlling Memory
Usage” section of the “Creating Your Custom Soft-ware Start-Up Process” chapter for full informationon use of these command line options.
You can move the menu cursor to the right bypressing the space bar, or move it in either directionby use of the <Del> and <+> keys at the lower rightcorner of the keyboard. You can get back to theCOMMAND menu from any other screen by press-ing <Esc>. If you are using a mouse, you can makemenu selections by rolling the mouse horizontallyand pressing either button. Pressing both mouse but-tons simultaneously has the same effect as the<Esc> key. The menu structure of System One isshown in diagram form in the QUICK REFER-ENCE chapter and is more fully described in theMENUS chapter.
6.1. Running Stored Procedures
A number of example tests, procedures, and limitfiles have been furnished on one of the diskettes.Running the procedure named SELECT.PRO willpresent you with a menu of specific demonstrationprocedures which can be selected and run. Viewingthese procedures and tests can give you a good ideaof many of the functions of System One. Interrupt-ing the procedure to examine the panel setups andprocedure listings in detail will later be helpful asyou begin to create your own tests and procedures.
To run a procedure, press <Esc> to go to the com-mand menu, followed by <L> <P> for Load Proce-dure. The screen will show you a listing of the pro-cedure files in the current directory. Unless youhave a mouse installed or a keyboard with arrow
Figure 6-1 Command Menu
6-1

keys separate from the numeric keypad, be sure theNum Lock key is in the condition which enables ar-row key action rather than digit keys. Use the ar-row keys to move the cursor onto SELECT.PROand press <Enter> to load it into the computer.Then press <R> <P> for Run Procedure. A screenwill be displayed with a number of demonstrationprocedures, selectable by pressing one of the nu-meric keys from 0 through 9. A good place to startis with selection “0" for a quick performance checkof your system. No audio cables should be con-nected to the generator output when this procedureis being run. The procedure runs through a quickcheck against published specifications of a numberof System One’s key parameters. If you wish totemporarily pause during any test in order to exam-ine the data in more detail, press the <F10> keyonce to pause and again to proceed with the test andprocedure. The procedure ends with a summary list-ing of any out-of-specification measurements. The
<PgDn> and <PgUp> keys can be used to look atthe entire summary. Pressing the <Enter> or <Esc>key takes you back to the initial set of procedures.
Selecting “1" will run a demonstration procedureof System One’s analog indication and analog gener-ator control capabilities. It also demonstrates how aprocedure can have a prompting message to the op-erator on the bar graph screen. Other procedureswill show the results of stored tests on multi-tracktape recorders and stored tests made with a DSPmodule. Still other procedures are actual workingtests for test devices such as power amplifiers andcompact disc players.
To finally exit from SELECT.PRO back to theS1.EXE command menu, press “9".
Figure 6-2 Panel Display
6-2 Audio Precision System One Operator's Manual

6.2. Viewing and Running Tests
You may also load any test individually via the<L> <T> (Load Test) key sequence from the menu,selecting the test name from the displayed directorywith the cursor, and using <Enter> to bring the testinto the computer. You may then use <F7> or RunGraph to examine the stored data, and use <Esc><P> to go to the panel to examine the setup.
Now that you have a quick idea of System Onefunction, you may wish to perform actual audio testson external devices. The example .TST files fur-nished on the distribution disk provide many of thecommon audio tests. You can Load a Test andpress <F9> or Run Test to run the test on an exter-nal device. If you do run the test and wish to savethe data via Save Test, supply another file name toavoid destroying the data originally stored. Youmay also wish to begin experimentation with thepanel and menus. Not all functions may be obvious,however; therefore, the following paragraphs brieflydescribe operation of System One for use as an intro-duction or as reference. More complete descriptionsare in the chapters which follow.
6.3. Panel
PANEL mode is used to set up tests for savingand later re-use, or to make impromptu, “spot” meas-urements. From the menu, press <P> or move thecursor to PANEL and press <Enter> to go to thepanel. You should see a full-screen display similarto that shown in Figure 6-2.
6.4. Making Your First Test Graph
The panel which you see will be the setup for thetest you last loaded, which may be the final test ofthe last procedure which you ran. It is recom-mended that you start with the standard power-onset of panel defaults. To do so, press <Esc><L> <T> and select DEFAULT.TST from the dis-played directory. Press <P> to go to the panel. Acursor will be located on one of the fields on thepanel. A second style of position marker will alsobe visible in PANEL mode near the bottom left cor-
ner of the screen; this indicates where entries will ap-pear when entering numbers into a numeric entryfield. Use the arrow keys to move the main cursorto the OUTPUT OFF field on the GENERATORpanel. Press the space bar; at the lower part of thescreen, the choices for generator on/off conditionswill appear with a cursor (“choices cursor”) now onthe A, meaning A channel on, B channel off. Pressthe <Enter> key to select the A condition.
Use the arrow keys (or mouse) to move the maincursor to the lower portion of the ANALYZERpanel, onto the line labeled CHANNEL-A and thefield indicating INPUT. Operate the space bar tomove the “choices” cursor from INPUT to GEN-MONITOR and press the <Enter> key to selectGEN-MONITOR. This connects a direct internal ca-ble between the GENERATOR channel A outputand the ANALYZER channel A input, and thebright numbers near the top of the ANALYZERpanel should begin indicating system residualTHD+N READING, generator LEVEL, and gener-ator FREQUENCY. For a 20 kHz to 20 Hz sweepof system residual distortion versus frequency (at500 kHz measurement bandwidth), press the <F9>function key. The panel will be replaced with agraph and the data will plot onto the graph as themeasurements are made. The computer will “beep”when the last measurement is made. You can returnfrom graph to panel by pressing <Enter> or<Esc> <P>.
6.5. Graphic Cursors
With a graph displayed on screen, touching eitherhorizontal arrow key will cause a graphic cursor andnumeric display areas to appear on screen. Touch-ing the left arrow first will cause the cursor to firstappear at the right edge of the screen and movedown into the data from the right end. Touching theright arrow first will cause the cursor to first appearat the left edge and move up into the data from theleft. The left-hand numeric display block, near thetop of the graph, will display the X-axis value at thecursor location. The second (and third, if three nu-meric blocks are displayed) displays are the Y-axis
GETTING STARTED QUICKLY 6-3

values of the DATA-1 line (solid line monochrome,green line color) and the DATA-2 line (dashed linemonochrome, yellow line color).
6.6. Panel Cursors
The vertical arrow keys move the cursor up anddown from field to field within any of the panel sec-tions (GENERATOR, ANALYZER, and SWEEP(F9) DEFINITION). The horizontal arrow keysmove the cursor between the three panel sections or,in the cases where a panel section has changeablefields on the same row, between those fields.Whenthe cursor is moved between panel sections, it goesto the field which it last occupied on that section.The Num Lock key controls whether the numerickeypad functions for numeric entry or for cursor con-trol via the arrow keys, <Home> and <End>, <PgUp> and <Pg Dn>, and <Ins> and <Del>. <NumLock> is a “toggle” key; each time it is pressed, itswitches the keypad to the opposite function.
Depending on your keyboard, you may find itmost convenient to leave <Num Lock> in the cursorcontrol position and use the top row of keys of themain keyboard for numeric entry, unless you have amouse option (see MOUSE chapter). If the mouseis present, you may use it for cursor control. The<Shift> key serves as a temporary over-ride of theselected <Num Lock> function. If <Num Lock> isin the cursor control condition, holding down the<Shift> key while pressing keys on the numeric key-pad will produce numeric entry (and vice versa).
6.7. Changing Contents of Fields
Certain fields are display only. Examples includelabel fields such as WAVEFORM on the GENER-ATOR panel and MEASURE on the ANALYZERpanel, the four measurement display fields near thetop of the ANALYZER panel, and the POST-EQfield on the generator panel when EQSINE is se-lected. The cursor cannot be placed on display-onlyfields. Most fields are either multiple choice fieldsor numeric entry fields.
6.8. Multiple Choice Fields
When the cursor is on a multiple choice fieldsuch as BAL UNBAL CMTST on the GENER-ATOR panel section, the choices will be displayedon the lower portion of the screen with the“choices” cursor on the current selection. The spacebar may be used to move the cursor to the rightthrough all the choices, or the <+> and <Del> keys(at the extreme lower right of most IBM-compatiblekeyboards) may be used to move the cursor eitherright or left. When the cursor is on the desiredchoice, press <Enter> to make the selection. If youhave a keyboard which has arrow keys separatefrom the numeric keypad, you may find that the<Del> key causes choices cursor movement onlywhen <Num Lock> is disabled; the <Del> keyworks as a decimal point in the <Num Lock> posi-tion.
6.9. Numeric Entry Fields
When the cursor is on a numeric entry field suchas those to the right of the words AMPLITUDE andFREQUENCY on the GENERATOR panel, num-bers can be entered directly with the number keys.System One accepts k as an abbreviation for kilo-,m as milli-, u as micro-, n as nano-, and will also ac-cept scientific notation such as 1E3 as an alternativeto 1000 or 1k. The numbers and characters typedwill first appear at the blinking underline marker atthe bottom of the screen. Errors can be correctedwith the backspace, prior to pressing <Enter> to ac-tually enter the data. For numeric entry fields thathave an associated multiple choice field for units(such as generator AMPLITUDE), you may changeboth numbers and units simultaneously by first typ-ing the numbers and then pressing the space bar.This moves the “choices” cursor in the units field,showing the choice of units available at the bottomof the screen to the right of the numbers. Use thespace bar as necessary to place the cursor on the de-sired unit, then press <Enter> to enter both thenumber and the new units simultaneously.
6-4 Audio Precision System One Operator's Manual
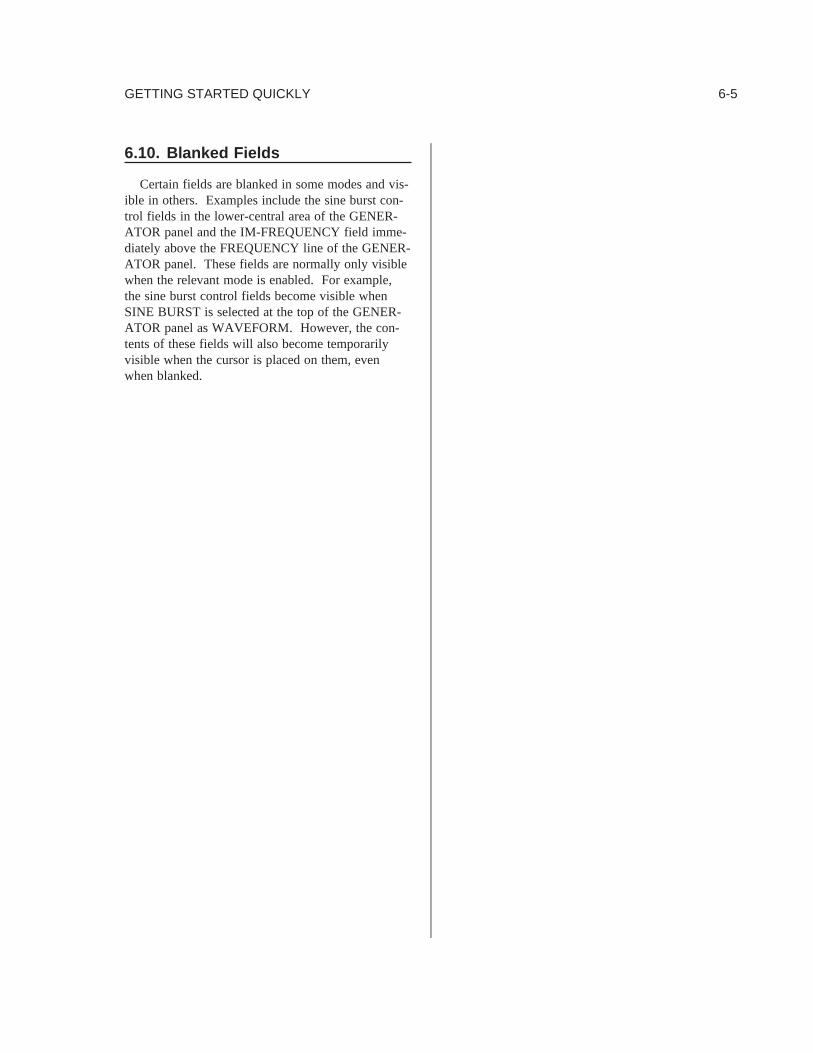
6.10. Blanked Fields
Certain fields are blanked in some modes and vis-ible in others. Examples include the sine burst con-trol fields in the lower-central area of the GENER-ATOR panel and the IM-FREQUENCY field imme-diately above the FREQUENCY line of the GENER-ATOR panel. These fields are normally only visiblewhen the relevant mode is enabled. For example,the sine burst control fields become visible whenSINE BURST is selected at the top of the GENER-ATOR panel as WAVEFORM. However, the con-tents of these fields will also become temporarilyvisible when the cursor is placed on them, evenwhen blanked.
GETTING STARTED QUICKLY 6-5

6-6 Audio Precision System One Operator's Manual

7. QUICK REFERENCES
This chapter brings together many key informa-tion items from later chapters of this manual. Fulldescriptions of the information shown here will befound in the sections to which the references aremade.
7.1. Menu System
System One’s system of menus are used princi-pally for computer-intensive activities such as load-ing files from disk to memory, saving files frommemory to disk, linking together tests and other ac-tions into procedures, “connecting” limit, sweep, orequalization files to tests, controlling external de-vices, performing computations on data, etc. Seethe MENUS chapter for more information.
TOPLEVELMENU
SECONDLEVELMENU
THIRDLEVELMENU
RUN PROCEDURETESTGRAPHBAR-GRAPHLOCALREMOTESLAVECALLEXIT
PANEL
LOAD TESTLIMITSWEEPCOMMENTPROCEDUREMACRODATAEQOVERLAYWAVEFORM
TOPLEVELMENU
SECONDLEVELMENU
THIRDLEVELMENU
SAVE TESTLIMITSWEEPCOMMENTPROCEDUREMACRODATAEQOVERLAYWAVEFORM
APPEND TESTDATA
EDIT COMMENTPROCEDUREDATAMACRO
HELP SPECIALOVERLAYEDITORDSP
XDOSDOS
NAMES UPPERLOWERSWEEPGEN-EQERR-FILEOFFTITLERENAMECLEARDELTAPROGRAM
7-1

TOPLEVELMENU
SECONDLEVELMENU
THIRDLEVELMENU
IF ERROR[NOTERROR[ABOVE[BELOW[0[1[2[3[4[5[6[7[8[9[
TOPLEVELMENU
SECONDLEVELMENU
THIRDLEVELMENU
FOURTHLEVELMENU
UTIL RESTOREOUTWAITDELAYBREAKLEARNENDPROMPTMESSAGEGOTOSERIAL-DSP
TRANSMIT
RECEIVEMODE AES-EBU
SPDIFSERIAL
DITHER TRIANGULARRECTANGULARSHAPEDOFF
FEED
QUIT
COMP NORMALIZEINVERTSMOOTHLINEAR-ITYCENTERDELTA2-SIGMAEX-CHANGE
: (labelname)
7-2 Audio Precision System One Operator's Manual

7.2. Generator Panel
System One’s (analog) generator is controlledfrom this panel. The available choices for the vari-ous selectable multiple-choice fields are shown in“exploded” form. In addition, direct numeric entryof the desired value can be made into the generatorFREQUENCY and AMPLITUDE fields.
A number of the fields are inter-dependent. Forexample, the choices of waveform modifier (Normalvs Burst, etc.; 4:1 vs 1:1; White vs Pink, etc.) de-pend upon which waveform has been selected. TheBurst On, Burst Interval, and Burst Low Lvl fieldsall appear only when Sine Burst is selected, andsome of those fields disappear when Sine Trig orSine Gate are selected.
For more information, see the GENERATORchapter beginning on page 9-1.
Figure 7-3 GENERATOR Panel
QUICK REFERENCES 7-3

7.3. Analyzer Panel
System One’s (analog) analyzer is controlledfrom this panel, and real-time results are displayedon the panel. The available choices for the variousselectable multiple-choice fields are shown in “ex-ploded” form.
The units for the Reading meter depend uponwhich function is selected on the top (Measure) line.Reading meter units are further sub-divided into rela-tive units (%, dB, X/Y, and PPM) versus absoluteunits such as Volts, dBm, etc.
For more information, see the ANALYZER chap-ter starting on page 10-1.
Figure 7-4 Analyzer Panel
7-4 Audio Precision System One Operator's Manual

7.4. Sweep (F9) Definitions Panel
This panel determines which stimulus parameterwill be swept (stepped) during a test as the inde-pendent variable, also forming the horizontal axiscalibration. It determines which one or two meas-ured values will be graphed as dependent variablesagainst that independent variable, along with selec-tion of displayed units and graphic coordinates. TheSWEEP (F9) DEFINITIONS panel also permits dis-playing two measured parameters versus one an-other in X-Y fashion, automatically testing bothchannels of a stereo or two channel system, scan-ning across channels of the SWR-122 family ofswitchers, plotting measured data versus time inchart recorder fashion, and “nesting” one inde-pendent variable sweep inside another (such as anamplitude sweep inside a frequency sweep). See theSWEEP (F9) DEFINITIONS (Chapter 11) for moreinformation.
The choices shown in “exploded” form in Figure7-5 may depend upon other selections. For exam-ple, the “RDNG LEVEL FREQ PHASE NONE”measurement parameter choices are available onlywhen the ANLR (analyzer) module is selected atDATA-1 or DATA-2. Selecting the GEN, DCX, orDSP modules instead of ANLR will cause a differ-ent set of measurement parameters to become avail-able. In turn, the units of measurement dependupon the parameter selected. DSP parameters andunits depend upon the particular DSP programwhich has been down-loaded to the DSP module. Ifno DSP program has been loaded, no parameters orunits will be displayed.
DATA-1; Solid(green) line on graph,2nd column withtabular display
DATA-2; dashed(yellow) line ongraph, 3rd columnin tabular display
SOURCE-1; sweptindependentvariable, horizontalaxis calibration
DATA-2 can be changed toHOR-AXIS to plot DATA-1 vsDATA-2 with no SOURCE-1calibration, STEREO toautomatically graph both channels,or SOURCE-2 to permit twoindependent variables to be sweptwithin one test (“nested sweep”)
Figure 7-5 Sweep (F9) Definitions Panel
QUICK REFERENCES 7-5

7.5. Software Start-Up Options
By including one or more “command line op-tions” following the characters “S1" when SystemOne software is started from the DOS prompt, manyvariations in the operation of the software can be ob-tained. These options are summarized below. Ashort listing of the available options can be obtainedfrom DOS by typing S1 /? <Enter> or S1 /HELP<Enter>.
7.5.1. Print-out Options
/F [#,#] controls printer formatting (first digit)and single versus bi-directional printing (seconddigit). Normal formatting has graphs horizontallycentered on the page, with multiple graphs per pageif the vertical height plus number of lines in theComments editor permits. Disabling formattingcauses no line feeds or form feeds after the last lineof the graph of comments. A first digit of 0 dis-ables formatting; a first digit of 1 (or not using the/F option at all) provides normal formatting. Thesecond digit must be 0 for one-directional printingand 1 for bi-directional printing. Thus, /F0,1 pro-duces unformatted graphs via bi-directional printingand /F0,0 disables formatting and causes uni-direc-tional printing. See the table on page 15-3 for amore complete description of the print formatting.
/P# [,#,#] describes the printer mode to be usedand specifies the height and width, in inches, of theresulting graph. See the table on page 15-5 for de-tailed information.
/G enables graphics reporting mode, in which agraphics display file (.GDL extension) can be savedvia the SAVE GRAPHICS menu command. Thisfile can then be used later by the plotter driver pro-grams PLOT.EXE or POST.EXE. See the Plottersection on page 15-7 of the HARD COPY PRINT-OUT chapter for more details.
7.5.2. Memory Control Options
/R specifies the amount of memory, in kbytes,which S1.EXE will set aside for DOS actions andprograms running under the XDOS or DOS exitsfrom S1. See page 28-6 for more information.
/B#,#,#,#,#,# specifies the size of the six bufferswhich have the principal variable effect on theamount of memory occupied by S1.EXE. See page28-8 for more information.
/8 disables the Image Store and sweep-erase-re-peat capabilities normally invoked by <Alt><F8>,<F8>, and <Alt><F9>, so that the 16k (CGA) to38k (VGA) required by those functions is availablefor other purposes. See page 28-6 for details onhow to use this option.
/&filename sets the memory swap mode andspecifies the disk filename into which the contentsof the six buffers will be swapped at XDOS andDOS exits, leaving approximately 220 kbytes ofmemory then available for programs running fromDOS. See page 28-9 for data.
7.5.3. Display Related
When S1.EXE software is started, it is normallyable to determine what type of display system is pre-sent in the computer and support it accordingly. Incertain cases (such as a CGA display system with amonochrome monitor), this automatic display modeselection may not work. The /D# option can beused to select the appropriate mode. See the tableon page 5-7 for complete information.
When overlay files (.OVL) are used instead oftest files (.TST) in order to retain some panel set-tings from the previous test, the video appearance ofthe “punched out” fields may be controlled by the/V# option. See the figure on page 25-11 of thePROCEDURES chapter for information.
7-6 Audio Precision System One Operator's Manual

7.5.4. Miscellaneous
When S1.EXE software operation is terminatedby the QUIT command, it automatically saves thecurrent test, procedure, and macro files asAPLAST$$.TST, APLAST$$.PRO, andAPLAST$$.MAC. If System One software is thenlater started with the /L (for last) option, it will loadthose files. See page 28-4 for information.
The /I# option may be used at software startup totell the system at which address the PCI-2 interfacecard is to be found, or that there is no interface cardinstalled. See page 28-5 for information.
An optional version of System One has been de-signed for German and Nordic countries with aslightly different set of generator source impedancesand analyzer input impedances than used in most ofthe rest of the world. When this special hardware
version is in use, the software should be started withthe /E option to show the proper selections on thepanels and to compute the proper dBm values.
For more information on command line options,see the Command Line Options section of the CRE-ATING YOUR CUSTOM SOFTWARE START-UP PROCESS Chapter starting on page 22-12.
7.6. Function Keys
Many of the most-used operations of System Onesoftware are controlled by the function keys <F1>through <F10>. Figure 7-6 summarizes the func-tions available; this screen can be displayed fromwithin the software at any time via <Esc> HELPSPECIAL.
Figure 7-6 Description of Function Key Operation (HELP SPECIAL screen)
QUICK REFERENCES 7-7

Figure 7-7 LOAD and SAVE Panel
Figure 7-8 HELP Panel
7-8 Audio Precision System One Operator's Manual

7.7. General Information Screens
Key information about the current status of Sys-tem One is displayed on three screens. Each ofthese is displayed when one of the following first-level (COMMAND) menu choices is made—LOAD(or SAVE), HELP, and NAMES.
The LOAD and SAVE screen, illustrated inFigure 7-7, displays the names of the most recentlyhandled files that are manipulated with the LOADand SAVE menu commands. These file types in-clude procedure (.PRO), comments or text (.TXT),ASCII data (.DAT), and DCX-127 macro files(.MAC) The LOAD and SAVE screens also showthe name of the file currently in main memorywhich may be a test file (.TST), acceptance limit file(.LIM), generator step table file (.SWP), generatorequalization file (.EQ), or an overlay file (.OVL).This file in main memory is the file whose set-uppanels show in PANEL mode, whose data contentswill be graphed if <F7> is pressed, which will take
real-time data if <F9> is pressed, and whose inter-nally-stored comments will be displayed in EDITCOMMENTS mode.
The HELP menu selection, Figure 7-8, displaysthe size of the six internal buffers for temporary stor-age of test data, equalization, limit, and sweep filedata points, and for the four editors (Data, Proce-dure, Comment, and Macro) plus the amount ofeach buffer actually in current use. The HELPscreen also shows memory available for DOS ac-tions or programs which run from DOS whileS1.EXE software stays in memory during an XDOSor DOS temporary exit. The HELP screen givesdata on the interface card type and address, displaysystem type for which the software is installed,printer status, graphic print screen ( <*> ) resolu-tion, orientation, and size, and a “roll call” of the in-strument modules connected. Note that the HELPscreen only interrogates the Audio Precision Inter-face Bus. With an “S” version instrument operatingover RS-232, the HELP screen will show all units“not connected”. The HELP screen also shows
Figure 7-9 NAMES Panel
QUICK REFERENCES 7-9

what microprocessor type is used as the main CPU(8088, 8086, 80286, etc.) and whether there is amath co-processor installed.
The NAMES screen, shown in Figure 7-9, dis-plays the names of the files which may be attachedto the file in main memory by use of the variousNAMES commands. These include the DELTAfile, upper and lower comparison limits files, gener-ator sweep (step table) file and equalization file, er-ror reporting file, and DSP program file and version.The NAMES panel, like the LOAD and SAVEpanel, also displays the name of the file currently inmain memory.
7.8. Procedures
A “procedure” (.PRO file) is a technique used inS1.EXE software to more-fully automate a completetesting process. Procedures can automatically loadand execute tests, compare results to pre-defined lim-its, control external devices, wait for external ac-tions to be completed, prompt the operator to takeactions, branch to different portions or to sub-proce-dures upon failure (or passing) of test limits or uponoperator input, save results to disk, print results, etc.See the Procedures chapter beginning on page 25-1for full information on procedures.
Procedures may be created in a “keystroke learnmode” initiated by the UTIL LEARN command, ordirectly in an ASCII text editor or in EDIT PROCE-
Procedure ManualListing TextAppearance Representation Function——————— —————————-—————
/F10 <F10> Pause/A9 <Alt><F9> Run sweep, erase repeating test/C9 <Ctrl><F9> Run test without erasing previous dat/F9 <F9> Run test/S9 <Shift><F9> Run external test, terminate on reversal to generator panel frequency/A8 <Alt><F8> Store graphic image of screen/F8 <F8> Display stored graphic image/A7 <Alt><F7> Graph limits/F7 <F7> Re-graph data in memory/F6 <F6> Re-transform (DSP only)/A6 <Alt><F6> Re-send data to PC without new transform (DSP)/F4 <F4> Set analyzer dBr reference/A4 <Alt><F4> Set analyzer relative frequency reference/F3 <F3> Set generator dBr reference/A3 <Alt><F3> Set generator relative frequency reference/C3 <Ctrl><F3> Initiate one REGULATION cycle/F2 <F2> Display bargraph/A1 <Alt><F1> Abort procedure without turning generator off/F1 <F1> Turn off generator and abort procedure/E <Esc> Go to command menu/R <Enter>* <*> Dump screen to printer
Figure 7-10 Special Keystroke Appearance in Procedure Listings
7-10 Audio Precision System One Operator's Manual

Figure 7-11 Screen Appearance of Keystrokes Which May Be Used in Procedures and Macros
Figure 7-12 Two-Character Codes to Jump to Panel Fields
QUICK REFERENCES 7-11

DURE mode. See Figure 7-10 for a listing of the re-lationship between common S1.EXE commands asrepresented in procedures versus the text of this man-ual, plus short definitions of their function.
Certain keystrokes useful in procedures cannot bedirectly entered in EDIT PROCEDURE mode. Insome text editors, they may be entered by use of the<Alt> key plus the numeric keypad. Alternately,they may be entered during UTIL LEARN modeand then “cut and spliced” with the <F6> and <F5>keys to the desired location. See Figure 7-11 for apresentation of the appearance of these keys inEDIT PROCEDURE mode and their function.
During procedures, it is sometimes necessary forpanel conditions to be changed during the course ofa test or between tests. A set of two-character com-mands has been created which jump the panel cursorto many of the major panel fields to simplify thesepanel moves. They may also be a convenience dur-ing normal test setup and operation of System One.See Figure 7-12 for a listing of these codes.
7-12 Audio Precision System One Operator's Manual

8. UNITS
The GENERATOR Panel and the ANALYZERPanel are both capable of expressing amplitude in anumber of different units. Generator amplitudeunits include Volts rms, Volts peak-to-peak, dBm,dBu, dBV, dBr, and Watts. The measurement mod-ule units include the same decibel and Watts unitsas the generator but do not specify rms for Volts,since rms is only one of four detector response typesthat the System One user may select. Unique to themeasurement module are several relative amplitudeunits for two-channel measurements with A-versionhardware (dB, X/Y, %, PPM).
The sine burst mode of the BUR-GEN module in-troduces several units for control of the burst pa-rameters. These provide the ability to define tonebursts in terms of number of cycles, time, percentduty factor, and repetition rate.
The frequency measured by the analyzer modulecan be expressed in many units relative to a fre-quency reference. Phase can be expressed in de-grees or radians, and four types of degree units maybe selected to provide the optimum display.
8.1. Amplitude Units
Vrms (generator only)
This is the root-mean-square open-circuit value(emf) to which the generator sinewave is set. As anopen circuit value, it is independent of generatorsource impedance and does not use the load resis-tance information. When complex waveforms, suchas the intermodulation distortion, squarewave, andnoise waveforms are selected, generator calibrationis in terms of the rms value of a single sinewavewhich would have the same peak-to-peak value asthe selected complex waveform.
When a voltage unit is used, the GENERATORAMPLITUDE field directly specifies the generatoropen-circuit voltage (sometimes called emf, or elec-
tro-motive force). Unless the external load imped-ance is infinite, the actual voltage delivered to theload will be less than this open circuit voltage sincethe selected generator source impedance and the ex-ternal load impedance act as a voltage divider. Forexample, if the 50 Ohm source impedance is in useand the generator output is connected to the analyzerinput with the analyzer 100 kilohm input termina-tion selected, the voltage across the load will be
100,000100,000+ 50
= 99.95%
of the open circuit voltage. With the 50 Ohmsource impedance in use, the voltage across the loadwill differ from the open-circuit voltage by no morethan 0.1 dB if the load is approximately 5,000 Ohmsor higher. For a 10,000 Ohm load (typical of bridg-ing inputs on many professional audio devices), theloading of the 50 Ohm source will produce approxi-mately an 0.05 dB error.
Vpp (generator only)
This is the peak-to-peak open-circuit value (emf)to which the generator is set. As an open circuitvalue, it is independent of generator source imped-ance and does not use the load resistance informa-tion.
Volts (analyzer)
The principal or READING voltmeter (in the ana-lyzer module) has five selectable detectors: true rms,average responding rms calibrated, quasi-peak (Q-Pk) complying with CCIR Recommendation 468-3,true peak, and scaled true peak (S-Pk). The S-Pk de-tector is the same as the true peak detector but witha 0.707 (-3.01 dB) scale factor to read sinewaveequivalent peak. The values displayed will thusvary with the detector selected and with the signalwaveform being measured. When the distortionmeasurement module is also present, a second volt-meter called LEVEL is added which continuallymonitors the input signal before any filtering; theLEVEL voltmeter detector is true rms.
8-1

dBm (generator and analyzer)
dBm is decibels referred to a power level of onemilliwatt in the selected impedance.
Generator dBm
The power units available for the generator aredBm & Watts; Watts units are rarely used as thegenerator amplitude unit. Neither the generator norcomputer can directly measure or control generatoroutput power, output current, or external load resis-tance. The computer and software have control onlyof generator open-circuit voltage. Therefore, in or-der for a value in dBm or Watts entered by the userinto the generator AMPLITUDE field to be valid,the operator must first determine the value of the ex-ternal load and enter that value into the W/dBmREF field near the bottom of the generator panel.The computer, knowing the value of source imped-ance presently selected on the generator, then usesthe W/dBm REF field value to compute what theopen-circuit voltage must be set to in order to pro-duce a voltage across the load resulting in the speci-fied power in the load. If the source impedance ischanged to another available value, the computer re-calculates the equation and re-sets the open-circuitvoltage so as to maintain the specified power in theload. For example, setting 0 dBm into a 600 Ohmload (0.7746 Volts across the load) from a 50 Ohmsource load will produce a generator open-circuitvoltage of
0.839V = 0.7746V600+ 50
600Changing the source impedance to 600 Ohms causesthe open-circuit voltage to go to
1.549V = 0.7746V600+ 600
600.
In dBm mode for generator AMPLITUDE, thecomputer sofware assumes that both generator out-put connectors A and B are loaded with the externalvalue specified in the W/dBm REF field if the A&Bor A&-B generator output selections are made. It as-sumes only one output is loaded if either A or B out-put selections are made. Violating these assump-tions will result in an amplitude calibraton error.
Note that the GEN-MONITOR internal connec-tion from generator to analyzer only loads the gener-ator output with 100,000 Ohms. The selectable100k/600/150 Ohm input terminations on the ana-lyzer affect only the front-panel input connectors butnot the GEN-MONITOR path.
Analyzer dBm
To compute measured power, the system mustknow the value of resistance across which the ana-lyzer is measuring. The user must enter this valueinto the “dBm/W REF” field near the bottom of theANALYZER panel. The analyzer then measuresthe voltage, performs a power conversion (square ofthe voltage, divided by the resistance) and convertsthe result into dB relative to one milliwatt.
dBu (generator and analyzer)
dBu is decibels referred to a voltage of 0.7746Volts; it does not imply any value of circuit imped-ance or power. The value of 0.7746 volts is the volt-age across a 600 ohm resistor when exactly one mil-liwatt is being dissipated in the resistor. Thus, dBuas measured by the analyzer is numerically equal todBm when measuring in a 600 ohm circuit.Virtu-ally all audio voltmeters and distortion analyzersused throughout the history of audio measure-ments (including those still being manufactured to-day) actually measure dBu even though their modeselection and meter scale indication may indicatedBm, since they have no knowledge of the circuitimpedance and thus the actual power.On the gen-erator, dBu is an open circuit value, is independentof generator source impedance, and does not use theload resistance information.
Modern broadcasting and pro audio equipmentnormally has output impedances much lower than in-put impedances. Output impedance values fromzero up to 50 Ohms are typical, and input imped-ances of 10 kilohms are typical. Such equipment,connected together, transfers negligible power dueto the large impedance mis-match. However, nearlyall the source voltage is transferred. As noted ear-lier, a 10 kilohm load reduces the open-circuit volt-age from a 50 Ohm source by only 0.5%, or 0.05dB. Thus, modern systems typically operate on a
8-2 Audio Precision System One Operator's Manual

voltage transfer basis and the dBm, as a power unit,is not appropriate. The proper unit for voltage-based systems is the dBu. Older audio meters cali-brated in “dBm” are really dBu meters. A good gen-eral rule when working with modern audio equip-ment, unless you know it to be terminated in 600Ohms, is to interpret the manufacturer’s “dBm” as“dBu”. Even if in doubt about the actual termina-tion value, you won’t go very far astray in usingdBu with the System One generator’s 50 Ohmssource; 600 Ohms loads a 50 Ohm source by about0.7 dB.
dBV (generator and analyzer)
dBV is decibels referred to a voltage of 1.0000Volts. On the generator, it is an open circuit valueindependent of generator source impedance anddoes not use the load resistance information.
dBr Relative dB (generator and analyzer)
Both the generator and the analyzer offer dBr asone of the unit choices. dBr stands for dB relative;the zero dB reference value for the dBr unit on eachpanel is the “dBr REF” field near the bottom of thepanel.
While in panel mode, the dBr REF value may bechanged in three fashions; one is to move the cursorto the dBr REF field and enter a new number (andunits, if desired) from the keyboard. A secondmethod, if it is desired to store the present value ofgenerator amplitude as the new generator dBr REF,is to press the <F3> function key. Similarly, the am-plitude presently being measured by the analyzercan be stored as the analyzer dBr reference by press-ing the <F4> function key. A third technique is tomove the cursor to the generator or analyzer dBrREF field, as desired, and press either the <+> or<Del> key. If the amplitude is displayed in dBr, thereading will go to 0.00 dB.
This “remember the reference” capability is par-ticularly useful on the analyzer to preserve the pre-sent reading as the reference for a frequency re-sponse, signal-to-noise ratio, common-mode rejec-tion ratio, or gain measurement. On the generator, itmay be used after experimentally increasing the gen-
erator amplitude for some measured phenomenon(for example, onset of clipping or 3% distortionpoint of a tape recorder). It is then simple to makesucceeding measurements at values such as -3 dB or-20 dB from that level.
Note that the power-up default value of the dBrREF on both generator and analyzer is 387.3 mil-livolts, the voltage across a 150 Ohm resistor whenone milliwatt is being dissipated. Thus, dBr is equalto dBm in 150 Ohms when the default dBr REF isused and System One is connected to a 150 Ohm cir-cuit.
The dBr unit may also be selected for distortionmeasurements, as one of the absolute units. Two ex-ample applications are in digital systems. In suchsystems, the theoretical minimum distortion andnoise value is known or may be computed fromknowledge of the number of bits and full-scale out-put level. If this value is entered for the dBr REFand the READING unit in THD+N mode is selectedas dBr, the display will be in terms of dB of “excessdistortion and noise” above the theoretical floor. Itis also possible to enter the full-scale output level asthe dBr REF (for example, by pressing <F4> whileplaying a 0 dB track on a compact test disc) and dis-play quantization distortion in dB below full-scaleoutput.
dB (analyzer only)
The ratio unit dB is available in distortion-meas-urement modes (THD+N, SMPTE, CCIF, DIM) andin the CROSSTALK and 2-CHANNEL modes of A-version hardware. In THD+N mode, the dB unit ex-presses the value of the distortion products relativeto the distorted input signal amplitude. In SMPTEand DIM modes, dB expresses distortion relative tothe amplitude of the high-frequency tone. In CCIFmode, dB expresses distortion relative to the ampli-tude of either of the two close-spaced tones.
With A-version hardware in CROSSTALKmode, dB expresses the signal in the non-drivenchannel relative to the currently-measured signal am-plitude in the driven channel. In 2-CHANNEL
UNITS 8-3

mode, the dB unit expresses the ratio of the signalin the channel selected at the top of the ANA-LYZER panel to the signal in the alternate channel.
PPM (analyzer only)
The ratio unit PPM (parts per million) is avail-able in distortion functions plus 2-CHANNEL andCROSSTALK functions of A-version hardware. Itis similar to %, dB, and X/Y, but expresses the se-lected quantity in parts per million of the referencequantity. For example, 0.0037% equals 37 ppm.
X/Y (analyzer only)
The ratio unit X/Y (dimensionless) is available inall distortion functions plus in the 2-CHANNEL andCROSSTALK functions of A-version hardware. Inthe distortion functions, it is similar to % and dBbut expresses the distortion as a ratio of amplitudes.In 2-CHANNEL and CROSSTALK functions, it ex-presses the ratio of amplitudes of the selected chan-nel to the alternate channel. For example, 3%equals a ratio of 0.03.
W (generator and analyzer)
The W (Watts) units in the generator AMPLI-TUDE field and in the analyzer units fields, just asthe dBm units, require that System One knows whatexternal resistance it is connected across. ThedBm/W REF fields at the bottom of both GENER-ATOR and ANALYZER panels permit you to enterany numeric value of external resistance. Operationof generator and analyzer in Watts units is identicalto that described above under dBm except that theresult of the power computation is expressed inWatts with no decibel conversion made.
8.2. Relative vs Absolute DistortionUnits
THD+N may be expressed in either relative (%,dB, PPM, X/Y) or absolute units. The relative unitsexpress the amplitude of the distortion products andnoise with reference to the input (distorted) signal.
The absolute units (Volts, dBm, etc.) directly ex-press the absolute amplitude of the distortion prod-ucts.
While either relative or absolute units may befreely selected on the ANALYZER panel, thechoice of units on the SWEEP (F9) DEFINITIONpanel is constrained by the data structure of SystemOne’s files. If a relative unit is selected on theANALYZER panel, only relative units may be se-lected on the SWEEP panel and ultimately saved.In this case, the displayed and saved data resultsfrom computations involving two measurements:signal amplitude from the LEVEL voltmeter and dis-tortion product measurements following the notchfilter, from the READING voltmeter. It is thus notpossible to change to absolute units and re-displaythe same test data following a test, since only thecomputed ratios were saved. Similarly,if an abso-lute unit is selected on the ANALYZER panel, onlyabsolute units may be selected on the SWEEPpanel. It is then not possible to change to a relativeunit, since the signal amplitude was not measuredand saved.
Only relative units (%, dB, PPM, X/Y) are avail-able in the three intermodulation distortion modes.Absolute units are not meaningful due to the defini-tions of the forms of intermodulation distortion.
8.3. Relative Frequency Units
A reference frequency may be entered into theFreq REF field near the bottoms of the GENER-ATOR and ANALYZER panels. This reference fre-quency may be typed in from the keyboard. The pre-sent generator frequency may be automatically trans-ferred into the generator reference frequency fieldby the <Alt><F3> keystroke. On the analyzer, thefrequency presently being measured by the fre-quency counter may be placed into the field bypressing <Alt><F4>. In addition to the absolute fre-quency units of Hz, a number of units relative tothis reference frequency may be selected for theFREQUENCY setting field of the GENERATORpanel or the FREQUENCY display on the ANA-
8-4 Audio Precision System One Operator's Manual

LYZER panel, and as the displayed units for graphsand tables defined on the SWEEP (F9) DEFINI-TION panel.
∆ %
This unit causes the difference between the set-ting or measured frequency and the reference fre-quency to be displayed as percentage deviation fromthe reference frequency. For example, with a refer-ence frequency of 3.15 kHz (common for tape speedand wow and flutter measurements), a measured fre-quency of 3.1185 kHz will display as -1.0% (speed1% slow) when delta % units are selected.
∆ Hz
This unit displays the difference between the set-ting or measured frequency and the reference fre-quency. For example, with a reference frequency of1.000 kHz, a measured frequency of 1.010 kHz willdisplay as +10 Hz and a measured frequency of 997Hz will display as -3 Hz.
∆ PPM
This unit displays the difference between the set-ting or measured frequency and the reference fre-quency to be displayed as deviation from the refer-ence frequency in parts per million. For example,with a reference frequency of 1.000 kHz, a meas-ured frequency of 1.00001 kHz will display as +10PPM (1 PPM equals 0.0001%).
%Hz
This unit displays the setting or measured fre-quency as a percentage of the reference frequency.For example, with a reference frequency of 1.000kHz, a measured frequency of 500 Hz will displayas 50% and a measured frequency of 1.100 kHz willdisplay as 110%.
OCTS
This unit displays the difference between the set-ting or measured frequency and the reference fre-quency in octaves, where an octave is a two-to-oneratio of frequencies. For example, with a reference
frequency of 1.000 kHz, a measured frequency of500 Hz will display as -1.000 (one octave below thereference) and a measured frequency of 4000 Hzwill display as +2.000 (two octaves above the refer-ence).
DECS
This unit displays the difference between the set-ting or measured frequency and the reference fre-quency in decades, where a decade is a ten-to-one ra-tio of frequencies. For example, with a referencefrequency of 1.000 kHz, a measured frequency of100 Hz will display as -1.000 (one decade below thereference) and a measured frequency of 100 kHzwill display as +2.000 (two decades above the refer-ence).
CENTS
This unit displays the difference between the set-ting or measured frequency and the reference fre-quency in cents, where a cent is 1/100 of a half-stepon a musical scale. For example, if the reference fre-quency is 440 Hz (the note A above middle C on apiano), a measured frequency of 440.262 Hz will dis-play as +1.0 CENTS.
F/R
This unit displays the ratio (unitless) of the set-ting or measured frequency to the reference fre-quency.
8.4. Phase and Polarity Units
Phase may be displayed on the ANALYZERpanel, on bargraphs, or on line graphs in four units;deg, deg1, deg2, deg3, and radians. Deg, deg1,deg2, and deg3 are all degrees, but with differentfull scale range characteristics. Polarity testing re-sults are also displayed on the PHASE line with thePOL unit.
UNITS 8-5

deg
Degrees are displayed with the panel or bargraphdisplay range being automatically selected as either+/-180 degrees or 0 to 360 degrees, depending onthe value being displayed. When sweeping fre-quency and displaying on a line graph, integral mul-tiples of 360 degrees are added or subtracted as nec-essary to make each new measurement plot closestto the preceding plotted point. This mode producescontinuous graphs even over thousands of degrees,rather than the abrupt transitions between maximumand minimum typical of most graphic plots of phase.
deg1
Degrees are displayed on the panel or bargraph orplotted on line graphs with a fixed +/-180 degreerange. Values exceeding the end of the range willmake an abrupt transition to the opposite end of therange. Readings at 180 degrees will be inaccurateand unstable.
deg2
Degrees are displayed on the panel or bargraph orplotted on line graphs with a fixed +270/-90 degreerange. Values exceeding the end of the range willmake an abrupt transition to the opposite end of therange. Readings at +270 or -90 degrees will be inac-curate and unstable.
deg3
Degrees are displayed on a fixed 0 to +360 de-gree range. Values exceeding the end of the rangewill make an abrupt transition to the opposite end ofthe range. Readings at 360 degrees or 0 degreeswill be unstable.
POL
The POL unit indicates an in-phase condition bydisplaying a 0 and an out-of-phase condition by dis-playing +180. The signal required for polarity test-ing is a low-duty-cycle sinewave burst from theBUR-GEN module.
8.5. Sine Burst Units
When the BUR-GEN module is installed on thegenerator and SINE BURST, SINE TRIG, or SINEGATE selected as the waveform, several units areavailable to control the duration of a burst and theinterval between the beginning of successive bursts.CYCLES refers to complete cycles of the generatorfrequency. ThesecBunit refers to seconds of burstduration. %ON is the duty factor of the burst:burst duration divided by burst period.Bps isbursts per second, the repetition rate of the train ofbursts. See the BUR-GEN chapter for more detailson these units and their usage.
8.6. DSP Units
Units of display with the DSP module are totallydependent upon the particular DSP program in use.See the documentation provided with each DSP pro-gram for an explanation of these units.
8-6 Audio Precision System One Operator's Manual

9. GENERATOR PANEL
See the Generator and Analyzer Hardware chap-ter beginning on page 32-1 for description and ablock diagram of the analog generator. The GEN-ERATOR panel is reproduced in Figure 9-1. Thefields can be grouped into five functional areas:waveform selection, amplitude control, frequencycontrol, output configuration control, and (if theBUR-GEN module is present) tone burst control.
9.1. Waveform Selection
The WAVEFORM line, consisting of the mainwaveform field and, for certain waveforms, thewaveform modifier field, permits selection of thegenerator output waveform. The waveform field se-lections are SINE, EQSINE, SMPTE, CCIF, DIM,
SQUARE, PSEUDO, and RANDOM. EQSINE is asinewave whose amplitude is adjusted as a functionof the selected frequency according to an attachedequalization file. See the EQUALIZATION chapter(page 23-1) for a complete discussion of generatorequalization curve capability. SMPTE, CCIF, andDIM are all intermodulation distortion test signalsavailable if the intermodulation signal generator op-tion has been installed onto the generator module.See the INTERMODULATION DISTORTIONchapter (page 16-1) for details. SQUARE,PSEUDO, RANDOM, and the BURST, TRIG, andGATE waveform modifier selections of the SINEwaveform are signals available if the BUR-GEN op-tion has been installed onto the generator module.See the BURST-SQUAREWAVE-NOISE GENER-ATOR chapter (page 20-1) for full details. The
Figure 9-1 GENERATOR Panel
9-1

DGEN selection, of the DSP module is installed andif the currently-loaded .DSP program includes signalgeneration capability, permits the output of the DSPgenerator to be routed via D/A converter throughthe analog generator power amplifier, transformer,and attenuators.
The table below shows the waveform modifier se-lections available under each of the waveforms.
WAVE-FORM
WAVEFORMMODIFIER
COMMENTS
SINE NORMAL STANDARDBURST BUR OPTTRIG BUR OPTGATE BUR OPT
EQSINE STANDARDSMPTE 4:1 IMD OPT
1:1 IMD OPTCCIF IMD OPTDIM 30 kBW IMD OPT
100 kBW IMD OPTB IMD OPT
SQUARE BUR OPTPSEUDO WHITE BUR OPT
PINK BUR OPTBPASS BUR OPTEQBPN BUR OPT
RANDOM WHITE BUR OPTPINK BUR OPTBPASS BUR OPTEQBPN BUR OPT
DGEN DSP OPT
9.2. Amplitude Control
The amplitude control and indication fields con-sist of:
• the AMPLITUDE line (numeric field andunits)
• the POST-EQ line (numeric field; same unitsas AMPLITUDE)
• the AMPSTEP line (numeric field and addi-tive/multiplicative choice)
• the dBr REF line (numeric entry or capture ofpresent value by <F3> function key or<Del>/<+> key, and units)
• the dBm/W REF field (numeric entry).
The AMPLITUDE numeric entry field can eitherhave digits entered directly from the keyboard or itcan be incremented/decremented by use of the AMP-STEP value and the <+> and <Del> keys. In directdigit entry, System One understands the commonprefixes of k for kilo, m for milli, u for micro, and nfor nano. It will also accept entries in scientific no-tation, such as 1E1 for 10 volts. If an amplitude out-side the range of the generator is entered, the systemwill sound a warning signal and display a “Conflictwith Maximum (or Minimum) Amplitude” warningat the lower left of the panel. The actual generatoramplitude will remain unchanged.
The amplitude units can be selected by use of the“choice” cursor, controlled by the space bar or <+>and <Del> keys. The <Enter> key then actuallymakes the selection. See the UNITS chapter fordefinitions of the various units available. Whenunits are changed, the generator open-circuit voltagewill not change; open-circuit amplitude will simplybe re-stated in the various units.
The POST-EQ field is visible only when EQS-INE waveform is selected. POST-EQ units are al-ways the same as AMPLITUDE units. POST-EQ isa display-only field. It shows the actual amplitudethe generator is asked to furnish, which is a functionof both the value set in the AMPLITUDE field andof the value of an attached equalization file at theparticular frequency at which the generator is set. Ifno equalization file is attached, a value of 1.00 is as-sumed for equalization at all frequencies. See theEQUALIZATION chapter.
AMPSTEP is used to select the size of changewhen manually incrementing and decrementing am-plitude with the <+> and <Del> keys in panel or bar-graph mode. Any desired value can be entered intothe AMPSTEP numeric field. If the arithmetic op-erator to the right of the number is +, the <+> and<Del> keys will respectively add or subtract theAMPSTEP numeric value to (from) the AMPLI-
9-2 Audio Precision System One Operator's Manual

TUDE value each time they are operated. This willonly occur while the cursor is located on either theAMPLITUDE numeric field or the AMPSTEP nu-meric field, or during bargraph (F2) mode withGEN AMPL selected as SOURCE-1. The units ofAMPSTEP are always the same as the units selectedfor AMPLITUDE. Thus, an AMPSTEP of 0.20 willproduce 0.2 dB increments if the AMPLITUDEunits are dBm and 200 millivolt increments if theAMPLITUDE units are Volts rms.
If the arithmetic operator is *, the <+> key willmultiply the AMPLITUDE value by the AMPSTEPvalue (and the <Del> key will divide by the AMP-STEP value) each time it is operated while the cur-sor is located on either the AMPLITUDE or AMP-STEP numeric fields. For example, an AMPSTEPof 1.050 * will cause the amplitude to increase to1.05 times its previous value each time the <+> keyis pressed, and to decrease to 0.95238 times(1.0/1.05) the previous value each time the <Del>key is pressed. This permits manually-controlledlogarithmic amplitude sequences if the AMPLI-TUDE units are Vrms or Vpp.
The dBr REF line lets the operator tell the systemwhat value of amplitude to use as the zero dB refer-ence for the generator dBr (dB relative) units. Thepower-up default value of dBr REF is 387.3 mil-livolts, the voltage across a 150 Ohm resistor whenone milliwatt is being dissipated in the resistor.Any new value may be entered into the numericfield from the keyboard, and the units may be se-lected in the usual select and <Enter> fashion.
It is frequently convenient to make the presentvalue of the generator amplitude become the refer-ence value for dBr. The generator amplitude (POST-EQ value if EQSINE mode is in use) can be trans-ferred to the dBr REF field at any time by pressingthe <F3> function key, or by moving the cursor tothe dBr REF numeric field and pressing the <+> or<Del> key. The value transferred will immediatelydisplay in the dBr REF field, and if the AMPLI-TUDE units are dBr the display will be seen to be0.00 dBr.
The dBm/W REF field is used for the operator toinform the system of the value of external load resis-tance connected across the generator output. Anyvalue may be entered from the keyboard. Thisvalue of resistance is then used by the system, alongwith the known value of generator source imped-ance, to compute what value of emf the generatorshould be set to in order to deliver the specifiedvalue of power in dBm or Watts to the load.Whenthe DUA-GEN option is present and both outputsare turned on (A&B or A&-B), the system assumesthat both outputs are loaded with the value of resis-tance shown in the dBm/W REF field.
If either of the power units (dBm or W) is se-lected and a change in generator source impedanceor specified load resistance is then made, the systemwill re-calculate and re-set the generator emf tomaintain the previously-specified power level underthe new conditions.
Since the generator emf range is finite (approxi-mately 10 uV to 26.6 Vrms balanced, 10 uV to 13.3Vrms unbalanced or common mode test configura-tion), not all values of power can be delivered toany arbitrary value of load resistance. An error mes-sage will result if the generator is unable to deliverthe requested power to the specified load from thepresently selected source impedance. The generatorcurrent delivery capability is also finite (rated 115mA peak balanced, 230 mA peak unbalanced). Ifthe system is asked to deliver an amount of powerinto a low load impedance which would exceed thecurrent rating, an overload indication will appear.
9.3. Frequency Control
The frequency control fields consist of:
• the FREQUENCY line
• the FAST/HIGH ACCURACY line
• the FREQSTEP line
• the IM-FREQ line (SMPTE and CCIF modesonly)
• the REFS Freq line.
GENERATOR PANEL 9-3

FREQUENCY may be set and changed by directnumeric entry into the field to the right of the FRE-QUENCY label; the system understands k as kiloand will also accept scientific notation such as 3.5e3for 3500 Hz. Frequency can also be changed in anincrement-decrement fashion by use of theFREQSTEP capability. If a frequency outside therange of the generator is entered, the system willsound a warning signal and display a “Conflict withMaximum (or Minimum) Frequency” warning, leav-ing the actual generator frequency unchanged.
Frequency may be expressed absolutely, in Hzand kHz, or in a number of relative frequency units.The reference value for the relative frequency unitsmay be entered in the REFS Freq field near the bot-tom of the panel. Any value may be typed in, or the<Alt><F3> keystroke may be used to automaticallytransfer the present value from the FREQUENCYfield into the REFS Freq field.
Generator frequency can be controlled in twomodes, each with its own trade-offs. FAST modewill be used for the large majority of audio testing.FAST mode produces worst-case frequency resolu-tion of 0.25% or better and accuracy of 0.5%, whichis adequate for most applications. It yields fre-quency settling times of about 10 milliseconds.HIGH ACCURACY mode includes a two-step fre-quency calibration each time the generator fre-quency is changed, using a quartz-based counter onthe generator module as the calibration source. Theresult is frequency resolution of 0.005% and accu-racy of 0.03%, with a calibration cycle time rangingfrom less than 150 milliseconds at frequenciesabove 50 Hz to about 3/4 second at 10 Hz. Evenwhen FAST mode is selected, the calibration cycleof HIGH-ACCURACY mode may be invoked bypressing the <Enter> key while the cursor is on thefrequency numeric entry field. HIGH-ACCURACYmode cannot pull the generator frequency within the0.03% specification if the generator, in the FASTmode, has drifted outside its rated 0.5% range.
FREQSTEP functions similarly to AMPSTEP.Any value may be entered into the numeric fieldnext to the FREQSTEP label, and either + (additive)or * (multiplicative) may be selected as the arit-hmetic operator in the field to the right of the step
size. The default value (value used when SystemOne software is first loaded) is 1.25992 * (multipli-cative), which is the 1/3 octave multiplier value (dis-play rounds to 1.260). Thus, if the cursor is placedon either the FREQSTEP numeric field or the FRE-QUENCY numeric field, or in bargraph mode, thegenerator frequency will be moved in three logarith-mically equal steps over a 2:1 frequency range (oneoctave) when the <+> key is pressed three times.The <Del> key similarly decreases the frequency insteps. For steps of a constant number of Hz, select+ as the arithmetic operator, enter the step size intothe FREQSTEP numeric field, and use the <+> and<Del> keys. When a relative frequency unit is se-lected at the GENERATOR FREQUENCY field,FREQSTEP will control operation in the units se-lected. Thus, another way to obtain 1/3 octave stepsis to choose OCTS as the unit, .33333 + as theFREQSTEP increment size and arithmetic operator,and use the <+> and <Del> keys.
System One’s intermodulation distortion test sig-nals consist of two frequencies. In the SMPTEmodes (which also generate signals for DIN imd test-ing), the lower-frequency tone is selected via the IM-FREQ line, which will be visible only when theSMPTE or CCIF waveforms are selected. In theCCIF twin-tone mode, the spacing between the twotones is selected on the IM-FREQ line. The <+>and <Del> keys allow selection of any of the avail-able frequencies, or a frequency may be enteredwith the digit keys and the software will select anddisplay the nearest available intermodulation fre-quency. The IM-FREQ line has no effect on theDIM modes, where the squarewave frequency selec-tion is made automatically when DIM 30kBW, DIM100kBW, or DIM B is selected as the waveform.See the INTERMODULATION DISTORTIONchapter beginning on page 16-1 for more details.
9.4. Output Section Control
The output section control area consists of fourfields on the GENERATOR panel:
• channel on/off and phase (OFF, A, B, A&B,A&-B)
9-4 Audio Precision System One Operator's Manual

• output configuration (BALanced, UNBAL-anced, CMTST [common mode test])
• source impedance (600, 150, or 50 Ohms bal-anced/common mode test, 600 or 25 Ohms un-balanced)
• FLOAT/GND selection.
• OFF/A/B/A&B/A&-B
Both outputs may be off (OFF); output A onlymay be selected (A); output B only may be selected(B); both outputs A and B may be on (A&B); orboth A and B may be on, but with output B inverted180 degrees in phase relative to output A (A&-B).
This latter mode is used during testing of multiplexstereo broadcast systems.The OFF condition willproduce lower residual signal and noise at bothoutputs than will be present at the non-selected out-put in either the A mode or B mode.When eitheror both outputs are off or not selected, they are back-terminated in a resistance equal to the selectedsource impedance. This permits noise and crosstalkmeasurements to be made with no necessity of dis-connecting cables or connecting termination resis-tors to the input of the device under test.In bothA&B and A&-B modes with either dBm or Wattsselected as the generator amplitude units, the sys-tem assumes that both outputs are connected toload resistances of the value shown in the dBm/W
Typical15 nF
1/2 Rs
1/2 Rs
CT 2 1
3
GND/FLOAT
COM
-
+
Figure 9-2 Balanced Mode Output Configuration
Typical15 nF
Rs
CT 2 1
3
GND/FLOAT
COM
-
+
Figure 9-3 Unbalanced Mode Output Configuration
GENERATOR PANEL 9-5

REF field. For these reasons, use only the OFF andA modes when the DUA-GEN option is not presentor the second channel is not in use.
9.4.1. Bal/Unbal/Cmtst
Pin 1 of the XLR and the sleeve of the phonejack are connected to chassis ground at all times.
BALanced mode (see Figure 9-2) provides a bal-anced signal from the generator output transformer.Pin 2 of the XLR connector and the (+) banana jackor the tip of the 3-conductor 1/4" phone jack are con-nected to the end of the transformer secondary wind-ing which is in phase with the MONITOR jack onthe generator auxiliary connector panel. Pin 3 of theXLR and the (-) banana jack or the ring of thephone jack connect to the opposite end of the trans-former secondary. The transformer secondary cen-ter-tap connects to the COM banana jack on the gen-erator output connector panel.
UNBALanced mode (Figure 9-3) connects thehigh side of the transformer secondary to pin 2 ofthe XLR and the phone jack tip or (+) banana jack.The transformer secondary low side connects to pin3 of the XLR, the ring of the phone jack or (-) ba-nana jack, and to the COM banana jack. Maximumoutput amplitude in the UNBAL mode is one-halfthe maximum available in BAL mode, but the peakcurrent available is twice that in BAL mode. At gen-
erator frequencies below 20 kHz, the generator maybe used in BALanced mode with one end of the out-put grounded if the highest output levels (above13.3 Volts) are needed in an unbalanced system.
Note that adapter cables from the XLR connec-tors to typical unbalanced connectors such as RCA(Cinch) phono plugs or 1/4" or miniature phoneplugs must be wired from pins 2 and 3 of the XLRconnector. Pin 2 of the XLR must be connected tothe center conductor of the plug and pin 3 of theXLR must be connected to the shell of the phonoplug or sleeve of the phone plug. A separate groundwire from the ground connector on the GENER-ATOR panel to chassis ground on the device undertest is also recommended. Using GROUND modeis likely to add noise through ground loops. When astereo device is to be driven, the A and B channelcables should be twisted together or otherwisetightly dressed together to minimize hum coupling.Hum is a potential problem in this configurationsince a loop exists, created by the fact that the signalcommon of both channels is normally connected to-gether at the device input and also inside the GEN-ERATOR output.
CMTST (common mode test) mode (Figure 9-4)permits the measurement of the common-mode rejec-tion ratio (cmrr) of balanced-input devices withoutany cable changes from the normal connections usedfor all other tests. CMTST mode connects the trans-former secondary high side (in unbalanced configu-
Typical15 nF
1/2 Rs
1/2 Rs
CT 2 1
3
GND/FLOAT
COM
-
+
Figure 9-4 Common Mode Test (CMTST) Configuration
9-6 Audio Precision System One Operator's Manual

ration) to the center-tap of a pair of precisionmatched resistors between pins 2 and 3 (+ and - ba-nana jacks, or tip and ring of the phone jack). Theseries resistance of the pair equals the selected gener-ator source resistance. The transformer low sidemust be connected to ground at signal frequencies;for the majority of common mode testing, this isdone by selecting GND at the FLOAT/GND fieldon the GENERATOR panel. For cases such asmeasuring the cmrr of microphone inputs whichhave a phantom power dc voltage present, it may bepreferable to select FLOAT and to connect a largecapacitor between COMMON and GROUND con-nectors on the generator connector panel. This willprevent current flow from the phantom power sup-ply through the secondary of the generator outputtransformer. The CMTST FLOAT connection couldalso permit the introduction of some other commonmode signal in addition to the generator output, byconnecting the other signal source between gener-ator COMMON and GROUND. Since CMTSTmode uses half the transformer secondary, as doesUNBAL mode, the maximum amplitude available ishalf that available in BAL mode.
9.4.2. 600/150/50
The source impedance selections available fromgenerator are 600 Ohms, 150 Ohms, and 50 Ohmsin BALanced and CMTST modes. In UNBALancedmode, 150 Ohms is not available and the lowest im-pedance selection changes from 50 to 25 Ohms. Ifthe European broadcast option version of hardwarehas been installed and the European mode of thesoftware has been invoked at start-up, the generatorimpedance choices will be 600 Ohms, 200 Ohms,and less than 40 Ohms.
9.4.3. Float/Gnd
FLOAT mode opens all connections from SystemOne’s chassis ground to any point on the generatoroutput transformer secondary. GND mode connectsthe COM banana jack (transformer center tap whenBALanced, transformer low side when UNBAL-anced) to chassis ground through a one ampere fuselocated on the generator module circuit board.
GND mode is not normally recommended whendriving unbalanced devices due to the probability ofground loops. FLOAT mode may be used in con-junction with a separate conductor connected be-tween the generator COMMON connector and aground on the device under test, for optimum noiserejection.
9.5. Tone Burst Control
The tone burst control section of the panel con-sists of the three lines labeled BURST ON, INTER-VAL, and LOW LVL. These lines will not be vis-ible (except by placing the cursor on them) unlessSINE BURST, SINE TRIG, or SINE GATE is se-lected at the WAVEFORM line. SINE TRIG willonly cause the BURST ON and LOW LVL lines toappear; SINE GATE will only cause the LOW LVLline to be visible.
The BURST ON field controls the duration of thehigher-amplitude portion of a repetitive internally-generated tone burst or an externally-triggered burst.The INTERVAL field controls the time from thestart of one burst to the start of the next during inter-nally-generated repetitive burst operation. TheLOW LVL field controls the amount by which thelower amplitude portions (between bursts) will bebelow the amplitude set in the AMPLITUDE fieldnear the top of the panel. The values for each ofthese parameters may be entered and displayed inseveral units.
For more information on tone burst operation, seethe BURST-SQUAREWAVE-NOISE GENER-ATOR chapter starting on page 20-1.
9.6. Interactions
The available range of amplitude (POST-EQ am-plitude in EQSINE mode) and frequency are interde-pendent with one another and with certain parame-ters of the output configuration and the specifiedvalue of load resistance (dBm/W REF). For exam-ple, the maximum value of open-circuit voltage isnot available over the entire frequency range; themaximum open circuit voltage available in UNBAL
GENERATOR PANEL 9-7

or CMTST modes is half that available in BALmode; the maximum amplitude available in square-wave and noise modes is half that in sinewavemodes; the maximum available power (in dBm orWatts units) depends not only on the frequency andbalanced-unbalanced configuration, but on the gener-ator source impedance and the specified load resis-tance.
When making changes to AMPLITUDE, FRE-QUENCY, or one of the interdependent configura-tion or impedance values, you may obtain the “Con-flict with Maximum Amplitude” or “Conflict withMaximum Frequency” warnings. It may be that thecombination of conditions you are attempting toachieve is available, but that you are temporarily re-questing an unavailable combination due to the se-quence in which you are making the changes; a dif-ferent order of change can then achieve your goal.For example, assume that you are operating at 10Vrms at 15 Hz and wish to change to 25 Vrms at 30Hz. Both are available combinations, but if you at-tempt to set 25 Vrms while still at 15 Hz, you willget a warning and no change. Changing the fre-quency first will then permit the amplitude to be in-creased to the desired level.
9-8 Audio Precision System One Operator's Manual

10. ANALYZER PANEL
The ANALYZER panel, reproduced in Figure 10-1, controls the entire audio analyzer (analog meas-urements) section consisting of the LVF Level andFrequency Measurement Module, the PHA-LVFDual Input and Phase Measurement Option (if pre-sent), the DIS Distortion Measurement Module, theIMD-DIS Intermodulation Distortion Analyzer Op-tion (if present), and the W&F-LVF Wow and Flut-ter Analyzer Option (if present). The choices avail-able at each of the multiple-choice fields are alsoshown in the figure.
The analyzer includes four separate and inde-pendent meters. These are the PHASE meter, theFREQUENCY counter, the LEVEL meter, and theREADING meter. Their readings are displayed nearthe top of the ANALYZER panel. The PHASE me-
ter always displays the phase difference between thesignals present at the CHANNEL A and CHANNELB inputs. The FREQUENCY counter always dis-plays the frequency of the signal present at one ofthese inputs. The LEVEL voltmeter always displaysthe amplitude of the signal at one of these inputs.
The READING voltmeter is a flexible, multipur-pose meter which can measure and display in any often different functions if all the available measure-ment options (IMD and W&F) are fitted; see belowfor a description of these ten functions. READINGmeter measurements are affected by choice of detec-tors, filters, and (often) the BP/BR tunable filter.Figure 10-2 shows the selection and display fieldswhich affect only the READING meter measure-ments.
Figure 10-1 Analyzer Panel
10-1

Readings of the PHASE, FREQUENCY, andLEVEL meters are unaffected by any of thesechoices, since they measure signal prior to the cir-cuit location of these filters. Figure 10-3 shows theanalyzer selection fields which affect all meters.These include the channel selection (A vs B) field atthe top of the panel, detector reading rate, and the in-put connector, termination and range control fieldsfor both channels A and B. See the analyzer blockdiagram in the ANALYZER AND GENERATORHARDWARE chapter for an understanding of thecircuit location of these four meters.
10.1. Channel Selection andPrincipal Voltmeter Function
At the top of the panel on the MEASURE line,Channel A or Channel B may be selected if thePHA-LVF option is present. The principal (READ-ING) voltmeter function is also selected on the
MEASURE line from AMPLITUDE, BANDPASS,BANDREJECT, THD+N, SMPTE, CCIF, or DIM,plus CROSSTALK or 2-CHANNEL (serial numbersSYS1-20300 and above only). With System One se-rial numbers below SYS1-20300, only one channelmay be measured at any instant and a dashed linewill be displayed instead of the CROSSTALK and 2-CHANNEL selections. Serial numbered units aboveSYS1-20300 permit amplitude measurements ofboth channels simultaneously in CROSSTALK and2-CHANNEL functions.
• AMPLITUDE is a normal audio voltmetermode.
• BANDPASSuses the tunable filter moduletwo-stage filter in selective bandpass mode;the filter has a bandwidth of approximately1/3 octave at the 3 dB points (Q of approxi-mately 4.3), with skirt rejection slopes of 12dB per octave. Center frequency tuning accu-
Figure 10-2 Analyzer Panel Fields Affecting Onlythe READING Meter
Figure 10-3 Analyzer Panel Fields Which AffectAll Meters
10-2 Audio Precision System One Operator's Manual

racy is 3%. With serial numbers SYS1-20300and above, the BANDPASS filter meets ANSIClass II 1/3 Octave specifications.
• BANDREJECT (notch) mode also uses thetunable two-stage filter, but in bandrejectmode. BANDREJECT differs from THD+Nin servo control of the notch. In THD+Nfunction, servo circuits constantly operate totune the notch frequency for maximum rejec-tion of the signal fundamental frequency. InBANDREJECT mode, servos are disabled andthe notch is tuned to the specified frequencywith 3% accuracy.
• THD+N mode uses the tunable filter moduletwo-stage notch filter, servo-controlled to auto-matically remove the fundamental componentof the input signal so that the remaining har-monics plus noise may be measured. Whenany of the distortion ratio units (X/Y, %, dB,PPM) are used, the measurement of theREADING meter through the notch filter iscompared to the measurement of the LEVELmeter and the resulting computation is dis-played in the READING field.
• SMPTE, CCIF , andDIM modes use theIMD-DIS option to measure intermodulationdistortion products according to the selectedstandard. See the INTERMODULATIONDISTORTION chapter for more details.
• W+F mode, if the wow and flutter option ispresent, measures to the IEC (DIN), NAB,and JIS standards plus wideband scrape fluttermeasurements. See the WOW AND FLUT-TER chapter for more details.
• CROSSTALK function is available only withserial numbers SYS1-20300 and above. Adashed line displays instead of the CROS-STALK function choice if hardware below se-rial SYS1-20300 is connected. CROSSTALKfunction connects the principal voltmeter inbandpass mode to the channel selected at thetop of the panel, to the left of MEASURE,and the LEVEL voltmeter and frequencycounter to the alternate channel. The band-pass filter frequency is steered by the gener-ator in generator-based sweeps and by the
counter in EXTERN sweeps. If a ratio unit(X/Y, %, dB, PPM) is selected, the numberdisplayed on the READING line is the ratioof the selected (non-driven) channel to the al-ternate (driven) channel. If an absolute unit(V, dBm, dBu, dBV, dBr, and W) is selected,the READING field displays the measurementof the selected channel and the LEVEL fielddisplays the measurement of the alternatechannel.
• 2-CHANNEL function is available only withhardware serial numbers SYS1-20300 andabove. A dashed line displays instead of the2-CHANNEL function choice if earlier hard-ware is connected. 2-CHANNEL functionconnects the principal voltmeter in amplitudemode to the channel selected at MEASURE,and the LEVEL voltmeter and frequencycounter to the alternate channel. If one of theratio units (X/Y, %, dB, PPM) is selected onthe READING line, the number displayed onthe READING line is the ratio of the selectedchannel (READING voltmeter) to the alter-nate channel (LEVEL voltmeter). With an ab-solute unit (V, dBm, dBu, dBV, dBr, and W)selected, the READING line displays ampli-tude of the selected channel and the LEVELline displays amplitude of the alternate chan-nel. In bargraph display and 2-CHANNELfunction (non-ratio unit selected at READ-ING), the READING and LEVEL may be se-lected as desired for DATA-1 and DATA-2 toproduce bargraphs of signal amplitude atboth inputs simultaneously.
The measurement in the function selected is dis-played by the bright digits to the right of the READ-ING label, and the units desired may be selected bythe field at the right of the reading. Note that inTHD+N, 2-CHANNEL, and CROSSTALK func-tions, both absolute units (V, dBm, dBu, dBV, dBr,and W) and ratio units (X/Y, %, dB, PPM) are avail-able. The choice of units on the ANALYZER panelconstrains the available unit selections on theSWEEP (F9) DEFINITION panel. Ratio units se-lected on the ANALYZER panel will permit only ra-tio units on the SWEEP (F9) DEFINITION panel;
ANALYZER PANEL 10-3

absolute units on the ANALYZER panel permitonly absolute units on the SWEEP TEST panel.See the UNITS chapter for more details.
10.2. Reading Meter Range Control
The range amplifier of the principal (READING)voltmeter is autoranging when AUTO is selected onthe RANGE line immediately below the MEASUREline, near the top of the ANALYZER panel. Peak-sensitive detectors will automatically select theproper range for maximum resolution, dependingupon the signal amplitude following the tunable fil-ter module. See the analyzer block diagram in theANALYZER AND GENERATOR HARDWAREchapter. For information on how to fix the gain ofthe READING meter range amplifier, see the Rangesection at the end of this chapter.
10.3. Other Measurement Functions
TheLEVEL line displays the data from a secondvoltmeter on the tunable filter module board. Thissecond voltmeter continually monitors the analyzersignal input, prior to any LF filters, HF filters, or op-tional FILTERS. It always uses true rms detection.Units are selected in the field to the right of its datadisplay. The LEVEL voltmeter lacks the full-rangesensitivity of the AMPLITUDE function of the mainvoltmeter, but has somewhat wider bandwidth. Atsignal amplitudes below approximately 10 mV theLEVEL voltmeter will begin to lose high-frequencyresponse. At amplitudes below approximately 1mV, its resolution will become a limiting factor inaccuracy, even at mid-band frequencies. Thus,noise measurements and very low level signal meas-urements should always be made with the AMPLI-TUDE function of the main (READING) voltmeter.The READING meter maintains specified accuracyat any level, but becomes limited by its noise specifi-cation at signal levels below approximately 100 mi-crovolts (see specifications section of System Onebrochure). The LEVEL voltmeter flatness is typi-cally better than the principal (READING) voltme-ter for wideband true rms measurements.
TheFREQUENCY line of the ANALYZERpanel displays the frequency of the input signal.With hardware serial numbers below SYS1-20300and in most functions with hardware above those se-rial numbers, the counter measures on the channelselected at the top of the ANALYZER panel. In 2-CHANNEL and CROSSTALK functions with hard-ware serial numbers SYS1-20300 and above, thecounter measures the alternate channel.
In BANDPASS, BANDREJECT or W+F func-tions with hardware s/n SYS1-20300 and above,when the analyzer BP/BR frequency is swept orfixed instead of AUTO, the counter is connected tothe output of the BP/BR filter. This extends thecounter usable sensitivity below 250 microvolts dueto 12 dB gain in the filter and permits frequencymeasurements of one component of a complex sig-nal due to the filter selectivity.
The actual measurement technique is a period av-erage measurement followed by a reciprocal calcula-tion in the analyzer microprocessor. The number ofperiods averaged is automatically selected as a func-tion of the reading rate currently in use and the sig-nal frequency being measured. The measurementmay be expressed either in absolute units (Hz andkHz) or in a number of relative units with respect tothe Freq REF value entered near the bottom of thepanel; see the UNITS chapter for details.
PHASE, if the PHA-LVF module is present andboth channels are presented with signals above thephase measurement threshold of a few millivolts, dis-plays the phase of the signal at the CHANNEL-BINPUT referred to the CHANNEL-A INPUT. Unitsare selected to the right of the measurement display.
Input-output phase measurements of a device un-der test may be made by selecting GEN-MONitor in-stead of INPUT for the analyzer channel not con-nected to the output of the device under test. In ad-dition, both the A and B outputs of the generatormodule must be turned on. One channel of thephase meter is thus connected to the generator out-put (device input) and the other to the device output,providing a measurement of device input-to-outputphase shift. If high-gain devices are to be meas-
10-4 Audio Precision System One Operator's Manual

ured, their required input amplitude for linear opera-tion may be less than the approximately 2 mV sensi-tivity of the phase meter. In this case, the signal atthe BNC connector labeled MONITOR OUTPUT(GENERATOR AUXILIARY SIGNALS) can beconnected to the CHANNEL-B connector to serveas the phase reference, instead of selecting GEN-MONitor at CHANNEL-B. This MONITOR OUT-PUT signal is a constant amplitude signal of approxi-mately 1 Volt, even when the generator outputs areat very low amplitudes.
Either CHANNEL-A or CHANNEL-B may be se-lected as GEN-MONitor. System One software willautomatically correct the phase measurements sothat the GEN-MONitor channel is the reference andphase measurements are relative to it. If both chan-nels A and B are set to GEN-MONitor, channel Awill again be the reference. The panel display rangecan be fixed in +/-180 degree display format (deg1),-90 to +270 degree format (deg2), 0 to +360 degreeformat (deg3), or can be automatically selected as +/-180 degrees or 0-360 degrees, depending on themeasured value (deg).
Polarity testing may be performed with SystemOne if the BUR-GEN module is present or anotherassymetrical (low duty cycle) tone burst signal isavailable. The signal must consist of a tone burst ofapproximately 30% duty cycle, with the leadingedge of the burst sinewave being positive-going.All tone bursts from the BUR-GEN module are in-itially positive-going. Polarity mode is selectable asa unit on the PHASE line of the ANALYZER panel,shown in Figure 10-4. WhenPOL is selected, thePHASE indication can be only 0 or +180. The 0 in-dication shows that the measured signal is positive-going; a +180 indication indicates that a polarity re-versal has occurred somewhere between the gener-ator output and the analyzer input.
Polarity testing is a requirement when testing thewiring of mixing consoles, studios, and other sophis-ticated multi-channel audio systems to assure that noinadvertent cable transpositions have taken place.
10.4. Filter Frequency Control
The BP/BR FREQ line permits control of the tun-ing of the bandpass/bandreject filter of the tunablefilter module. Two modes are selectable—AUTOor Hz. In the AUTO mode, the filter will automat-ically be tuned to the generator frequency during fre-quency or amplitude sweeps where generator is thesignal source. In sweeps with an EXTERNal source(such as the signal from a pre-recorded test tape ordisk or a distant-origination signal), AUTO modesteers the filter to the frequency being measured bythe analyzer frequency counter. In panel mode withAUTO selected, the filter is also steered by the ana-lyzer frequency data if the LEVEL voltmeter read-ing is above approximately 8 millivolts; below thatlevel, the filter will be locked to the last frequencymeasured by the frequency counter.
When Hz is selected, the filter can be fixed-tunedto any frequency from 10 Hz to 200 kHz (+/-3%) bymaking a numeric entry in this field. If it is desiredto transfer the present value of the FREQUENCYcounter to this field, you may place the cursor onthe BP/BR FREQ units (Hz) field and press <En-ter>. When an ANLR BP/BR sweep is selected atSOURCE-1 or SOURCE-2, it will take control ofthe filter frequency during the sweep even if theANALYZER panel selection was fixed at a specificfrequency.
Figure 10-4 Analyzer Panel in Polarity TestingMode
ANALYZER PANEL 10-5

10.5. Detector Selection
The DETECTOR line permits selection of read-ing rate and of any of five detector types in the prin-cipal (analyzer) voltmeter. The actual hardware de-tector choices are RMS (true rms), AVG (average re-sponding, rms calibrated), Peak (peak responding),and Q-Pk (quasi-peak response conforming withCCIR Recommendation 468-4).
The S-Pk “detector” uses the Peak detector hard-ware circuitry, but multiplies the measurement by0.7071 before display. It thus displays the ampli-tude of a sinewave which would have the same peakamplitude as the signal being measured. It is par-ticularly useful for expressing the output power ofamplifiers with stimulus from an intermodulationdistortion test signal or other non-sinusoidal signal.Using the S-Pk detector will show an amplifier’savailable power at clipping to be essentially thesame under sinewave or IMD waveform stimulus.
With Q-Pk, Peak, or S-Pk selections, the displayautomatically holds the maximum value for approxi-mately 0.5 seconds, regardless of reading rate selec-tion. All detectors are linear even with signal crestfactors as high as 7.
The true RMS detector should be selected for ac-curate measurements when the signal is non-sinusoi-dal, such as a distortion measurement or wide-bandnoise measurement. If the signal is sinusoidal orsharply band-limited noise due to use of SystemOne’s BANDPASS mode or optional bandpass fil-ters for individual harmonic measurements, theAVG detector will exhibit faster settling, less errorat low frequencies, and less noise.
10.6. Reading Rate
With the RMS detector, there is an inherent rela-tionship between the fastest valid reading rate forfull specified measurement accuracy and the lowestfrequency component of the measured signal. 32readings per second should be used only for repeti-tive signals faster than approximately 65 Hz. Simi-larly, 16 readings/sec is valid for 30 Hz and faster, 8readings/sec for 20 Hz and faster, and 4 readings/sec
for 10 Hz and faster. These signal frequency limita-tions pertain not only to a single sine wave, but tothe difference between the two most closely spacedcomponents of a complex signal. For example,when measuring THD+N at 35 Hz in an amplifierwith significant 60 Hz hum from the power mains, a10 Hz beat product can exist between the powermains hum at 60 Hz and the second harmonic at 70Hz. Properly measuring the amplitude of the signal,including this 10 Hz beat, would require use of the4 readings/sec detector selection.
The field between the DETECTOR label and thedetector type selection controls the update rate ofthe four measurements (READING, LEVEL, FRE-QUENCY, and PHASE). The five selections areAUTO, 4/sec, 8/sec, 16/sec, and 32/sec. If any ofthe four fixed selections are chosen, the update ratewill be fixed at the selected rate during all modes ofoperation. If AUTO is selected, a software algo-rithm takes control of the reading rate. This algo-rithm selects 4/sec in panel mode and chooses appro-priate selections under other conditions dependingupon the display mode, signal waveform being gen-erated, SOURCE-1 and SOURCE-2 selection, analy-sis function, and generator or bandpass filter fre-quency. See the “Auto and Fixed Sampling Rates”section of the SWEEP (F9) DEFINITIONS PANELchapter for full information on these selections. De-tector time constants are also switched along withthe reading rate. The AUTO algorithm also causesthe 22 Hz high-pass filter to be selected wheneverthe source frequency is above 60 Hz in a sweep.
Reading rates faster than the recommendationsabove may be used with some loss of accuracy,which may be an acceptable tradeoff in specific ap-plications. Rates slower than the AUTO selectionsare required in some applications, such as when us-ing the LEVEL meter at very low amplitudes.AUTO mode is generally recommended except forspecial cases. During swept frequency measure-ments with external sources, a faster reading ratemay normally be selected consistent with the lowestfrequency signal expected at which accuracy is to bemaintained. Faster rates may be desirable for goodinformation feedback during equipment adjustmentsusing bargraph display mode.
10-6 Audio Precision System One Operator's Manual

10.7. Bandwidth Control
Both low and high frequency band limits of theprincipal (READING) voltmeter are controlled fromthe BANDWIDTH line. The low frequency bandlimit is controlled from the field immediately afterthe BANDWIDTH label. With no filter selected,the lower 3 dB limit is <10 Hz (typically approxi-mately 4 Hz in amplitude modes and 6 Hz inTHD+N or BAND-REJECT modes). Three-polehigh-pass filters at 22 Hz, 100 Hz, and 400 Hz areselectable.
The right-hand field on the BANDWIDTH linesimilarly controls the upper band limit. With no fil-ters, the bandwidth is in excess of 500 kHz. Three-pole low-pass filters at 80 kHz or 30 kHz may be se-lected. The 22 kHz low-pass filter selection is madeup of three poles at 22 kHz, cascaded with the three-pole 30 kHz filter. The resulting six-pole responseabove 30 kHz produces somewhat greater attenu-ation of signals such as the 44.1 kHz or 48 kHz sam-pling frequency in digital systems.
In intermodulation distortion modes and wow andflutter modes, the bandwidth line becomes an indica-tor of detection bandwidth used in the selected mode.
10.8. Optional Filters
Optional FILTER capability on analyzers belows/n SYS1-20300 consists of four sockets on the ana-lyzer module circuit board. Units with serial SYS1-20300 and above add a fifth socket plus front-panelBNC connectors for externally-connected filters.Optional filters made by Audio Precision may beplugged into the sockets. A blank circuit board isalso offered for the sockets to allow user design andfabrication of custom filter designs. The ANA-LYZER panel shows the choices of OFF, #1, #2, #3,#4, #5 (s/n SYS1-20300 and higher only), EXTER-NAL (s/n SYS1-20300 and higher only), CCIR,CCIR-2K, and “A”WTG whether or not filters areactually installed. Selecting an unoccupied socketwill result in erroneous readings.
If a CCIR weighting filter is used, it must be in-stalled in socket #1, nearest the rear panel of SystemOne. If an A weighting filter is used it should be in-stalled in the #2 socket, second from the rear.When any filter (A-weighting or otherwise) is in-stalled in the #2 socket, it can be selected eitherwith the #2 or the “A”WTG selection on the panelwith identical results.
If a filter is plugged into socket #1, however, theresults will be different depending on whether it isselected on the panel as #1, CCIR, or CCIR-2K.The #1 panel selection chooses the #1 socket withunity gain, as is appropriate for all available filtersexcept the CCIR weighting filter. The CCIR selec-tion also selects the #1 socket, but with a software-controlled gain factor of 12.22 dB (4:1 attenuation).This value is required in conjunction with the actualelectrical gain through the CCIR filter to produceunity gain at 1 kHz as specified in CCIR recommen-dation 468-4 and earlier. Selecting CCIR-2K againselects the #1 socket, but with a software-controlledgain factor of 5.92 dB. This value produces theunity gain point at 2 kHz, as specified by Dolbyfor the CCIR-ARM noise measurement method (inconjunction with the AVG detector).
Other available filters include C-message andCCITT weighting filters, the receiver bandpass filter(200 Hz to 15 kHz bandpass plus 19 kHz notch),and a precision 20 kHz band limiting filter withsharp rolloff..
The FBP-nnn family of bandpass filters are in-tended for individual harmonic distortion measure-ments, especially with tape recorders. For example,assume that a 1 kHz fundamental tone is recordedon tape and that 2 and 3 kHz filters (FBP-2000 andFBP-3000) are plugged into sockets #3 and #4. Se-lecting THD+N mode with no optional filters se-lected will produce a READING of total harmonicdistortion plus noise. Further selecting socket #3 (2kHz bandpass) would produce a reading which ispurely second harmonic. Selecting the #4 socket (3kHz bandpass) would provide a third harmonic read-ing.
ANALYZER PANEL 10-7

10.9. Input Configuration
The next two pairs of lines on the ANALYZERpanel are input configuration controls for the chan-nel A and channel B input circuitry. Selections areindependent for the two channels. The INPUT vsGEN-MONitor (vs AUXILIARY, on units s/n SYS1-20300 and above) selection chooses either the panelconnectors (INPUT) or an internal cable to the corre-sponding generator output connector (GEN-MONi-tor) to allow monitoring of the generator terminalvoltage. An auxiliary input connector is added onunits of serial number SYS1-20300 and above andmay be selected as an A channel input in addition tothe INPUT and GEN-MONitor choices.
The TERMination line permits selection of a 150Ohm or 600 Ohm input termination or the 100kilohm high impedance bridging input for the IN-PUT connector. A 300 Ohm selection replaces the150 Ohm selection when the EURZ option is in-stalled and the software properly invoked at start-up.Since excessive power dissipation is a potential prob-lem with the low impedance terminations, they willbe automatically disconnected if the input signallevel exceeds approximately +32 dBu (30 Volts).The GEN-MONitor connection does not load thegenerator, even if a termination has been selectedfor the INPUT connector.
In all cases except the AUXILIARY input ofunits above serial SYS1-20300, the input is fully bal-anced (differential). The AUXILIARY input is un-balanced due to use of a grounded-type (BNC) con-nector.
Input RANGE will nearly always be left in theAUTO mode, though a manual range may be se-lected for certain specialized applications. Theautoranging control circuitry responds to the peakvalue of the input signal, rather than the rms or aver-age value as in other audio test equipment, prevent-ing overload and non-linearity on signals with highcrest factors. Note that the input manual range selec-tion (under CHANNEL-A and CHANNEL-B) fixesonly the input auto-ranging circuitry. The range am-plifier circuitry located later in the READING metercircuitry can be fixed in the RANGE field near thetop of the ANALYZER panel.
The balanced inputs to the analyzer appear atpins 2 and 3 of the XLR connectors. When makingadapter cables from the XLR connectors to unbal-anced connectors such as RCA phono or standard orminiature phone plugs and jacks, pin 2 of the XLRmust be wired to the center conductor of the unbal-anced cable. Pin 3 of the XLR must be wired to theshell of the RCA phono or sleeve connection of thephone plug or jack.When stereo devices (balancedor unbalanced) are being tested, take care that theleft and right channel cables between System Oneand the device are tightly dressed together or eventwisted to reduce the loop area into which hum canbe magnetically coupled.
A separate ground connection may be made fromthe chassis of the device under test to the GROUNDconnector on the analyzer input connector panel. Ifstimulus is also provided from System One, onlyone ground connection should be made between thedevice under test and System One. Experimentationmay be required to see whether lower noise resultswith that connection made to the generator panel orthe analyzer panel.
10.10. Reference Values
dBr REF is the zero dB reference for the dBrunits of both the principal analyzer voltmeter andthe LEVEL voltmeter. The default value at power-up is 387.3 millivolts, the voltage across a 150 Ohmresistor when one milliwatt is being dissipated in theresistor. A new dBr value may be entered into thenumeric entry field, or the present value of a meas-ured parameter may be transferred to this field bypressing either the <F4> function key, or by press-ing the <+> or <Del> key while the cursor is on thedBr numeric entry field. This capability is ex-tremely convenient in setting the reference level forfrequency response sweeps, gain and loss measure-ments, signal-to-noise ratio measurements, commonmode rejection ratio measurements, separation andcrosstalk measurements, or other relative audiomeasurements.
10-8 Audio Precision System One Operator's Manual

When the <F4> key is pressed to set the dBrREF value, System One goes through the followingpriorities to determine which measurement will beentered into the dBr REF field:
1. If the principal voltmeter (READING)has dBr units selected on the ANALYZERpanel, use the principal voltmeter reading
2. If the LEVEL voltmeter has dBr units se-lected on the ANALYZER panel, use theLEVEL voltmeter reading
3. If the READING voltmeter is in AMPLi-tude function or BANDPASS function orBANDREJECT function, use the principalvoltmeter reading
4. If the READING voltmeter is in THD+Nfunction with Volts or dBm or dBu or dBVor dBr, use the principal voltmeter reading
5. If both READING and LEVEL voltme-ters are set to OFF on the ANALYZERpanel, use the principal voltmeter reading
6. Otherwise, use the LEVEL voltmeterreading.
Note that the dBr REF value is not instantlychanged when the <F4> key is pressed. This is dueto a 200 millisecond delay, plus the SETTLINGpanel criteria (see SWEEP (F9) DEFINITIONSchapter) being applied to the readings from the hard-ware, just as they are during graphic sweeps. Thisdelay helps assure that stabilization is achieved aftera test is loaded during a procedure, immediately be-fore the dBr REFerence is set.
The dBr unit may be used in THD+N modes forapplications such as expressing quantization distor-tion in digital systems in dB above the theoreticalfloor for the number of bits in the digital word. As-suming that the full-scale output voltage of the digi-tal device is known, the theoretical floor can be com-puted in the units desired and entered into the dBrREF field. Selecting dBr as the THD+N units willthen provide a reading of “excess distortion” abovethe ideal value. If an actual THD+N reading is tobe entered into the dBr REF field by pressing the<F4> key (case 4 in the priority list above), caremust be taken that none of the higher priorities will
override. Specifically, this means that dBrmust notbe selected as the LEVEL voltmeter unit, or case 2would be in effect.
Units for the dBr REF value may be selected inthe usual fashion by the field following the numericfield.
The dBm/W REF field is used to enter the valueof circuit impedance across which the analyzer inputis connected so that power measurements (dBm orWatts) can be correctly computed. Any numericvalue may be entered into this field. This entry isnot automatically made or changed when selectinganalyzer input termination values, since the analyzerhas no way of knowing what external impedancesmay be in parallel with its input. If the selected in-put impedance of System One cannot be neglectedin comparison to external terminations, the parallelcombination of the two must be computed and en-tered by the operator into the dBm/W REF field.
The Freq REF field is used to enter a referencefrequency which will be used in all relative fre-quency units. Typical applications include tape anddisk player speed (drift) measurements, measure-ments of the frequency drift of an oscillator, meas-urements of the frequency error through frequency-division-multiplex equipment, measurement of theslope (in dB per octave or dB per decade) of a filter,and measurement of musical notes in the terminol-ogy used by instrument tuners. The Freq REF valuemay be entered into this field from the keyboard, orthe presently-measured frequency from the analyzerfrequency counter may be automatically entered bypressing <Alt><F4>. See the UNITS chapter for adiscussion of the units.
10.11. Range
The System One analyzer has gain range switch-ing circuitry in three places. Each input channel, Aand B, has switchable attenuators and gain stages im-mediately following the input connectors. TheREADING meter also has switchable gain stagesprior to the low-pass, high-pass, and optional filters(see Figure 32-1 on page 32-2 of the Analyzer and
ANALYZER PANEL 10-9

Generator Hardware Chapter). For the majority ofSystem One operation, these three gain-controlblocks should be left under AUTO control.
There are two reasons why selecting a fixed gainrange may be desirable; speed, and transient-freeMONITOR OUTPUT signals. During AUTO rangeoperation, significant time is required for theautorange circuitry to detect that the signal is out-side the optimum range for the present settings andto change the range. Changing is then normally ac-complished one step at a time. The time required de-pends upon the reading rate, which in turn normallydepends upon signal frequency and thus becomeslongest with low frequency signals. A commoncase is when signal is removed and restored, eitherbecause the generator output is turned off and on orwhen one device is disconnected and another con-nected. When signal is removed in AUTO rangemode, the instrument sensitivity is automatically in-creased one step at a time until the most sensitiverange is reached. When signal is restored, the sensi-tivity is decreased one step at a time until the opti-mum range is found for the signal. The period oftime required may be many hundreds of millisec-onds or even more than one second.
With fixed ranges, this autoranging time is elimi-nated. The risk of a fixed range is that the signalmay move outside that range. If the signal ampli-tude increases above the range maximum, clippingcan occur in the analyzer amplifiers with severe am-plitude errors, increased distortion, and apparent fre-quency multiplication resulting. If the signal ampli-tude decreases below the range minimum, the ef-fects are less catastrophic but distortion and noisemeasurement performance will be limited and belowinstrument specifications as the signal approachesthe instrument internal noise levels.
Note in Figure 32-1 on page 32-2 that the CHAN-NEL A and CHANNEL B MONITOR OUTPUTBNC connectors follow the input ranging circuitsand the READING MONITOR OUTPUT BNC con-nector follows the READING meter selectable gainstage. As the signal amplitude rises or falls, the sig-nal present at these BNC connectors tends to remainat a relatively constant amplitude but with suddentransient changes each time a range is switched. If
these transients are undesirable for a particular moni-toring purpose, or if it is desired that the signal atthese connectors linearly follows the input signal upand down, the ranges can be fixed. It is not neces-sary to fix the range of the READING meter gainamplifier in order to eliminate transients from theCHANNEL A and B MONITOR OUTPUTS, butboth the INPUT RANGE for the channel in use andthe READING RANGE must be fixed to eliminatetransients at the READING MONITOR OUTPUT.
For improved speed or to eliminate MONITOROUTPUT transients, it may be preferable to lockany or all of these circuit blocks into fixed gainranges. Each input channel range block is control-led by the right-hand field following the RANGE la-bel, on the line below the CHANNEL-A and CHAN-NEL-B labels. The READING meter channel gainamplifier may be fixed (in most functions andmodes) by the right-hand field on the RANGE lineimmediately below the MEASURE label near thetop of the analyzer panel.
If any of these fields is changed from the normalAUTO selection, the gain of the circuit block con-trolled will be fixed at the present value (which hadbeen automatically selected depending upon the sig-nal or noise amplitude present at the time). Thus,the easiest way to specify a fixed range is to apply asignal to the analyzer inputs at the absolute maxi-mum level which can occur for the particular test tobe made. Then, change the field(s) from AUTO andsave the test with the resulting value stored. To se-lect other fixed-range values, the cursor can beplaced in the field to the immediate left. In the
Figure 10-5 READING Meter Gain Amplifier GainFixing Fields and Selections
10-10 Audio Precision System One Operator's Manual

cases of the two INPUT channels, a variety of ampli-tude units is selectable and any desired signal ampli-tude may be typed into the field, followed by <En-ter>. The software will then select and display themost sensitive range which will not be overloadedby a signal of that amplitude.
For the READING channel, only a small numberof gain ranges are selectable (see Figure 10-5). Thisgain value may be displayed either in dB or as again ratio with the “* ” unit. The <+> and <Del>keys may be used to scan up or down through theavailable gain ranges. In AMPLITUDE and 2-CHAN functions, the available gain ratios are 1, 4,16, 64, and 256 (gains of 0.00, +12.04, +24.08,+36.12, and +48.16 dB). In all remaining READ-ING meter functions except W&F, an additional1024 gain value (+60.21 dB) is available. In theW&F function only AUTO is permitted because theanalyzer operates in a single range.
ANALYZER PANEL 10-11

10-12 Audio Precision System One Operator's Manual

11. SWEEP (F9) DEFINITIONS PANEL
Much of the power of System One comes fromits easy setup and use of sweeps of frequency or am-plitude, or measurements versus time. The parame-ters for these tests are controlled from the SWEEP(F9) DEFINITIONS panel section.
11.1. Stimulus and Horizontal AxisControl
Near the bottom of the SWEEP (F9) DEFINI-TIONS panel, on the SOURCE-1 line, you can se-lect GEN, ANLR, SWI, DCX, DSP, or EXTERN asthe stimulus source for a sweep test. GEN andANLR are the System One generator and analyzer,respectively. SWI refers to the SWR-122 family of
System One switching modules. DCX refers to theDCX-127 module. DSP is the Digital Signal Proc-essing Module. EXTERN is for use with externalsources such as pre-recorded test tones from a com-pact disc or test tape, or a test signal originating at adistant location. EXTERN mode is also used forTIME (chart recorder) measurements.
11.1.1. Source-1 Generator
When GEN is selected, subsidiary choices in thefield to the right may be made from FREQuencysweeps, AMPLitude sweeps, or NONE (a singlepoint measurement with tabular display). If theBUR-GEN option is installed, the three further
DATA-1; Solid(green) line on graph,2nd column withtabular display
DATA-2; dashed(yellow) line ongraph, 3rd columnin tabular display
SOURCE-1; sweptindependentvariable, horizontalaxis calibration
DATA-2 can be changed toHOR-AXIS to plot DATA-1 vsDATA-2 with no SOURCE-1calibration, STEREO toautomatically graph both channels,or SOURCE-2 to permit twoindependent variables to be sweptwithin one test (“nested sweep”)
Figure 11-1 Sweep (F9) Definitions Panel
11-1
choices of TB-ON, TB-INT, and TB-LVL will be ef-fective. TB-ON sweeps the tone burst on time, TB-INT sweeps the tone burst interval, and TB-LVLsweeps the amplitude of the lower level of the burstsignal. See the BURST-SQUAREWAVE-NOISEGENERATOR chapter for more details.
Frequency sweeps using the generator as thesource are made by selecting GEN FREQ asSOURCE-1. The software will vary the frequencyaccording to the SWEEP (F9) DEFINITIONS panel.The amplitude setting and all other conditions set upon the generator panel will be maintained, unlessEQSINE mode is selected on the GENERATORpanel or GEN AMPL is selected at SOURCE-2 (seenested sweeps, below). If the EQSINE mode is se-lected or a nested sweep is being run, the generatoramplitude will also be controlled. Similarly, ampli-tude sweeps with the generator use the SWEEP (F9)DEFINITIONS panel for amplitude control butmaintain frequency and all other conditions as seton the generator panel, unless GEN FREQ is se-lected at SOURCE-2. A test made with the NONEselection will take a single point measurement at theamplitude and frequency conditions set on the GEN-ERATOR panel. The NONE selection automat-ically produces tabular output if either MONO-GRAPH or COLOR-GRAPH is selected for DIS-PLAY.
11.1.2. Source-1 Analyzer
With the ANLR choice, the sweepable parameteris the frequency of the DIS-1 bandpass/bandrejectfilter (BPBR) in BANDPASS or BANDREJECTmodes. NONE can also be selected with ANLR fora single-point measurement.
11.1.3. Source-1 Switcher
A number of modes are available for switchercontrol when SWI is selected; see the SWITCHERchapter for more information.
11.1.4. Source-1 DCX
The DCX selection can produce sweeps of eithervariable DC output of the DCX-127 or of the paral-lel digital output word of the DCX-127. See theDCX-127 chapter for more details.
11.1.5. Source-1 DSP
The DSP selection choices depend upon the par-ticular Digital Signal Processing program down-loaded to the DSP module. See the Digital SignalProcessor chapter and the documentation with eachindividual DSP program for more details.
11.1.6. Source-1 External
Under the EXTERNal source selection, FRE-Quency sweeps, LEVEL sweeps, or TIME (“chartrecorder” mode) may be selected. The units avail-able on the START and STOP lines are those appro-priate to the independent variable (FREQ, LEVEL,TIME, switcher channel, etc.) and choices are madefrom among them just as on the GENERATOR orANALYZER panels.
11.1.7. Other Source-1 Parameters
The # STEPS parameter allows control over theresolution of the stimulus in the test. # DIVS givescontrol over the number of division lines (tic marks)in LINear modes; in LOG modes, a standard loga-rithmic set of division lines will always be used. Inlinear sweep modes with MONO-GRAPH display,the maximum number of horizontal divisions select-able is 13 except during SWItcher scans, when up to25 divisions may be selected (plus the single case of30 divisions). Entering 0 for the # DIVS will causethe software to make an automatic selection. InCOLOR-GRAPH display with the low resolutionCGA displays and linear sweep, the automatic selec-tion mode is always used except for SWItcher scans,when up to 25 divisions may be selected.
11-2 Audio Precision System One Operator's Manual

Frequency and amplitude sweeps may be madefrom high to low or low to high, and the switchersmay be scanned in either direction. Measurementsversus TIME (chart recorder mode) must be in thedirection of increasing time. Direction is controlledby selecting the end points appropriately on theSTART and STOP lines. For most applications, fre-quency sweeps from high to low are preferred sincemost real world devices and System One settlefaster at high frequencies. Though sweeping fromhigh to low does not always reduce the total sweeptime, it provides more data on the screen quickly tobegin interpretation of while the low frequency por-tion of the sweep is being completed.
Low to high frequency sweeps may be preferredwhen phase is being graphed with the deg (degrees)or rad (radians) units selected on the SWEEP (F9)DEFINITIONS panel. When plotting with either ofthese units, System One software automatically addsmultiples of 360 degrees to phase measurements asrequired to obtain a continuous graph even throughmany complete phase rotations. Starting at low fre-quency may be advantageous since phase delaythrough a system may be less at low than at high fre-quencies (unless the system includes high-pass filter-ing). If this automatic plotting of phase as a continu-ous function is not desired, the units on the SWEEP(F9) DEFINITIONS panel may be selected as deg1(fixed 180 degree range), deg2 (fixed -90 to +270degree range), or deg3 (fixed 0 to 360 degreerange). Fixing the phase range as deg1 may be par-ticularly valuable when using Bargraph mode to dis-play phase error while adjusting tape head azimuthon tape recorders.
START and STOP values in EXTERNal sweepmode (see below) must be selected to correspondwith the direction of sweep of the external source,since System One avoids retrace effects by not plot-ting the line between data points when transitions oc-cur in the direction opposite to that implied by theSTART and STOP values; see the External Sweepsection below for more details.
11.2. Generator Sweeps andAnalyzer Filter Sweeps
Generator frequency or amplitude sweeps andanalyzer bandpass/bandreject filter frequencysweeps are not truly continuously-varying analogsweeps, but a series of fixed points.
11.2.1. System-Computed Sweeps
If the SWEEP TABLE feature is OFF, or if notest file has been named as the SWEEP SOURCE,the system will compute all intermediate values forsweeps. (See the Table-Based Sweeps section be-low for an alternative method.)
The STEP TYPE may be selected from LOG orLIN. With LOG selected, the span between theSTART and STOP points will be divided into thenumber of logarithmically equal (constant multi-plier) steps specified by the # STEPS value. IfLOG is selected but zero or a negative number en-tered for either the START or STOP value, the sys-tem will default to LIN since the logarithm of zeroand negative numbers is not defined. The sweepingdevice (generator or analyzer filter) will then pro-ceed through them. LIN operation is similar exceptthat the span between START and STOP is dividedinto arithmetically equal steps. In LIN operation,the START and STOP values will exactly determinethe limits of the graph. In LOG mode, the graphlimits will always be set to significant figures of 1,2, 3, 5, or 8.
The number of steps desired can be entered onthe # STEPS line. Note that the number of stimulusand measurementpointswill be one greater than thenumber ofsteps. For example, if you select #STEPS as 1, two points will be generated (STARTvalue and STOP value). Zero steps can be specifiedto produce a single measurement point at theSTART value of the “sweep”, though selectingNONE as the sweep parameter is generally the pref-erable way of obtaining single point measurements.
Generator frequency and analyzer BP/BR filterfrequency sweeps can also be made in relative fre-quency units rather than absolute Hz and kHz. Gen-
SWEEP (F9) DEFINITIONS PANEL 11-3

erator relative frequency sweeps are with respect tothe number in the REFS Freq field of the GENER-ATOR panel. Analyzer relative frequency sweepsare with respect to the number in the REFS Freqfield of the ANALYZER panel. Acoustical analysiswork can be simplified, for example, by sweepingthe analyzer 1/3 octave filter in 1/3 octave steps byselecting OCTS instead of Hz/kHz as SOURCE-1units and choosing the START, STOP, and #STEPS values properly. For example, with STARTat +2 OCTS and STOP at -2 OCTS, 12 STEPS willproduce 1/3 octave steps across that 4-octave span.The BPASS noise mode or sine wave of the gener-ator can be similarly stepped in fractional octave orfractional decade steps of any desired size.
With the standard memory space allocation proce-dure and a computer with sufficiently large memory,the upper limit on the # STEPS which can be savedor re-plotted is 1089. For any specific computersize and memory space allocation, press <Esc> <H>to display the HELP panel, which will show themaximum number of steps available. Sweeps maybe run on-screen (and printed to paper) with a largernumber of steps than the maximum shown, but sav-ing the test or re-plotting via the <F7> key will onlysave or re-plot the initial portion of the sweep up tothe maximum limit. Larger numbers of steps, up to16,000 maximum, can be accommodated by reduc-ing the size of memory allocations for other buffers.See the Controlling Memory Usage section of theCREATING YOUR CUSTOM SOFTWARESTART-UP PROCESS chapter for more details.
The optimum number of steps to select is a trade-off between time and data detail. A larger numberof steps will take more test time and produce moredetailed data. For distortion versus frequencysweeps of typical devices from 20 Hz to 20 kHz, 10to 30 steps is usually adequate. Frequency responsemeasurements of relatively flat devices such as mostpower amplifiers can also be shown adequately with30 steps or less, while frequency response measure-ments of equalizers, loudspeakers, and similar de-vices with rapidly-changing response may profit by75 to 100 steps or even more.
A practical upper limit on the number of steps forgraphic display is set by the graph size and thegraphic resolution of the computer display system;in CGA color displays, about 255 points (200 if twoparameters are being graphed) is the horizontalgraphic resolution limit; in EGA and VGA colorgraphics, monochrome graphics with a CGA system,or the Toshiba 3100 orange monochrome display,about 575 points (520 with two parameters graphed)is the horizontal graphic limit; and with the Hercu-les high-resolution monochrome graphics, about 615points (560 with two parameters) is the horizontalgraphic resolution limit. (The principal advantageof the Hercules card is 348 point vertical resolutioncompared to 200 vertical points with the CGA card.)
11.2.2. Table-Based Sweeps
System One also supports table-based sweeps.This feature may most commonly be used in produc-tion test applications, when it is desired to test at cer-tain exact points across the frequency or amplituderange being tested. This may be desirable as a timesaving technique if, for example, high detail of fre-quency response is critical at certain portions of thespectrum (such as at band edges) but response isnon-critical or simply unlikely to vary across otherareas, such as mid-band. Another application of ta-ble-based sweeps is in testing graphic equalizers,real time analyzers, or other filter-bank devices; thetable can consist of the specified center frequenciesfor each filter in the bank.
Table-based sweeps make use of the STEP TA-BLE ON/OFF line and the Names Sweep menu com-mand. The Edit Data and Save Sweep capabilitiesare normally used to create a sweep (.SWP) file tobe used as the sweep source table.
The simplest method of creating a sweep sourcetable is to set up the SWEEP (F9) DEFINITIONSpanel for the type sweep (FREQuency or AMPLi-tude) desired, specifying the units you wish to usein the table, and with a # STEPS value equal to oneless than the number of values you plan to have inthe table. It is also convenient, though not critical,to select as the START and STOP values those num-bers which you plan to have as the end values in the
11-4 Audio Precision System One Operator's Manual
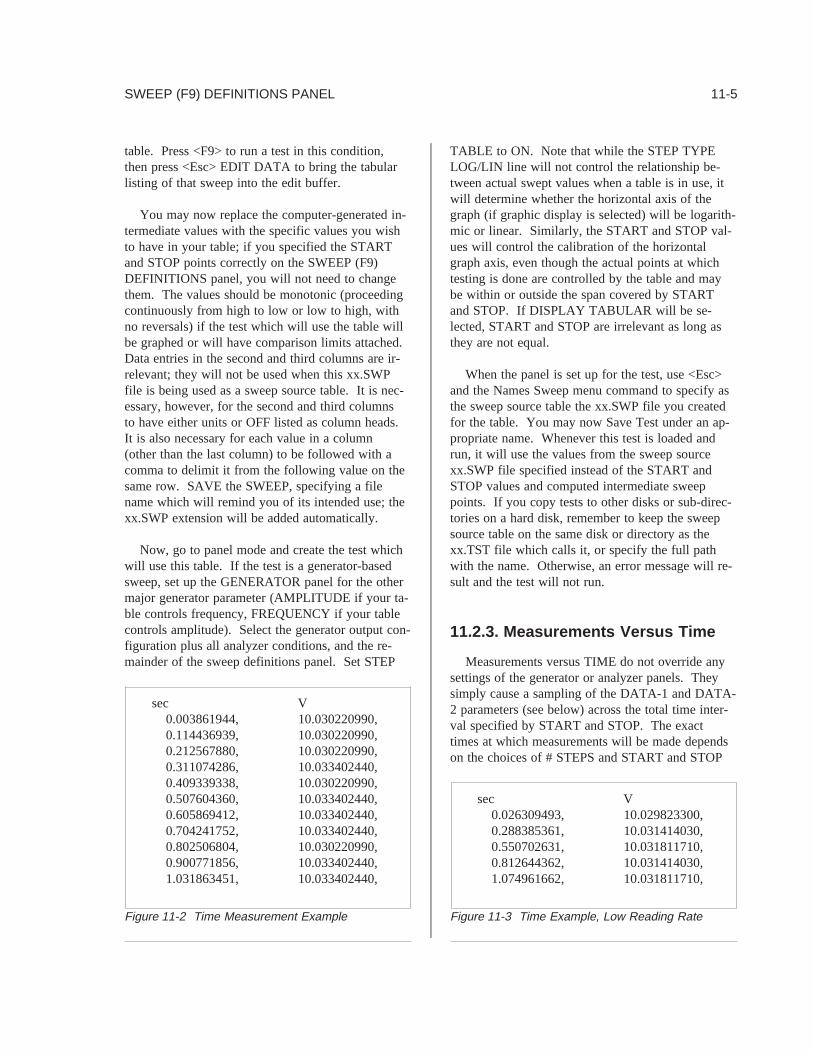
table. Press <F9> to run a test in this condition,then press <Esc> EDIT DATA to bring the tabularlisting of that sweep into the edit buffer.
You may now replace the computer-generated in-termediate values with the specific values you wishto have in your table; if you specified the STARTand STOP points correctly on the SWEEP (F9)DEFINITIONS panel, you will not need to changethem. The values should be monotonic (proceedingcontinuously from high to low or low to high, withno reversals) if the test which will use the table willbe graphed or will have comparison limits attached.Data entries in the second and third columns are ir-relevant; they will not be used when this xx.SWPfile is being used as a sweep source table. It is nec-essary, however, for the second and third columnsto have either units or OFF listed as column heads.It is also necessary for each value in a column(other than the last column) to be followed with acomma to delimit it from the following value on thesame row. SAVE the SWEEP, specifying a filename which will remind you of its intended use; thexx.SWP extension will be added automatically.
Now, go to panel mode and create the test whichwill use this table. If the test is a generator-basedsweep, set up the GENERATOR panel for the othermajor generator parameter (AMPLITUDE if your ta-ble controls frequency, FREQUENCY if your tablecontrols amplitude). Select the generator output con-figuration plus all analyzer conditions, and the re-mainder of the sweep definitions panel. Set STEP
TABLE to ON. Note that while the STEP TYPELOG/LIN line will not control the relationship be-tween actual swept values when a table is in use, itwill determine whether the horizontal axis of thegraph (if graphic display is selected) will be logarith-mic or linear. Similarly, the START and STOP val-ues will control the calibration of the horizontalgraph axis, even though the actual points at whichtesting is done are controlled by the table and maybe within or outside the span covered by STARTand STOP. If DISPLAY TABULAR will be se-lected, START and STOP are irrelevant as long asthey are not equal.
When the panel is set up for the test, use <Esc>and the Names Sweep menu command to specify asthe sweep source table the xx.SWP file you createdfor the table. You may now Save Test under an ap-propriate name. Whenever this test is loaded andrun, it will use the values from the sweep sourcexx.SWP file specified instead of the START andSTOP values and computed intermediate sweeppoints. If you copy tests to other disks or sub-direc-tories on a hard disk, remember to keep the sweepsource table on the same disk or directory as thexx.TST file which calls it, or specify the full pathwith the name. Otherwise, an error message will re-sult and the test will not run.
11.2.3. Measurements Versus Time
Measurements versus TIME do not override anysettings of the generator or analyzer panels. Theysimply cause a sampling of the DATA-1 and DATA-2 parameters (see below) across the total time inter-val specified by START and STOP. The exacttimes at which measurements will be made dependson the choices of # STEPS and START and STOP
sec V0.003861944, 10.030220990,0.114436939, 10.030220990,0.212567880, 10.030220990,0.311074286, 10.033402440,0.409339338, 10.030220990,0.507604360, 10.033402440,0.605869412, 10.033402440,0.704241752, 10.033402440,0.802506804, 10.030220990,0.900771856, 10.033402440,1.031863451, 10.033402440,
Figure 11-2 Time Measurement Example
sec V0.026309493, 10.029823300,0.288385361, 10.031414030,0.550702631, 10.031811710,0.812644362, 10.031414030,1.074961662, 10.031811710,
Figure 11-3 Time Example, Low Reading Rate
SWEEP (F9) DEFINITIONS PANEL 11-5
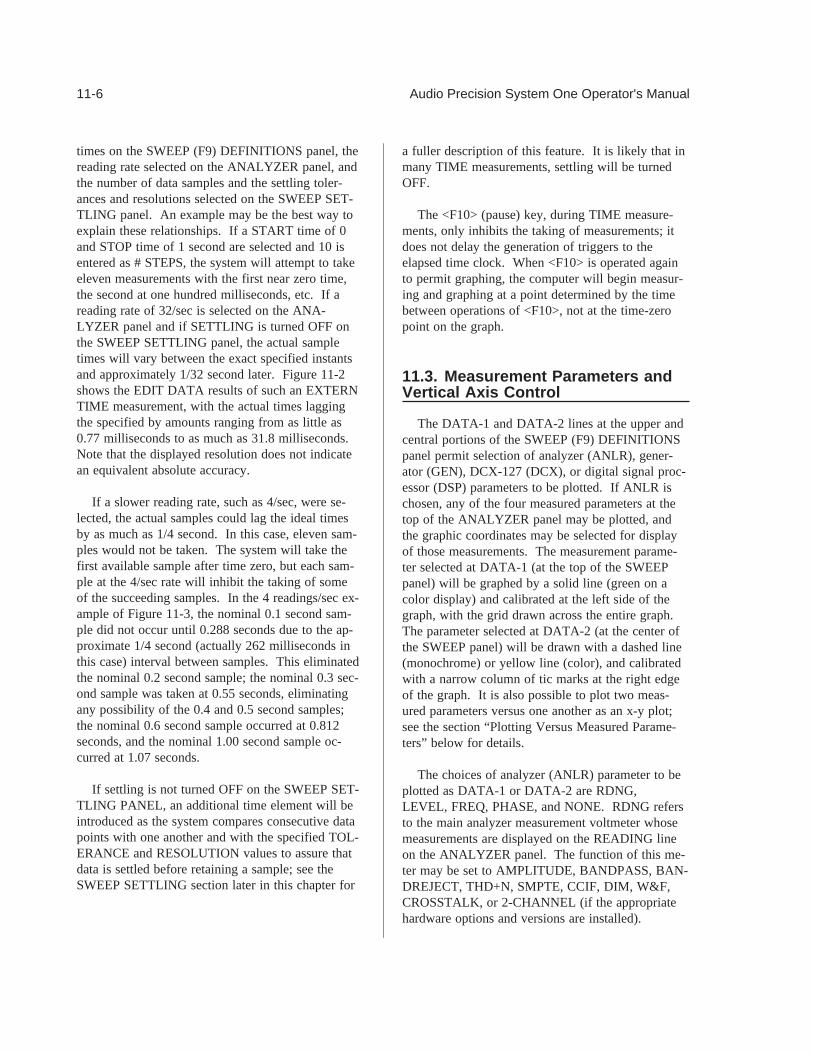
times on the SWEEP (F9) DEFINITIONS panel, thereading rate selected on the ANALYZER panel, andthe number of data samples and the settling toler-ances and resolutions selected on the SWEEP SET-TLING panel. An example may be the best way toexplain these relationships. If a START time of 0and STOP time of 1 second are selected and 10 isentered as # STEPS, the system will attempt to takeeleven measurements with the first near zero time,the second at one hundred milliseconds, etc. If areading rate of 32/sec is selected on the ANA-LYZER panel and if SETTLING is turned OFF onthe SWEEP SETTLING panel, the actual sampletimes will vary between the exact specified instantsand approximately 1/32 second later. Figure 11-2shows the EDIT DATA results of such an EXTERNTIME measurement, with the actual times laggingthe specified by amounts ranging from as little as0.77 milliseconds to as much as 31.8 milliseconds.Note that the displayed resolution does not indicatean equivalent absolute accuracy.
If a slower reading rate, such as 4/sec, were se-lected, the actual samples could lag the ideal timesby as much as 1/4 second. In this case, eleven sam-ples would not be taken. The system will take thefirst available sample after time zero, but each sam-ple at the 4/sec rate will inhibit the taking of someof the succeeding samples. In the 4 readings/sec ex-ample of Figure 11-3, the nominal 0.1 second sam-ple did not occur until 0.288 seconds due to the ap-proximate 1/4 second (actually 262 milliseconds inthis case) interval between samples. This eliminatedthe nominal 0.2 second sample; the nominal 0.3 sec-ond sample was taken at 0.55 seconds, eliminatingany possibility of the 0.4 and 0.5 second samples;the nominal 0.6 second sample occurred at 0.812seconds, and the nominal 1.00 second sample oc-curred at 1.07 seconds.
If settling is not turned OFF on the SWEEP SET-TLING PANEL, an additional time element will beintroduced as the system compares consecutive datapoints with one another and with the specified TOL-ERANCE and RESOLUTION values to assure thatdata is settled before retaining a sample; see theSWEEP SETTLING section later in this chapter for
a fuller description of this feature. It is likely that inmany TIME measurements, settling will be turnedOFF.
The <F10> (pause) key, during TIME measure-ments, only inhibits the taking of measurements; itdoes not delay the generation of triggers to theelapsed time clock. When <F10> is operated againto permit graphing, the computer will begin measur-ing and graphing at a point determined by the timebetween operations of <F10>, not at the time-zeropoint on the graph.
11.3. Measurement Parameters andVertical Axis Control
The DATA-1 and DATA-2 lines at the upper andcentral portions of the SWEEP (F9) DEFINITIONSpanel permit selection of analyzer (ANLR), gener-ator (GEN), DCX-127 (DCX), or digital signal proc-essor (DSP) parameters to be plotted. If ANLR ischosen, any of the four measured parameters at thetop of the ANALYZER panel may be plotted, andthe graphic coordinates may be selected for displayof those measurements. The measurement parame-ter selected at DATA-1 (at the top of the SWEEPpanel) will be graphed by a solid line (green on acolor display) and calibrated at the left side of thegraph, with the grid drawn across the entire graph.The parameter selected at DATA-2 (at the center ofthe SWEEP panel) will be drawn with a dashed line(monochrome) or yellow line (color), and calibratedwith a narrow column of tic marks at the right edgeof the graph. It is also possible to plot two meas-ured parameters versus one another as an x-y plot;see the section “Plotting Versus Measured Parame-ters” below for details.
The choices of analyzer (ANLR) parameter to beplotted as DATA-1 or DATA-2 are RDNG,LEVEL, FREQ, PHASE, and NONE. RDNG refersto the main analyzer measurement voltmeter whosemeasurements are displayed on the READING lineon the ANALYZER panel. The function of this me-ter may be set to AMPLITUDE, BANDPASS, BAN-DREJECT, THD+N, SMPTE, CCIF, DIM, W&F,CROSSTALK, or 2-CHANNEL (if the appropriatehardware options and versions are installed).
11-6 Audio Precision System One Operator's Manual

LEVEL refers to the LEVEL voltmeter on the DIS-1 module, which continuously monitors the inputsignal prior to any filtering. FREQ and PHASE arethe analyzer frequency counter and phase meter, re-spectively. Polarity test display is via the PHASEselection. When POL is selected as the phase “unit”on the ANALYZER panel, only POL units are avail-able at DATA-1 or DATA-2.
Generator amplitude may also be plotted asDATA-1 or DATA-2 by selecting GEN instead ofANLR in the field following DATA-n, then select-ing AMPL or INVAMP as the generator parameterto be plotted, with appropriate units. It is useful toplot generator amplitude if it is not held constantduring sweep tests, such as in the REGULATIONmode (see the REGULATION chapter) or in theequalized sweep mode (see the EQUALIZATIONchapter). Selection of INVAMP causes dBr to beplotted. This is useful in REGULATION modewhen measuring frequency response of a system atconstant output by varying the generator amplitude.To produce a conventional frequency responsegraph, the inverse of generator amplitude must beplotted since a gain fall-off of the device under testwill require more generator amplitude in order tohold output constant.
When DCX is selected at DATA-1 or DATA-2(or HOR-AXIS or STEREO instead of DATA-2),further selection may then be made of the DCX-127digital voltmeter (DMM) or digital input (DIGIN).The voltmeter selection will graph voltage or resis-tance, depending on which function is selected onthe DCX-127 panel. See the DCX-127 chapter formore details.
When DSP is selected at DATA-1 or DATA-2,the further selections for parameter to be plotted aretotally dependent upon the particular DSP programwhich has been downloaded to the DSP module.See the documentation for each DSP program for de-tails.
The fields to the right of GRAPH TOP and BOT-TOM permit setting the graph’s upper and lowerboundaries. Units of display for each parametermay be selected from those appropriate for the pa-rameter being measured. The units selected on the
sweep panel for display on the graph are inde-pendent of the units selected for numeric display ofthe same parameter on the ANALYZER panel, withthe exception of absolute versus relative units in dis-tortion modes, CROSSTALK mode, and 2-CHAN-NEL mode. For graphic display in one of the rela-tive units (%, dB, PPM, or X/Y), a relative unitmust be selected on the ANALYZER panel. Forgraphic display of absolute units, (Volts, dBm, dBu,dBV, dBr, W) an absolute unit must be selected onthe ANALYZER panel.
LOG or LIN vertical display may be selected;LIN is automatically chosen if the GRAPH TOP orBOTTOM value is zero or negative.The # DIVS(which functions only with LIN vertical displays)controls the number of divisions into which thegraph will be divided. A 0 entry causes an auto-divi-sion-mark selection. The maximum number of divi-sions is 20. With LIN selected, the graph top andbottom lines will be exactly the values specified inGRAPH TOP and BOTTOM.In LOG mode, thegraph top and bottom will always be lines with sig-nificant figures of 1, 2, 3, 5, or 8.
11.4. Graphic and Tabular Display
At the very bottom of the screen, select DIS-PLAY MONO-GRAPH, COLOR-GRAPH, TABU-LAR, or NONE.
In COLOR-GRAPH mode with a CGA displaysystem, because of the lower resolution of the colorgraphics card in the computer, larger alphanumericcharacters are required for legibility. The size ofthese characters forces the omission from colorgraphs of several pieces of information displayed onmonochrome graphs. These include the title(AUDIO PRECISION unless changed via theNames Title function), the test name, and the dateand time. The actual graph area of CGA colorgraphs is also smaller than monochrome and thegraphic resolution is poorer. EGA and VGACOLOR-GRAPH displays do not sacrifice detail forcharacter size for color due to their higher resolutioncapability. Color graphs are attractive and are sim-
SWEEP (F9) DEFINITIONS PANEL 11-7

Figure 11-4 Sample Graph from CGA Color-Graph Mode
Figure 11-5 Sample Graph from Mono-Graph Mode, CGA Display System
11-8 Audio Precision System One Operator's Manual

pler to interpret when two variables are plotted ontothe same graph, since each is plotted in a differentcolor.
When you are using a color display but printinghard copy with a monochrome printer, you will prob-ably wish to change the DISPLAY selection toMONO-GRAPH before doing the printout in orderto have the additional information, solid line vsdashed line data discrimination, and higher resolu-tion (if CGA display system) on the hard copy. SeeFigure 11-5 and Figure 11-4 to compare printout ofthe same graph on a CGA system with the DIS-PLAY in MONO-GRAPH versus COLOR-GRAPH.
DISPLAY TABULAR will produce a tabular list-ing on screen as a test runs, showing the inde-pendent value and the one or two measured values,plus any out-of-limit readings if limit files are at-tached to the test (see the ACCEPTANCE TESTLIMITS chapter). Tabular display is automaticallyselected if single-point measurements are made us-ing either the GEN NONE or ANLR NONE selec-tions for SOURCE-1.
DISPLAY NONE is intended principally for pro-duction test or other applications with non-techni-cally-skilled operators who would not be able to in-terpret either graphic or tabular displays. Thescreen will be blank except for a message showingthat the test is in progress or has completed. DIS-PLAY NONE also slightly shortens test time.
11.5. Running Tests
To make a sweep test and graph, press functionkey <F9> or <Esc> Run Test. You may interrupt asweep to return to the panel by pressing the <Enter>key. A sweep may be interrupted and re-startedonto the same graph by pressing key <F9>. Youcan cause a sweep to pause by operation of <F10>and to resume by another operation of <F10>. Thegrid can be pre-drawn but actual testing delayed bypressing <F9>, followed immediately by <F10>;this permits synchronizing to some external signalsource such as a compact disk or tape player, by notstarting actual data acquisition until the test tones be-gin on the device being tested. <F7> (or <Esc> Run
Graph) will retrieve the data of the most recentlymade test, even if you have gone to the panel andchanged measurement or graphic parameters in themeantime. <F9> will then run the test again.
11.6. Graphic Cursors
With a graph displayed on screen (except withCGA color displays), pressing either the left or rightarrow key will cause a graphic cursor and numericdisplay areas to display on screen. These numericdisplay blocks show the exact value(s) at the inter-section of the cursor and the DATA-1 (and DATA-2, if used) curves on screen. The right-hand nu-meric display shows the exact horizontal location ofthe cursor (independent variable in most cases).The left-hand numeric display is the vertical intersec-tion of the cursor with the DATA-1 display line. IfDATA-2 (or HOR-AXIS or STEREO) is in use, thecenter numerical display shows the value of thatvariable.
The left arrow causes the cursor to first appear atthe right edge of the screen, then move to the left(downwards numerically) through the data points.The right arrow causes the cursor to appear at theleft edge and move upwards through the display.The cursor will move to and display only actual datareadings; it does not interpolate between data points.Holding down the <Ctrl> key while pressing the ar-row keys (in the numeric keypad only, not the sepa-rate arrow keys on 101-key keyboards) causes thecursor to move in steps of five data points. Holdingdown the <Shift> key while pressing the arrow keys(in the numeric keypad only, not the separate arrowkeys on 101-key keyboards) causes the cursor tomove in steps of twenty data points. Pressing<Home> will cause the cursor to jump to the ex-treme left end of the screen. <End> jumps the cur-sor to the extreme right end.
To remove the cursor from the screen, <Esc> tothe menu, then press <F7> for a re-plot.
SWEEP (F9) DEFINITIONS PANEL 11-9
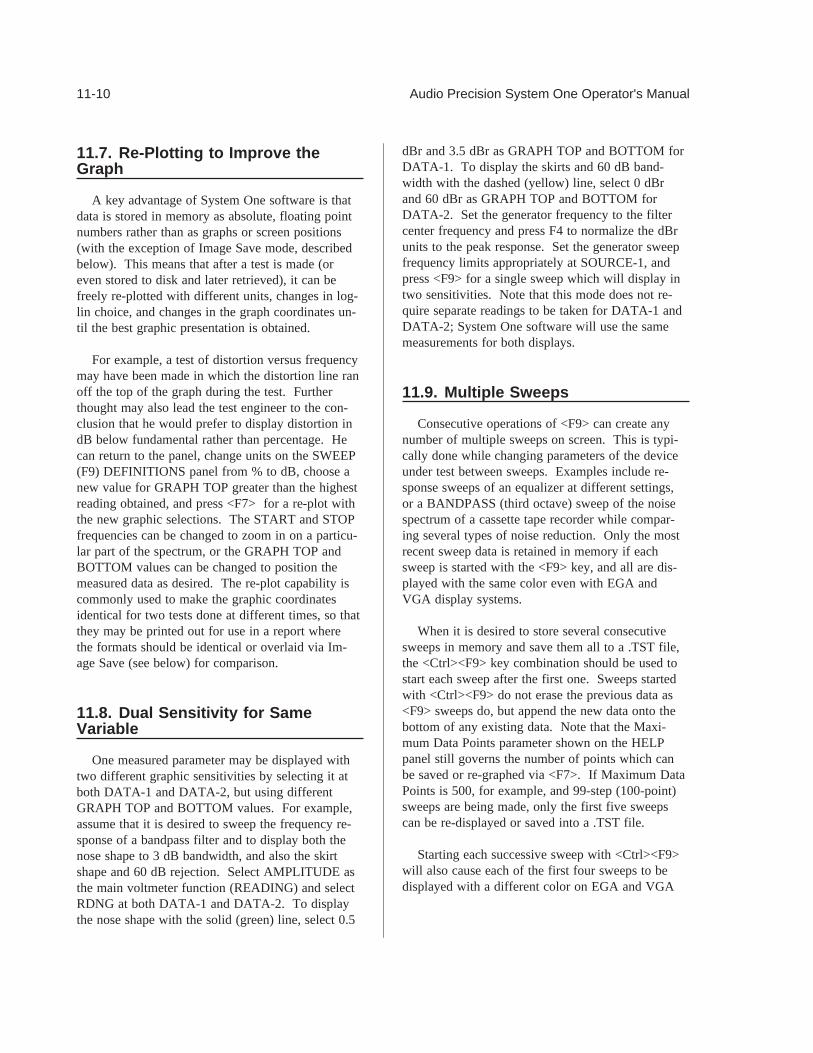
11.7. Re-Plotting to Improve theGraph
A key advantage of System One software is thatdata is stored in memory as absolute, floating pointnumbers rather than as graphs or screen positions(with the exception of Image Save mode, describedbelow). This means that after a test is made (oreven stored to disk and later retrieved), it can befreely re-plotted with different units, changes in log-lin choice, and changes in the graph coordinates un-til the best graphic presentation is obtained.
For example, a test of distortion versus frequencymay have been made in which the distortion line ranoff the top of the graph during the test. Furtherthought may also lead the test engineer to the con-clusion that he would prefer to display distortion indB below fundamental rather than percentage. Hecan return to the panel, change units on the SWEEP(F9) DEFINITIONS panel from % to dB, choose anew value for GRAPH TOP greater than the highestreading obtained, and press <F7> for a re-plot withthe new graphic selections. The START and STOPfrequencies can be changed to zoom in on a particu-lar part of the spectrum, or the GRAPH TOP andBOTTOM values can be changed to position themeasured data as desired. The re-plot capability iscommonly used to make the graphic coordinatesidentical for two tests done at different times, so thatthey may be printed out for use in a report wherethe formats should be identical or overlaid via Im-age Save (see below) for comparison.
11.8. Dual Sensitivity for SameVariable
One measured parameter may be displayed withtwo different graphic sensitivities by selecting it atboth DATA-1 and DATA-2, but using differentGRAPH TOP and BOTTOM values. For example,assume that it is desired to sweep the frequency re-sponse of a bandpass filter and to display both thenose shape to 3 dB bandwidth, and also the skirtshape and 60 dB rejection. Select AMPLITUDE asthe main voltmeter function (READING) and selectRDNG at both DATA-1 and DATA-2. To displaythe nose shape with the solid (green) line, select 0.5
dBr and 3.5 dBr as GRAPH TOP and BOTTOM forDATA-1. To display the skirts and 60 dB band-width with the dashed (yellow) line, select 0 dBrand 60 dBr as GRAPH TOP and BOTTOM forDATA-2. Set the generator frequency to the filtercenter frequency and press F4 to normalize the dBrunits to the peak response. Set the generator sweepfrequency limits appropriately at SOURCE-1, andpress <F9> for a single sweep which will display intwo sensitivities. Note that this mode does not re-quire separate readings to be taken for DATA-1 andDATA-2; System One software will use the samemeasurements for both displays.
11.9. Multiple Sweeps
Consecutive operations of <F9> can create anynumber of multiple sweeps on screen. This is typi-cally done while changing parameters of the deviceunder test between sweeps. Examples include re-sponse sweeps of an equalizer at different settings,or a BANDPASS (third octave) sweep of the noisespectrum of a cassette tape recorder while compar-ing several types of noise reduction. Only the mostrecent sweep data is retained in memory if eachsweep is started with the <F9> key, and all are dis-played with the same color even with EGA andVGA display systems.
When it is desired to store several consecutivesweeps in memory and save them all to a .TST file,the <Ctrl><F9> key combination should be used tostart each sweep after the first one. Sweeps startedwith <Ctrl><F9> do not erase the previous data as<F9> sweeps do, but append the new data onto thebottom of any existing data. Note that the Maxi-mum Data Points parameter shown on the HELPpanel still governs the number of points which canbe saved or re-graphed via <F7>. If Maximum DataPoints is 500, for example, and 99-step (100-point)sweeps are being made, only the first five sweepscan be re-displayed or saved into a .TST file.
Starting each successive sweep with <Ctrl><F9>will also cause each of the first four sweeps to bedisplayed with a different color on EGA and VGA
11-10 Audio Precision System One Operator's Manual

displays. If more than four sweeps are made withthe <Ctrl><F9> keys, the same four colors will re-peat in succession.
When the graph cursor is used on a file with mul-tiple sweeps stored by use of the <Ctrl><F9> keys,the cursor will travel through the sweeps one byone. The <Home> key can be used to jump to oneend of the data and the <End> key to the other.
A similar result to operations of the <Ctrl><F9>key can produce a multi-sweep screen display of.TST files even if the tests were separately run andsaved. This is accomplished via the APPENDTEST and APPEND DATA features. APPENDTEST will append the data from the specified .TSTfile onto the bottom of any data presently in mem-ory. APPEND DATA does a similar thing, butfrom a specified .DAT file. The data from anynumber of previously-saved tests can thus bebrought into memory for display or to be re-savedas a composite, multiple test file. With EGA andVGA systems, up to four different colors will beused to display the multiple data sets, as with<Ctrl><F9>.
Note that certain precautions must be taken if anyof the test data is not in absolute units. If data inthe file specified during APPEND TEST is in dBrunits, for example, it will be re-computed againstthe dBr REF value presently on the panel when it isloaded. Similarly, dBm data will be re-computedagainst the dBm/W REF value on the panel when itis loaded. If it is instead desired to preserve the ab-solute amplitude relationships of the data in the vari-ous files being appended, they should each bechanged to an absolute unit and re-saved to disk be-fore the APPEND TEST operation is done.
11.10. Repeated Sweeps
It is sometimes desirable to make repeatedsweeps, erasing the data from the grid at the end ofeach sweep to avoid clutter. <Alt><F9> will triggera sweep, erase, and repeat operation which is con-venient while making adjustments to the device un-der test. This repeat cycle may be terminated bypressing <Esc>. Note that this mode uses any im-
age stored in the Image Save buffer, if graphicallycompatible, or writes over it if incompatible; see theImage Save section below for more information.When it is desired to graph any attached limits viathe <Alt><F7> feature before entering the sweep,erase, and repeat operation, the <Alt><F8> com-mand must be used to store the limits into the imagebuffer. Thus, the keystroke sequence to automat-ically graph limits, store their image, and start a re-peating sweep cycle is:
<Alt><F7> <Alt><F8> <Alt><F9>.
With EGA and VGA display systems, the storedimage will be monochrome even when normal dis-plays are in color.
Sweep-erase-repeat mode (<Alt><F9>) and Im-age Save mode (<Alt><F8> and <F8>) are not func-tional if the software was started with the /8 com-mand line option to conserve memory.
11.11. Stereo Mode, Nested Sweeps,and Measurements on the HorizontalAxis
The DATA-2 line contains three other choices formeasurement and plotting flexibility. STEREOmode permits two-channel devices to be tested moreefficiently. SOURCE-2 permits two types of pa-rameters to be swept in a test, with one “nested” in-side the other. For example, generator frequencymay be swept from 20 Hz to 20 kHz at one ampli-tude; the amplitude may then be automatically in-creased by a specified amount, another frequencysweep made, the amplitude increased again and fre-quency swept again, etc. HOR-AXIS mode on theDATA-2 line permits two measured values to beplotted against one another, rather than plotting bothas dependent variables versus an independent vari-able such as generator amplitude. Each of thesemodes is discussed below.
SWEEP (F9) DEFINITIONS PANEL 11-11

11.11.1. Stereo Mode
Selecting STEREO instead of DATA-2 producestwo different types of operation, depending onwhether an EXTERNal sweep or a GEN-ANLR-SWI-DCX-DSP sweep has been selected atSOURCE-1.
11.11.1.1. Generator-Based StereoSweeps
When a generator (or analyzer BPBR filter orswitcher or DCX) sweep has been selected asSOURCE-1 and STEREO mode is selected, SystemOne will automatically make two successive sweepsof the stimulus. The first sweep will be made withthe generator output channel selection and analyzerinput channel selection as set up on the GENER-ATOR and ANALYZER panels. This first sweepwill be plotted in the usual DATA-1 conventions(solid line monochrome, green line color, 2nd col-umn if table). At the conclusion of the first sweep,System One will automatically switch generator out-put channels and analyzer input channels as requiredto perform the identical test on a second channel ordevice, plotting the results in the usual DATA-2 con-ventions (dashed line monochrome, yellow linecolor, 3rd column if table). Both sets of data arestored in the same xx.TST file and will be re-graphed simultaneously when <F7> is pressed, eventhough they were measured sequentially. Both chan-nels may have limits files attached to them, and thelimits need not be the same (see ACCEPTANCETEST LIMITS chapter).
The same units would normally be used for bothchannels of a stereo device. The COMPUTE EX-CHANGE menu command or its “shorthand” equiva-lent, <Alt><X>, can simplify this. At DATA-1, se-lect the desired parameter (RDNG, LEVEL, etc.)and enter the desired GRAPH TOP and BOTTOM,LOG-LIN selection, and # DIVS. Move the cursorto the STEREO (DATA-2) line and select the sameparameter (RDNG, LEVEL, etc.). Press <Alt><X>and the GRAPH TOP and BOTTOM, LOG-LIN,and # DIVS will be automatically copied into thesefields. Since COMPUTE EXCHANGE (<Alt><X>)also exchanges any data in the DATA-1 and DATA-2 fields, it may be desirable to press <Alt><X> a
second time if the test has already been run to re-store the data values to their original columns. Seethe COMPUTE EXCHANGE description in theMENU chapter for more details.
The two channels may also have their units,GRAPH TOP, and GRAPH BOTTOM selected inde-pendently. This independent selection of GRAPHTOP and BOTTOM for the two channels permitseither overlaying of the two channels or deliberatelyseparating them by any desired amount to preventone line from obscuring data of the other. For exam-ple, a stereo amplifier frequency response sweepmight be made with +1.0 dBr and -1.0 dBr asGRAPH TOP and BOTTOM for DATA-1, but +0.9dBr and -1.1 dBr chosen on the STEREO (DATA-2) line to cause an 0.1 dB offset between the twosets of data. When different GRAPH TOP andBOTTOM values are selected for the second chan-nel, a separate set of calibration marks will appearalongside the right margin of the graph. When bothchannels use the same calibration, no calibrationmarks will be displayed on the right.
If A was selected on the GENERATOR panel asthe output configuration of a STEREO sweep, Bwill be automatically selected during the secondsweep. Similarly, if B were selected on the panel,A will be used during the next sweep. If the gener-ator output configuration is set on the GENER-ATOR panel to OFF, A&B, or A&-B, no generatorchange takes place between the two sweeps in STE-REO mode.
Whichever analyzer input channel is selected atthe top of the ANALYZER panel will be inter-changed with the other channel on the second sweepin STEREO mode. At the CHANNEL-A andCHANNEL-B INPUT lines further down the ANA-LYZER panel, no change will be made betweensweeps if both channels have INPUT or GEN-MONitor selected on the panel. If, however, onechannel is set to GEN-MONitor and the other to IN-PUT, the selections will be interchanged during thesecond sweep.
These interchange conventions not only permitstereo device tests such as frequency response orthd+n versus frequency, but also support stereo cros-
11-12 Audio Precision System One Operator's Manual

stalk measurements and tests of input-output phasevariations on stereo amplifiers. With units with se-rial number SYS1-20300 and higher, the 2-CHAN-NEL and CROSSTALK modes present improved al-ternate methods of making frequency response andcrosstalk measurements on stereo devices.
11.11.1.2. External Stereo Sweeps
External sweep mode is commonly used with un-controllable (or only semi-controllable) signalsources such as pre-recorded test tapes, test compactdiscs, or a network feed from a continuously-cyclingstep tone oscillator. Most such sources are designedfor slow, manual methods of audio measurementand thus dwell at each frequency for times rangingfrom 10 or 20 seconds to one minute. One to threeseconds is typically adequate for System One tomeasure response or phase or distortion on bothchannels of a stereo system. Thus, the logic behindSTEREO mode with EXTERNal sweep is for agiven parameter to be measured on both channelsduring a single pass.
In this mode, System One will measure the speci-fied SOURCE parameter (frequency for EXTERNFREQ sweeps, amplitude for EXTERN LEVELsweeps) from the ANALYZER-panel-selected chan-nel until it settles within definitions of the SWEEPSETTLING panel as described later in this section.System One then measures the parameter specifiedat DATA-1 until the data is settled, automaticallytoggles the analyzer input to the opposite channel,and measures the DATA-2 parameter until it settles.Following settling on the second channel, SystemOne switches back to the first (ANALYZER panel-selected) channel and waits for the SOURCE pa-rameter to change by more than the SPACINGvalue entered at the bottom of the SWEEP (F9)DEFINITIONS panel; it then repeats the cycle.Both channels will be plotted simultaneously, eventhough the measurements are actually being made insequence.
Crosstalk and stereo separation from externalsources can be measured by two methods with hard-ware after serial number SYS1-20300 and onemethod with hardware prior to s/n SYS1-20300.With either hardware version, if BANDPASS mode
is selected at the top of the ANALYZER panel, Sys-tem One will measure the incoming signal fre-quency and steer the bandpass filter to that fre-quency while measuring the panel-selected channel.Thesignal-driven channelmust thus be selected onthe ANALYZER panel. After settling, System Oneswitches to the alternate channel, keeping the band-pass filter fixed at the same frequency. The driven(panel-selected) data is displayed with DATA-1 con-ventions and the non-driven channel is displayedwith DATA-2 conventions. The actual crosstalk orseparation is the difference between the two lines onthe graph. Use of bandpass mode permits measure-ment of crosstalk below wideband noise level onplayback-only tape machines such as videotape re-corders.
With System One s/n SYS1-20300 or higher,STEREO mode is no longer necessary when measur-ing crosstalk or separation from EXTERNal sources.Instead, CROSSTALK function may be selected andthe desired unit (usually dB or X/Y) selected on theREADING line. Thenon-drivenchannel must be
Figure 11-6 Sweep Test Panel for Channel Balance,Original Hardware
SWEEP (F9) DEFINITIONS PANEL 11-13

Figure 11-7 Typical Display, Channel Balance Adjustments with Original Hardware
Figure 11-8 Nested Sweep Frequency Response of Cassette Recorder at Four Amplitudes
11-14 Audio Precision System One Operator's Manual

selected on the ANALYZER panel, since CROS-STALK function automatically connects the LEVELmeter and frequency counter to the alternate channeland the principal (READING) voltmeter, in band-pass mode, to the channel selected on the ANA-LYZER panel. By selecting RDNG as DATA-1,the crosstalk will be plotted as the EXTERNalsweep progresses. No channel toggling is involvedand the graph plotted will not need further correc-tion in the case of non-flat frequency response, sinceeach measurement is the difference between the am-plitudes on the two channels.
11.11.1.3. Channel Balance Adjust-ments
Channel balance adjustments, to cause equal lev-els from both channels of a stereo system, are a fre-quent need. One example is a head height adjust-ment on a stereo tape recorder, while playing a refer-ence tape.
With units of serial number SYS1-20300 andhigher, 2-CHANNEL function provides a superiorway of making such balance adjustments. 2-CHAN-NEL function connects the READING voltmeter tothe selected channel and the LEVEL voltmeter tothe alternate channel. They may then both be dis-played simultaneously in bar-graph mode by select-ing RDNG and LEVEL as DATA-1 and DATA-2and pressing the <F2> key. Alternately, dB or X/Ymay be selected as the READING unit, RDNG se-lected as DATA-1, <F2> pressed, and the balanceadjustments made for zero dB (or a 1:1 ratio).
With hardware below serial number SYS1-20300,channel balance adjustments can be facilitated witha repeating one-step ANLR BPBR “sweep” atSOURCE-1, with STEREO mode instead of DATA-2. See Figure 11-6 for the panel setup. The<Alt><F9> key will start a continuous sweep-erase-repeat sequence. The generator and analyzer chan-nel selection will be toggled at each step, with the Achannel data plotted as a solid (green) line and the Bchannel data as a dashed (yellow) line. These two
NESTTEST 01 JUN 86 09:33:25FREQ(Hz) AMPL(dBu) AMPL(d
20.0000 kHz -29.75 dBu -30.00 dBm2.00000 kHz -29.47 dBu -30.00 dBm200.000 Hz -29.31 dBu -30.00 dBm20.0000 Hz -29.27 dBu -30.00 dBm20.0000 kHz -19.73 dBu -20.00 dBm2.00000 kHz -19.44 dBu -20.00 dBm200.000 Hz -19.30 dBu -20.00 dBm20.0000 Hz -19.25 dBu -20.00 dBm20.0000 kHz -9.72 dBu -10.00 dBm2.00000 kHz -9.44 dBu -10.00 dBm200.000 Hz -9.31 dBu -10.00 dBm20.0000 Hz -9.26 dBu -10.00 dBm20.0000 kHz 0.21 dBu 0.00 dBm2.00000 kHz 0.55 dBu 0.00 dBm200.000 Hz 0.67 dBu 0.00 dBm20.0000 Hz 0.72 dBu 0.00 dBm
Figure 11-9 Sweep Test Definition Panel and Table Display, NestedSweep
SWEEP (F9) DEFINITIONS PANEL 11-15

input channels will be alternately measured and plot-ted as often as the SETTLING panel conditions per-mit. Bandpass measurement mode is not used, sothe measured data is not affected by the filter“sweep”; this is merely a method of obtaining rapidchannel switching and display of both channels.The device under test is then adjusted until the am-plitudes on the two stereo channels are equal. SeeFigure 11-7 for a typical display during such adjust-ments.
11.11.2. Plotting Measurements onthe Horizontal Axis
The most common graphic format in System Oneis with the independent variable (typically generatorfrequency, generator amplitude, or time) along thehorizontal axis and one or two measured parameterscalibrated along the vertical axis. For certain meas-urements, it is desirable to plot one measured pa-rameter versus another as an x-y plot. For example,it is very useful to provide an amplitude sweep at afixed frequency to the input of an amplifier or taperecorder while measuring both distortion and ampli-tude at the device output. It may then be desired toplot distortion versus output amplitude of the de-vice, not showing the stimulus amplitude at all.This is accomplished by changing from DATA-2 toHOR-AXIS at the center of the panel. The analyzerfunction selection on this line will be plotted hori-zontally on the graph, with the parameter selected asDATA-1 plotted vertically.
11.11.3. Nested Sweeps
The SOURCE-2 selection on the DATA-2 line of-fers the capability of nesting a generator amplitudesweep inside a generator frequency sweep or vice-versa; nesting a generator frequency sweep inside ascan through switcher positions; nesting an analyzerbandpass filter sweep inside a generator frequencysweep; nesting a frequency sweep inside steps ofcontrol voltage (DCX-127 DCOUT) of a VCA, andother such combinations. An example graph of acassette tape deck measurement with nested sweepsin shown in Figure 11-8, consisting of four 50 Hz to15 kHz sweeps, each at an amplitude ten dB higher
than the previous. On an EGA or VGA color dis-play, each sweep in the nest will be displayed with adifferent color, up to four sweeps. The colors willthen repeat.
Nested sweeps are created by use of theSOURCE-1 line and the DATA-2/SOURCE-2 lineof the SWEEP (F9) DEFINITIONS panel. If a FRE-Quency sweep has been selected for GEN on theSOURCE-1 line, it can be nested inside an ampli-tude sweep by changing from DATA-2 to SOURCE-2, and selecting GEN AMPL to the right ofSOURCE-2. Enter the desired amplitude for thefirst sweep into the GRAPH BOTTOM field and theamplitude for the last sweep into the GRAPH TOPfield. Use the # STEPS field to select the numberof steps of amplitude which will be made betweenthe first and last sweeps, and select TYPE LOG orLIN to control the type of progression betweenthose amplitudes. For example, if GRAPH TOP is0 dBm, GRAPH BOTTOM is -30 dBm, TYPE isLIN, and # STEPS is 3, the result will be foursweeps through the frequency range selected on theSOURCE-1 line—the first at a generator output am-plitude of -30 dBm, the second at -20 dBm, thethird at -10 dBm, and the last at 0 dBm. See Figure11-9 for a SWEEP (F9) DEFINITIONS panel setup for a nested sweep with the example just de-scribed, and for an example of the screen display ifDISPLAY TABULAR were selected. Note thatwith the TABULAR display (or when examiningdata in the Edit Data mode), the third column indi-cates the value of the “outer loop” of the nest, ascontrolled by the SOURCE-2 parameters.
GEN AMPL can be selected as SOURCE-1 andGEN FREQ as SOURCE-2 to nest an amplitudesweep inside a frequency sweep. Similarly, an am-plitude or frequency sweep can be nested inside aswitcher scan to perform the same test on manychannels of a multi-channel device; see theSWITCHER chapter for more details.
A key difference between a nested sweep and aseries of individual tests combined via Image Save(see below) is that all the data from all sweeps in anested sweep are stored in one standard xx.TST file.The multiple sweeps can thus all be retrieved with asingle Load Test operation and re-plotted with a sin-
11-16 Audio Precision System One Operator's Manual

gle <F7> keystroke, and after-the-fact changes ingraphic units and coordinates can be made just asthey can with a single sweep. Since a nested sweepis a standard xx.TST file, the total number of pointsin all the nested sweeps cannot exceed the Maxi-mum Data Points value (viewable on the HELPpanel).
When the graph cursor is used with a nestedsweep test, the right-hand numeric display will showthe SOURCE-2 value for each sweep while the leftnumeric display shows the actual data value.
With the normal start-up procedure and a large-memory computer, the MAXIMUM DATAPOINTS value is 1,089 points. Thus, a 30 step fre-quency sweep with a 30 step amplitude sweepnested inside it could be run (though it would takequite a long while to run), but a 50 step frequencysweep could not have more than approximately 20amplitude steps nested inside it. When more than1089 total points are required, S1 software can beloaded with the /B option to specifically set buffersizes as needed. See the “Controlling Memory Us-age” section of the CREATING YOUR CUSTOMSOFTWARE START-UP PROCESS chapter formore information.
If the data from a nested sweep (or APPENDTEST or APPEND DATA operations) is examinedwith the Edit Data capability, it will be seen that theend of one sweep and beginning of the next is signi-fied with an artificial data row consisting of a dupli-cation of the ending value of the independent vari-able in the first column and an extremely large nega-tive number (-1.000E32) in the second and third col-umns. When graphing data, this row signifies toSystem One that it should move (but not draw a vec-tor) to the following point and then continue plot-ting data. With EGA and VGA color displays, thetrace color is also changed each time this row isreached. This “move but don’t draw” capabilitymay be useful in applications other than nestedsweeps, and a data row of this description could beentered into any file in Edit Data mode to obtain thesame function.
A useful application of an amplitude sweepnested inside a frequency sweep is testing compres-sors and other processors such as noise reductionunits. Select AMPLITUDE as the main MEASUREREADING on the ANALYZER panel and RDNG atDATA-1. Select GEN FREQ at SOURCE-1 withthe desired start and stop frequencies. A family ofcurves of frequency response at levels from belowthe compression threshold to levels well into com-pression can then be run as one test by selectingSOURCE-2 GEN AMPL and properly selecting theGRAPH TOP and BOTTOM amplitudes and the #STEPS.
A frequency sweep nested inside an amplitudesweep is useful in determining the maximum outputlevel (MOL) of a tape recorder. The SOURCE-1area is used to select a GEN AMPL sweep and setthe amplitude limits and number of steps for a testwhich will show the tape and tape machine distor-tion. The DATA-2 line can then select a GENFREQ sweep with, for example, a LOG TYPE, 20Hz for GRAPH BOTTOM, 20 kHz for GRAPHTOP, and 3 for # STEPS. The test will then runfour consecutive amplitude sweeps, at 20 Hz, 200Hz, 2 kHz, and 20 kHz.
11.12. Overlaying Graphs
As noted earlier, repeated operations of the <F9>key can build up any number of sweeps on screenwhen the difference between them results fromchanges to the device under test, such as testing anumber of different settings of an equalizer.<Ctrl><F9> can be used if they are all to be savedor re-graphed via <F7>. Append Test can be usedto make composite graphs of the results of two ormore different tests already saved.
The graphics Image Storing capability can beused to make composite graphs, with a different setof advantages and disadvantages compared to the<Ctrl><F9> and Append Test method.
The image store and retrieve capability involvesthe use of two additional controls:
SWEEP (F9) DEFINITIONS PANEL 11-17

• <Alt><F8> (hold down the <Alt> key whilepressing the <F8> key) to store graphics im-age of the present screen into computer mem-ory
• <F8> to retrieve the stored graphics image tothe screen
After an image has been brought to the screen,the <F7> key will plot data from memory onto it ifthe graph coordinates match. Similarly, the <F9>key will cause new test data to plot onto the imageif the graphic coordinates match. Matching graphiccoordinates refer to the sweep start and stop points,log-lin selection on horizontal and vertical axes,units on horizontal and vertical axes, and graph topand bottom lines. Even small deviations from thesaved image will prevent the graphs from overlay-ing. Typical problems include having a DATA-1 orDATA-2 LOG selection but with dB units with azero or negative GRAPH TOP or BOTTOM. Inthis case, a linear plot will result but overlay will bedenied if one test is set for LIN and the other forLOG. If the stored image and the panel do notmatch in graphic coordinates, a new graph will bedrawn; the stored image still remains in memory tobe retrieved later with the <F8> key.
With VGA and EGA display systems, the storedimage will be monochrome even though COLOR-GRAPH was selected for DISPLAY. This limita-tion was necessary due to the large amount of mem-ory required to store high-resolution color displayswith a large number of available colors.
The image store function will not work ifS1.EXE was loaded with the /8 option in order toconserve memory.
An example may be the best way to explain theuse of image store. Assume that monthly tests havebeen made for four months of the frequency re-sponse of a tape machine, and it is desired to see allfour graphs overlaid to look for deterioration trends.Also assume that all four monthly tests were madeby loading the same xx.TST file as a setup file, run-ning the test, and then saving under filenames suchas RESP_JAN.TST, RESP_FEB.TST,
RESP_MAR.TST, and RESP_APR.TST. The testswill thus all have identical graphic coordinates,since they were made with the same setup file.
First, Load Test RESP_JAN.TST and use <F7>to graph the data. Press <Alt><F8> to store thegraphic image to computer memory. Then, <Esc>Load Test RESP_FEB.TST, press <F8> to bring thestored graphic image (January data) to the screen,and press <F7> to plot the stored test from Februaryonto the stored graphic image. When it has plotted,press <Alt><F8> to store the composite combina-tion of the two to computer memory. Similarly,<Esc> Load Test RESP_MAR.TST, bring the com-posite image to screen with <F8>, plot the Marchdata onto it with <F7>, and store the new three-graph composite back to computer memory with<Alt><F8>. Any number of matching-coordinategraphs can be combined in this fashion, with the re-sulting image printed if desired.
Note that an error message “Saved Image NotCompatible With Graphics Mode” will be obtainedin a display system when <F8> is pressed if thestored image (color graph or monochrome graph)format does not match the current panel displaymode (display color-graph or display mono-graph).
The APPEND TEST and APPEND DATA com-mands (see the MENUS chapter) provide an alter-nate approach to creating composite graphs. TheAPPEND commands may be easier to use sincethey do not require the identically-matched graphiccoordinates and graphics modes of Image Store. Af-ter appending several sets of data, the graphic coordi-nates or mode (color-monochrome-table) may bechanged and the entire set of tests re-graphed via<F7>. Image Store, in contrast, permits no changesafter the first image is stored. However, APPENDTEST and APPEND DATA will re-interpret anydata not saved in absolute units (dBm and dBr, forexample), while Image Store is only a graphic tech-nique which will not tamper with data or references.Furthermore, Image Store has no “Maximum DataPoints” limitations and will thus support overlay ofany number of tests with any number of points pertest.
11-18 Audio Precision System One Operator's Manual

11.13. External Sweeps
EXTERNal sweep mode uses as the independentvariable external signals which step or continuouslyvary in frequency or amplitude from high to low orlow to high, or which go through a repetitive cycle.The START and STOP values selected on the panelin EXTERNal sweep mode determine the graphichorizontal limits and calibration, and the direction inwhich plotting will take place. Measurements willbe made (but not plotted) outside those values if theexternal test source includes tones outside thatrange. If the external signal moves in the oppositedirection to that implied by the choice of STARTand STOP values, data will be taken but no line willbe plotted between those points. This feature per-mits EXTERNal sweep mode to be used even withcontinuously recycling sweeps without any re-traceline being plotted across the graph.
Measurement of AMPLITUDE or LEVEL, FRE-Quency, and PHASE may be made on eitherstepped or continuously analog-swept (glide tone)external signals. Select EXT SOURCE 1 SAMPLEon the SWEEP SETTLING panel for continuousanalog-swept (“glide tone”) signals so that the exter-nal source (frequency or level) will be measuredeven though no two consecutive values agree.THD+N tests require a stepped external signalwhich dwells at each value for approximately onesecond or more, depending on the sweep settling pa-rameters selected. The exact required dwell time de-pends on the signal frequency (more time requiredat low frequencies), reading rate, whether there is anoff period with no signal between tones (more timerequired because System One will autorange downto the off level, then back up to the signal level),and on the parameters selected on the SWEEP SET-TLING panel; see the SWEEP SETTLING sectionbelow.
EXTERNal sweep performs the following func-tions (assuming a frequency sweep):
1. Measures frequency with the analyzercounter until the frequency measurementsare stabilized within the conditions specifiedon the SWEEP SETTLING panel.
2. Waits for the specified SETTLING DE-LAY.
3. Verifies that signal amplitude as meas-ured with the LEVEL voltmeter is above theMIN LVL voltage.
4. Measures the parameters selected byDATA-1 and DATA-2 until data settles.
5. Draws lines on the graph from the pre-vious data point to this data point and soundsthe “bell”.
6. Monitors frequency until it changes fromthe previous frequency measurement bymore than the SPACING percentage enteredin the SOURCE-1 area; when it does, goesto step 1 and repeats the cycle.
Unless extremely flat frequency response beyond50 kHz is required during EXTERNal frequencysweep measurements, it is recommended that the 80kHz low pass filter or even the 30 kHz or 22 kHz fil-ters be selected. Selecting any of these three low-pass filters also causes a low pass filter prior to theanalyzer frequency counter to be selected, which im-proves the counter’s ability to quickly acquire andaccurately measure the signal frequency under noisyconditions. Since EXTERNal frequency sweepmeasurements are totally dependent on these fre-quency measurements to drive the test and calibratethe data, selecting a low pass filter improves bothtest speed and data quality.
If EXTERNal LEVEL sweep is selected, it per-forms the following functions:
1. Measures amplitude with the LEVEL me-ter until the measurements are stabilizedwithin SWEEP SETTLING panel specifiedconditions.
2. Waits for the specified SETTLING DE-LAY.
3. Verifies that signal amplitude as meas-ured with the LEVEL meter is above theMIN LVL voltage.
4. Measures the parameters selected byDATA-1 and DATA-2 until data settles.
SWEEP (F9) DEFINITIONS PANEL 11-19

5. Draws lines on the graph from the pre-vious data point(s) to this (these) datapoint(s) and sounds the “bell”.
6. Monitors LEVEL voltmeter amplitude un-til it changes from the previous measurementby more than the SPACING percentage en-tered in the SOURCE-1 area; when it does,goes to step 1 and repeats the cycle.
If STEREO is selected instead of DATA-2, thesystem will first measure and settle the SOURCEvalue as described in either frequency or amplitudecases above, apply SETTLING DELAY, measureand settle the DATA-1 parameter, switch to the alter-nate channel, again apply SETTLING DELAY,measure and settle the parameter selected on theSTEREO/DATA-2 line, switch back to the selectedchannel to verify that the SOURCE is still within itstolerance from the value which started this set ofmeasurements, plot the data, and then monitor theSOURCE for a change greater than the SPACINGpercentage. If the source parameter was not stillwithin tolerance upon the verification after DATA-2measurement, the system will plot only DATA-1 onthe assumption that the source may have shiftedsometime during the DATA-2 measurement.
In the typical test disk or test tape situation of amid-band reference signal preceding the start of afrequency-stepped or analog-frequency-swept seriesof tones, select the START and STOP values to im-ply the direction of frequency sweep which the testsignal will take following the reference signal. Sys-tem One will then measure the mid-band referencetone (unless it is the same frequency as the GENER-ATOR panel FREQUENCY value), but will not plotthe transition from this mid-band value to the start-ing frequency since it will be opposite to the direc-tion implied by START and STOP selection. If am-plitude measurements are to be expressed in dBrunits, the <F4> key may be pressed or invoked by aprocedure while the reference portion is playing.Test tapes or disks with voice announcements ofeach frequency or level are typically usable with thismode, since the measurements cannot settle duringthe voice portions.
Three different modes of external sweep testsmay be run, selected by pressing <F9>, <Alt><F9>,or <Shift><F9>. External sweeps begun with <F9>will accumulate data until terminated with the<Esc> or <Enter> key. If, for example, the signal isa continuously recycling frequency sweep, multipleplots will be made until the operator halts the test.If the test tone proceeds in an increasing direction(for example, 50 Hz, 100, 500, 1000, 5000, 15000,50, 100, etc.), 50 Hz should be selected as STARTand 15,000 (or 20,000) Hz selected as STOP. Eachupwards transition will then be plotted, but the tran-sition (retrace) from 15,000 to 50 Hz will not beplotted since it takes place in the opposite directionto that specified by START and STOP.
If the test is started with <Alt><F9>, a sweep-erase-repeat mode will take place. If the externaltest signal is a continuously-repeating sweepthrough the frequencies in the example given above,the graph will be plotted from 50 Hz to 15,000 Hz,no retrace line will be drawn from 15,000 to 50 Hz,and the data line (but not the grid) will be erasedwhen the 50 Hz to 100 Hz transition is plotted.This mode is designed for adjustments to be madewhile the external signal repeatedly sweeps, eliminat-ing the clutter which would result in <F9> modewith all previous graphs remaining on the screen.Typical applications are amplitude measurementsfrom a three-head (simultaneous record-playback)tape recorder while adjusting bias or equalization, orphase difference measurements between two tracksof a tape recorder in playback mode while adjustinghead azimuth. The sweep-erase-repeat mode willcontinue until terminated via <Esc> or <Enter> key.Sweep-erase-repeat mode will not function ifS1.EXE was started with the /8 option to conservememory.
The <Shift><F9> mode of external sweep is de-signed for use during procedures. It differs from thetwo other external sweep modes in that it automat-ically terminates the test, and will thus move on tothe next test in a procedure, whenever the externalsignal makes a frequency transitionin the oppositedirection to that implied by the START and STOPfrequencies, to the frequency set in the GEN FRE-QUENCY field on the GENERATOR panel. Thismode is intended for use with known external sig-
11-20 Audio Precision System One Operator's Manual

nals, such as a test tape previously recorded by useof System One, or with a test compact disc wherethe frequency of the next tone following a frequencysweep or set of steps is known.
When making a test tape for this mode with Sys-tem One, a generator-based frequency sweep willnormally be set up on the SWEEP (F9) DEFINI-TIONS panel; it is common to leave the GENER-ATOR panel FREQUENCY set at a mid-band valuesuch as 1 kHz. If the tape is allowed to continue re-cording for another few seconds following comple-tion of the sweep, the result will be a period ofsteady tone at the GENERATOR panel frequency.It is the frequency-reversal from the sweep endpoint to this steady tone at the GENERATOR panelfrequency which then serves as the signal to halt the<Shift><F9> external sweep during execution of aprocedure. If the test source is already created (suchas a compact test disc with a series of tracks at dif-ferent frequencies), the signal frequency on the trackfollowing the last of the frequency-step seriesshould be determined and entered as the GENER-ATOR panel FREQUENCY when creating and sav-ing the EXTERNal sweep test for use in a procedure.
SWEEP (F9) DEFINITIONS PANEL 11-21

11-22 Audio Precision System One Operator's Manual

12. SWEEP SETTLING
12.1. The Settled Reading Problem
Automated measurement hardware is capable ofgenerating rapid streams of questionable or totallyerroneous data. This is due to the fact that readingrates and data transfer rates of ac measurement in-struments are normally faster than the time requiredfor the analog portions of the instrument to settle tospecified or ultimate accuracy. Furthermore, manyaudio devices being tested have even longer settlingtimes; compressors, limiters, and other types of sig-nal processors can have decay or release times ofseveral seconds. Three-head tape recorders, in re-cord-playback mode, have a time delay of typicallyhundreds of milliseconds between the heads, syn-chronous satellite up-and-down links have a delay ofapproximately 250 milliseconds, and audio time de-
lay units may have delays of seconds. A knowledge-able audio test engineer using manual instruments al-lows for settling times and time delays. Each timehe changes stimulus, he waits for the indicated meas-urement to stabilize before he writes down thenumber. System One software performs similar ac-tions to guarantee the integrity of the measurementstaken. The engineer setting up System One panelsand creating tests has control over how the systemdefines a settled measurement, via the SWEEP SET-TLING panel.
Figure 12-1 Sweep Settling Panel
12-1

12.2. Sweep Settling Control Panel
The SWEEP SETTLING panel (Figure 12-1) canbe interchanged with the panels normally in placevia the <Pg Dn> and <Pg Up> keys. <Pg Up> and<Pg Dn> will interchange the entire set of threepanel sections on screen (typically GENERATOR,ANALYZER, and SWEEP (F9) DEFINITIONS),with three other lesser-used panels. By using<Ctrl><Pg Up> and <Ctrl><Pg Dn>, it is possibleto bring an off-screen panel section from one of the“lower pages” onto the screen in place of the panelsection where the cursor is located. The system willrotate through the still-lower off-panel screens, al-lowing you to produce any combination of panelson screen that you wish. <Ctrl><Home> will returnyou to the original default combination of GENER-ATOR at the left, ANALYZER in the center, andSWEEP (F9) DEFINITIONS at the right, with thecursor on the GENERATOR OUTPUT field.
The sweep settling concept is to continually ex-amine the series of measurement samples comingfrom the hardware. The rate at which the samplesarrive is determined by the reading rate selected onthe DETECTOR line of the ANALYZER panel. IfAUTO is selected on that line, an algorithm will se-lect the reading rate as a function of the present fre-quency during GEN and ANLR BPBR sweeps. Thesoftware makes comparisons between the most re-cent measurement sample and several immediately-prior samples, and finally accepts the newest meas-urement sample (and allows the stimulus to proceedto the next value) only when all those comparisonsfall within specified limits.
The limits for each major type of measurementparameter are independently determined by a select-able tolerance and/or resolution value. AMPL (am-plitude), LVL (level), THD (total harmonic distor-tion plus noise), IMD (intermodulation distortion),FREQ (frequency), W+F (wow and flutter), DCV(DCX-127 dc voltmeter), OHMS (DCX-127 ohmme-ter), and D-IN (DCX-127 digital input) each haveboth a tolerance and a resolution value; PHASE hasonly a resolution value. Note that AMPL refers toall amplitude functions of the principal voltme-ter—AMPLITUDE, BANDPASS, BANDREJECT,the THD+N function when used with absolute units
such as V, dBu, dBm, dBr, and Watts, and (withunits after s/n 20300) CROSSTALK and 2-CHAN-NEL.
The consecutive number of samples which willbe compared is determined by the DATA SAM-PLES value. The SETTLING line permits selectionof three modes of control of the settling process.EXPONENTIAL causes an exponentially-shaped“window”, with height determined by the TOLER-ANCE parameter, to be applied backwards from thelatest data sample. EXPONENTIAL is the recom-mended selection for most applications, since mosttransient signals settle in an approximately exponen-tial fashion. FLAT extends the specific TOLER-ANCE value backwards horizontally and will pro-vide the most-settled (but slowest) data. AVGcauses a calculation to be made of the average ofthe number of samples specified, with the computedaverage value then plotted and saved. This is par-ticularly helpful with noisy signals. OFF disablesthe settling function entirely, permitting plots of val-ues such as peak noise, wow and flutter, and phasejitter.
If DATA 6 SAMPLES is selected, each measure-ment sample will be compared to the five previoussamples with the EXPONENTIAL or FLAT “win-dow” defining the comparison standards. If SET-TLING is EXPONENTIAL and a TOLERANCE of
SAMPLES
LATESTPRECED2NDPRECED
3RDPRECED
4THPRECED
5THPRECED
+16%
+ 8%
+ 4%+ 2%
-16%
- 8%
- 4%- 2%± 1%
Figure 12-2 Sweep Settling Diagram
12-2 Audio Precision System One Operator's Manual

1% is specified, as illustrated in Figure 12-2, themost recent data point will be plotted and the stimu-lus permitted to step to the next value only when:
• the two most recent samples agree within 1%
• the most recent and the second preceding sam-ples agree within 2%
• the most recent and the third preceding sam-ples agree within 4%
• the most recent and the fourth preceding sam-ples agree within 8%
• the most recent and the fifth preceding sam-ples agree within 16%
As with any digital display instrument, digitalresolution (“plus-or-minus one count error”) can be-come a limiting factor when measurements are madevery near the bottom of the instrument’s dynamicrange. This fundamental resolution limitation due tothe digitization process can exceed the TOLER-ANCE value when very low values of a parameterare being measured. To keep this factor from pre-venting settling, “floor” values are specified by theRESOLUTION values for each major measurementparameter. If the RESOLUTION value is largerthan the TOLERANCE percentage multiplied by theactual measurement, the system uses the RESOLU-TION value instead of the TOLERANCE value,multiplies it by an amount determined from the EX-PONENTIAL or FLAT algorithm, and makes its de-cision on that particular comparison.
12.2.1. Recommended Values
The EXPONENTIAL selection matches the set-tling curves of many real-world devices and is use-ful for most types of measurements. The defaultTOLERANCE values are also selected as best esti-mates of the settling and accuracy required in mosttypical audio measurements. The AMPL and LVLdefault tolerances of 1% (approximately 0.1 dB)may need to be considerably tightened, however,when measuring the flatness of System One itself orcomparably flat external devices. Values of 0.1%(approximately 0.01 dB) or even tighter may becalled for under such circumstances. On the other
hand, if a particular test is measuring noise or anoisy signal such as crosstalk, a tolerance of 5%(0.5 dB) to 10% (1.0 dB) may be appropriate.
12.3. Averaging for Noisy Signals
Rather than examining successive readings anddiscarding them until they agree within the specifiedtolerance, the settling algorithm can also average to-gether a specified number of successive readingsand plot the computed average. This mode is se-lected by the AVG selection as an alternate to EX-PONENTIAL or FLAT. When AVG is selected anda sweep begun, the algorithm will first wait out theSETTLING DELAY value. It will then acquire andaverage together the number of consecutive readingsfrom the hardware which is specified in the DATASAMPLES field. This average value will be plot-ted, the SOURCE-1 parameter will step to its nextvalue, and the delay and averaging process repeated.
When AVG is selected, the minimum value usedfor SETTLING DELAY should be 200 millisec-onds. In usual SOURCE-1 sweeps of generator pa-rameters or the analyzer bandpass filter, a transientis caused at each SOURCE-1 step. A SETTLINGDELAY shorter than 200 ms will result in that tran-sient data being included in the averaged data, pro-ducing an erroneous result. Shorter delays, such as30 ms, are usable in the settled modes (EXPONEN-TIAL or FLAT) since the settling process itself dis-cards older samples until a succession of samplesfits within the specified tolerance.
The number of samples selectable for AVG modecan be from 1 to 99. Note that the maximum entryin this same field for EXPONENTIAL or FLATmodes is 6. Thus, you will receive an error messagewhen changing from AVG to either of the settledmodes if the number in the DATA SAMPLES fieldis greater than 6. The solution is to first reduce theDATA SAMPLES value, then change from AVG toa settled mode.
SETTLING PANEL 12-3

12.4. Timeout
Under some circumstances, the stream of meas-urement samples may never settle within the condi-tions specified by the TOLERANCE value and thewindow shape. This can occur because the toler-ances are set too tightly for the amount of noise onthe signal being measured. It can also occur duringdistortion measurements at, for example, approxi-mately half the power mains frequency; the secondharmonic and power mains hum can beat together,producing a cyclic variation over a period of hun-dreds of milliseconds or seconds.
To prevent the system hanging up under such cir-cumstances, the TIMEOUT function is part of theSWEEP SETTLING process. If settling is notachieved within the time specified in TIMEOUT,the system computes the average of the last sixpoints in order to save and plot, then permits thegenerator to move on to the next step. A “T” is dis-played at the lower margin of the graph below anypoints where timeout occurs. In DISPLAY TABLE
mode, the word “TIMEOUT” is displayed to theright of the data whenever timeout occurs.TIMEOUT is not used in external sweeps.
12.5. Settling Delay
The SETTLING DELAY parameter controls theinterval between when the generator or any other in-ternally swept parameter is commanded to step andwhen the system starts applying the settling tests tothe measured data stream. During GENeratorsweeps, it should never be set to less than 10-15 mil-liseconds, to allow for worst case relay bounce timeand stabilization of the generator. 30 millisecondsis a good default value. In cases where there is anadditional time delay through the device under test,the SETTLING DELAY should be set to a valueslightly longer than the known value of the time de-lay. Examples of time delay in audio testing includetests of three-head tape recorders in simultaneous re-
Figure 12-3 Determining Minimum SETTLING DELAY for Testing a Three Head Tape Recorder by use of 3H-DELAY.TST from Tests and Utilities Diskette
12-4 Audio Precision System One Operator's Manual

cord and playback mode, tests of analog or digitaltime delay units, and tests of satellite up and downlinks.
12.5.1. Testing for Delay Throughthe Device
A practical method to experimentally determinethe minimum required SETTLING DELAY througha three-head tape recorder or similar device is via anamplitude vs amplitude (linearity) sweep. SetSOURCE-1 for a GEN AMPL sweep through aknown-linear portion of the device’s dynamic range,in relatively large steps such as 2 dB minimum. Ona typical tape recorder, a GEN AMPL sweep from20 to 0 dBu with 10 STEPS (2 dB per step), assum-ing a frequency of 1 kHz or less, is a good choice.Set SETTLING DELAY to a value which you arecertain is longer than the delay time through the de-vice. Select LEVEL as DATA-1, with GRAPHTOP and BOTTOM values corresponding to the ex-pected output from the device. Such a test is storedon the Tests and Utilities diskette as 3H-DE-LAY.TST. If the device is unity gain, as is typicalwith professional tape recorders, these values wouldbe 0 dBu and 20 dBu for the example given. Press<F9> for a sweep, which should result in a straightdiagonal line plotted from the lower left to upperright corner of the graph. Use <Alt><F8> to“freeze” this graph in place.
You are now ready to experimentally determinethe minimum required SETTLING DELAY.Change SETTLING DELAY to some lower value.For an extreme case of error, select a value as smallas 30 milliseconds and press <F8>, then <F9>. Youare likely to see an entirely new line or many newpoints plotted to the right of the reference line as thesoftware settles on the amplitude output from the de-laying device which was caused by the previous gen-erator output step, but erroneously plots it offset tothe right, at the horizontal value corresponding tothe current generator amplitude (see Figure 12-3).Increase SETTLING DELAY and use <F8> and<F9> to bring back the stored reference and plot anew sweep. As you get close to the required SET-TLING DELAY, many of the points will plot on thereference line but an occasional point will still plot
to the right of the line when the software mistakesold data as corresponding to the new generator am-plitude. When you find a SETTLING DELAYwhich produces no error points to the right of thereference diagonal line, you may use this value onfuture tests of the device under the same conditions.
Note that delay is a function of tape speed on 3-head tape recorders. The SETTLING DELAY ac-ceptable at 15 inches per second, for example, mustbe doubled for 7.5 inches per second.
SETTLING DELAY is also useful when record-ing a test tone tape to be used later as a playbacktest tape. In this application, SETTLING DELAYcan be set up to several seconds to guarantee a mini-mum dwell time at each frequency as the recordingis made. This additional time is necessary for EX-TERNal source testing, compared to the faster set-tling times during generator-based sweeps, since dur-ing EXTERNal source tests the analyzer frequency
Gen. Freq. Reading Rate10-18 Hz 4/sec18-29 Hz 8/sec29-65 Hz 16/sec>65 Hz 32/sec
Figure 12-4 Frequency vs Reading Rate in AMPLI-TUDE, BANDREJECT, THD+N, 2-CHANNEL Modes
BP Freq Reading Rate10-47 Hz 4/sec47-75 Hz 8/sec75-170 Hz 16/sec>170 Hz 32/sec
Figure 12-5 Frequency vs Reading Rate in BAND-PASS, CROSSTALK Modes
SETTLING PANEL 12-5

counter must acquire a stable frequency reading be-fore the amplitude, distortion, or phase can be meas-ured.
12.6. Auto and Fixed Sampling Rates
The AUTO selection on the DETECTOR line ofthe ANALYZER panel turns on an algorithm whichoptimizes the accuracy vs speed tradeoffs duringmost System One operation. It should thus be leftin the AUTO mode for most applications. This algo-rithm takes charge of selecting reading rate and de-tector time constant (the RMS and AVG detectorseach have several selectable time constants) as afunction of frequency and test mode. It alsoswitches the 22 Hz high pass filter into the circuit atfrequencies above approximately 60 Hz. This algo-rithm, and the hardware it controls, is a major factorin the testing speeds System One is able to achievewhile still maintaining data integrity.
When AUTO is selected instead of a fixed read-ing rate, System One will select the reading rate ac-cording to a number of modes, functions, and condi-tions as follows:
• In PANEL mode, selects 4 readings/second
• In bargraph mode (F2), selects 8 readings/sec-ond unless PSEUDO or RANDOM noise sig-nals are selected on the GENERATOR panel.In this case, it selects 4 readings/second
• During EXTERNal time “sweeps”, selects 32readings/second except with a NOISE sourceselected on the generator panel. For EXTER-Nal FREQuency and EXTERNal LEVELsweeps, selects 8 readings/second except witha NOISE source selected on the panel. If aPSEUDO or RANDOM noise source is se-lected on the generator panel, 4 readings persecond is selected by AUTO.
• For all other SOURCE-1 selections (GEN,ANLR, SWI, DCX), chooses reading rate asfollows:
PSEUDO or RAN-DOM noise signal 4/secSMPTE analysis
mode 8/secCCIF analysis mode 8/secDIM analysis mode 16/secW+F mode 16/secAll other modes see Figure 12-4
and Figure 12-5
The remaining fields on the SWEEP SETTLINGpanel are involved only when using EXTERNalsweeps. These lines are EXT SOURCE SAMPLES,and the MIN LVL value in Volts.
12.7. External Sweeps and SweepSettling
During EXTERNal sweeps the analyzer fre-quency counter measures the incoming frequency,the LEVEL voltmeter measures the incoming ampli-tude for comparison to the MIN LVL value, theDATA-1 and/or DATA-2 measurements are made,and System One waits until all are stable within thedefinition of the sweep settling panel. The DATA-1and DATA-2 parameters are then accepted and plot-ted. If a frequency sweep is selected, the frequencycounter continues to monitor the incoming signalbut will not accept data and plot again until themeasured frequency changes by more than a speci-fied percentage from the previous value. For ampli-tude sweeps, the LEVEL voltmeter is monitored un-til the measured amplitude changes by more thanthe specified value. The SPACING parameter(which appears on the SWEEP (F9) DEFINITIONSpanel only in EXTERNal FREQ or LEVEL sweepmodes) determines the percentage by which the fre-quency or amplitude must change before another setof measurements is taken. The cycle is repeated un-til halted by the operator (or by a reversal in fre-quency sweep direction to the frequency value seton the GENERATOR panel, if the EXTERNalsweep was initiated with the <Shift><F9> opera-tion).
EXT SOURCE SAMPLES is the number of con-secutive frequency measurements (during frequencysweeps) or amplitude measurements (during ampli-tude sweeps) which will be compared to test for set-tling. These samples must agree within the TOLER-ANCE and RESOLUTION values specified for
12-6 Audio Precision System One Operator's Manual

FREQ or LVL at the top of the SWEEP SETTLINGpanel as described earlier for other data. MIN LVLprevents System One from taking data in EXTER-Nal source mode when test signal dropouts occur, orin compact disc testing during the intervals whilethe disc player seeks from one track to the next. Ifthe incoming signal amplitude (as qualified by thesettling parameters) drops below the MIN LVLvalue, the system suspends data capture until the sig-nal again exceeds that level. TIMEOUT is ignoredduring external sweeps.
When collecting amplitude, phase, or frequencydata from a continuously-varying (analog) externalsource sweep, SOURCE SAMPLES must be set to1. System One will then capture a set of data meas-urements each time the incoming frequency changesby more than the SPACING percentage from the pre-vious measurement, without requiring the frequencyto settle. If the analog sweep is fairly rapid, it mayalso be necessary to open up the TOLERANCE val-ues for the measured parameters in order to obtaindata. As in all EXTERNal sweeps, be sure to selectthe fastest detector reading rate compatible with thelowest frequency at which accurate data must be ob-tained.
SETTLING PANEL 12-7

12-8 Audio Precision System One Operator's Manual

13. MENUS
The stimulus and measurement hardware of Sys-tem One is principally controlled by Panels: theGENERATOR, ANALYZER, and SWEEP (F9)DEFINITIONS panels discussed in the precedingthree chapters, plus several other more specializedpanels described later in this manual. The selectionsand entries on these panels determine stimulus lev-els, frequencies, measurement functions, band-widths, detectors, display formats and units, etc.
The Menus described in this chapter principallycontrol more computer-oriented activities: loadingfiles from disk and saving them to disk, linking sev-eral files together into procedures, editing files, at-taching limit, equalization, or sweep files to a testfile, taking conditional actions during procedures,sending control data to external devices, performingcomputations on test data, etc.
System One in general uses two levels of menus;in only one case do the menus extend to a thirdlevel. The top level (COMMAND, abbreviatedCMD) menu is the line seen at original start-up ofthe system software, reproduced above. The tablebelow shows the complete menu structure.
TOPLEVELMENU
SECONDLEVELMENU
THIRDLEVELMENU
RUN PROCEDURETESTGRAPHBAR-GRAPHLOCALREMOTESLAVECALLEXIT
TOPLEVELMENU
SECONDLEVELMENU
THIRDLEVELMENU
PANEL
LOAD TESTLIMITSWEEPCOMMENTPROCEDUREMACRODATAEQOVERLAYWAVEFORM
SAVE TESTLIMITSWEEPCOMMENTPROCEDUREMACRODATAEQOVERLAYGRAPHICWAVEFORM
APPEND TESTDATA
EDIT COMMENTPROCEDUREDATAMACRO
Figure 13-1 Command Menu
13-1

TOPLEVELMENU
SECONDLEVELMENU
THIRDLEVELMENU
HELP SPECIALOVERLAYEDITORDSP
XDOS
DOS
NAMES UPPERLOWERSWEEPGEN-EQERR-FILEOFFTITLERENAMECLEARDELTAPROGRAM
IF ERROR[NOTERROR[ABOVE[BELOW[0[1[2[3[4[5[6[7[8[9[
TOPLEVELMENU
SECONDLEVELMENU
THIRDLEVELMENU
FOURTHLEVELMENU
UTIL RESTOREOUTWAITDELAYBREAKLEARNENDPROMPTMESSAGEGOTOSERIAL-DSP
TRANSMIT
RECEIVEMODE AES-EBU
SPDIFSERIAL
DITHER TRIANGU-LARRECTAN-GULARSHAPEDOFF
FEED
QUIT
COM-PUTE
NORMAL-IZEINVERTSMOOTHLINEAR-ITYCENTERDELTA2-SIGMAEX-CHANGE
: (labelname)
13-2 Audio Precision System One User's Manual

The single line description at the lower left of thescreen (“Run procedure, test, or graphs”, in the ex-ample shown) provides more information than themenu command itself can carry. Selection of menuitems is made in one of two fashions—by <Space>bar and <Enter> key (or mouse, if a mouse is avail-able), or by pressing the key corresponding to thefirst character of the menu command.
With the <Space> and <Enter> technique, the<Space> bar moves the cursor clockwise throughthe selections. The <+> and <Del> key may alter-nately be used to move the cursor to the right or tothe left, respectively. Rolling a mouse horizontallyalso controls the cursor. When the cursor is on thedesired item, pressing <Enter> (right-hand mousebutton) makes the selection.
Direct selection, regardless of the present positionof the cursor, can be made by pressing the keywhich matches the first character of the desired com-mand. The <L> key thus has the same result as us-ing the cursor and <Enter> key to select LOAD.
13.1. Panel, Xdos, Dos, Quit
Four of the menu selections are single level andcomplete their entire operation when selected.These selections are PANEL, XDOS, DOS, andQUIT.
PANEL ; display the instrument front panels.
XDOS; temporarily exit from System One soft-ware to the computer’s disk operating system. Thiswill allow running a DOS program without remov-ing System One from memory. You then resumeSystem One operation instantly by typing EXIT <En-ter>. Since System One software remains in mem-ory, you will be limited on the size of other pro-grams which can be run while in the XDOS mode.When System One loads, it attempts to leave 64k ofmemory available for operations under XDOS. Seethe “Controlling Memory Usage” section of theCREATING YOUR CUSTOM SOFTWARESTART-UP PROCESS chapter for instructions onhow to cause the system to leave more or less mem-ory for DOS operations.
DOS; similar to XDOS, except returns to SystemOne’s top level menu immediately after executing asingle DOS command, rather than waiting for theEXIT <Enter> command. This command is usefulfor executing DOS commands during a procedure;see the PROCEDURES chapter.
QUIT ; exit from System One software to DOSand allow System One software to be over-writtenin memory; thus, no ability to return to System Oneexcept by re-starting the software from the begin-ning by typing S1 <Enter>. Any stored image fromthe Image Save ( <Alt><F8> ) facility is lost whenQUIT is executed. When the QUIT command is is-sued, System One automatically saves the currenttest in a file called APLAST$$.TST, the current pro-cedure in a file called APLAST$$.PRO, and the cur-rent macro in a file called APLAST$$.MAC. If,when you next start System One, you wish to startup with this same test, procedure, and macro loadedwhich were in use when you quit, type S1 /L (forlast) and the system will start with those files in use.See Command Line options in the CREATINGYOUR CUSTOM SOFTWARE START-UP PROC-ESS chapter beginning on page 28-1 for more de-tails.
Each of the remaining menu selections leads to asecond level menu; these are RUN, LOAD, SAVE,APPEND, EDIT, HELP, NAMES, IF, UTIL, COM-PUTE, and :. As you become familiar with SystemOne commands, you may type the first letters of thedesired commands in rapid sequence and proceedthrough the desired actions without stopping to haveeach menu displayed. For example, to load anothertest, press <Esc> <L> <T> filename <Enter>. Eachof the two-level menu commands is discussed be-low, along with the second level menu choices.
13.2. Run Menu
RUN: PROCEDURE TEST GRAPH BAR-GRAPH LOCAL REMOTE SLAVE CALLEXIT
RUN PROCEDURE starts execution of any pro-cedure presently in the procedure buffer. If the er-ror message PROCEDURE BUFFER IS EMPTY
MENUS 13-3

OR INVALID is displayed, it is either because noprocedure has been loaded, because a procedure hasbeen incorrectly edited to produce an unacceptableheader or empty first line, or because a procedurefrom an earlier S1 software version has been loaded.If the earlier version procedure is compatible withthe current version, it can be made to run by chang-ing the first line of the procedure from PRO-CEDUREv1.xx or PROCEDUREv2.00 to PRO-CEDUREv2.10. Earlier version procedures shouldbe compatible unless they included arrow-key-strokes to move the cursor around the panel tochange settings during a procedure.
RUN TEST starts the test presently set up on thepanel; this is identical to the <F9> key.
RUN GRAPH re-graphs data presently in mem-ory, identical to the <F7> key.
RUN BAR-GRAPH displays the bargraph foranalog indication of measurement parameters andanalog control of stimulus. See the BARGRAPHchapter. This command is identical to the <F2> key.
RUN LOCAL , RUN REMOTE , andRUNSLAVE are all related to either “Split Site” (RE-MOTE) operation or use with the “S” (RS-232 se-rial) versions of System One. See the “RemoteMode for Transmission Testing and Laptop Com-puter Operation” chapter for details on these com-mands.
RUN CALL , followed by a sub-procedure nameand <Enter>, jumps control from a procedure to thesub-procedure. See the Sub-Procedures section ofthe PROCEDURES chapter for more informationand examples.
RUN EXIT , in a sub-procedure, returns proce-dure flow control to the point immediately follow-ing the RUN CALL statement in the calling proce-dure or sub-procedure. If a sub-procedure contain-
Figure 13-2 Load and Save Information Panel
13-4 Audio Precision System One User's Manual

ing a RUN EXIT command is run by itself, an errormessage will result when the RUN EXIT line isreached since the sub-procedure was not called anddoes not know where to return.
13.3. Load Menu
LOAD: TEST LIMIT SWEEP COMMENTPROCEDURE MACRO DATA EQ OVER-LAY WAVEFORM
When the LOAD selection is made, an informa-tion screen is displayed in addition to the second-level menu choices. This screen shows the proce-dure, comment, data, and macro file last loaded orsaved. It also shows the name of the file (.TST.LIM, .SWP, .EQ, or .OVL) currently in main filememory. This is the file whose panels will be dis-played in PANEL mode, whose data will be dis-played when the <F7> key is pressed, and whosedata can be edited in Edit Data mode. See Figure13-2 for an illustration of this information screen.
All Load commands have certain features in com-mon. Each will ask for the file name of a pre-viously-saved file of the appropriate type (xx.TST,xx.LIM, xx.SWP, xx.TXT, xx.PRO, xx.MAC,xx.DAT, xx.EQ, xx.OVL, xx.WAV) to load fromdisk. The first 88 file names (in the current direc-tory) of that type will be shown and may be selectedvia arrow keys or mouse, or a file name of a compat-ible type (including disk drive prefix and/or com-plete subdirectory pathname, if not in the current di-rectory) may be typed in. When typing in filenames, the horizontal arrow keys maybe used tomove back into the typed-in material to make correc-tions. The <Ins> key may be used to toggle backand forth between overtype mode and insert mode.The DOS “wild card” symbols of * and ?, otherdisk drive designators such as B: or D:, and sub-di-rectory pathnames may be used to view a directoryof other types of files or files in other directoriesthan the current directory. See your DOS manualfor more information on use of wild card symbolsand path names.
Note that .TST, .LIM, .SWP, .EQ, and .OVL filesall have the same structure and occupy the samemain file memory area when loaded. Thus, if youwish to load and examine a test, then load and exam-ine a limit file, and then go back to the test, youmust load the test again since it will have beenerased from memory (ram) when the limit file wasloaded.
LOAD TEST asks for the file name of a pre-viously-saved test to load into main file memory inorder to either use the test setup or to examine thesaved data (or both).
LOAD LIMIT asks for the file name of a pre-viously-saved limit file to load into main file mem-ory in order to examine and possibly edit the data.
LOAD SWEEP asks for the file name of a pre-viously-saved sweep table file to load into main filememory in order to examine and possibly edit thespecified frequency or amplitude steps.
LOAD COMMENT asks for the file name of acomment file to bring into the “Comments Buffer”section of memory, typically either to attach to thecurrent test for print-out or for further editing of thecomments. All comments and error files (files withxx.TXT file type) on the disk will be shown in al-phabetical order; you may select the file via cursoror by typing in its name. Any other ASCII file maybe loaded into the comments buffer if its full filename, including the extension, is typed in. LoadComment capability may thus be used to display asummary error file at the end of a test or procedure;the procedure SYS22CK.PRO distributed with Sys-tem One software includes an example of this tech-nique. Load Comment may also be used to viewASCII files such as AUTOEXEC.BAT, CON-FIG.SYS, and other files. These files may be ed-ited in the comments editor and the edited versionsmay be saved under the original or new file names.
LOAD PROCEDURE asks for the file name ofa procedure file to bring into the “Procedure Buffer”section of memory, either to run or for further edit-ing. All procedures files (files with xx.PRO filetype) on the disk will be shown and may be selectedwith cursor or by typing.
MENUS 13-5

LOAD MACRO asks for the file name of a pre-viously-saved macro file to load into the “MacroBuffer” section of memory. Once loaded, it will de-fine the keystroke sequences to be executed when acontact closure occurs at any of the eight pins of thePROGRAM CONTROL INPUT connector on theDCX-127 front panel. See the Edit Macro sectionbelow and the DCX-127 chapter for more details.
LOAD DATA asks for the file name of a pre-viously-saved ASCII data file to convert into binaryand bring into the test data section of main file mem-ory, either to graph onto the screen (Run Graph or<F7>) or for editing. All data files (files withxx.DAT file type) on the disk will be shown andmay be selected.
LOAD EQ asks for the file name of a previously-saved equalization file to bring into main file mem-ory, typically for editing or to graph or examine.
LOAD OVERLAY asks for the file name of apreviously-saved overlay file to bring into main filememory. The overlay file will set new test condi-tions for all fields which were saved, but will pro-tect or preserve the values and parameters remainingfrom the previously-used test in any fields whichwere “punched out” when the overlay file was cre-ated and saved.
LOAD WAVEFORM asks for the file name ofa previously-saved waveform acquired by the DSPmodules in a System One + DSP or System OneDual Domain. That waveform will then be down-loaded to the DSP module. Certain key settings ofSystem One panels will also be restored to the set-tings in effect when the waveform was saved. Seethe DSP manual for more details.
13.4. Save Menu
SAVE: TEST LIMIT SWEEP COMMENTPROCEDURE MACRO DATA EQ OVER-LAY GRAPHIC WAVEFORM
When the SAVE selection is made from theCOMMAND menu, an information screen is dis-played in addition to the second-level choices. This
screen is identical to that displayed when LOAD isselected, and is illustrated in Figure 13-2 on page 13-4.
All Save commands have certain features in com-mon. Each will ask for a file name under which tosave the test, limit, sweep table, comments, proce-dure, macro, data, equalization, graphic data list,overlay, or waveform file. The file name suppliedmay be up to eight characters long and may includealphabetic characters A through Z, numerals 0through 9, and the symbols $ ( ) & ‘ _ - @ # %~ ! DOS does not distinguish between upper andlower case letters in file names. The horizontal ar-row keys may be used to move back into the typed-in material to edit it. The <Ins> key will toggle be-tween overtype mode and insert mode when editingtyped-in material. If you wish to save the file in a di-rectory other than the current directory, you mustsupply the complete path name including disk driveprefix (if not the current disk) and subdirectory path.The full path name cannot exceed 26 characters.The extension (file type) need not be typed in anddoes not count as part of the 26-character limitation.The extension will be automatically supplied by thesystem, (unless a specific extension is typed in bythe user) depending on the file type being saved:xx.TST for tests, xx.LIM for limits, xx.SWP forsweep tables, xx.TXT for comments, xx.PRO forprocedures, xx.MAC for macros, xx.DAT for data,xx.EQ for equalization, xx.OVL for overlays, andxx.WAV for waveforms.
The first 88 files (in the current directory) of thetype being saved will be shown alphabetically ar-ranged on screen. Typing in the name of a file ofthe same type presently existing in the directory (orpositioning the cursor on one of the file names dis-played on screen and pressing <Enter>), will resultin a message that the file name already exists. Thesystem will request confirmation by pressing Y thatyou wish to over-write the existing file. If you do,the existing file will be destroyed and replaced bythe current file you are saving. If you do not wishto destroy the existing file, press <Esc> Save (file-type) and supply a new file name which does notconflict. In a procedure (see the Procedures chap-ter), the Y for overwrite is not required. The soft-
13-6 Audio Precision System One User's Manual

ware assumes that the procedure has been properlyplanned and that it is permissible to over-write anyfile if the procedure issues a SAVE command.
SAVE TEST saves the current test setup, data,and comments (if any) to disk, with a xx.TST filetype (extension). xx.TST files are binary files andcannot be viewed or edited by normal text editors.xx.TST files (and the identical-format xx.LIM,xx.SWP, xx.EQ, and xx.OVL file types—see below)occupy disk space which depends on the number ofdata points in the stored data. The minimum filesize, with zero data points, is approximately 1,660bytes for the header and panel setup information.Thirteen bytes are added for each data point. Thus,tests with up to 29 data points (28-step sweeps) willstore in a 2k disk cluster. Tests with up to 186 datapoints (185-step sweeps) will store in a 4k disk clus-ter.
SAVE LIMIT saves the current test setup, data,and comments to disk, with a xx.LIM file type.xx.LIM file types are binary files of identical for-mat to xx.TST files and can be used interchange-ably. When attached to a test by the Names Upperor Names Lower command, only the data will beused. The purpose of Save Limit is to create a dis-tinctive file type (extension) so that only limit fileswill be displayed as the directory during Names Up-per and Names Lower activities.
SAVE SWEEP saves the current test setup, data,and comments (if any) to disk with a xx.SWP filetype (extension).xx.SWP files are binary files ofidentical format to xx.TST files and can be used in-terchangeably.When attached to a test by theNames Sweep command, only the independent vari-able data (first column when viewed in DISPLAYTABLE or Edit Data modes) will be used.The pur-pose of the Save Sweep command is to create a dis-tinctive file extension so that only sweep table fileswill be displayed as the directory during NamesSweep activities.
SAVE COMMENT saves, as an ASCII file, anytext presently in the comments buffer. See EditComments for instructions on how to create text inthe comments buffer. Comments files are savedwith a xx.TXT file type. Save Comment is used
when creating a comments “form” for repeated usein different tests.If the comments created areunique to the particular test and will not be usedelsewhere, Save Comment is unnecessary since thecomments buffer is automatically saved as part ofthe xx.TST file when Save Test is done.Edit,Save, and Load Comments may also be used as ageneral-purpose text editor. If a specific extensionis typed in, it will override the xx.TXT extension.
SAVE PROCEDURE saves, as an ASCII file,any procedure presently in the procedure buffer.See Edit Procedure below and the PROCEDURESchapter of this manual for instructions on how to cre-ate procedures. The xx.PRO file type will be addedautomatically.
SAVE MACRO saves the current contents of theMacro editor. Macros define the keystroke se-quences which will be executed when an externalcontact closure is made at the PROGRAM CON-TROL INPUT connector on the front panel of theDCX-127 module. This facility permits easy addi-tion of completely flexible custom keyboards in ad-dition to or in place of the standard PC keyboard.This is particularly useful in production test applica-tions. The xx.MAC file type will be added automat-ically. See the Edit Macro section below and theDCX-127 chapter for more details.
SAVE DATA asks for a file name under whichto save the data currently in memory as a tabular,comma-delimited ASCII file. This differs from theSave Test command, which saves test setup, data,and comments in a binary format not suitable for ed-iting. The purpose of Save Data is for transfer ofdata to other programs such as statistical, data-base, or spreadsheet programs.The file typexx.DAT will be added automatically unless anotherextension is typed in.
SAVE EQ asks for a file name under which tosave the equalization data currently in memory.xx.EQ file types are binary files of identical formatto xx.TST files and can be used interchangeably.When used as an equalization file, only the inde-pendent and first dependent variable data (SOURCE-
MENUS 13-7

1 frequency and DATA-1 amplitude) are used. Seethe EQUALIZATION chapter for more informationon equalization capability.
SAVE OVERLAY asks for a file name underwhich to save the overlay file currently in memory.An overlay (xx.OVL) file differs from a xx.TST fileonly in that one or more panel fields have been“punched out”. The result, when an overlay file isloaded, is that the value from the previous panel con-ditions will be unchanged where any “punched-out”fields load. This has the effect of preserving a fieldfrom the previous test, instead of over-writing theparameter with a new value. Panels with one ormore punched-out fields may only be saved asxx.OVL files. See the Partial Load (Overlay) sec-tion of the PROCEDURES chapter for more infor-mation.
SAVE GRAPHIC saves, under the file namesupplied by the user, the necessary information tocreate a high-resolution (vector graphics) plot to anHPGL plotter or laser print to an HP LaserJet orPostScript-compatible laser printer such as the Ap-ple LaserWriter. The saved file will have the exten-sion .GDL (Graphics Data List. See the sections be-ginning on page 15-6 of the HARD COPY PRINT-OUT chapter for full details.
SAVE WAVEFORM saves, under the file namesupplied by the user, the waveform data presentlystored in data memory in the DSP module of a Sys-tem One + DSP or System One Dual Domain unit.The .WAV extension will be automatically added.This waveform data may then later be downloadedfrom disk to the DSP unit by the LOAD WAVE-FORM command for further analysis or display.The size of a saved waveform file on disk may bequite large (approaching 256 kbytes), depending onthe amount of memory in the DSP unit, which FFTprogram was used to acquire the data, and whetherthe full contents of both data channels are saved.See the DSP chapter for more details.
13.5. Append Menu
APPEND: TEST DATA
TheAPPEND TEST andAPPEND DATA com-mands permit loading and attaching data from aspecified file to the end of the data presently inmemory. Each command will ask for the name of apreviously-saved file of the corresponding type(.TST or .DAT) to be appended to the data in mem-ory. The data is appended following a−1E+32value as a delimiter. This value is recognized as aspecial value during re-plots via F7. The systemwill then not draw a vector from the last point of theprevious section of data to the first point of the next,eliminating re-trace effects. The entire data file,original plus appended, can then be saved or re-plot-ted with the F7 key exactly as a nested sweep re-plots.
The system will append the data from the speci-fied file without checking for consistency in meas-urement parameters or units between the files . Theuser must thus assure himself or herself that it islogical to append files. When the file to be ap-pended is logically consistent with the data in mem-ory (for example, both frequency response tests) theunits in which they are stored must still be consid-ered. If both files have amplitude measured in abso-lute units (Volts, dBV, or dBu), the appended datawill be correctly converted into the display units ofthe test presently in memory, to which they are ap-pended.
If the appended test file used non-absolute unitssuch as dBm or Watts (which depend on the circuitimpedance value), dBr, or one of the relative fre-quency units, additional factors must be considered.In all cases, non-absolute units in the stored file be-ing appended will be interpreted in terms of the ref-erence value for that unit on the panel of the testinto which it is loaded. dBm or Watts units willthus be correctly appended only if the dBm/W REFvalue on both tests is identical. If the appended testfile used dBr units, the data will not load as the cor-rect absolute amplitudes unless the dBr REF valuesaved with the test is identical to the dBr REF valueon the LVF1 panel of the test to which it is being ap-pended. When preserving absolute amplitude rela-
13-8 Audio Precision System One User's Manual

tionships is important, the best procedure when ap-pending tests with dBr units is to first change to ab-solute units (dBu, dBV, or V) and re-save, then ap-pend. If the goal is to append dBr tests so that allpass through zero dBr at a specific horizontal value,a copy of each test can be prepared with the dBrREF value set to a standard value such as one Volt.Compute Normalize is then used to cause each testto go through zero dBr. The test copy can then besaved and ultimately appended.
13.6. Edit Menu
EDIT: COMMENT PROCEDURE DATAMACRO
EDIT COMMENT takes you to a full-screen edi-tor. See the General Edit Capability section at theend of this EDIT section for a discussion of the edi-tor capability. In Edit Comments mode, you can cre-ate alphanumeric text which will be saved with thecurrent test and printed out along with a graph viaRun Graph or <F7> or Run Test or <F9>, followedby the <*> key (without pressing <Shift>). Thesecomments could consist of operator name, test condi-tions such as temperature, humidity, or voltage,status of the device under test such as the value ofexperimental components or the position of controls,or other information. When a test is saved, any com-ments in the edit comment buffer will also be savedalong with the setup and data in a xx.TST file. It isalso possible to save the comments buffer separatelyvia Save Comments; this will result in a xx.TXT file.
The double vertical bar symbols in the “rulerlines” at the top and bottom of the editor screenmark the edges of the graph printout to which thecomments will be attached. If it is desired to havecomments exactly aligned below the graph bounda-ries, comments text should be generated only be-tween those two columns. Note that the spacing be-tween these symbols changes with different videodisplay systems and changes if the /P command lineoption is used to specify different widths for graphicprintout.
EDIT PROCEDURE uses the editor in order toedit or create a test procedure—a series of stepslinked together in the desired order, with inter-spersed prompting messages to an operator, controlcommands via an interface to external hardware, andinclusions of user-written sections of software inother languages such as BASIC. Edit Proceduremode thus permits generation of a complete set oftests on a device which can then be run by operatorsof even sub-technician skill level. See the PROCE-DURES chapter for complete details.
EDIT DATA places you in the editor with tabu-lar data from the most recent test taken by thexx.TST file or current panel setup. The principalpurpose of the Edit Data capability is to modify orcreate files for use as limits, sweep tables, or equali-zation curves. Note that the Edit Data function musttranslate data from the binary format in which it isstored into a readable ASCII format in columns,which can take several seconds for a long data file.Similarly, when <Esc> is pressed to exit from EditData to the command menu, several seconds may berequired to translate all the data back into binary for-mat if any data has been changed; if the data wassimply examined but not changed, the transitionback to the menu will be very rapid.
EDIT MACRO command moves you into themacro editor, used for defining actions which willbe triggered by contact closures at the PROGRAMCONTROL INPUT connector of the DCX-127 mod-ule. This capability is intended for limited-functionkeyboards which will replace or supplement thecomputer keyboard, particularly in production testapplications with limited-experience operators.
The PROGRAM CONTROL INPUT connectorsupports up to eight individual switches, connectedto pins 1 through 8. A contact closure to ground(pin 9) at any of those contacts will trigger the “play-back” of the keystroke sequence defined as the corre-sponding macro (1 through 8) in the currently-loaded macro file. Macro files may be created,saved (xx.MAC file type), and loaded as desired todefine and re-define the functions.
Each macro is defined by a line or lines begin-ning with
MENUS 13-9

N=
or
N+
where N is the number from 1 through 8 correspond-ing to the connector pin which will control it. The= sign is used for normal priority macros, and the +sign for high priority macros. The numeral must bein the first column with no preceding spaces. Theremust not be a space between the numeral and the =or + sign. Spaces following the = or + sign will beinterpreted exactly as they would be during a proce-dure. For example, if the macro includes PANELmode with the cursor on a multiple-choice field,spaces will move the cursor through the choices tothe right. Each macro definition continues until thebeginning of the next definition or the end of thebuffer. Thus, it is possible for a single definition tooccupy several lines.
Macros may be created directly in the editor ormay be “learned” into the Procedure editor via theUtil Learn feature and then transferred into theMacro Editor. A number of keystrokes which couldbe useful in macros cannot be directly created in theeditor and thus must be learned in Util Learn modeand transferred into the Macro Editor. Figure 13-3shows the IBM graphic representation of a numberof those keystrokes, as they will be seen after press-ing the corresponding keys during a Util Learn op-eration.
An entire procedure can be learned via UtilLearn, saved with the .PRO extension, and loadedinto the macro buffer by typing in the full name in-cluding the .PRO extension. It may then have the“1=” or “1+” macro designator added and the PRO-CEDUREv2.10 and UTIL END header and footer re-moved and be re-saved under another name with the.MAC extension.
Figure 13-3 Screen Appearance of Keystrokes Which May Be Used in Procedures and Macros
13-10 Audio Precision System One User's Manual

In the typical situation where several macros areto be defined, however, it is simpler to transfer themfrom the procedure editor to the macro editor via the<Alt><F6> capability. Any block of material in theEdit Procedure (or Edit Comment or Edit Data) buff-er which is marked with the <Alt><F6> key will bedeleted into the copy buffer of the Edit Macro buff-er. This contrasts with the action of the <F6> key(without the <Alt> key), which deletes only into thecopy buffer of the Editor section presently beingused. After using <Alt><F6> to move text from theEdit Procedure buffer to the Edit Macro copy buffer,you can then exit to the menu with <Esc>, EditMacro, move the cursor to the desired insertionpoint, and press <Alt><F5> to copy the text into theEdit Macro buffer. The additional information (3=,5+, etc.) may then be added and the macro savedwith the desired name.
Any macro terminates when it starts a procedure,even if there were additional keystrokes still in themacro. Any macro terminates if it causes EditMacro. All macros are ignored when in Edit Macromode.
Normal macros (=) will run if selected while aprocedure is paused. The contact closure whichwould normally start a normal macro will be ig-nored if a procedure is running or if another macrois running.
High priority macros (+), if the initiating contactclosure is made while a procedure is running, willimmediately start executing. Since the status of theprocedure at this time is undefined, the interactionof the macro and procedure running simultaneouslyis undefinable. It is thus best to start most high pri-ority macros with:
N+/A1
This is the “procedure language” code for <Alt>F1,which aborts a procedure without turning off thegenerator. An exception to this rule would be amacro intended to be used as the “panic button” tostop any activity, which would be:
N+/F1
A macro to pause a procedure and commenceagain after pause would be:
N+/F10
A high priority macro will terminate any othermacro running at the time the contact closure ismade.
See the Program Control Input section of theDCX-127 chapter for more information and exam-ples of macros.
13.6.1. General Edit Capabililty
A summary of all the keys usable in EDIT modemay be brought to the screen at any time by press-ing <Esc> Help Editor; this screen is reproduced asFigure 13-7.
The editor functions in either insert mode or over-write mode, selected by alternate operations (toggle)of the <Ins> key. When first selected, the editorwill always be in insert mode. Movement of the cur-sor is controlled by the arrow keys, <Home>, and<End>. <PgUp> and <PgDn> permit pagingthrough text. The <Ctrl> key “amplifies” the func-tion of the left and right arrows and the <Home>,<End>, <PgUp>, and <PgDn> keys. Specifically,<Ctrl><PgDn> takes you to the end of the bufferand <Ctrl><PgUp> to the top of the buffer.
A section of text may be deleted to a copy bufferwithin that editor by moving the cursor to one endof the section, marking it by use of the <F6> key,then moving the cursor to the other end of the sec-tion and pressing <F6> again. If it is desired tocopy the text from the buffer at some point, movethe cursor to that point and press the <F5> functionkey. Only the block of text most recently moved tothe buffer with the <F6> key will remain; any textpreviously in the buffer will be lost. Text in the “de-lete buffer” is maintained even through the loadingof another file into that same editor, so the deletebuffer may be used to “cut and paste” or copy textfrom one procedure file to another, one commentsfile to another, etc.
MENUS 13-11

Figure 13-4 HELP Information Screen
Figure 13-5 HELP SPECIAL Screen
13-12 Audio Precision System One User's Manual

Figure 13-6 HELP OVERLAY Screen
Figure 13-7 HELP EDITOR Screen
MENUS 13-13

If it is desired to move sections of text betweeneditor sections (for example, from the procedure edi-tor to the macro editor), the <Alt><F6> and<Alt><F5> keys may be used. Text marked at itsbeginning and endin any editorwith the<Alt><F6> key will be deleted to the copy buffer ofthe Macro editor. Text currently in the Macro editorcopy buffer will be copied to the present cursor posi-tion of any editorsection when the <Alt><F5> keyis pressed.
Note that the Load Comment, Edit Comment,and Save Comment capability may also be used as asimple, general purpose text editor to review or gen-erate text files such as AUTOEXEC.BAT files. Theautomatic filename extension of xx.TXT given tocomments files when saving can be over-ridden bysupplying an explicit file type, such as xx.BAT ifgenerating or editing a batch file.
13.7. Help Menu
HELP: SPECIAL OVERLAY EDITORDSP PANEL
When the HELP selection is made, an informa-tion screen is displayed in addition to the second-level menu choices. This information screen showsmemory assigned to the various buffers controlledby the /B option at S1.EXE startup. It also showsinformation on the interface card, display type,printer, print screen function, which instrument mod-ules are connected to the system, and computer proc-essor and math coprocessor type. This screen is re-produced in Figure 13-4.
HELP SPECIAL puts on screen a one-page sum-mary of the effect of the function keys <F1>through <F10>. The Help Special screen is repro-duced in Figure 13-5.
HELP OVERLAY puts on screen a one-pagesummary of the keys associated with overlay mode.The Help Overlay screen is reproduced in Figure 13-6.
HELP EDITOR puts on screen a one-page sum-mary of the keys available when in any of the Editmodes. The Help Editor screen is reproduced asFigure 13-7.
HELP DSP displays a one-page summary of thekey features of the particular DSP program whichhas been attached to a test and thus down-loaded tothe DSP module. The Help DSP screen is thus com-pletely DSP program-dependent.
HELP PANEL displays a summary of the two-character mnemonic codes which permit instantjumping to often-used fields on each software panel.These codes may be used during manual operationor to expedite making panel changes during a proce-dure.
13.8. Names Menu
NAMES: UPPER LOWER SWEEP GEN-EQ ERR-FILE OFF TITLE RENAMECLEAR DELTA PROGRAM
When NAMES is selected or the <N> key ispressed, the Names screen information display willappear in addition to the Names Menu subsidiarychoices, as shown in Figure 13-8. This panel showsthe names of the delta, upper and lower compare(limits), sweep source, generator equalization, errorreporting, and DSP program files (if any) attachedto the test presently in memory. The Names panelalso shows the current graph title (normally AUDIOPRECISION). If you are upgrading proceduresfrom version 1.60 to 2.10, note that three of thesecommands have been slightly changed since version1.60. They must be changed in any 1.60 proceduresimported for use under version 2.10 software.These three changed commands are NAMES GEN-EQ (formerly NAMES GEN#1-EQ), NAMES ERR-FILE (formerly NAMES ERROR-FILE), andNAMES RENAME (formerly NAMES RENAME-TEST).
NAMES UPPER asks for entry of the name of afile whose data is to be used as the upper acceptablelimit to which currently-measured data will be com-pared during go/no-go testing. The file name may
13-14 Audio Precision System One User's Manual

be typed in, or selected from the directory with thecursor and <Enter> key. The displayed directorywill show only files with the xx.LIM extension, butxx.TST, xx.EQ, or xx.SWP files could also be usedby explicitly typing them in. The file named as theUPPER limit will normally have been created usingthe Edit Data capability. See the ACCEPTANCETEST LIMITS chapter for a discussion of how tocreate a file for use as a limit.
NAMES LOWER is identical in principle to theNames Upper command, with the file name for thelower comparison test limit being attached to thetest file.
NAMES SWEEP permits attaching to a test fileanother file to be used as a sweep source table.STEP TABLE ON must also be selected on theSWEEP TEST DEFINITION panel for the table tobe used in the test. The directory will display onlythose files with a xx.SWP extension, but xx.TST,xx.EQ, and xx.LIM files have identical formats and
might be used in some circumstances. See the Ta-ble-Based Sweeps section of the SWEEP (F9) DEFI-NITION chapter.
NAMES GEN-EQ (formerly NAMES GEN#1-EQ) permits attaching to a test file another file to beused as an equalization file, controlling the outputamplitude of the generator as a function of fre-quency. The directory will display only those fileswith a xx.EQ extension, but xx.TST, xx.SWP, andxx.LIM files have identical formats and might beused in some circumstances. See the EQUALIZA-TION chapter for more detail.
NAMES ERR-FILE (formerly NAMES ER-ROR-FILE) permits assignment of a file name intowhich out-of-limits information will be written dur-ing execution of a test with limits, so that a failuretag or report of deviations may be printed out orstored. When the test first runs, it will create an AS-CII file of the assigned name with the xx.TXT exten-sion. Each execution of a test will cause the test filename, date, time, and column headings for the inde-
Figure 13-8 Names Panel
MENUS 13-15

pendent variable and dependent variable(s) to bewritten into the error file. If no out-of-limits meas-urements are made, the message “All data withinlimits” will be written into the file. The same errorfile may be named to more than one test file. Eachtime a test file runs, it will append error informationto anything already in the error file; thus, namingone error file for all the tests in a procedure willcause it to become the master error summary of theentire set of tests. In such cases, the first line of theprocedure should normally be
DOS ERASE xx.TXT
(where xx.TXT is the error file name) to erase thefile remaining from when the procedure last ran.
If PRN or LPT1 (the DOS designations for thesystem printer) are specified instead of a file name,the system printer will print out the error file con-tents at the conclusion of the test.
NAMES OFF temporarily disconnects an errorfile from a test. The error file name can then be re-attached to the test by the sequence:
NAMES ERR-FILE <Enter>
The purpose of Names Off is for use in conjunc-tion with Compute Center. Compute Center willslide test data vertically for best fit between upperand lower comparison limits. If Compute Center isto be used in a procedure with an error file, it is notnormally desired for failure data to be written intothe error file when the test is first run. Instead, thedesired sequence is to run the test with limits at-tached but error file disconnected, run Compute Cen-
ter to center the data, re-connect the error file, andthen re-compare the data to limits via F7, after thedata has been slid for best fit.
NAMES TITLE permits replacement of theAUDIO PRECISION title in the upper left corner ofgraphs (CGA color displays do not show theAUDIO PRECISION name due to larger charactersrequired by the poorer resolution). The Names Titlefunction may be used, for example, by a manufac-turer who desires to furnish test data to his custom-ers and would prefer his company name in the title.
Names Title may also be used to deliberatelyover-write the standard units so that user-assignedunits will appear in the top graph legend. Long ti-tles will replace portions of the top line information.With MONO-GRAPH display or EGA and VGACOLOR-GRAPH displays, the maximum number ofcharacters in the top row of the graph is 79. The toprow may consist of four elements: the TITLE (nor-mally AUDIO PRECISION), the test name (up toeight characters of the DOS file name, not includingthe .TST extension), the measured parameters andunits (for example, THD+N (%)), and the date andtime. If the total number of characters in those fourelements exceeds 79, the lower priority elementswill not be displayed. The priority among the ele-ments is:
TitleParameters and UnitsDate and TimeTest Name
Thus, the test name is the first element to disap-pear when all elements (plus spaces between the ele-ments) exceed 79 characters total. The date and
Figure 13-9 Top of Mono-Graph with Long Title Replacing Original Title, Test Name, and Units
13-16 Audio Precision System One User's Manual

time are the second to disappear, etc. Since someparameters have more characters than others(BANDPASS vs THD+N, for example), the point atwhich lower-priority elements disappear will varywith test parameters.
Figure 13-9 is an example in which a long titlehas been substituted for the usual title. The long “ti-tle” includes a title, test name, and custom units:
AUDIO PRECISION TESTNAME KILO-GRAMS vs POUNDS PER SQUARE INCH
This causes the actual units and test name to bereplaced. Note that the horizontal arrow keys and<Home> and <End> keys may be used to moveback into the “title” and the <Ins> key toggles be-tween overtype mode and insert mode, to simplifyediting of titles.
With CGA COLOR-GRAPH display, the title,test name, date, and time are not normally displayeddue to the poorer resolution of the CGA display sys-tem. If, however, a title of more than 16 charactersis entered in NAMES TITLE, the units will be de-leted from the top line and the title displayed in-stead. The maximum title length which can be dis-played in CGA COLOR-GRAPH mode is 39 charac-ters.
NAMES RENAME (formerly NAMES RE-NAME-TEST) permits replacement of the test namewhich will be shown in the top line of monochrome-displayed or table-displayed and printed graphs.This command changes the name in computer mem-ory; if the test had already been saved under its pre-vious name, the old version of the xx.TST file willstill remain on disk. A Save Test operation willsave the test again under its new name.
NAMES CLEAR permits wiping out in one ac-tion up to seven files attached to a test: the uppercomparison file, lower comparison file, error report-ing file, sweep source file, generator equalizationfile, delta file, and DSP program file.When a se-ries of tests are being generated by modificationsof an earlier test, any of these files attached to theoriginal test will “propagate” through successive
modifications unless conscious effort is made to re-move them. The Names Clear function simplifiestheir removal.
NAMES DELTA specifies a file to be used in aCompute Delta operation. Compute Delta (see be-low) then subtracts the data in the named file fromthe data presently in memory. Note that, beginningwith version 2.00, a Delta file name attached to atest is saved with the test just as any other attachedname. In earlier software versions, a Delta filename did not save with the test but was effectivelypart of the environment, working with all testsloaded until it was replaced with another Delta filename.
13.9. If Menu
IF: ERROR[ NOTERROR[ ABOVE[ BE-LOW[ 0[ 1[ 2[ 3[ 4[ 5[ 6[ 7[ 8[ 9[
The variousIF commands permit conditional ac-tions to take place in a procedure. IF ERROR[, IFNOTERROR[, IF ABOVE[, and IF BELOW[ allcause the conditional action to take place dependingupon whether an out-of-limits error occurs duringthe immediately preceding test.
The IF n[ commands permit conditional action totake place depending upon which of the ten numberkeys, 0 through 9, the operator presses at a point ina procedure when the <Ctrl> F10 key (/C10) is exe-cuted.
The action to be taken in either case is describedby the keystrokes between the If xx[ statement and aclosing bracket, ]. As an example, assume that afile named ERRORFIL has been named as the errorfile for a test. If it is desired to have a procedureprint an error file and halt the test when any out-of-limits measurement occurs, this could be the nextline in the procedure after the <F9> commandwhich starts the test:
IF ERROR[ DOS COPY ERRORFIL.TXTPRN/R UTIL BREAK ]
MENUS 13-17

If no out-of-limits measurement is found, the IFcommand will be skipped and the procedure willcontinue through the following steps. If an errordoes occur, the system will go to DOS, copy a filenamed ERRORFIL.TXT to the printer (note the /Rfor <Enter>, to select this file), then return to Sys-tem One software and halt the procedure.
IF ERROR[ permits conditional actions when anerror occurs during a test with limits. The action tobe taken is described by the keystrokes between theIf Error[ statement and a closing bracket, ].
IF NOTERROR[ permits conditional actionswhen an error does not occur during a test with lim-its. The action to be taken is described by the key-strokes between the square brackets [ ].
IF ABOVE[ permits conditional actions to takeplace in a procedure if a measurement above an up-per limit value occurs during a test. The action tobe taken is described by the keystrokes between theIf Above[ statement and a closing bracket, ].
IF BELOW[ permits conditional actions to takeplace in a procedure if a measurement below alower limit value occurs during a test. The action tobe taken is described by the keystrokes between theIf Below[ statement and a closing bracket, ].
IF n[ permits conditional actions to take place ina procedure when the operator presses a number key(0 through 9) on his computer keyboard correspond-ing to statements in the procedure. This permitscreation of menus within procedures so that opera-tors may select from a number of possible coursesof action. See the “Conditional Branching Upon Op-erator Input” section beginning on page 25-6 of thePROCEDURES chapter for more detail.
13.10. Util Menu
UTIL: RESTORE OUT WAIT DELAYBREAK LEARN END PROMPT MESSAGEGOTO AES/EBU FEED
UTIL RESTORE sets the System One hardwareto the current condition of the System One software.It is not normally used unless there has been apower interruption, or if the System One hardwarewas not turned on and connected to the computer atthe time the System One software was started.
UTIL OUT permits sending a data word to aspecified address port within the computer or to digi-tal output ports A, B, or C of the DCX-127 module.The purpose of this capability is control of externaldevices through an unused parallel port, via an inter-face card plugged into the computer, or via theDCX-127.
Util Out is normally used as part of a procedure,often to change the status of a remotely controllabledevice under test between portions of the test. Ex-amples include switching a tape recorder from re-cord to play mode or rewinding the tape, or switch-ing the gain or equalization of a remotely control-lable mixing console or audio processor. Util Out isthe one menu command which does not return youto the top level menu after execution. This wasdone because sequences of several consecutive out-puts are frequently required to control a device. Forexample, a device controlled by a momentary con-tact closure may require two commands via a relaycard; one to close the relay, and a second to re-openit. Such sequences can be executed more rapidly ina procedure since Util Out does not need to go backto the top menu between commands.
Warning: writing to the wrong port cancause a serious malfunction in your com-puter.
The addresses of the three digital output ports onthe DCX-127 module are A, B, and C. See theDCX-127 chapter of this manual for more details.
If a monochrome card with a printer port is pre-sent, its address in decimal is 956. A second andthird printer port if present would be decimal 888
13-18 Audio Precision System One User's Manual

and decimal 632. If no monochrome card printerport is furnished, the decimal address of the firstprinter port (treated by DOS as LPT1) is 888 andthe second port (LPT2) is 632. Each individual bitline of a printer port is compatible with LSTTLlogic. See the “Control of External Devices” sec-tion of the PROCEDURES chapter for connectorpin information on printer ports.
UTIL WAIT causes a procedure, during execu-tion, to pause until a specific binary word appears ata specific address port in the computer. The pur-pose of this capability is to synchronize a test proce-dure with the device under test or some other exter-nal event through an unused parallel port or in-put/output card plugged into the computer. An ex-ample could be a procedure which first rewinds atape machine (by use of Util Out, above), then waitsfor a signal from the machine that it is fully re-wound before continuing through the procedure.Any address port can be specified with any dataword (both expressed in decimal), and a “mask”word can also be specified for the cases where thestatus of some bits of the data word are not impor-tant. If the signal from the external device is a sin-gle logic line, all other bits could thus be maskedoff so that the Util Wait function looks only at thesingle relevant bit.
UTIL DELAY permits the insertion of a speci-fied time delay (in seconds) during a sequence oftests and operations in a procedure. It is typicallyused to permit a remotely controlled device or fix-ture to settle into its new condition before the testcontinues.
UTIL BREAK causes a procedure to halt, return-ing to the COMMAND menu, when it executes.Util Break is usually used within an If Error state-ment, to stop a procedure when an out-of-limitsmeasurement is detected.
UTIL LEARN starts the keystroke recordingprocess when creating procedures by learning key-strokes. All succeeding keystrokes will be ap-pended to the procedure until Util End is pressed. Ifa procedure is already in the procedure editor whenyou wish to generate a new, unrelated procedure,you should delete the old procedure by marking its
beginning and end with the <F6> key; you canquickly move to the end of the editor via<Ctrl><PgDn>. Util Learn automatically creates theheader PROCEDURE (with the software versionnumber) at the beginning of a procedure. Whenevera menu is on screen during the keystroke recordingprocess, the appearance of the menu name willchange to remind you that you are recording.
UTIL END terminates the keystroke recordingprocess of generating a procedure.
UTIL PROMPT permits the entry of a messageto the operator into a procedure. The message willthen appear on the computer screen when the proce-dure executes. The <Esc> key must be used to re-turn to the keystroke recording process when theprompt has been written. Procedure execution willpause with the message on screen until the <Enter>key is pressed by the operator.
UTIL MESSAGE permits entry of a messagewhich will be written into the error file (if one hasbeen attached to a test by use of the Names Err-filecommand) when the procedure executes. The<Esc> key must be used to return to the keystrokerecording process after the prompt is written.
UTIL GOTO , followed by a line label and <En-ter> key operation, causes flow of a procedure tojump to another location in the procedure, ratherthan simply continuing to the next line. The label isindicated in a procedure by a colon ( : ) symbol atthe beginning of the line. See the PROCEDURESchapter for more information on procedure controlflow and examples of use of the UTIL GOTO state-ment and labels.
UTIL SERIAL-DSP is the only menu commandwhich leads to a third and fourth level. UTIL SE-RIAL-DSP is functional only with the digital audioinputs and outputs of System One Dual Domain.UTIL SERIAL-DSP permits control over which ofthree serial modes are to be used for digital domaininterface, what type of dither (if any) is to be addedto the digital output signal, and also permits controland monitoring of the status bytes used with the
MENUS 13-19

AES/EBU and SPDIF/EIAJ interfaces. See theDIGITAL SIGNAL PROCESSOR chapter and sepa-rate DSP program manuals for more information.
UTIL FEED sends a form feed (page feed) com-mand to an attached parallel printer. The intent ofthe UTIL FEED command is for use when a /F com-mand line option has been used to override normalgraph printout formatting. When formatting hasbeen overridden, the printer will simply stop at thebottom of a graph. If desired, a UTIL FEED com-mand may then be used to advance the paper to thetop of the next page. See the Hard Copy chapter formore information on graphic printouts and the /F op-tion (page 15-3).
13.11. Compute Menu
COMPUTE: NORMALIZE INVERTSMOOTH LINEARITY CENTER DELTA2-SIGMA EXCHANGE
COMPUTE functions permit mathematical ma-nipulation of the data in memory from a previously-made test. They can be executed immediately aftera test is made, or can be run on test data previouslyrun, saved to disk, and re-loaded.
As a group, the COMPUTE functions replacethe original test data with a computed result. If itwill ever be desirable to use the original data, savethe test before using a COMPUTE function. If theresults after using the COMPUTE function arealso to be saved, use a different test name to avoidover-writing the original data.
Most of the COMPUTE functions allow numericarguments to be typed in following selection of thesecond-level function, before pressing the <Enter>key. The prompt line for entry of these numbers in-dicates their meaning and whether or not they areoptional. Items enclosed in square brackets [ ] areoptional. Items enclosed in parenthesis ( ) describewhat information is to be typed in. These argu-ments and their effect are discussed under each com-mand below.
COMPUTE NORMALIZE multiplies everyDATA-1 or DATA-2 point in memory,in the baseunit, by the same value. The base unit is Volts forall amplitude measurements (including distortion,wow and flutter, etc.), Hz for frequency measure-ments, degrees for phase measurements, and % forrelative distortion or wow and flutter measurements.COMPUTE NORMALIZE is normally used onlyfor amplitude measurements, where the data is nor-mally viewed logarithmically (dB, or Volts with aLOG vertical scale). Given that a log display or dBlinear is in use, COMPUTE NORMALIZE thus hasthe visual effect of offsetting amplitude data verti-cally without changing the shape of the curve.
The multiplier constant used is the value requiredto bring the data at a specified “horizontal” value(value of the independent variable) to a specified tar-get value expressed in the displayed units.
The form of entry for the command is:
COMPUTE NORMALIZE [data set], horizontalvalue, [target] <Enter>
Data set, if typed in, must be the number 1 or 2.1 refers to DATA-1 values (second column in thedata editor or table display), 2 refers to DATA-2 val-ues. If no number is entered, the system assumesDATA-1 is to be normalized.
HORIZONTAL VALUE is the point along the in-dependent variable axis (usually SOURCE-1) whichis to be exactly at the TARGET after multiplication.Pre-fixes such as k for kilo are permitted.
TARGET is the value after multiplication at thespecified horizontal value. The software assumesthat the TARGET value entered is in the selecteddisplay units for the data column (DATA-1 orDATA-2) being normalized. If no number is en-tered for TARGET, the system assumes the target tobe 1.000 in the basic unit for the parameter meas-ured. Volts is the basic unit for all amplitude pa-rameters—AMPLITUDE, LEVEL, BANDPASS,BANDREJECT, 2-CHANNEL, XTALK. Thus, se-lecting COMPUTE NORMALIZE with no TAR-
13-20 Audio Precision System One User's Manual

Figure 13-10 Loudspeaker Frequency Response by Sinewave Sweep (201 Points) Before Smoothing
Figure 13-11 Loudspeaker Frequency Response After Default Smoothing
MENUS 13-21

GET value specified will produce data goingthrough 1.000 Volt (zero dBV, +2.2 dBu) at the hori-zontal value specified.
For example, assume that it is desired to removethe channel imbalance from a frequency responsemeasurement of a stereo device such as a CDplayer. The DATA-1 value (left channel) alreadygoes through zero dBr at 1 kHz as a result of press-ing the F4 key while the 1 kHz reference was play-ing. To re-align the right channel data, normalizethe DATA-2 column so that it also passes throughzero dBr at 1 kHz. The command form would be:
COMPUTE NORMALIZE 2, 1k, 0 <Enter>
One use of Compute Normalize is in preparationof an equalization file (xx.EQ extension) which willnot cause a change in generator output level whenchanging between SINE and EQSINE modes at thespecified reference frequency. See the EQUALIZA-TION chapter for more details on equalization files.Compute Normalize can also be used to standardizean amplitude measurement data file or multiple setsof data files to pass through unity as a common ref-erence point.
COMPUTE INVERT replaces each DATA-1value in memory with its reciprocal; DATA-2 val-ues, if present, are not affected. It thus “turns over”or inverts the shape of the data curve (assuming thatthe curve is graphed with decibel or logarithmicVolts units). Compute Invert creates a vertical rota-tion about a 1.000 Volt (0 dBV) value. The princi-pal intended use of the Compute Invert function isin creating an equalization file for the generatorEQSINE function which will exactly compensate forthe varying frequency response of the device undertest. See the EQUALIZATION chapter for more de-tails and examples on use of this function. No nu-meric arguments are required or accepted for COM-PUTE INVERT.
COMPUTE SMOOTH applys a smoothing algo-rithm to the data and can also average an entire datafile to a single value. The smoothing is a simplerunning three-point average process. Each set ofthree adjacent points in the pre-smoothing data is av-
eraged, with the computed average becoming thecenter of the corresponding points in the smootheddata. The form of the command is:
COMPUTE SMOOTHdata, [passes]<Enter>
DATA, as described above, is 1 or 2 to specifyDATA-1 or DATA-2. DATA-1 is assumed if novalue is typed in. PASSES describes how manytimes the smoothing algorithm is applied to the data.This argument is optional. If no value is entered forPASSES, the default selection will be three passeson short tests (up to 63 data points). On longertests, the default number of passes will be the larg-est integer in one-half the square root of the numberof the points in the data. Any positive integer (oneor greater) may be specified for more or less smooth-ing. Figure 13-10 shows a loudspeaker frequency re-sponse measurement before default smoothing andFigure 13-11 after the default smoothing, which was7 passes in this case.
To average all the data points in a test file, selectCOMPUTE SMOOTH with the selected data setand any negative number for the second argument;for example:
COMPUTE SMOOTH 1,-1 <Enter>
The system will average all the DATA-1 points,then replace them all with the computed averagevalue. The graphic result will be a horizontalstraight line at the computed average value.
COMPUTE LINEARITY generates a best fitstraight line to a specified portion of the data, thencalculates the deviation of each data point from thatstraight line. The line is generated by the leastsquares method. If only a limited portion of thedata is used to generate the line, every data point (in-cluding those outside that limited range) is com-pared to the line. The form of the command is:
COMPUTE LINEARITY data, [low, high]<En-ter>
DATA specifies DATA-1 or DATA-2. LOWand HIGH are optional entries. They define the“window” or portion of the horizontal axis (inde-
13-22 Audio Precision System One User's Manual
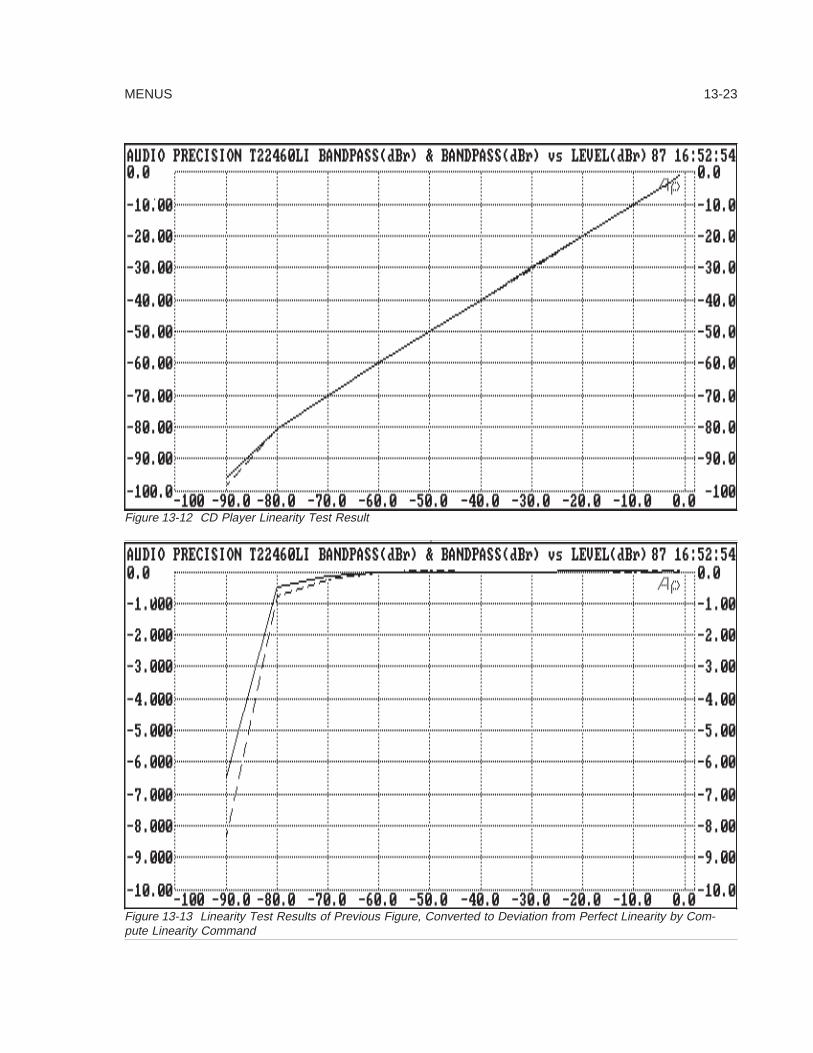
Figure 13-12 CD Player Linearity Test Result
Figure 13-13 Linearity Test Results of Previous Figure, Converted to Deviation from Perfect Linearity by Com-pute Linearity Command
MENUS 13-23

pendent variable) within which data points will beused to calculate the best fit straight line. If theyare not supplied, the line will be fitted to the entiredata range.
A good example application of COMPUTELINEARITY is in linearity testing of compact discplayers. Figure 13-12 is an example of a CD playerlinearity test result, after replacing the column onedata with the actual amplitudes on the test disc assupplied by the disc manufacturer. It is thus an ac-curate measurement of linearity but is difficult toanalyze, since a dynamic range of 100 dB isgraphed. It can be seen that the linearity is best atthe high-amplitude portion of the range, from 0 to−50 dB. The command to compute deviation frombest straight line could be:
COMPUTE LINEARITY 1, −50, 0 <Enter>
Figure 13-13 is the graph after the COMPUTELINEARITY operation and after changing theDATA-1 GRAPH TOP and BOTTOM from 0 and−100 dBr to +1 and−9 dBr to properly display the de-viations from perfect linearity.
COMPUTE CENTER is designed for use withtests that have both upper and lower comparisonlimit files attached. If COMPUTE CENTER is runafter the test has been made, it will move the se-lected data array up or down as necessary to bestcenter the data between the limits. This is a fre-quent necessity in microphone testing, where theshape of the response curve is more important thanthe absolute values (sensitivity). The form of thecommand is:
COMPUTE CENTER data <Enter>
DATA specifies DATA-1 or DATA-2, as in mostother COMPUTE functions.
COMPUTE DELTA will compute the differ-ence between the data in memory and the data in an-other file specified by the user. The second file isspecified by use of the Names Delta command.This permits calculating and displaying the differ-ence between two tests.
Since COMPUTE DELTA is a subtraction andoperates in the displayed units, it is normally usedon “linear” data such as phase (degrees) or ampli-tude expressed in dB. It can be used as a form ofanalyzer equalization to produce a set of data con-sisting of a frequency response measurement withan equalization curve subtracted from it, given thatboth curves were displayed in dB. It can be used to“offset” a phase versus frequency measurement verti-cally. The form of the command is:
COMPUTE DELTAdata, data<Enter>
The first DATA specifies whether the DATA-1 orDATA-2 values presently in memory are to be thebasis of the final result. The second DATA speci-fies whether the DATA-1 or DATA-2 values of theNames Delta file are to be subtracted from the datain memory. If the second data set argument is nottyped in, the system uses the same data set in theDELTA file as in memory.
To compute the difference between frequency re-sponse measurements of the two channels of a ste-reo system (given that the measurements were indB), use the Names Delta command to name the testitself as the delta file. Run the test and save it viaSave Test. Invoking COMPUTE DELTA 1,2 <En-ter> or COMPUTE DELTA 2,1 <Enter> will thensubtract the specified channel of the test saved todisk from the specified channel of the test in mem-ory. Press <F7> to display the results.
To apply an equalization file to measured test re-sults, the equalization file should first be convertedto dBr units with the data going through zero dBr ata reference frequency (usually 1 kHz). The COM-PUTE NORMALIZE command may be used tomake the .EQ file go through zero at the desired fre-quency. NAMES DELTA and COMPUTE DELTAare then used for the calculation.
COMPUTE 2-SIGMA is designed specificallyfor wow and flutter testing. It is common in wowand flutter measurements to take data for a period ofseconds or tens of seconds, but to then display or re-cord a single number representing the value whichwas exceeded for 5% of the time. This is not a truestandard deviation approach, although the 5% value
13-24 Audio Precision System One User's Manual

is derived from the fact that in a Gaussian distribu-tion, the two-standard-deviation value will be ex-ceeded only 5% of the time.
The form of the command is:
COMPUTE 2-SIGMAdata<Enter>
DATA specifies DATA-1 or DATA-2, as usual.DATA-1 is assumed if no value is typed in. TheCOMPUTE 2-SIGMA operation replaces every datapoint in the specified column with the same com-puted value. The computed result can thus begraphed and will always be a horizontal straight lineat the computed value.
COMPUTE EXCHANGE interchanges theDATA-1 and DATA-2 sets of values of any test inmemory which has data in both areas. It also ex-changes the DATA-1 and DATA-2 fields on theSWEEP TEST DEFINITIONS panel. The com-mand is simply:
COMPUTE EXCHANGE
There are no numeric arguments and no <Enter>key operation is necessary. Another form of thecommand, when in Panel mode, is <Alt><X>. Asecond operation of COMPUTE EXCHANGE willrestore the data columns to their original locations.
A secondary application of COMPUTE EX-CHANGE is to simplify panel setup for a STEREOtest. In stereo tests, it is usually desired to haveidentical units, graph top and graph bottom, LOG vsLIN choice, number of divisions, etc., at bothDATA-1 and STEREO/DATA-2. Choose the de-sired module and parameter at DATA-1; for exam-ple, LVF1 RDNG. Select the DATA-1 graphic coor-dinates, units, and other display parameters as de-sired. Move the cursor to STEREO (DATA-2) andselect the same module and parameter as at DATA-1; LVF1 RDNG in this example. Then press either<Esc> COMPUTE EXCHANGE or <Alt><X> (thekeyboard “short cut” equivalent to COMPUTE EX-CHANGE) and the graphic display parameters fromDATA-1 will copy to STEREO/DATA-2. Note thatif any data was in memory at the time, the data willalso be swapped by the COMPUTE EXCHANGE
or <Alt><X> operation. If only the display parame-ter copying action is desired without the data swap,operate <Alt><X> or COMPUTE EXCHANGE asecond time which will swap the data back to theoriginal positions.
13.12. : (Colon) Line Label Symbol
: The colon (:) symbol, when the first characterof a row in a procedure, identifies this line as a la-bel. The name following the : symbol is the nameof this line. A UTIL GOTO statement anywhere inthe procedure will then cause procedure flow tojump to the location of this label. The : selection inthe COMMAND menu permits line labels to be en-tered into a procedure during UTIL LEARN mode.The name of the label is then typed in, and termi-nated with the <Enter> key.
MENUS 13-25

13-26 Audio Precision System One User's Manual

14. BARGRAPH DISPLAY
In addition to the numeric readouts at the top ofthe ANALYZER panel and the line graphs gener-ated during sweep measurements versus amplitude,frequency, or time, System One offers a third typeof display. The bargraph display, reproduced asFigure 14-1, provides an analog-like indication ofmagnitude of up to three measured parameters. Italso allows analog-like control of a stimulus parame-ter (GEN FREQ, GEN AMPL, ANLR BPBR, SWI,DCX DCOUT, or DCX DIGOUT) while displayingup to two measured parameters, or two stimulus pa-rameters while displaying one measured parameter.
14.1. Analog Indicators forAdjustments
The principal intended applications of the bar-graph screen are cases where the user must adjustthe device under test or stimulus to some targetvalue, or simply wishes to monitor a parameter.Common examples are making adjustments in anamplifier for minimum distortion or noise, or adjust-ing tape head azimuth for maximum output or zerophase. Peaking or nulling operations are much eas-ier with a bargraph than when observing numericreadout. The display update rate in bargraph modeis controlled by the readings per second parameteron the DETECTOR line of the ANALYZER panel.A minimum of 8 readings per second is recom-mended for good information feedback when mak-ing adjustments, and 16 or 32 readings per secondmay be preferred.
Figure 14-1 Bargraph Display
14-1

The bargraph display is obtained by pressingfunction key <F2> or Run Bargraph. The selectionsof which parameters will be displayed and of thesensitivity of the display are made from the SWEEP(F9) DEFINITIONS panel. The top bargraph isdriven from the DATA-1 selections. The center ofthe panel may contain a second measurement bar-graph driven from the DATA-2 selections, or astimulus control line when SOURCE-2 replacesDATA-2. The bottom portion of the screen maycontain a third measurement bargraph if EXTERNalAMPL or FREQ is chosen, or can be the primarystimulus control line when SOURCE-1 is selected.Both stimulus control lines can be simultaneouslycontrolled by the mouse or arrow keys. When thestimulus source is GEN FREQ or GEN AMPL, the<+> and <Del> keys will also control the SOURCE-1 stimulus by the FREQSTEP or AMPSTEP values.
Note that with original version System One hard-ware (prior to System One-A), even when STEREOmode is selected on the DATA-2 line, both the topand middle bargraphs will be displaying the samemeasurement of the channel selected at the top ofthe ANALYZER panel. It is not possible with theoriginal version of System One to display measure-ments from both channels of a stereo device simulta-neously in bargraph mode. With System One-Ahardware, use of the 2-CHANNEL function can pro-vide bargraphs of amplitude on both channels simul-taneously. Select either RDNG at DATA-1 andLEVEL at DATA-2, or vice-versa.
For the top two measurement bargraphs, use theDATA-1 or DATA-2 fields to select measurementsource, units of display, LOG or LIN, and the bar-graph end points. The numbers entered for GRAPHTOP and BOTTOM will set the two ends of the bar-graph display. The large digits displayed near eachbargraph give the exact value of the measurement.Note that these digits will continue to function, dis-playing the measurement value, even if the analogdisplay of measurement moves off either end of thebargraph display due to the particular end points se-lected on the SWEEP (F9) DEFINITIONS panel.As the data varies, note that the outline of the bar-graph remains at the highest and lowest valuesreached to indicate the maximum and minimum
peaks reached by the data. The maximum and mini-mum values reached are also indicated numericallyon the screen. This peak hold feature can be re-setto the current level at any time by pressing the <F2>key or mouse button.
A vertical “tic mark” is located at the exact cen-ter of each of the measurement bargraphs, for possi-ble use as a “target” for adjustments. If it is desiredto use the mark as a target, the two end points andlog or lin shape must be carefully selected on theSWEEP (F9) DEFINITIONS panel so that the mid-point target corresponds to the desired electricalvalue. In a procedure, it is also possible to mark ad-ditional targets or a range by typing onto the bar-graph screen; see the end of this chapter for more de-tails.
14.2. Stimulus Control withBargraphs
The bottom of the bargraph screen can provideeither generator stimulus control, analyzer BP/BR fil-ter frequency control, switcher channel control,DCX-127 dc output or digital word output control,or a third measurement bargraph.
For control of a single stimulus parameter, theSOURCE-1 line selection must be the desired stimu-lus (GEN FREQ, GEN AMPL, GEN tone burst con-trol, ANLR BPBR, SWI, DCX DCOUT, or DCXDIGOUT). The end points and units are set by theSTART and STOP entries, and the LOG/LIN selec-tion controls the relationship of the cursor positionto the parameter. Note that if LOG is selected buteither the START or STOP value is negative orzero, the actual calibration will revert to LIN sincethe LOG of zero and negative numbers is not de-fined.
The cursor line may be moved back and forth bythe horizontal arrow keys (or the mouse, if avail-able). This provides the analog-like control over thevariable parameter desirable for operations such asfinding the center frequency of a bandpass filter, thefrequency of a noise component, or the clippingpoint of an amplifier. When the stimulus is GENFREQ, GEN AMPL, SWItcher channel, tone burst
14-2 Audio Precision System One User's Manual

on-time, or tone burst interval, the value and cursormay also be controlled by the increment <+> anddecrement <Del> keys. Operation of these keysmoves generator frequency in FREQSTEP incre-ments, or generator amplitude in AMPSTEP incre-ments. SWItcher channel is moved in one-step in-crements, which is very convenient when aligningmulti-track tape recorders. Tone burst “ON” and in-terval values are moved in steps of one cycle whenthe units are cycles, one second when the units areseconds, one percent when on-time is expressed inpercent duty factor, and one burst per second wheninterval is expressed in Bps.
The initial location of the stimulus cursor is deter-mined by the numeric entry on the panel for thatstimulus parameter (AMPLITUDE or FRE-QUENCY value on the GENERATOR panel,BR/BR FREQ on the ANALYZER panel, DCOUT1on the DCX panel, switcher channel on theSWITCHER panel, etc.). Upon exit from the bar-graph display (via <Esc> or <Enter>) to the panel,the cursor value sets the panel value. The <Ctrl>and <Shift> keys magnify the movement of the cur-sor caused by the arrow keys. Operation of the hori-zontal arrow keys will cause a one-step change inthe generator. <Ctrl> arrow key will cause a 5-stepchange; <Shift> arrow key will cause a 25-stepchange. Setting resolution is limited to 1 part in500 by the horizontal graphic resolution of thescreen. The sensitivity of amplitude or frequency tocursor movement can be adjusted by proper selec-tion of the end points on the SWEEP (F9) DEFINI-TIONS panel.
When GEN FREQ or GEN AMPL is theSOURCE-1 selection, sensitivity of cursor move-ment caused by the increment <+> and decrement<Del> keys is determined by the FREQSTEP andAMPSTEP values entered on the GENERATORpanel. One application of this feature is to permitany arbitrary frequency or amplitude change withone keystroke. For example, if the adjustment proc-ess for an audio device requires repeated amplitudemeasurements at 1 kHz and 10 kHz, FREQSTEPcould be selected as 9 kHz on the GENERATORpanel. The GENERATOR panel would be set to 1kHz. Bargraph mode is then selected with an ampli-tude display at DATA-1 or DATA-2 and GEN
FREQ selected as SOURCE-1. The frequency canbe instantly toggled back and forth between 1 kHzand 10 kHz with the increment and decrement keyswhile making adjustments on the device and observ-ing the results on the bargraph.
14.2.1. Simultaneous Amplitude andFrequency Control
When it is desired to control both generator am-plitude and frequency (or any other combination oftwo stimulus parameters) from the mouse or arrowkeys, select GEN FREQ at SOURCE-1 as describedabove; near the center of the SWEEP (F9) DEFINI-TIONS panel, change DATA-2 to SOURCE-2,change ANLR to GEN, and select AMPL as theGEN parameter. Only one measurement parametermay be selected in this mode, as selected at DATA-1. When you press <F2> (or Run Bargraph) to goto the bargraph screen, you will find a generator am-plitude line and cursor at the screen center and agenerator frequency line and cursor at the screen bot-tom; see Figure 14-3 for an example. “Vertical” mo-tion of the mouse (along its long axis) will controlamplitude, and horizontal motion of the mouse willcontrol frequency. The vertical and horizontal ar-row keys will also control these parameters; notethat <Ctrl><vertical arrow> is not defined by theIBM keyboard, and therefore cursor movement mag-nification with the vertical arrow keys is limited tothe <Shift> key. The increment <+> and decrement<Del> keys affect only the SOURCE-1 parameter.
14.3. Three Parameter Bargraphs
The bottom of the bargraph screen can also dis-play frequency, or amplitude as measured by theLEVEL voltmeter, resulting in three parameters be-ing measured and displayed as bargraphs simultane-ously. To make the bottom into a measurement bar-graph instead of generator stimulus control, selectEXTERNal instead of GEN as SOURCE-1. Selecteither FREQ or AMPL to be displayed, select the de-sired units, use START and STOP to control theend points, and select STEP TYPE LOG or LIN asdesired. See Figure 14-2 for an example.
BARGRAPH DISPLAY 14-3

Figure 14-2 Bargraph with Three Measurement Parameters
Figure 14-3 Bargraph for Simultaneous Generator Amplitude and Frequency Control
14-4 Audio Precision System One User's Manual

With System One-A hardware, it is possible toset up a useful display for stereo or multi-track taperecorder adjustments with the amplitude of two chan-nels and inter-channel phase displayed simultane-ously. Select channel A and the 2-CHANNEL func-tion at MEASURE on the ANALYZER panel. Se-lect ANLR RDNG for DATA-1 (channel A ampli-tude), ANLR PHASE for DATA-2, and EXTERNAMPL as SOURCE-1 (channel B amplitude).
14.4. Bargraphs in Procedures
A bargraph panel can be incorporated as part of aprocedure by first specifying a xx.TST file whichsets the desired parameters and scaling factors, andsaving the test. In the procedure, Load this Test andthen enter Run Bargraph or <F2> into the procedureto select the bargraph panel and pause until the op-erator presses the <Enter> key.
In a production test application, a prompt to theoperator might be required to describe the desired ac-tion. Prompts can be typed directly onto the bar-graph during creation of a procedure. If the first
keystroke in a procedure following the <F2> or RunBargraph command is a space or some other key-stroke not interpreted as a command when a bar-graph is on screen (not an arrow key or <Esc>), thespace and backspace keys and keyboard charactersmay then be used to create the desired prompt at thedesired location on the bargraph. Characters couldbe used to indicate additional calibration marks astargets or range markers for adjustment. You can-not move back up by single lines, but the <Home>key can be used to jump back to the top left cornerof the screen in this mode. Do not type on the bar-graph area itself, or the message will obliterate thebargraph. Creation of the message is terminated bypressing <Esc>, which also exits from the bargraph.Figure 14-4 shows an example of a bargraph withprompting message and additional calibration marks.
14.5. Printing Bargraphs
A bar-graph on screen may be printed to an at-tached compatible printer by pressing the <*> key.Note that on newer-type AT keyboards, the <*> keyis totally separate from the <PrintScrn> key. Do not
Figure 14-4 Bargraph with Prompting Message and Additional Calibration
BARGRAPH DISPLAY 14-5

use the <PrintScrn> key. Any prompts and themaximum and minimum indications will also printout, as will any comments in the comments editor atthe time the <*> key was pressed.
14-6 Audio Precision System One User's Manual

15. HARD COPY PRINTOUT
15.1. Introduction
If you have a compatible dot matrix printer orHP LaserJet connected to your computer via the par-allel interface, you can obtain paper printout of testgraphs, bargraphs, tabular data, and setup panels.These printouts can be made at a single key pushfrom within S1.EXE software. Resolution of thegraphs will be no better than the resolution of thecomputer display system (pixel limited).
Graph printouts (not panels or tabular data) canalso be obtained via RS-232-connected HPGL-com-patible plotters (in multi-pen colors), RS-232-con-nected PostScript laser printers such as the Apple
LaserWriter, and RS-232 or parallel connected HPLaserJet laser printers. These are vector-drawing de-vices and the graphic resolution will be limited onlyby the output device and the number of points takenin the measurement. The plotter and laser printoutsare obtained by exiting or quitting S1.EXE software,then running another Audio Precision-furnished pro-gram to define and execute the printing. For the HPLaserJet II, an additional hardware or software prod-uct (not furnished by Audio Precision) is requiredwhich effectively converts the LaserJet to HPGL for-mat. An HP LaserJet III with two megabtyes ofmemory can operate directly in HPGL mode.
ASTERISK<*>
SCREEN DUMP
• GRAPHS, PANELS,TABULAR DATA
• GRAPH RESOLU-TION LIMITED BYDISPLAY SYSTEMPIXELS
• PARALLEL INTFCONLY
• DOT MATRIX: EP-SON-FX-EX-LQ COM-PATIBLE, OR IBMGRAPHICS
• HP LASERJET• PRINTER TYPE, DEN-
SITY, GRAPHHEIGHT, WIDTHSPECIFIED BY /P OP-TIONS.
HP LASERJETW/ “PLOTTER
IN A CAR-TRIDGE” ORLASERJET IIIW/ 2 MEG INHPGL MODE,
PARALLELOR RS-232
• START S1.EXE WITH /GOPTION.
• SAVE GRAPH XX.GDL.• RESOLUTION LIMITED
ONLY BY OUTPUT DEVICE
PLOT.EXE POST.EXE
HPGL PENPLOTTER
(MULTI-PENCOLOR)
DISKFILE
XX.GL
DOS COPYCOMMAND
DOS COPYCOMMAND
DISKFILE
XX.PSPOSTSCRIPT-COMPATIBLE
LASER PRINTER(i.e.,APPLE LASER-
WRITER),RS-232
“LASERPLOTTER”
SOFTWAREPLOTTEROR HP
LASERJETW/ “PLOT-TER IN A
”CAR-TRIDGE"RS-
232,
HP LASER-JET W/
“PLOTTERIN A CAR-TRIDGE”
PARALLEL
HP LASER-JET, RS-232 OR
PARALLEL
.GDL FILE
DISKFILE
XX.EPS
/I opt.
Figure 15-1 Representation of Hard Copy Print-Out Modes and Devices Supported by System One Software
15-1

Figure 15-2 Pixel-Limited and Vector Mode HP Laserjet Printed Graphs
15-2 Audio Precision System One User's Manual
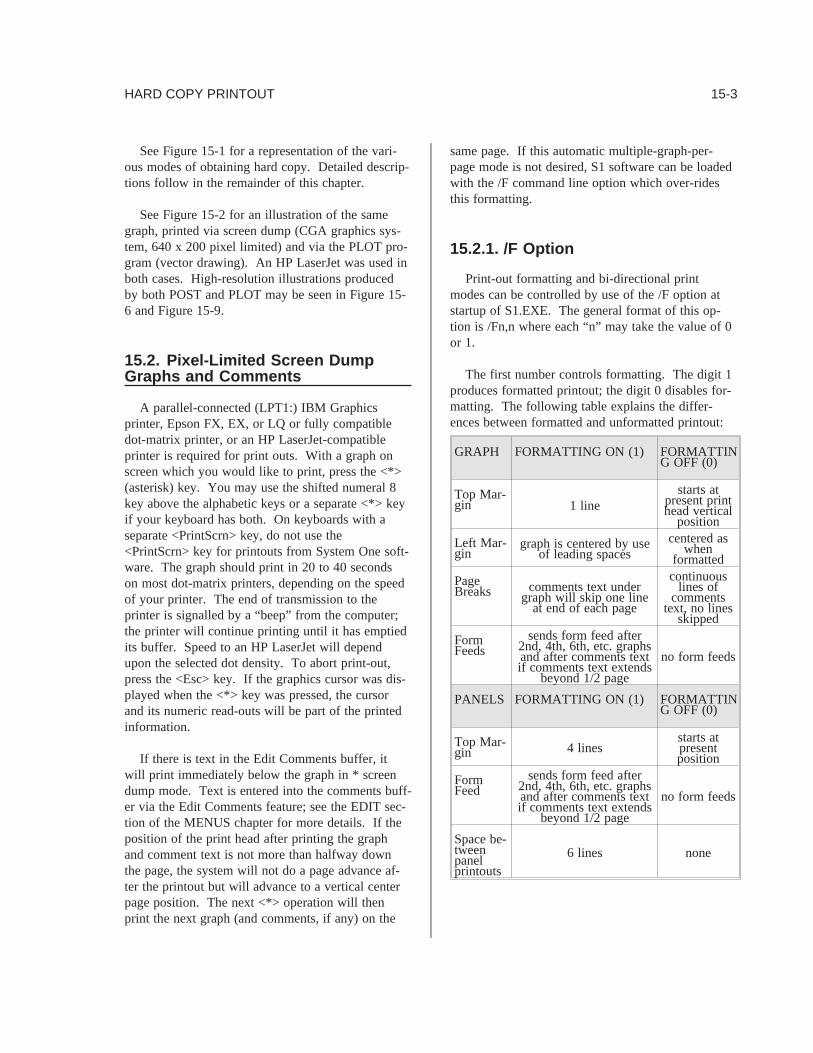
See Figure 15-1 for a representation of the vari-ous modes of obtaining hard copy. Detailed descrip-tions follow in the remainder of this chapter.
See Figure 15-2 for an illustration of the samegraph, printed via screen dump (CGA graphics sys-tem, 640 x 200 pixel limited) and via the PLOT pro-gram (vector drawing). An HP LaserJet was used inboth cases. High-resolution illustrations producedby both POST and PLOT may be seen in Figure 15-6 and Figure 15-9.
15.2. Pixel-Limited Screen DumpGraphs and Comments
A parallel-connected (LPT1:) IBM Graphicsprinter, Epson FX, EX, or LQ or fully compatibledot-matrix printer, or an HP LaserJet-compatibleprinter is required for print outs. With a graph onscreen which you would like to print, press the <*>(asterisk) key. You may use the shifted numeral 8key above the alphabetic keys or a separate <*> keyif your keyboard has both. On keyboards with aseparate <PrintScrn> key, do not use the<PrintScrn> key for printouts from System One soft-ware. The graph should print in 20 to 40 secondson most dot-matrix printers, depending on the speedof your printer. The end of transmission to theprinter is signalled by a “beep” from the computer;the printer will continue printing until it has emptiedits buffer. Speed to an HP LaserJet will dependupon the selected dot density. To abort print-out,press the <Esc> key. If the graphics cursor was dis-played when the <*> key was pressed, the cursorand its numeric read-outs will be part of the printedinformation.
If there is text in the Edit Comments buffer, itwill print immediately below the graph in * screendump mode. Text is entered into the comments buff-er via the Edit Comments feature; see the EDIT sec-tion of the MENUS chapter for more details. If theposition of the print head after printing the graphand comment text is not more than halfway downthe page, the system will not do a page advance af-ter the printout but will advance to a vertical centerpage position. The next <*> operation will thenprint the next graph (and comments, if any) on the
same page. If this automatic multiple-graph-per-page mode is not desired, S1 software can be loadedwith the /F command line option which over-ridesthis formatting.
15.2.1. /F Option
Print-out formatting and bi-directional printmodes can be controlled by use of the /F option atstartup of S1.EXE. The general format of this op-tion is /Fn,n where each “n” may take the value of 0or 1.
The first number controls formatting. The digit 1produces formatted printout; the digit 0 disables for-matting. The following table explains the differ-ences between formatted and unformatted printout:
GRAPH FORMATTING ON (1) FORMATTING OFF (0)
Top Mar-gin 1 line
starts atpresent printhead vertical
position
Left Mar-gin
graph is centered by useof leading spaces
centered aswhen
formatted
PageBreaks comments text under
graph will skip one lineat end of each page
continuouslines of
commentstext, no lines
skipped
FormFeeds
sends form feed after2nd, 4th, 6th, etc. graphsand after comments textif comments text extends
beyond 1/2 page
no form feeds
PANELS FORMATTING ON (1) FORMATTING OFF (0)
Top Mar-gin 4 lines
starts atpresentposition
FormFeed
sends form feed after2nd, 4th, 6th, etc. graphsand after comments textif comments text extends
beyond 1/2 page
no form feeds
Space be-tweenpanelprintouts
6 lines none
HARD COPY PRINTOUT 15-3

Note that when automatic form feeds (page ad-vances) are disabled by the /F option, the operatormay manually or in a procedure cause a form feedat any desired point by use of the Util Feed menucommand.
The second digit controls bi-directional printing.The digit 1 produces bi-directional printout, wherethe print head moves from left to right on one passand right to left on the next pass. This mode pro-duces the fastest printout. The digit 0 causes uni-di-rectional printout. While slower, uni-directionalprintout will produce higher quality graphs on someprinters which tend to produce vertical lines with adegree of “waviness” in bi-directional mode.
For example, the command to start System Onesoftware with formatting disabled and uni-direc-tional printout would be:
S1 /F0,0 <Enter>
If the /F option is invoked without a digit follow-ing, it is equivalent to /F0,1 (formatting disabled,bi-directional printing).
15.2.2. Graph Size Selection andPrinter Compatibility
Graphic printout of any desired height and widthcan be obtained by use of the /P option whenS1.EXE software is loaded. Figure 15-3 lists thecommand line printer specification codes, the printermodes supported by S1.EXE, and the horizontal andvertical dot density produced by the printer in eachmode. The first four modes (codes 0 through 3) aresupported by both IBM and Epson (or Epson-com-patible) printers. The next four modes (codes 4-7)are available only in Epson and Epson-compatibleprinters. Modes 8-18 are available only in the Ep-son LQ series and LQ-compatible (24-pin) printers.Modes 19-22 support the HP LaserJet and compat-ibles at several different dot densities.
To specify a printer mode and graph size otherthan the default value, the software must be startedwith the /P option followed by three numbers sepa-rated by commas:
S1 /P#,#,# <Enter>
The first number is the printer code selected fromFigure 15-3. The second and third numbers are thedesired height and width of the graph (in inches).To obtain a 3 inch high by 5 inch wide graph inmode 2, for example, the software would be started:
S1 /P2,3,5 <Enter>
Batch files or the DOS Environment area may beused to specify the printer mode and graph size auto-matically, rather than requiring these characters tobe typed each time the software is started. See theCREATING YOUR CUSTOM SOFTWARESTART-UP PROCESS Chapter, beginning on 28-1,for details.
15.2.3. Graph Quality vs Size, PrinterMode, and Display System
Completely arbitrary selection of printed graphsize will not generally produce the highest quality re-sult. This is because both the computer display sys-tem and the printer are dot matrix devices. For theprinted image to offer the full detail of the screen,every dot (pixel) of the display screen must map toa single dot or fixed number of dots in the printer.If the screen dot-to-printer dot mapping is not an in-tegral ratio such as 1:1, 1:2, etc., the software mustperiodically round off to an adjacent dot as the print-out is made. The result will be one or more dis-torted areas in the graph, consisting of doubledlines, distorted characters, etc.
In order to select graph size for undistorted print-out, you must know the graphic resolution of yourgraphics display system and the available resolu-tion(s) of your printer. Figure 5-2 on page 5-7shows the horizontal and vertical full-screen resolu-tion of the various graphics display systems sup-ported by S1.EXE.
For example, assume your graphics system isCGA-compatible with a MONO-GRAPH display.From Figure 5-2, you can determine that the screendisplays 640 dots horizontally across its full widthand 200 dots across its height. Assume that your
15-4 Audio Precision System One User's Manual

printer supports mode 2, with 120 dots/inch horizon-tal and 72 dots/inch vertical resolution. The accept-able printed graph heights are those sizes which re-
sult in an integer ratio ofscreen dotsprinter dots
. For the verti-
cal axis, the smallest graph height which will showfull screen resolution is 200/72 = 2.7777 inches.Other acceptable heights are integral multiples ofthis value: 5.5555 inches, 8.3333 inches, etc. Thesmallest printed width for full screen resolution is640/120 = 5.3333 inches. To select mode 2 with a2.7777 inch height and 5.3333 inch width, start S1as follows:
S1 /P2,2.7777,5.3333 <Enter>
15.2.4. Landscape and PortraitOrientation Graphs
To obtain graphic printout with the graph rotated90 degrees, add 100 to the printer code selectedfrom Figure 15-3. This is commonly referred to aslandscape mode, where the paper would be heldwith its long axis horizontal while viewing thegraph. For example, to use printer mode 2 but witha 90 degree rotation of the printout, and to obtain alarge 8 inch by 10 inch graph, start the software:
S1 /P102,10,8 <Enter>
SCREEN DUMP (ASTERISK) PRINT MODES OF S1.EXE SOFTWARE
HORIZ. VERT.RES. RES
MODE DESCRIPTION (dots/in.) (dots/in.)—— ——————————- —————- ————/P0 IBM/Epson single density 60 72
/P1 IBM/Epson low speed double density 120 72/P2 IBM/Epson high speed “double” density 120 72/P3 IBM/Epson quadruple density 240 72/P4 Epson “CRT 1” 80 72/P5 Epson 1:1 (plotter) 72 72
/P6 Epson “CRT 2” 90 72/P7 Epson dual density plotter 144 72/P8 Epson LQ single density 8 wire 60 60/P9 Epson LQ low speed double density 8 wire 120 60
/P10 Epson LQ high speed double density 8 wire 120 60/P11 Epson LQ quadruple density 8 wire 240 60/P12 Epson LQ “CRT 1” 8 wire 80 60/P13 Epson LQ “CRT 2” 8 wire 90 60/P14 Epson LQ single density 24 wire 60 180
/P15 Epson LQ double density 24 wire 120 180/P16 Epson LQ “CRT 3” 24 wire 90 180/P17 Epson LQ triple density 24 wire 180 180/P18 Epson LQ hex density 24 wire 360 180/P19 HP PCL (LaserJet) 75 75
/P20 HP PCL (LaserJet) 100 100/P21 HP PCL (LaserJet) 150 150/P22 HP PCL (LaserJet) 300 300
Figure 15-3 Command Line /P Options for Print-Out Control
HARD COPY PRINTOUT 15-5

The contents of the Edit Comments buffer willnot print out in landscape mode. Note that heightand width are relative to the paper, not to the graph,and thus are effectively interchanged in landscapeorientation. The example immediately above there-fore produces a landscape orientation graph 8 incheshigh by 10 inches wide.
The normal mode supporting two graphs per pageis referred to as portrait mode, where the paper isheld with its long axis vertical while viewing graphs.
15.2.5. Graphs Without Grids
To prepare original graphs for multi-color print-ing, it is necessary to have one original for eachcolor of the final process. S1.EXE software can bestarted with the /- option, resulting in <F7> or <F9>producing a graph with no grid, calibration marks,or alphanumeric text. The box around the graph isdisplayed for use as an alignment guide. A print-out of this display can be used for one color separa-tion (data line only). With a normal software load(not using the /- option), an empty grid can be dis-played and printed without data. This can be usedfor a second color, or in black.
15.2.6. Tabular Data Printout
At the conclusion of a Run Test <F9> or RunGraph <F7> operation with any test file or panelwhere DISPLAY TABLE is selected on the SWEEP(F9) DEFINITIONS panel, pressing the <*> keywill cause the data to print to the printer in the sameformat as displayed on screen. Single point tabulardata will also be printed by the <*> key ifSOURCE-1 is set as GEN NONE, since this modeautomatically produces tabular output on screen.Out-of-limits values and TIMEOUT or UNREGU-LATED flags will thus also print, just as they dis-play on screen. The full set of data will print, evenif longer than one full screen. The data will notprint point-by-point in real time as it is taken, but allpoints will print at the conclusion of the last pointof the test. No line feeds or page advances are sentat the conclusion of a tabular printout. Tabular print-
outs are compatible with any printer which is com-patible with the computer, rather than the more lim-ited compatibility of graphics printouts.
Since many printers have internal buffers whichhold several lines of text, a procedure with tabularprintouts may run with almost no delay compared tothe same procedure with no printout, since the pre-ceding test data can be printing while the next test isrunning.
15.2.7. Panel Printout
You may obtain a printout of the setup panels ora bargraph screen by pressing the <*> key wheneverthe desired panels or bargraph are on screen.
15.3. High Resolution Plotter andLaser Printer Output
High-quality graph printouts can be obtained tocertain plotters and laser printers. The resolution ofsuch graphs is unlimited by the resolution (pixels)of the computer graphics adapter. These graphs arenot obtainable directly via S1.EXE software, but re-quire running an additional program also furnishedby Audio Precision.Unlike the screen dump print-outs, graphics cursor information(see page 11-9)is not reproduced as part of a plot or print made inthis mode. Unlike the screen dump print-outs, thecontents of the comments editor do not print via thehigh-resolution modes as they do with the screendump. When the HP LaserJet III is the printer,there is a method of obtaining comments print-out;see page 15-15 below. These high-resolution modessupport only graphs, not panels or tabular data.
S1.EXE must be started with the /G option to en-able graph data reporting to a file which will then beused by either PLOT.EXE or POST.EXE, depend-ing on which type of plotter or laser printer is to beused. To start S1 in the graphics reporting mode,from the DOS prompt, type:
S1 /G <Enter>
15-6 Audio Precision System One User's Manual

When started in this mode, the SAVE GRAPH-ICS menu command is enabled. By executingSAVE GRAPHICS and supplying a file name,graph information will be stored to disk in a filewith the extension .GDL (Graphics Display List).This file contains information on all text and lineson the graphics screen which was saved.
15.3.1. Plotter and HP LaserJetLaser Printer Output
PLOT.EXE is furnished as part of System One’sstandard software. It drives any HPGL-compatibleplotter. The HP LaserJet III with two megabytes ofmemory can directly function as an HPGL plotter.PLOT also drives HP LaserJet II laser printerswhich are equipped with the “Plotter In A Car-tridge” product from:
Pacific Data Products6404 Nancy Ridge DriveSan Diego, CA 92121telephone (619) 552-0880.
Alternately, HP LaserJet printers can be drivenby a software product called “Laser Plotter”, manu-factured by:
Insight1024 Country Club Drive, Suite 140Moraga, CA 94556telephone (415) 376-9451FAX (415) 631-0595.
“Laser Plotter” is available both from the manu-facturer and from Hewlett-Packard. “Laser Plotter”uses as its input a .GL file saved by PLOT.EXE.See the section on page 15-16 for more informationon using this method.
PLOT is normally started from the DOS promptsimply by typing:
PLOT <Enter>
For an HP LaserJet III with two megabytes ofmemory and operating in HPGL emulation mode,PLOT should be started with the “/3” option:
PLOT /3 <Enter>
PLOT is normally able to determine the type ofdisplay system in the computer and configure itselfaccordingly. If the automatic configuration does notwork properly, the /D option may be used at startupto force selection of a particular display mode. Forexample, to force configuration for a Hercules mono-chrome display system the /D1 option is requiredand the software would be started with the com-mand:
PLOT /D1 <Enter>
See the Graphic System Compatibility section be-ginning on page 5-7 for full details.
PLOT can be run after quitting S1.EXE software.PLOT may also be run during an XDOS or DOStemporary exit from S1.EXE. In this case, S1.EXEmust have been started with the /R, /B , or /&file-name options so as to leave sufficient memory avail-able to DOS for operation of the program. ThePLOT program itself occupies about 100 kbytes ofmemory, plus an additional amount which dependsupon the complexity of the image to be plotted.This additional amount may be estimated by assum-ing 3 kbytes for the empty grid plus text and 16bytes per data vector. For example, a 100-stepgraph with both DATA-1 and DATA-2 in usewould have 100 vectors per data value or 200 vec-tors total, requiring 3200 bytes. The total memoryrequirement in this case would be 100 kbytes for theprogram, 3 kbytes for the blank grid, and 3.2 kbytesfor data vectors for a total of about 106 kbytes. Acommon large memory requirement is likely to oc-cur when plotting FFTs which may have as many as500 points to plot (8 kbytes for the data). Nestedsweeps or appended tests with many lines on thegraph may also have large memory requirements.See the CREATING YOUR CUSTOM SOFT-WARE START-UP PROCESS Chapter (starting onpage 28-1) for more information on the /R, /B, and/&filename options.
Note also that your disk, in the current directory,must have space available for temporary files cre-ated during the operation of PLOT.EXE. This tem-
HARD COPY PRINTOUT 15-7

porary file (APTEMP$$.GL) will be approximatelyfour times the size of the input .GDL file whichPLOT is using.
15.3.1.1. Interactive Mode
When PLOT loads, an introductory screen willdisplay along with the menu choices across the bot-tom as follows:
CMD: POSITION ATTRIBUTES OUTPUTSAVE LOAD QUIT
This menu operates similarly to S1.EXE’s com-mand menu. The <Space> bar, horizontal arrowkeys, or mouse may be used to move the cursor tothe desired selection and the <Enter> key used tomake the selection. Alternately, a selection may bemade by pressing the key corresponding to the first
character of the command. Returning to this menufrom any screen within PLOT is accomplished bythe <Esc> key.
15.3.1.2. Position Panel
When POSITION is selected, a screen similar toFigure 15-4 will be displayed. The arrow keys ormouse may be used to move a cursor onto each fieldwhich can be changed. Some fields are multiplechoice, while others accept numeric entry from thekeyboard.
The PAPER SIZE field permits selection of thepaper onto which the plot or laser printout will bemade, ranging from U.S. sizes A through E (Euro-pean A4 through A0).
ORIENTATION permits selection of the orienta-tion of the graph with respect to the paper. In POR-TRAIT mode, the paper must be held with its long
Figure 15-4 Position Panel, PLOT.EXE
15-8 Audio Precision System One User's Manual

axis vertical for the graph to be normally viewed.In LANDSCAPE mode, the graph will be normallyviewed with the paper’s long axis horizontal.
PLOTS ON PAGE permits selection of a singleor multiple plots on a page. Normally, each plotwould be a different graph. The number of plotsand relative orientation of the plots depends uponwhich paper size has been selected and whether land-scape or portrait mode has been selected. The alter-natives are clearly illustrated in the right portion ofthe screen. The PLOTS ON PAGE entry will be su-perceded by making specific entries into the CAL-CULATED POSITION fields below.
PLOT POSITION selects which of the multiplepositions a graph will be printed/plotted onto duringthe current printing/plotting session. If only oneplot per page has been selected, only the 0 selectionis available. With a multiple plot selection, the rightside of the screen illustrates the position numbering
scheme. The PLOT POSITION entry will be super-ceded by making specific entries into the CALCU-LATED POSITION fields below.
SCALE SIZE selects the size of plot or print.The aspect ratio (horizontal-to-vertical size ratio)will be 4:3 for any scale size entered. Any numericvalue may be entered for scale size. The defaultvalue of 95% creates a small amount of space be-tween multiple plots on the same page. The scalesize value will be superceded by making specific en-tries into the CALCULATED POSITION fields be-low.
ROTATE 180 DEG permits definition of whichedge of the paper the top of the graph is oriented to-ward. Use of this field plus the LANDSCAPE/POR-TRAIT choice above lets a graph be plotted orprinted in any of the four possible orientations withrespect to the paper.
Figure 15-5 Attributes Panel, PLOT.EXE
HARD COPY PRINTOUT 15-9

EJECT permits control of whether an HP Laser-Jet III or LaserJet II equipped with “Plotter in a Car-tridge” ejects the sheet after the first plot or retainsit for further plots. Different graphs may then beplotted onto the different positions on the paper byloading different .GDL files, selecting different plotpositions, and plotting. Each graph will be stored inthe plotter memory until the final graph is transmit-ted with EJECT set to ON; the plotter will thenprint. EJECT has no effect when .GL files are writ-ten which will later be used by the “Laser Plotter”software.
With an HPGL plotter, the paper may simply beleft on the plotter through multiple operations ofPLOT. The only effect of EJECT OFF with a plot-ter is to leave the pen uncapped at the end of a plot,though many plotters will automatically cap the penwhen no commands are received for approximately15 seconds.
The CALCULATED POSITION fields displaythe exact plot location resulting from the choicesmade in all the fields above. The CALCULATEDPOSITION fields also permit selection of any spe-cific size and aspect ratio for a plot or print. P1 andP2 are the x and y coordinates of the corners of theplot. The units are plotter-dependent units and mustbe obtained from information furnished by the manu-facturer of the particular plotter or laser printer.Any entry into any of the CALCULATED POSI-TION fields over-rides the selections of the PLOTSON PAGE, SCALE SIZE, and PLOT POSITIONfields above. When any entry is made into one ofthe CALCULATED POSITION fields, the message“User Position” appears above these fields. To can-cel the CALCULATED POSITION entry and returnto a choice among the standard pre-selections, movethe cursor up to any of the fields above, select anitem, and press the <Enter> key.
15.3.1.3. Attributes Panel
From the command menu of PLOT (obtainablevia the <Esc> key), selecting ATTRIBUTES dis-plays a screen similar to Figure 15-5. This screenpermits selection of the appearance of the variouslines, numbers, and text which make up the plot.
The DATA-1 and DATA-2 areas control the ap-pearance of the one or two lines on the graph whichplot the DATA-1 and DATA-2 values. GRID refersto the rectangular logarithmic or linear calibrationgrid onto which the data is plotted. LIMITS defineshow any upper and/or lower comparison files willappear, if they were displayed by the <Alt><F7>keystroke before the graphic data was saved to the.GDL file. BOX defines the appearance of the out-side rectangular lines around the entire graphic andtext area.
In all these areas, the four controllable parametersof the line are plotter pen number (PEN #), type ofline such as solid, dashes, dots, etc. (STYLE #),how frequently the dash or dot cycle repeats acrossthe graph (SIZE %), and line width (WIDE). In theTEXT area, only pen number is selectable. Differ-ent pens may be specified to write the GENERALinformation (graph title, test name, date and time),the DATA-1 parameter and units, DATA-2 parame-ter and units, and the numbers calibrating the hori-zontal axis of the graph (HORIZ).
Most plotters have carousel or other pen holdersso that more than one pen can be in place at a time,selected by the plotter upon software request. Pensare available with many different ink colors pluswriting technology choices (felt tip, ballpoint, Rapi-dograph, etc.). The total number of pens used tomake a graph can be larger than the number of penswhich the plotter holds at one time. When morepens are specified than are entered in the PENCOUNT field, PLOT.EXE will first draw the por-tions corresponding to the number of pens in place,then prompt the operator to replace pens and con-tinue the plot. It is thus possible to make a plotwith as many as 17 colors even on a single-pen plot-ter.
Under the DATA-1 and DATA-2 headings, lineappearance may be independently specified for up tofour TRACE values. The TRACE parameter refersto the multiple lines on a graph obtainable via anested sweep (SOURCE-2 instead of DATA-2 onthe SWEEP DEFINITION panel), use of the<Ctrl><F9> key to make additional tests withouterasing the data from earlier tests, or after use of theAPPEND TEST or APPEND DATA command to
15-10 Audio Precision System One User's Manual

bring multiple data sets into one file. The first foursuch traces for DATA-1 and DATA-2 may thuseach be shown with a different line appearance. Ifthe graph being plotted has five or more sweeps, thepen-vs-trace cycle will be repeated. For example,the fifth trace will use the TRACE 1 selection, thesixth will use TRACE 2, etc.
The STYLE # choices are illustrated in the IN-FORMATION block at the lower right of the AT-TRIBUTES screen. For all selections other than thesolid line (STYLE 7) and dots at each data point(STYLE 0), the SIZE % field adds control of howoften the dash-dot cycle repeats along the graph.The scale reference for the % value is a diagonalline from corner to corner of the graph. For exam-ple, if 4% is entered, the dash-dot cycle length is4% (1/25) of the diagonal dimension of the graphand would thus repeat 25 times on a data plot fromcorner to corner of the graph.
The WIDE field and PEN WIDTH fields permitcontrol of the plotted line width. A WIDE value of1 results in a single pen trace. Larger values forWIDE will produce repeated plots with the pen posi-tion offset by one pen width to produce a wider line.The WIDE value used is always an integer and willround to the nearest integer if a fraction is entered.If a trace wider than one pen width but narrowerthan two pen widths is desired, enter 2 as WIDEand enter a smaller value into the PEN WIDTHfield than the actual pen tip width. The softwarethen produces a smaller offset for the repeat plot.
If a striped line appearance is desired, with whiteareas between the repeated plots, enter a value of 2or greater in the WIDE field and a larger value intoPEN WIDTH than the acutal pen tip width.
Figure 15-6 is an illustration of some of the lineappearances possible through use of the Attributespanel of PLOT.EXE. This illustration was saved todisk as a .GL file and imported directly to XeroxVentura Publisher as an HPGL file. Since it was to
AUDIO PRECISION & vs 05 JUL 91 10:57:08
-40.00
-35.00
-30.00
-25.00
-20.00
-15.00
-10.00
-5.000
0.0
5.0000
2-CHAN(dBV) LEVEL(dBV)
20 100 1k 10k 20k
FREQ(Hz)
Figure 15-6 PLOT.EXE Print-Out of Nested Sweep of Cassette Recorder Response at Four Amplitudes. Differ-ing Widths of Solid Line Used for DATA-1 Four Sweeps, Various Dot-Dash Patterns Used for DATA-2 FourSweeps
HARD COPY PRINTOUT 15-11

be finally printed on a 300 dpi laser printer, penwidth was set as 0.085 mm (25.4 mm/inch dividedby 300 dots/inch). The four DATA-1 traces are allsolid lines (Style 7) with WIDE values of 13, 9, 5,and 1. The four DATA-2 traces all use a WIDEvalue of 1, with Style 1 (dots), Style 2 (dashes),Style 4 (dot-dash), and Style 6 (long dash and twoshort dashes) used for the four traces.
15.3.1.4. HP LaserJet Printer Line At-tributes
When the HP LaserJet II printer is used, the ulti-mate line appearance depends upon whether the“Plotter in a Cartridge” hardware adapter or the “La-ser Plotter” software is being used. The LaserJetwith “Plotter in a Cartridge” installed effectively be-comes a single-pen plotter. The PEN # selection isthus effectively ignored. The STYLE #, SIZE %,and WIDE attributes function similarly to plotter us-age. For WIDE to be properly used, and assumingthe A/A4 paper size selection on the POSITIONscreen, the PEN WIDTH value must be entered asthe width of one pixel on the laser printer which isessentially 0.085 mm (300 dots per inch resolution).
With “Laser Plotter” software, an additional stepin the process permits the user to define gray levelattributes corresponding to the PEN # selectionsmade in PLOT.EXE. Control of the PEN #-to-graylevel correspondence is described in the documenta-tion furnished by the manufacturer of the “LaserPlotter” software. Note that “Plotter in a Cartridge”is approximately five times faster than “Laser Plot-ter”.
15.3.1.5. Saving Configurations
When a complete selection has been made of allthe POSITION screen and ATTRIBUTES screenchoices, the results can be saved to disk in a configu-ration file format (.CFP) for later use. The SAVECONFIGURATION command is used and any de-sired filename acceptable to DOS furnished. The.CFP extension is automatically supplied by the soft-ware. At any later time, the LOAD CONFIGURA-TION command may then be used to retrieve thecomplete configuration.
15.3.1.6. Making the Plot
When all the ATTRIBUTES and POSITION val-ues have been entered, the LOAD GRAPHICS com-mand may be used to load the .GDL file containingthe data and text to be plotted. The plot is thenmade to a plotter or LaserJet with “Plotter in a Car-tridge” installed by either the OUTPUT or SAVEOUTPUT commands. Either command gives achoice of computer output ports to which the plotteror laser printer is connected. Selecting the appropri-ate port (for example, COM1:) causes the informa-tion to be transmitted to the plotter or printer andthe plot or print to begin. HPGL plotters are nor-mally RS-232 interface devices and must be con-nected to COM1: or COM2:. The HP LaserJet IIIor the LaserJet II equipped with Plotter in a Car-tridge may be used with either the parallel or RS-232 interface and will be faster from the parallel in-terface. With the LaserJet III, remember that PLOTmust have been started with the /3 option as dis-cussed earlier.
RS-232-connected devices normally use one oftwo methods to manage the transmission of data andavoid overflow of the data buffer in the device.One method is a hardware handshake wire in the in-terface cable. The alternate method is a form of soft-ware handshake called Flow Control or XON-XOFFprotocol. The LaserJet with Plotter in a Cartridgemay be set to either handshake mode via softswitches, described in the LaserJet manual. HPGLplotters normally use hardware handshake.PLOT.EXE may be configured at start-up for eithertechnique via the /X command line option. If PLOTis started with no /X option or with the /X0 option,it is configured for hardware handshake as appropri-ate for typical HPGL plotters. If PLOT is startedwith the /X1 option, it is set for XON-XOFF proto-col (flow control).
For output to a LaserJet printer via the “LaserPlotter” software, an additional step must be per-formed as described on page 15-16 below.
15-12 Audio Precision System One User's Manual

15.3.1.7. Color Separations
Selecting PEN # 0 results in no plotting or print-ing of the selected parameter. Original art for colorseparations can be prepared by multiple operationsof PLOT, specifying PEN # 0 for all parameters ex-cept the ones desired for the present color. TheBOX may be allowed to print in all separations, touse as an alignment aid.
15.3.1.8. Define Now, Print Later
It is possible to save complete plot information todisk for later plotting or printing. To save the infor-mation, supply a file name instead of selecting acomputer port under the OUTPUT or SAVE OUT-PUT commands. The software will automaticallyfurnish the .GL extension. Then, at a later time, youmay use the DOS COPY command with the filename and computer port specification to make a plotor print. If the file will be copied to a HP LaserJetIII, remember to use the “/3” option in startingPLOT before saving the .GL file. Saved .GL filesmay be copied to a parallel-connected HP LaserJetIII or LaserJet II with “Plotter In A Cartridge” in-stalled, or to an RS-232-connected HPGL plotter.For example, if the file name furnished when the.GL file was saved was FREQRESP, then a plotcould be made at a later time to an HPGL plotter bytyping at the DOS prompt:
COPY FREQRESP.GL COM1: <Enter>
if the plotter is connected to the COM1 port. Notethat the “P” option of the DOS MODE commandmust be invoked for the COPY command to func-tion reliably. A typical MODE command, typed atthe DOS prompt, would be:
MODE COM1:9600,N,8,1,P
The P instructs the computer to retry sendingblocks of data when the plotter reports back that itsinput buffer is (temporarily) full.
PLOT.EXE software need not be present at thetime of plotting in this mode. When this “save nowand plot later” mode of operation is planned, the pennumbers specified on the ATTRIBUTES page
should not exceed the number which will be inplace when the .GL file is later copied to the plotter.This is because there will be no pause and prompt-ing message to the operator to change pens whenthe COPY command is given. Any subsequent soft-ware commands to change to higher-numbered penswill be ignored, resulting in the last pen being usedto draw all remaining elements of the graph.
15.3.1.9. Batch Mode Operation
To incorporate plotting to an HPGL device orprinting to an HP LaserJet automatically during aprocedure, PLOT can also be run in a batch modewith two file names, an output port or output filename specification, one or more codes as commandline options, and (for the HP LaserJet III only) thename of a comments or text file to be printed belowthe graph. One file name is the configuration file(.CFP) which specifies plot size, location, pen selec-tion, line style, etc. Another file name specifies the.GDL file containing the data to be plotted. The out-put port specifies where the printer is connected, oran output file name will cause the graphics output tobe saved to a file of that name with the .GL exten-sion. The /O code is required for immediate outputrather than entering interactive mode. For example,a System One procedure could contain the line:
DOS PLOT //O FULLPAGE THD-FREQCOM1: <Enter>
where DOS is System One’s menu command to exitto DOS and execute one DOS-compatible commandor program. PLOT is the program. /O is the com-mand to output immediately, rather then merelyloading the specified files and entering interactivemode. Note that the actual procedure listing mustcontain a double slash (//O) in order to functionproperly, since the S1.EXE Procedure Editor inter-prets single slashes as computer keyboard codes. Ifyou create the procedure in Util Learn mode, the ad-ditional slash will be inserted automatically. If youcreate the procedure by typing directly into the Pro-cedure Editor, remember to use two slashes when-ever a single slash is to be passed to a DOS com-mand.
HARD COPY PRINTOUT 15-13
FULLPAGE is an example name of a .CFP con-figuration file which completely specifies the sizeand location, pen choices, etc. This file would havebeen created in interactive use of the PLOT programby making all selections, then using the SAVE CON-FIGURATION command of PLOT.EXE and supply-ing the file name. THD-FREQ is an example nameof a .GDL file. This would have been created bythe SAVE GRAPHICS command of S1.EXE follow-ing the running of a test. S1.EXE must have beenstarted with the /G command line option in order forthe SAVE GRAPHICS command to function.COM1: specifies that the plotter or laser printer isconnected to serial port number one. Spaces are re-quired between the word PLOT and the first ele-ment and between all elements. Order of the vari-ous elements is not important as long as the currentdirectory does not contain .GDL, .CFL, or .GL fileswith the same names. If files of the same name doexist, the entire file name including extensionshould be explicitly typed.
The entire sequence in a procedure might thenlook like this:
LOAD TEST testfilename /R/F9/ESAVE GRAPHICS graphicsfilename/RDOS PLOT //O configfilename graphicsfile-name outputport/RLOAD TEST etc.
The procedure listing must contain a double slash(//O) before any DOS “/” command line options inorder to function properly, since the S1.EXE Proce-dure Editor interprets single slashes as computer key-board codes. If you create the procedure in UtilLearn mode, the additional slash will be insertedautomatically. If you create the procedure by typingdirectly into the Procedure Editor, remember to usetwo slashes whenever a single slash is to be passedto a DOS command. Note also that S1.EXE musthave been loaded with an appropriate /R or /B op-tion to set aside enough memory for PLOT.EXE tooperate; see the memory requirements discussionabove.
When multiple plots are to be made onto a singlesheet of paper in a LaserJet III or LaserJet II printerwith Plotter in a Cartridge installed, two further com-
mand line options are useful in batch mode opera-tion. The /E# option controls whether the page willbe ejected following transmission of data to the laserprinter. The /P# option controls at which positionon the page the graph will be printed.
Use of the /E and /P options assumes that a con-figuration file (.CFP) specifying multiple plots onthe page has been saved from earlier interactive op-eration of PLOT.EXE. The /P option may have anynumeric value from 0 through 8, corresponding topositions 0 through 8 of the PLOT POSITION fieldof the POSITION panel of PLOT.EXE during inter-active operation. The /E0 (zero) option is equiva-lent to EJECT OFF on the POSITION panel andcauses the page to be retained in the laser printer./E1 or /E with no number is equivalent to EJECTON and causes the page to be ejected immediatelyafter data transmission and printing.
As an example of usage of these options, assumethat PLOT.EXE has been run to develop a configura-tion file, FOURPLOT.CFP, which specifies fourplots on a page. The configuration file would alsospecify the desired line styles and text attributes onthe ATTRIBUTES panel. Next, assume thatS1.EXE has generated four .GDL files (XX, YY,ZZ, and AA) from four tests.
Now, the following sequence can be executed ina DOS batch file or procedure to generate four plotson one page:
PLOT FOURPLOT.CFP XX.GDL COM1: /O /E0 /P0PLOT FOURPLOT.CFP YY.GDL COM1: /O /E0 /P1PLOT FOURPLOT.CFP ZZ.GDL COM1: /O /E0 /P2PLOT FOURPLOT.CFP AA.GDL COM1: /O /E1 /P3
In an S1.EXE procedure, the menu commandDOS would be required at the start of each line, thefile extensions (.CFP, .GDL) would not be neededunless duplicate names exist, and a /R code for <En-ter> would be required at the end of each line. Notethat only one configuration file is now needed.
15-14 Audio Precision System One User's Manual

15.3.1.10. Printing Comments to HPLaserJet III
Unlike the screen dump print mode initiated bythe <*> key, contents of the comments editor arenot printed via PLOT. However, a similar functioncan be obtained when the HP LaserJet III is used inbatch mode (not interactive) printing. The text de-sired for printing beneath the graph can be preparedin Edit Comments mode or via any ASCII text edi-tor and saved to disk. If another editor is used, sup-ply the .TXT file extension which the Save Com-ments command automatically furnishes. Then, sim-ply include this file name, separated by a space fromother command line options or file names, followingthe PLOT command. For example, the DOS com-mand:
PLOT /3 /O CONFIGFILE.CFPGRAPHICSFILE.GDL TEXTFILE.TXT LPT1
will result in PLOT loading with the “/3” option re-quired for the LaserJet III, going into immediate out-put rather than interactive mode, using CONFIG-FILE to determine position and attributes settings,taking GRAPHICSFILE as the vector file input andsending it to the printer, sending TEXTFILE to theprinter, and then ejecting the page with the textprinted directly below the graph. The ATTRIB-UTES screen of PLOT must be used when prepar-ing and saving CONFIGFILE to set a graph sizewhich will allow the required size text file to beprinted below it on a single sheet of paper.
15.3.1.11. LaserJet Output via “La-ser Plotter”
To drive an HP LaserJet via “Laser Plotter” soft-ware, a .GL file must first be saved as describedabove. PEN # selections should be made on thePLOT.EXE ATTRIBUTES panel where different ap-pearance is desired, just as they would be for a plot-
Figure 15-7 Position Panel, POST.EXE
HARD COPY PRINTOUT 15-15

ter. After saving the .GL file, QUIT fromPLOT.EXE and load the “Laser Plotter” softwarefrom the DOS prompt by typing:
LP <Enter>
The “Laser Plotter” software, assisted by docu-mentation furnished by the manufacturer, then per-mits selection of the gray levels and other attributeswhich will correspond to the PEN # selections madeduring PLOT.EXE operation. Finally, the actualprintout will be initiated from the “Laser Plotter”software. Laser Plotter software can communicatewith the HP LaserJet via either the parallel interfaceor RS-232 (serial) interface.
Note that “Plotter in a Cartridge” is much faster,producing LaserJet output in about 45 seconds for atypical graph while “Laser Plotter” may require overfive minutes.
15.3.2. PostScript Laser PrinterOutput
POST.EXE is a program furnished for use withthe Apple LaserWriter and other PostScript-compat-ible laser printers. POST is started from the DOSprompt simply by typing:
POST <Enter>
POST is normally able to determine the type ofdisplay system in the computer and configure itselfaccordingly. If the automatic configuration does notwork properly, the /D option may be used at startupto force selection of a particular display mode. Forexample, to force configuration for a Hercules mono-chrome display system the /D1 option is requiredand the software would be started with the com-mand:
POST /D1 <Enter>
Figure 15-8 Attributes Panel, POST.EXE
15-16 Audio Precision System One User's Manual

See the Graphic System Compatibility section be-ginning on page 5-7 for full details.
POST can be run after quitting S1.EXE software.POST may also be run during an XDOS or DOStemporary exit from S1.EXE. In this case, S1.EXEmust have been started with the /R, /B, or /&file-name options so as to leave sufficient memory avail-able to DOS for operation of the program. ThePOST program itself occupies about 100 kbytes ofmemory, plus an additional amount which dependsupon the complexity of the image to be plotted.This additional amount may be estimated by assum-ing 3 kbytes for the empty grid plus text and 16bytes per data vector. For example, a 100-stepgraph with both DATA-1 and DATA-2 in usewould have 100 vectors per data value or 200 vec-tors total, requiring 3200 bytes. The total memoryrequirement in this case would be 100 kbytes for theprogram, 3 kbytes for the blank grid, and 3.2 kbytesfor data vectors for a total of about 106 kbytes. Acommon large memory requirement is likely to oc-cur when plotting FFTs which may have as many as500 points to plot (8 kbytes for the data). Nestedsweeps or appended tests with many lines on thegraph may also have large memory requirements.See the CREATING YOUR CUSTOM SOFT-WARE START-UP PROCESS Chapter starting onpage 28-1 for more information on the /R, /B, or/&filename options.
Note also that your disk, in the current directory,must have space available for temporary files cre-ated during the operation of POST.EXE. This tem-porary file (APTEMP$$.PS) will be approximatelyfour times the size of the input .GDL file whichPOST is using.
When POST loads, an introductory screen willdisplay along with the menu choices across the bot-tom as follows:
CMD: POSITION ATTRIBUTES OUTPUTSAVE LOAD QUIT
This menu operates similarly to S1.EXE’s com-mand menu. The <Space> bar, horizontal arrowkeys, or mouse may be used to move the cursor tothe desired selection and the <Enter> key used to
make the selection. Alternately, a selection may bemade by pressing the key corresponding to the firstcharacter of the command. Returning to this menufrom any screen within POST is accomplished bythe <Esc> key.
15.3.2.1. Position Panel
When POSITION is selected, a screen similar toFigure 15-7 will be displayed. The arrow keys ormouse may be used to move a cursor onto each fieldwhich can be changed. Some fields are multiplechoice, while others accept numeric entry from thekeyboard.
ORIENTATION permits selection of the orienta-tion of the graph with respect to the paper. In POR-TRAIT mode, the paper must be held with its longaxis vertical for the graph to be normally viewed.In LANDSCAPE mode, the graph will be normallyviewed with the paper’s long axis horizontal.
PLOTS ON PAGE permits selection of a singleor multiple plots on a page. Normally, each plotwould be a different graph. The number of plotsand relative orientation of the plots depends uponwhether landscape or portrait mode has been se-lected. The alternatives are clearly illustrated in theright portion of the screen.
PLOT POSITION selects which of the multiplepositions a graph will be printed onto during the cur-rent printing session. If only one plot per page hasbeen selected, only the 0 selection is available.With a multiple plot selection, the right side of thescreen illustrates the position numbering scheme.
SCALE SIZE selects the size of the graph print.The aspect ratio (horizontal-to-vertical size ratio)will be 4:3 for any scale size entered. The defaultselection is 95% to create some white space betweenmultiple plots on the same page, but any numericvalue may be entered. The scale size value may besuperceded by making specific entries into the CAL-CULATED POSITION fields below.
The EJECT field permits control over whetherthe paper is ejected after the current plot, or remainsin the printer for additional plots. Setting EJECT
HARD COPY PRINTOUT 15-17

OFF for all but the final graph of multiple plots on apage thus permits loading and printing several .GDLfiles onto different positions on the page. Each ofthe plots transmitted from POST.EXE is stored inthe laser printer memory until the EJECT ON com-mand is sent. The sheet then prints with multiplegraphs.
The CALCULATED POSITION fields displaythe size and offset location of the particular plot se-lected by the fields above. The units for these fieldsmay be selected as inches or centimeters. Alter-nately, numeric entry can be made into these fieldsto permit selection of any specific size, aspect ratio,and location for a print.When any entry is made,the message “User Position” appears above the en-tries and the user entries over-ride the selectionsmade in the PLOT POSITION and PLOTS ONPAGE fields above. To return to the mode of select-ing among the standard pre-selections, move the cur-sor up to any of the fields in the PLOT POSITIONsection (ORIENTATION, PLOTS ON PAGE, orPLOT POSITION) and press the <Enter> key to can-cel any user-made entries into the CALCULATEDPOSITION fields.
15.3.2.2. Attributes Panel
From the command menu of POST (obtainablevia the <Esc> key), selecting ATTRIBUTES dis-plays a screen similar to Figure 15-8. This screenpermits selection of the appearance of the variouslines, numbers, and text which make up the graph.
The DATA-1 and DATA-2 areas control the ap-pearance of the one or two lines on the graph whichplot the DATA-1 and DATA-2 values. GRID refersto the logarithmic or linear calibration grid ontowhich the data is plotted. LIMITS defines how anyupper and/or lower comparison files will appear, ifthey were displayed by the <Alt><F7> keystroke be-fore the graphic data was saved to the .GDL file.BOX defines the appearance of the outside rectangu-lar lines around the entire graphic and text area.
In all these areas, the four controllable parametersof the line are density or gray level (GRAY), lengthof dashes (ON), length of space between dashes(OFF), and line width (WIDE).
20 100 1k 10k 20k
FREQ(Hz)LEVEL(dBV)
-40.00
-35.00
-30.00
-25.00
-20.00
-15.00
-10.00
-5.000
0.0
5.0000
2-CHAN(dBV)AUDIO PRECISION & vs 05 JUL 91 10:57:08
Figure 15-9 POST.EXE Print-Out of Nested Sweep of Cassette Recorder Response at Four Amplitudes. Differ-ing Gray Densities of Solid Line Used for DATA-1 Four Sweeps, Differing Density Dash Patterns Used for DATA-2 Four Sweeps
15-18 Audio Precision System One User's Manual

In the TEXT area, the type font style (STYLE)and gray level (GRAY) are selectable. The STYLEchoices include the Helvetica (a sans-serif font some-times called Swiss) and Times Roman (with serifs)fonts in normal, bold, italic, and bold italic styles.Different fonts and gray levels may be specified towrite the GENERAL information (graph title, testname, date and time), the DATA-1 parameter andunits, DATA-2 parameter and units, and the num-bers calibrating the horizontal axis of the graph(HORIZ).
Under DATA-1 and DATA-2 headings, the lineappearance may be independently specified for up tofour TRACE values. The TRACE parameter refersto the multiple data sets obtainable via a nestedsweep (SOURCE-2 instead of DATA-2), use of the<Ctrl><F9> key to make additional tests withouterasing the data from the first test, or after use ofthe APPEND TEST or APPEND DATA commandto bring multiple data sets into one file. The firstfour such traces for either DATA-1 or DATA-2 maythus each be shown with a different line appearance.If the graph being plotted had five or more sweeps,the attribute-vs-trace cycle will be repeated. For ex-ample, the fifth trace will use the TRACE 1 selec-tion, the sixth will use TRACE 2, etc.
The ON, OFF, and WIDTH values are all statedin “user units”, where one unit equals 1/32000 ofthe X (horizontal) dimension of the graph as se-lected on the POSITION panel.
Figure 15-9 is an illustration made from the same.GDL file used for Figure 15-6 earlier in this chap-ter, to demonstrate some of the attributes ofPOST.EXE. Gray densities of 1.00, 0.60, 0.40, and0.20 were used for the four traces of both DATA-1and DATA-2. Solid lines were used for DATA-1and dashed lines at 300 units ON, 150 units OFFwere used for DATA-2. The text fonts wereHelvetica Bold for AUDIO PRECISION and thedate and time, Helvetica Italic for FREQ(Hz), TimesRoman for 2-CHAN(dBV), and Times Roman BoldItalic for & LEVEL(dbV). This illustration wassaved as a disk file using the /I option ofPOST.EXE which creates an Encapsulated Post-script file (.EPS). See the Desktop Publishing sec-tion below for more details.
15.3.2.3. Saving Configurations
When a complete selection has been made of allthe POSITION screen and ATTRIBUTES screenchoices, the results can be saved to disk in a configu-ration file format (.CFL) for later use. The SAVECONFIGURATION command is used and any de-sired filename acceptable to DOS furnished. The.CFL extension is automatically supplied by the soft-ware. At any later time, the LOAD CONFIGURA-TION command may then be used to retrieve thecomplete configuration.
15.3.2.4. Making the Printout
When all the ATTRIBUTES and POSITION val-ues have been entered, the LOAD GRAPHICS com-mand may be used to load the .GDL file containingthe data and text to be plotted. The plot is thenmade by either the OUTPUT or SAVE OUTPUTcommands. Either command gives a choice of com-puter output ports to which the laser printer is con-nected. Selecting the appropriate port (for example,COM1:) causes the information to be transmitted tothe printer and the print to begin. The Apple Laser-Writer has no parallel interface and must be con-nected to COM1: or COM2:. RS-232-connected de-vices normally use one of two methods to managethe transmission of data and avoid overflow of thedata buffer in the device. One method is a hardwarehandshake wire in the interface cable. The alternatemethod, used by the Apple LaserWriter, is a form ofsoftware handshake called Flow Control or XON-XOFF. POST.EXE may be configured at start-upfor either technique via the /X command line option.If POST is started with no /X option or with the /X1option, it is configured for the XON-XOFF protocol(flow control) as required by the Apple LaserWriter.If POST is started with the /X0 option, it is set forhardware handshake.
15.3.2.5. Color Separations
A GRAY value of 0.00 results in no printing ofthe selected parameter. Color separations can be pre-pared by multiple operations of POST.EXE, specify-ing GRAY 0.00 for all parameters except those to
HARD COPY PRINTOUT 15-19
be printed in the current color. The BOX may be al-lowed to print in all separations, to use as alignmentmarks.
15.3.2.6. Saving to Disk
It is possible to save complete plot information todisk for later use. To save the information, supply afile name instead of selecting a computer port underthe OUTPUT or SAVE OUTPUT commands. Thesoftware will automatically furnish the .PS extension(.PS for PostScript). Then, at a later time, this diskfile may be used with appropriate software or hard-ware to produce output on a photo typesetter or la-ser printer.
15.3.2.7. Desktop Publishing
Some desktop publishing software, includingXerox Ventura Publisher (which is used to preparethis manual), can import Encapsulated Postscriptfiles (.EPS extension). POST.EXE will save files inthe .EPS format when POST is loaded with the /I op-tion. For example
POST /I <Enter>
Note that Ventura Publisher cannot display thecontent of .EPS files on screen, but will only showthe boundary of the graphic with a large “X” super-imposed. The graphic will print correctly to a Post-script-compatible printer, however.
15.3.2.8. Batch Mode Operation
To incorporate printing to a PostScript-compat-ible laser printer automatically during a procedure,POST can also be run in a batch mode with two filenames, an output port specification, and one or morecodes as command line options. One file name isthe configuration file (.CFL) which specifies plotsize, location, gray level, line style, etc. Anotherfile name specifies the .GDL file containing the datato be plotted. The output port description describeswhere the printer is connected; alternately, an outputfile name can be specified, into which the graphicsdata will be saved with a .PS extension. The /O
code is required for immediate output rather than en-tering interactive mode. For example, a System Oneprocedure could contain the line:
DOS POST //O FULLPAGE THD-FREQCOM1: <Enter>
where DOS is System One’s menu command to exitto DOS and execute one DOS-compatible commandor program. POST is the program. /O is the com-mand to output immediately, rather than merelyloading the specified files and entering interactivemode. Note that the actual procedure listing mustcontain a double slash (//O) in order to functionproperly. If you create the procedure in Util Learnmode, the additional slash will be inserted automat-ically. If you create the procedure by typing di-rectly into the Procedure Editor, remember to usetwo slashes whenever a single slash is to be passedto a DOS command.
FULLPAGE is an example name of a .CFL con-figuration file (configuration, LaserWriter) whichcompletely specifies the size and location, penchoices, etc. This file would have been created ininteractive use of the POST program by making allselections, then using the SAVE CONFIGURA-TION command of POST.EXE and supplying thefile name. THD-FREQ is an example name of a.GDL file. This would have been created by theSAVE GRAPHICS command of S1.EXE followingthe running of a test. S1.EXE must have beenstarted with the /G command line option in order forthe SAVE GRAPHICS command to function.COM1: says that the laser printer is connected to se-rial port number one (or, an output file name maybe substituted). Spaces are required between theword POST and the first element and between allelements. Order of the various elements is not im-portant as long as the current directory does not con-tain .GDL, .CFP, or .PS files with the same names.If files of the same name do exist, the entire filename including extension should be explicitly typed.
The entire sequence in a procedure might thenlook like this:
LOAD TEST testfilename /R/F9/ESAVE GRAPHICS graphicsfilename/R
15-20 Audio Precision System One User's Manual

DOS POST //O configfilename graphicsfile-name outputport/RLOAD TEST etc.
Note that S1.EXE must have been loaded with anappropriate /R or /B option to set aside enough mem-ory for POST.EXE to operate; see the memory re-quirements discussion above.
When multiple plots are to be made onto a singlesheet of paper, two further command line optionsare useful in batch mode operation. The /E# optioncontrols whether the page will be ejected followingtransmission of data to the laser printer. The /P# op-tion controls at which position on the page the graphwill be printed.
Use of the /E and /P options assumes that a con-figuration file (.CFL) specifying multiple plots onthe page has been saved from earlier interactive op-eration of POST.EXE. The /P option may have anynumeric value from 0 through 8, corresponding topositions 0 through 8 of the PLOT POSITION fieldof the POSITION panel of POST.EXE during inter-active operation. The /E0 (zero) option is equiva-lent to EJECT OFF on the POSITION panel andcauses the page to be retained in the laser printer./E1 or /E with no number is equivalent to EJECTON and causes the page to be ejected immediatelyafter data transmission and printing.
As an example of usage of these options, assumethat POST.EXE has been run to develop a configura-tion file, FOURPLOT.CFL, which specifies fourplots on a page. The configuration file would alsospecify the desired line styles and text attributes onthe ATTRIBUTES panel. Next, assume thatS1.EXE has generated four .GDL files (XX, YY,ZZ, and AA) from four tests.
Now, the following sequence can be executed ina DOS batch file or procedure to generate four plotson one page:
POST FOURPLOT.CFL XX.GDL COM1: /O /E0 /P0POST FOURPLOT.CFL YY.GDL COM1: /O /E0 /P1POST FOURPLOT.CFL ZZ.GDL COM1: /O /E0 /P2POST FOURPLOT.CFL AA.GDL COM1: /O /E1 /P3
In an S1.EXE procedure, the menu commandDOS would be required at the start of each line, thefile extensions (.CFL, .GDL) would not be needed,and a /R code for <Enter> would be required at theend of each line. Note that only one configurationfile is now needed.
HARD COPY PRINTOUT 15-21

15-22 Audio Precision System One User's Manual

16. INTERMODULATION DISTORTION
With the IMD-GEN and IMD-DIS options in-stalled, System One can perform stimulus-responseintermodulation distortion measurements by threedifferent techniques: SMPTE/DIN, CCIF (twin-tone)difference tone, and DIM/TIM. The SMPTE (Soci-ety of Motion Picture and Television Engineers) isthe oldest standard. The DIN (Deutsches Institut furNormalizung) standard is similar to SMPTE. CCIFis believed to be the initials of a European organiza-tion since merged into another standards organiza-tion. The so-called CCIF method is also describedas IHF-IM by the Institute of High Fidelity. DIMand TIM (Dynamic Intermodulation and TransientIntermodulation) testing methods are understood tobe in the process of standardization by the IEC inEurope.
16.1. Theory of Operation
The SMPTE and DIN methods use a signal con-sisting of a low-frequency (LF) tone and a high-fre-quency (HF) tone, usually at an amplitude ratio of 4to 1 (low frequency to high frequency). Non-linear-ity in the device under test will cause amplitudemodulation of the high-frequency tone by the lowfrequency tone. The System One analyzer treats thehigh-frequency tone plus sidebands as an amplitude-modulated signal, applies it to an AM detector,measures the amplitude of the recovered sidebands,and expresses it relative to the amplitude of the highfrequency “carrier” signal. The SMPTE standardspecifies a 60 Hz LF tone in a 4:1 amplitude ratiowith a 7 kHz HF tone. DIN allows several choicesof tone frequency selection; 250 Hz and 8 kHz arethe most popular.
System One also permits “SMPTE-like” testswith user-selected frequencies and amplitude ratios.The System One IMD generator provides sevenchoices for the lf tone, two choices of amplitude ra-tio, and allows the “HF” tone to be set anywherewithin the range of the generator (which could thusbe lower in frequency than the “LF” tone). The Sys-
tem One analyzer can accurately analyze SMPTE-like signals only when the high frequency tone is at3.0 kHz or above. The applied amplitude ratios canvary from 0:1 (no low frequency tone present, thusmeasuring only incidental amplitude modulation ofhigh frequency tone) to at least 8:1, with IMD prod-ucts (sidebands) between 40 Hz and 500 Hz aroundhigh-frequency tones (carriers) between 3 kHz and200 kHz. The 3 dB analysis bandwidth after the amdetector is 30 Hz to 700 Hz; thus, if it is desired thatthe measurement be sensitive to both second andthird order IM products, the generator IM frequencyshould not be set above 250 Hz so that the third or-der product will fall within the analysis band.
The CCIF or difference frequency method appliesa stimulus of two closely-spaced equal amplitudetones to a device under test (DUT). Non-linearitiesin the DUT will result in a variety of IMD products.System One measures the amplitude of only the dif-ference tone; the low-frequency product (second or-der) existing at a frequency equal to the spacing be-tween the two stimulus tones. The System One gen-erator provides seven choices of tone spacing; itthen generates a pair of tones spaced symmetricallyabout the main generator carrier frequency; the maingenerator amplitude is suppressed. The System OneIMD analyzer properly measures the amplitude ofthe difference tone produced when the frequency ofthe lower of the two-tone pair is between 4 kHz and200 kHz, with tone spacing of 80 Hz to 1 kHz.
The DIM or TIM test method provided by Sys-tem One combines a square wave at 3.15 kHz (DIM100kBW or DIM 30kBW) or 2.96 kHz (DIM B) ina 4:1 pk-pk amplitude ratio with a sine wave “probetone”. The IM-FREQ field on the generator panel isblanked during DIM testing. The square wave isbandwidth limited by a single-pole low-pass filter ateither 100 kHz (100kBW) or 30 kHz (30 kBW andB). The probe tone may be generated at any fre-quency setting of the main generator. The analyzermeasures the amplitude of any resulting productsfalling between 750 Hz and 2.4 kHz. A probe tone
16-1

of 15.0 kHz is recommended for the DIM30 orDIM100 tests, since this will produce a fifth-order(odd) product at 2.40 kHz (15.0 kHz 4 * 3.15kHz) and a sixth-order (even) product at 750 Hz (5* 3.15 kHz 15.0 kHz). The test thus produces asingle measurement which has approximately equalsensitivity to odd and even order slewing nonlineari-ties. Similarly, a 14 kHz probe tone is recom-mended for the DIM-B test for the same reason.The DIM-B test has been recommended for FM ra-dio and TV audio testing because of their 15 kHzbandwidth limitations.
16.2. Setting Up the Generator Panel
The software distribution diskette includes stand-ard panel set-ups for SMPTE, DIN, CCIF, DIM100, DIM 30, and DIM-B. These make good start-ing points for variations as desired. SMPT-FRQ.TST sets the generator to a 60 Hz IM-FREQ ina 4:1 amplitude ratio with a 7.000 kHz main gener-ator FREQUENCY. DIN.TST is also a 4:1 ampli-tude ratio, but with 250 Hz as the IM-FREQ and8.000 kHz as the high frequency. CCIF.TST selectsa 13.50 kHz main generator frequency (suppressed).IM-FREQ indicates the spacing between tones inCCIF mode, which is 1.000 kHz for CCIF.TST, pro-ducing twin tones at 13 kHz and 14 kHz.DIM100.TST and DIM30.TST both select a 15.0kHz probe tone, while DIM-B.TST uses a 14.00kHz probe tone.
Amplitude calibration in all IMD waveforms is insinewave peak equivalent terms; for example, select-ing an AMPLITUDE of 1.000 Volt will result in thecomplex IMD signal having the same 2.828 Voltpeak-to-peak amplitude that a 1.000 Volt sine wavehas. Clipping in a device under test will thus occurat the same generator amplitude for THD+N andIMD modes.
In SMPTE (DIN) mode, the seven availablechoices for the low frequency tone are 40, 50, 60,100, 125, 250, and 500 Hz. Selection may be madeon an increment-decrement basis by using the <+>and <Del> keys while the cursor is placed on theIM-FREQ indication field. Alternately, a numbermay be entered into that field from the keyboard
with the digit keys. The software will select thechoice nearest the entered frequency when the <En-ter> key is pressed.
In CCIF mode, the spacing between the two gen-erated tones may be selected in the same fashionfrom the choices of 80, 100, 120, 200, 250, 500, and1000 Hz. These frequency spacing values are ex-actly twice the SMPTE frequencies listed above,since the same oscillator is used in a balanced modu-lator technique to generate the tone pair.
In DIM mode, the square wave frequency is fixedat either 3.15 kHz in DIM 30 and DIM 100 modesor at 2.96 kHz in DIM B mode. This frequency isnot indicated on the generator panel, but will gener-ally be measured and displayed by the analyzer fre-quency counter when the signal is fed to the ana-lyzer module.
The main generator minimum useful frequency(suppressed center frequency) in CCIF mode is 4.0kHz, since lower values would produce erroneous re-sults; in fact, a 4.0 kHz center frequency and 1.0kHz spacing in CCIF mode will produce somewhatdegraded accuracy and residuals. Similarly, 4.0 kHzis the minimum useful main generator (probe tone)frequency in the DIM modes. In SMPTE mode, theanalyzer residual SMPTE/DIN IMD will increaserapidly with main generator frequencies below ap-proximately 3 kHz. The analyzer will not produceaccurate measurements with main generator frequen-cies below 2.5 kHz. There are non-IMD applica-tions, such as compander swept frequency responsetesting, for placing the main generator lower than 3kHz, even below the IM-FREQ.
16.3. Setting Up the Analyzer Panel
Analyzer set-up for IMD testing is done princi-pally by selecting the desired IMD mode. When anIMD mode is selected, the BW field near the centerof the analyzer panel will indicate the approximate 3dB analysis bandwidth of the instrument for speci-fied accuracy. None of the absolute measurementunits (V, dBm, dBu, dBV, dBr) can be selected inthe IMD modes, even though they are available inTHD+N mode. This is because SMPTE/DIN IMD
16-2 Audio Precision System One User's Manual

is inherently defined as a percentage of (or ratio to)the high frequency “carrier” tone; measurement ofthe distortion products in absolute units has no sig-nificance.
16.4. Bandpass Filter Use DuringIMD Testing
In most IMD testing, the BP/BR FREQ line willbe left in the AUTO position. This will automat-ically tune the bandpass filter to the difference fre-quency tone in CCIF mode, and positions it as aband reject filter to assist stopband attenuation in theSMPTE and DIM modes. For certain applicationsin SMPTE and DIM testing, however, it is useful tofix the filter as a bandpass at certain frequencies forfurther information on the distortion products and toobtain lower residual noise contribution. It can alsobe very illuminating to sweep the bandpass filter inSMPTE-DIN modes to graph the IM products ofseveral orders.
In SMPTE testing, the bandpass filter can beused to discriminate between the even and odd orderproducts. Assuming the stimulus to include a 60 Hzsignal as the lf tone, the BP/BR FREQ line can bechanged from AUTO to 60 Hz; the reading will thenconsist essentially of the second order product (HFtone LF tone). If the BP/BR FREQ is set to 120Hz when the signal has a 60 Hz low frequency com-ponent, the reading will consist essentially of thethird order product (HF tone 2 * LF tone).
If it is desired to graphically display all productswithin the 700 Hz analysis bandwidth of SMPTE-DIN mode, SOURCE-1 can be set for an analyzerBP/BR sweep from perhaps 1 kHz to 30 Hz. Figure16-1 shows the result of such a test, using the 50 Hz-7 kHz signal from a test compact disc. The band-pass filter rejection is approximately 16 dB (originalhardware) or 32 dB (A-version hardware) at halfand twice its center frequency.
Figure 16-1 Spectral Analysis of SMPTE IMD Products
INTERMODULATION DISTORTION 16-3

Similarly, the filter can be used in DIM testing todiscriminate between the fifth order (odd) and sixthorder (even) products. With the recommended 15.0kHz probe tone in DIM100 and DIM30 tests, theBP/BR FREQ line can be set to 2.40 kHz to pro-duce a reading of only the fifth order product, andto 750 Hz to measure only the sixth order product.For the DIM-B test with the recommended 14.00kHz probe tone, the correct frequencies are 2.16kHz for the fifth order product and 800 Hz for thesixth order.
16.5. Intermodulation DistortionSweep Testing
All three forms of IMD can be usefully swept inamplitude, showing the distortion characteristics of adevice across its entire dynamic range. The CCIFmode may be superior to THD+N tests at low ampli-tudes since it is much more narrow-band and there-fore does not become noise limited until muchlower amplitudes.
SMPTE and CCIF IMD tests can also be usefullyperformed as frequency sweeps. Sweeping theprobe tone in DIM tests is of questionable utility,since only certain bands of probe tone frequencieswill produce moderately low-order products whichfall into the 750 Hz-2.4 kHz analysis band. SMPTE-like tests can have the high frequency tone sweptfrom 2.5 kHz to any upper limit within range of thegenerator, though maximum accuracy and residualIMD performance is specified only when the highfrequency tone is between 3 kHz and 20 kHz. CCIFtests can have the (suppressed) center frequencyswept from 4.0 kHz to any upper frequency. Fully-specified performance is limited to lower-tone fre-quencies (main generator center FREQUENCY mi-nus one-half the IM-FREQ spacing) above 4 kHz,with 20 kHz the upper limit for full accuracy.
16.6. Amplitude Measurements ofIMD Signals
Since IMD signals consist of two or more tones,they are non-sinusoidal by definition. As noted ear-lier in this section, System One’s generator ampli-
tude calibration for all IMD signals is in terms of si-newave peak equivalent amplitude. A generator am-plitude selection of 1.000 Volts amplitude will thusproduce an IMD waveform of 2.828 Volts peak-to-peak, the same peak-to-peak voltage which a 1.000Volt rms sinewave has.
The equivalent measurement calibration in Sys-tem One requires use of the S-Pk “detector” choice.S-Pk stands for scaled peak. S-Pk is not actually aseparate detector circuit. S-Pk uses the Peak detec-tor of System One, but multiplies the measurementby 0.707 before display. S-Pk thus displays the am-plitude of a sinewave which would have the samepeak-to-peak amplitude as the actual signal wave-form being measured.
A typical example of use of the S-Pk detectormight be after having adjusted the generator ampli-tude (perhaps in bargraph mode) for the threshold ofa rapid increase in IMD distortion from a power am-plifier. If the amplifier power at this point werethen measured using the RMS detector, the resultwould differ markedly from a similar measurementusing THD+N and would also differ significantlyfrom the rated output power from the amplifier. Us-ing the S-Pk detector will produce a measurement ofthe equivalent sinewave power, which should corre-late well both with the manufacturer’s power ratingsand with similar measurements using sinewaves andTHD+N.
16-4 Audio Precision System One User's Manual

17. WOW AND FLUTTER
17.1. Theory of Operation
Wow and flutter is the undesirable frequencymodulation of an audio signal due to instantaneousspeed variations caused by mechanical imperfectionsin a recording and playback mechanism such as atape recorder or turntable. Wow and flutter measure-ments are usually made with a test tape or disk hav-ing a pre-recorded tone that is assumed to containvery little residual FM. The reproduced tone isbandpass filtered to limit potential wideband interfer-ence and is fed into an FM discriminator. The out-put of the discriminator is an ac signal whose ampli-tude is proportional to the instantaneous frequencydeviation of the test tone. For most measurementsthis signal is passed, before detection, through a se-lectable weighting filter whose peak response is cen-tered at about 4 Hz. The purpose of the weightingfilter is to produce numerical results which parallelthe human ear’s sensitivity to different frequencycomponents of wow and flutter. Unweighted meas-urements simply bypass the weighting filter.
17.2. Measurement Standards
Four major standards exist for the measurementof wow and flutter: IEC, DIN, NAB, and JIS. Allrecommend the measurement of weighted frequencymodulation of a test tone, but differ in specific testtone frequency, detector type, and/or “ballistics”(the dynamic response of the detector). The IECand DIN standards are identical and recommend a3.15 kHz test tone with a quasi-peak detection char-acteristic. Both NAB and JIS recommend a 3.0 kHztest tone but differ in detector type: NAB specifiesan average response (rms calibrated), JIS specifies“effective” response which is similar to NAB detec-tion but with a much longer integration time con-stant.
The flat or unweighted bandwidth of the NABand JIS recommendations extends from 0.5 Hz to200 Hz, covering the portion of the spectrum where
frequency modulation is normally caused by imper-fect rotating components such as idlers, wheels, cap-stans, pulleys, or motors. IEC/DIN recommends a0.2 Hz lower cutoff; however, little energy is nor-mally present below 0.5 Hz. Because the settlingtime of a practical 0.2 Hz system cutoff would be 5to 10 seconds, the low frequency cutoff of theAudio Precision System One wow and flutter meas-urement option is designed to be 0.5 Hz regardlessof the standard selection. Weighted measurementsare not compromised because the weighting filter re-sponse includes the effects of the 0.5 Hz low fre-quency rolloff.
17.3. Scrape Flutter
Frequency modulation in tape recorders can alsobe caused by frictional effects of the tape slidingover guides or the tape heads themselves. This formof imperfection is called “scrape” flutter and is char-acterized by FM products extending to 5 kHz, butoften peaking near 3 kHz. Motors with servo speedregulation can also exhibit FM products substan-tially above the 200 Hz cutoff of normal unweightedwow and flutter measurements. Higher frequencyFM products are perceived more as added noise,“grit”, or “harshness” instead of as frequency modu-lation.
To measure this form of flutter, it is necessary touse a higher test tone or “carrier” frequency to per-mit FM discrimination of products to 5 kHz withoutaliasing. To achieve this extended performance, Sys-tem One utilizes the HIGH BAND flutter measure-ment technique developed by Dale Manquen of Al-tair Electronics, Inc. The recommended HIGHBAND test tone frequency of 12.5 kHz yields the de-sired measurement bandwidth of 5 kHz on recorderswhich have frequency response to 18 kHz. SystemOne also permits operation at test tone frequenciesdown to 10 kHz with some increase in alias errors,for recorders such as consumer VCRs which havemore limited high-frequency response.
17-1

Scrape flutter is normally measured with averagedetection-rms calibrated (NAB) characteristics.Measurement bandwidth in HIGH BAND mode isselectable over four bandwidths: 4 Hz bandpass(WTD), 0.5-200 Hz, 200 Hz-5 kHz, and 0.5 Hz-5kHz. For a typical professional recorder which in-corporates a scrape flutter idler, the below-200 Hzand above-200 Hz contributions will be approxi-mately equal.
Despite the difference in test tone frequencies,the conventional and HIGH BAND modes yieldnear-identical readings if both are weighted or bothare unweighted. The only change with the HIGHBAND mode is the extended measurement capabil-ity. The HIGH BAND mode can therefore be usedfor all measurements unless either a pre-recorded 3or 3.15 kHz test tape is being used, or if the re-corder has such limited frequency response that onlythe lower frequency test tone will pass through themachine.
17.4. Making Wow and FlutterMeasurements
The wow and flutter analysis capability is se-lected as “W+F” on the MEASURE function linenear the top of the ANALYZER panel. Three otherfields on the analyzer control panel change whenW+F is selected. The far right field on the DETEC-TOR line changes from the usual choices of RMS,AVG, Q-PK, and PEAK to IEC, NAB, and JIS. Se-lecting IEC enables a quasi-peak detector with dy-namics (“ballistics”) conforming to the IEC andDIN standards. Selecting NAB or JIS enables an av-erage detector with approximate VU ballistics; how-ever, JIS also enables a software algorithm that im-parts a 4-5 second integration time constant to meas-urements for a heavily damped response.
Measurement bandwidth and test tone compatibil-ity are selected on the FILTER line of the ANA-LYZER panel. Selecting WTD (weighted) orUNWTD (unweighted) will instruct the analyzer toassume a test tone or “carrier” frequency in the 2.8kHz to 3.3 kHz band. To prevent the possibility ofgrossly inaccurate readings, the READING displaywill blank if the signal from the reproducing ma-
chine falls outside the 2.7 kHz to 3.4 kHz band.When WTD is selected, the weighting filter is in-serted between the discriminator and detector stages.When UNWTD is selected, the measurement band-width is flat, extending from approximately 0.5 Hzto 200 Hz. The BANDWIDTH fields immediatelyabove the FILTER line become indications, ratherthan selections, showing the approximate analysisbandwidth. With both WTD and UNWTD selec-tions, these fields will display 0.5 Hz and 200 Hz.
The four selections ending with “-HB” (WTD-HB, UNWTD-HB, SCRAPE-HB, and WIDE-HB)instruct the analyzer to assume a nominal test toneor “carrier” frequency of 12.5 kHz. The READINGdisplay will blank if the signal drops below 7.5 kHzor exceeds 14 kHz. WIDE-HB selects the full band-width of the analyzer, extending from 0.5 Hz to ap-proximately 5 kHz (typically 3 dB at 4.5 kHz). Theexact response is significantly influenced by the testtone frequency and has been optimized for 12.5kHz. Lower frequency test tones will exhibit de-graded bandwidth and aliasing for FM productsabove half frequency. SCRAPE-HB selects a 200Hz to 5 kHz analysis bandwidth, and UNWTD-HBselects a 0.5 Hz to 200 Hz bandwidth allowing rela-tive comparisons between the scrape flutter and/orservo harmonic products versus rotational products.WTD-HB selects the same weighting filter usedwith 3 kHz-3.15 kHz test tones, permitting bothweighted wow and flutter and scrape flutter measure-ments with the same test frequency.
When making wow and flutter measurements, thenormal input autoranging feature of System Oneshould be disabled. Tapes can exhibit momentarydropouts that might trigger ranging, causing a severetransient in the wow and flutter measurement. Fix-ing the input range is done by entering the maxi-mum expected input level and unit selection in theappropriate RANGE field at CHANNEL A orCHANNEL B (whichever is being used) of theANALYZER panel. The fields will display the clos-est available internal range. Selecting “AUTO” inthe units field will restore autoranging. The ana-lyzer has been designed to handle signals over a 30dB window, giving ample margin with a fixed inputrange.
17-2 Audio Precision System One User's Manual

The Audio Precision System One wow and flutteranalyzer permits wow and flutter measurements upto at least 1.0% using a 3 kHz or 3.15 kHz test tone,and 2.5% using a 12.5 kHz test tone. A measure-ment of 0.5% represents an almost unlistenable levelof wow and flutter. All measurements are displayedin a single range to avoid the long autoranging timesof other analyzers that can be triggered by occa-sional tape dropouts. Measurement resolution istypically 0.0003% using a 3.0 kHz or 3.15 kHz testtone and 0.001% using a 12.5 kHz tone.
17.5. Spectrum Analysis of Wow &Flutter
With System One + DSP or System One DualDomain, FFT spectrum analysis can be performed di-rectly on the 3 kHz or 3.15 kHz tone or on the wowand flutter discriminator output. When acquiringsignal at the discriminator (RDNG) output, a lowsampling rate such as 1 kHz can be used since flut-ter signal bandwidth is limited to a few hundred Hzin the wow and flutter analyzer. The resulting fre-quency resolution can be as high as 0.06 Hz. This
degree of resolution permits clear separation of flut-ter-frequency components, as shown in Figure 17-1.If the flutter is being caused by defective rotatingcomponents, the circumference and diameter of thefaulty component may be calculated from the meas-ured flutter frequency and knowledge of the tapespeed. For example, in the figure it can be seen thatthe dominant flutter frequency is 7.5 Hz. At thetape speed of 7.5 inches per second, this means thatthe flutter could be caused by a defective idler orcapstan with a circumference of 1.00 inches (diame-ter of 0.318 inches). This is a powerful diagnostictechnique for locating defective rotating compo-nents. The standard test files furnished with DSPunits include a test already set up for the measure-ment shown.
17.6. Standards and Test Methods
The NAB flutter standard specifies that testingshall be made while reproducing a “flutter free” testtape. The flutter value is the average value of thepeaks of the readings, excluding random peakswhich do not recur more than three times in any 10-
0.0 20.00 40.00 60.00 80.00 100.0 120.0 140.0 160.0 180.0 200.0
FREQ(Hz)
.0001
0.001
0.010
0.1
1AMP1(%)AUDIO PRECISION FFT-W&F vs 01 SEP 89 17:12:10
Figure 17-1 FFT Spectrum Analysis of Wow and Flutter. (Requires DSP Option)
WOW AND FLUTTER 17-3

second period. Make readings at random intervalsthroughout the length of the test reel, splicing seg-ments of the test tape into a full reel if necessary totest beginning, midreel, and end performance. Torandomize the phase of the various flutter compo-nents, stop the tape between readings and turn eachroller and idler slightly by hand.
The IEC flutter standard specifies that testingshall use a tape which has been recorded on the ma-chine undergoing test. Do not conduct tests duringsimultaneous record/playback mode! The time delaycaused by the physical spacing of the record andplayback heads will cancel flutter components at fre-quencies given by the following expression:
Flutter cancellation frequency
= N ∗ tape speedgap−to−gap distance
= Ntime delay between heads
( where N = 1, 2, 3, . . .)
Although the standards indicate that only a singlevalue of flutter is necessary, maintenance objectivesare optimized by keeping written records of trans-port performance at the beginning, middle, and endof the tape reel.
Whenever possible, use the HIGH BAND meas-urement capability of System One to complete a testdata table as shown in Figure 17-2, noting the detec-tor type.
As a simpler but more comprehensive alternate tomanually recording information in the table, a 10second time sweep test (see Display Types sectionbelow) could be run under each of the twelve condi-tions listed in the table and each saved as test fileswith unique names; the additional information suchas machine type, tape type, and tape speed can be re-corded in Edit Comments mode and automaticallysaved with each test.
The NAB technique of reading a flutter-free tapein playback with an average-responding meter is anoptimistic method. The IEC technique of record-playback with peak response yields readings whichrange from 1.5 to 3 times higher than the NAB val-ues. The selected method is important only whencomparing with the manufacturer’s specifications.For normal maintenance, consistency from test totest is more important than the absolute method.
From a practical standpoint, the NAB method ofusing a standard test tape on reel-to-reel machines isvery convenient, but some high-quality machineshave flutter levels which are near or below the resid-ual flutter in the test tape. If the flutter readings ob-tained from the test tape are higher than those ob-
Machine______________ Date_____________ Tape speed_____________
Tape Type___________ Detector NAB / IEC / JIS (NAB preferred)
Beginning Middle End
Weighted (4 Hz BP)
Unweighted (0.5-200 Hz)
Scrape (200 Hz-5 kHz)
Wideband (0.5 Hz-5 kHz)
Figure 17-2 Sample Table, Wow and Flutter Test Results
17-4 Audio Precision System One User's Manual

tained using record-playback, the test tape has moreflutter than the tape machine. Use the test tape onlyif it yields lower readings.
17.7. Display Types
Wow and flutter can be measured simply by ob-servation of the digital indication on the reading lineof the ANALYZER panel. It can also be monitoredin the analog bargraph mode of System One by se-lecting RDNG as DATA-1 on the SWEEP (F9)DEFINITIONS panel and pressing the <F2> func-tion key, or by selecting Run Bargraph from themenu. The end points of the bargraph will be con-trolled by the values entered for GRAPH TOP andGRAPH BOTTOM. When using the bargraphmode, it is also often desirable to enable the centerand bottom bargraphs to display speed error (drift)and output level of the tape or disk player. To putspeed error on the center bargraph, select ANLRand FREQ as DATA-2. Select delta % as theFREQ unit. This unit displays measured frequencyin terms of percentage deviation from the value en-tered in the FREQ REF field near the bottom of the
ANALYZER panel. This value should be the fre-quency recorded on the test tape or disk, normallyeither 3.0 or 3.15 kHz. To display output level fromthe player on the bottom bargraph, select EXTERNLEVEL as the SOURCE-1 parameter and select theunits and values desired for the ends of the bargraphas the START and STOP lines.
Wow and flutter can also be displayed versustime, in chart recorder fashion. Assuming that bothwow and flutter and speed error are to be charted, se-lect RDNG as DATA-1 and ANLR FREQ asDATA-2. Select EXTERN TIME as SOURCE-1.Choose the STOP time you wish; values of 10 to 30seconds are often appropriate. To obtain fast updateand many data points, choose the #STEPS value toproduce perhaps 10 to 20 readings per second. Forexample, with a 10 second sweep, select #STEPS as100 to 200. On the ANALYZER panel, selecteither AUTO or 16 or 32 readings per second on theDETECTOR line. Use the <PgDn> key to obtainthe SWEEP SETTLING panel, and turn SETTLINGOFF. This will result in readings from the hardwarebeing directly plotted as they occur, rather than be-
Figure 17-3 Wow and Flutter
WOW AND FLUTTER 17-5

ing compared against previous samples. Press <F9>and the time chart recording will take place, with in-stantaneous flutter and drift values being plotted.
It is sometimes desired to quote a single figurefor wow and flutter, rather than presenting a streamof readings versus time. The COMPUTE 2-SIGMAmenu command was designed for that purpose.COMPUTE 2-SIGMA calculates the value whichwas exceeded for 5% of the time, and replaces theoriginal data with that value. The F7 key will thusre-plot with a horizontal line at the 2 sigma value.If it is desired to retain both the original data vary-ing with time and the 2 sigma value, the test can in-itially be set up with RDNG selected at both DATA-1 and DATA-2. COMPUTE 2-SIGMA can then beinvoked only for DATA-2, for example. The F7 re-plot will then show the original data as the solid(green) line and the 2 sigma value as the dashed(yellow) line. See Figure 17-3 for an example ofthis technique on a high-quality professional multi-track tape recorder.
17-6 Audio Precision System One User's Manual

18. SWITCHER MODULES
18.1. Introduction
Audio Precision’s SWR-122 switcher family isdesigned for use with System One in the testing ofmultiple input-output devices such as mixing con-soles, multi-track tape recorders, audio routingswitchers, distribution amplifiers, or multiple unitsof simpler units during burn-in, environmental test,and similar activities. One of the versions is a patch-point switcher which can be connected at a numberof points in an audio chain or a console input chan-nel. It permits signal measurements at any of thesepoints, or allows breaking the normal path, measur-ing the unloaded output of the previous stage, anddriving the following stage with the System Onegenerator.
18.2. Functional Description
The SWR family of switchers is available in fourversions:
• input switcher with XLR connectors (SWR-122F)
• output switcher with XLR connectors (SWR-122M)
• patch-point switcher with 5-pin XLR connec-tors (SWR-122P)
• connectorless, terminal strip version (SWR-122T) which can be configured in any of theabove three functional types.
All four of the Audio Precision switchers use thesame circuit board. They differ from one another inconnector configuration and in attributes set by inter-nal jumpers, which define them as an input switcher(connecting multiple device outputs to the analyzerinputs), an output switcher (connecting generatoroutputs to multiple inputs of devices), or a patch-point switcher.
Each of the switchers is a 12 x 2 crosspoint ma-trix, hence the SWR-122 nomenclature. Either ofthe two common points can be connected, undersoftware control, to any of the twelve selectablepoints. All the switchers are of balanced design butmay be used with unbalanced circuits. Up to 16modules of the input and/or output switcher may bestacked and connected in daisy-chain fashion to per-mit testing devices with up to 192 inputs and/or out-puts (up to 96 stereo pairs). Rear panel program-ming switches permit setting the address of eachmodule in a stacked-module system for the desiredchannel number selections—1 through 12, 13through 24, etc. Figure 18-1 is a simplified diagrampertaining to all versions. The relay contacts shownas single switches are actually multiple relay con-tacts connected in a more complex arrangement.This is necessary to obtain the isolation and cros-stalk required for practical professional and high-grade consumer applications.
18.2.1. Input Switcher
The input switchers function basically as the sim-plified diagram indicates. Any of up to 12 balancedcircuit points per module (192 with the maximum16 modules stacked) may be connected to either theA or B connector, which would in turn normally beconnected to the A and B inputs of the System Oneanalyzer. The SWR-122F version of the inputswitcher has two male XLR connectors for connec-tion to the analyzer inputs, and 12 female XLR con-nectors for connection to device outputs. The con-nectorless terminal strip version SWR-122T may beconfigured as an input switcher.
18.2.2. Output Switcher
The usual function of the output switcher is toconnect System One generator outputs to a numberof device inputs. It is electrically different from theinput switcher in that it also has the capability of
18-1

connecting one output of the generator to all but oneinput of a device, such as a routing switcher. Theoutput of that one non-driven channel may then bemeasured to obtain a worst-case crosstalk measure-ment. The SWR-122M version has two female and12 male XLR connectors. The connectorless termi-nal strip version SWR-122T may be configured asan output switcher.
18.2.3. Patch Point Switcher
The patch point switcher differs considerablyfrom the input and output switchers, even though ituses the same circuit board. The two “common”connectors of the patch point switcher are a femaleconnector (INPUT) for connection to an output ofthe generator and a male connector (OUTPUT) forconnection to an input of the analyzer. The twelveconnectors of the SWR-122P version are 5-pin XLRconnectors. They are designed for connection at ma-
jor circuit nodes of a console, or between series-con-nected devices in an audio chain in a studio, trans-mitter, or sound reinforcement system. Pins 1(high) and 2 (low) connect to a balanced output ofthe preceding device. Pin 3 is ground. Pins 4(high) and 5 (low) are the balanced input of the fol-lowing stage or device. Figure 18-2 is a simplifieddiagram of the patch-point switcher. Although thediagram shows a single-ended architecture, all cir-cuits are actually balanced. The connectorless termi-nal strip version SWR-122T may be configured as apatch-point switcher.
In the normal mode of the patch point switcher(power off, or no channel selected) the previousstage or device is directly connected to the input ofthe following stage or device. By selecting an IN-PUT channel from the control panels of SystemOne, it is also possible to connect the analyzer inputacross any normalled-through connection to measurelevel, distortion, noise, response, etc. It is also possi-
FRONTPANEL
A
FRONTPANEL
B
REARSTACKING
A
REARSTACKING
A
REARSTACKING
B
REARSTACKING
B
1 2 12
Figure 18-1 Simplified Diagram, Switchers
18-2 Audio Precision System One User's Manual

1 2 12PRIORDEVICE
PRIORDEVICE
PRIORDEVICE
NEXTDEVICE
NEXTDEVICE
NEXTDEVICE
INPUT(TO
ANALYZER)
OUTPUT(TO
GENERATOR)
Figure 18-2 Simplified Diagram, Patch Point Switcher
I/OI/O
Figure 18-3 Jumper Locations, Output Switcher
SWITCHER MODULES 18-3

Figure 18-4 Jumper Locations, Input Switcher
I/OI/OREMOVEOTHER
JUMPER
I/O
Figure 18-5 Jumper Locations, Patch Point Switcher
18-4 Audio Precision System One User's Manual

ble to break the normalled-through connection by se-lecting an OUTPUT channel number from the soft-ware control panel, so that the previous stage or de-vice may be measured in an unloaded condition. Ifthe relevant generator output channel is turned onwhen an OUTPUT channel is selected, it will drivethe following stage or device. For stereo systemsand devices, two of the patch-point switchers maybe designated as A and B and used together to simul-taneously access both stereo channels.
18.2.4. Terminal Strip Switcher
The terminal strip switcher SWR-122T has five-screw connector blocks in place of XLR connectors.It may be configured as an input switcher, outputswitcher, or patch-point switcher as described be-low. Note that the isolation and crosstalk specifica-tions of the SWR-122 family of switchers applyonly to the connector blocks of the terminal stripversion. The user must take precautions with shield-ing and lead dress if these specifications are to bemaintained on through the user cable assemblies tothe device under test.
18.2.4.1. Jumper Selection
The switcher circuit board has four jumpers on itwhen shipped from the factory. They are dia-grammed in Figure 18-3, Figure 18-4, and Figure 18-5.
The two jumpers marked I/O are located near thetwo 25-pin D subminiature connectors on the rearpanel. These select between INPUT and OUTPUTmodes of the switcher. The input and output posi-tions are marked above the two jumpers, input beingaway from the power transformer and output beingtoward the transformer.
The other two jumpers are located near the six-po-sition rocker switch assembly on the rear panel.They select whether the switcher responds to Chan-nel A or Channel B commands. When both jumpersare side by side, they bypass the rear panel A and Brocker switches. They must be in this position forthe input or output versions of the switcher. This isthe position in which they are shipped from the fac-
tory. If a PATCH POINT switcher configuration isdesired, one of these jumpers must be removed andthe other rotated 90 degrees and placed on the pairof pins closest to the 74HCT74 integrated circuit.With the jumper in this position, the rear panel Aand B rocker switches will select the desired chan-nel for switcher operation.
18.2.4.2. Input/Output Connections
The connections to and from the device undertest are made through the twelve terminal strips lo-cated near the front panel of the switcher. The wir-ing for these connectors is as follows:
1 high signal from device under test output
2 low signal from device under test output
3 ground
4 high signal to device under test input
5 low signal to device under test input
When used as in INPUT or OUTPUT switcher,the corresponding XLR connections are as follows:
1 XLR pin 2 (signal high)
2 XLR pin 3 (signal low)
3 XLR pin 1 (ground)
4 not used
5 not used
When the terminal strip switcher is shipped fromthe factory, pins 1 and 4 are connected together andpins 2 and 5 are connected together on the circuitboard itself. If the switcher is to be used as aPATCH POINT switcher, the appropriate circuitboard traces must be cut. Figure 18-6 shows howthis is done on circuit boards of switchers before se-rial number 20000. Switchers after serial number20000 can be modified by cutting traces as shown inFigure 18-7. Once these traces are cut, operation as
SWITCHER MODULES 18-5

an INPUT or OUTPUT switcher will require wirejumpers to be inserted in the screw terminals be-tween pins 1 and 4 and between pins 2 and 5.
Connections to System One and to the otherswitchers in the system are made via the XLR con-nectors at the rear of the switcher. The Channel Astacking connectors on the rear panels should be con-nected from switcher to switcher with the last one ofthe chain connected to the appropriate System OneChannel A connector. The Channel B stacking con-nectors on the rear panels should be connected fromswitcher to switcher with the last one of the chainconnected to the appropriate System One Channel Bconnector.
The PATCH POINT version switcher uses theconnectors marked Channel A as the input connec-tions. These should be daisy-chained to the otherswitchers in the system and connected to one chan-nel of the System One generator output. The Chan-nel B connectors are used as the output connectorsand should be connected to the corresponding chan-nel of the analyzer input. This channel is then se-lected by setting the corresponding rocker switch, Aor B, on the rear of the switcher to the up position.
18.3. Installation
Switcher installation consists of physically mount-ing the switcher modules, setting the ac mains volt-age range switch, providing proper ac mains power,electrically interconnecting them, and setting rearpanel switches for address and function. Physically,the switcher modules may be either rack-mounted orsimply stacked on top of one another. Ac mainsconnections are made via standard IEC connectors.A rear panel switch selects the nominal 100-120Volt or 220-240 Volt ranges. No power switch isprovided; the units are designed for continuous serv-ice.
Electrically, the digital control connectors of theswitchers must be connected in “daisy-chain” fash-ion. Normally, the computer will be connected tothe first switcher with a digital interface cable, thefirst switcher connects to the second, etc., and thelast switcher connects to the System One digital con-
nector. Each switcher has both a male and femaledigital interface connector on its back panel forthese connections. When more than one module ofa given type (input, output, or patch-point) is usedin a system, rear panel address switches must alsobe set. The four left-hand switches on the binaryswitch bank on the rear panel set the module ad-dress. The relationship between rear panel addressswitch position, binary code, and channel number onthe computer software “panels” is shown in Figure18-8.
In a patch point switcher the two right-handswitches (viewed from the rear) select channel A orchannel B operation as shown in Figure 18-9.These switches are disabled in input or output ver-sions of the switcher.
Figure 18-6 Tracks to Cut to Convert Terminal Stripto Patch Point Switcher, Below S/N 2000
Figure 18-7 Tracks to Cut to Convert Terminal Stripto Patch Point Switcher, S/N 2000 and Above
18-6 Audio Precision System One User's Manual

Patch point switchers, input switchers, and outputswitchers may all be combined in the same system.Input and output switchers may share the same ad-dress. A patch point switcher must not have thesame address as either an input or output switcher.Two patch point switchers may be set to the sameaddress if one is set as Channel A and the other asChannel B.
Audio signal connection must also be connectedin daisy-chain fashion via the rear panel XLR con-nectors. Normally, the generator and analyzer out-puts and inputs will connect to the front panel inputsand outputs of the first pair of switcher modules (as-suming multiple units of both input and output
REAR PANEL SWITCH SETTINGS BINARY CODE CHANNEL NUMBERS
#8 #4 #2 #1
up up up up 0000 1-12up up up down 0001 13-24up up down up 0010 25-36up up down down 0011 37-48up down up up 0100 49-60up down up down 0101 61-72up down down up 0110 73-84up down down down 0111 85-96
down up up up 1000 97-108down up up down 1001 109-120down up down up 1010 121-132down up down down 1011 133-144down down up up 1100 145-156down down up down 1101 157-168down down down up 1110 169-180down down down down 1111 181-196
Figure 18-8 Switcher Address Switch Settings
REAR PANEL SWITCH PATCH PT MODE
A Bdown down OFFdown up CHANNEL B
up down CHANNEL Aup up EITHER A OR B
Figure 18-9 Patch Point Switcher Channel Selection Figure 18-10 Switcher Control Panel
SWITCHER MODULES 18-7

switchers are being used). The rear panel XLRswill then be used to connect channels A and B ofthe first input switcher module to A and B of thenext input switcher, etc.
18.4. Control of Switchers
Audio Precision’s switchers may be controlledfrom two portions of the standard System One soft-ware panels; from the SWITCHER control panel, orin a “sweep” (scan) mode from the SOURCE-1 orSOURCE-2 lines of the SWEEP (F9) DEFINI-TIONS panel.
18.4.1. Switcher Control Panel
The SWITCHER control panel (Figure 18-10)can be brought on screen via the <PgDn> and<PgUp> keys. The SWITCHER panel may also becombined with any two other panels by placing thecursor on a panel to be exchanged, then pressing<Ctrl><PgDn> or <Ctrl)<PgUp> to rotate the off-screen panels through until the SWITCHER panel isobtained. Thus, it is possible to obtain a screen con-sisting of the GENERATOR panel, the ANA-LYZER panel, and the SWITCHER panel.
A switch is closed from the SWITCHER panelsimply by entering a number from the keyboard intothe desired field on the CHANNEL A INPUT,CHANNEL B INPUT, CHANNEL A OUTPUT, orCHANNEL B OUTPUT line. Alternately, the <+>and <Del> keys at the lower right of most IBM-com-patible keyboards may be used to increment or dec-rement the switcher position when the cursor is onthe appropriate numeric field. When 0 is entered,none of the relays are selected. If a number outsidethe range of installed switchers is entered, none areselected.
The SWITCHER panel also permits setting twovalues of offset. The B OFFSET value controls thenumber of channels by which the B channel selec-tion will be offset from the A channel selection dur-ing AB mode sweeps (see below). The OUTPUT
OFFSET controls the number of channels by whichthe output switcher will be offset from the inputswitcher during I/O sweeps (see below).
18.4.2. Driving All But One Channel
The “complement” mode of the output switcherpermits driving all but one output. This mode isused for worst-case crosstalk testing of multi-chan-nel devices. To select the complement mode, enterthe channel number of the one channel which is notto be driven as CHANNEL A OUTPUT. Enter -1as CHANNEL B OUTPUT. The -1 is a code tellingthe switcher to complement all channels; thus, thesingle channel selected at Channel A will not bedriven and all others (up to 191 in a maximum case)will be driven. If 0 is entered as CHANNEL AOUTPUT and -1 is entered in CHANNEL B OUT-PUT for the complement mode, all output channelswill be driven. Complement mode results in directparallel connections of all but the selected channelto the generator B output, so the load impedancesseen by the generator will be reduced and maximumoutput amplitudes may not be obtainable.
Control of the switchers via the SWITCHERpanel is intended for impromptu, unstructured selec-tion of switcher position, or for cases where everytest (xx.TST file) has a specific switcher configura-tion which goes with it. Tests of a consumer stereopreamplifier could be one example of this mode.The moving coil phono preamp inputs, moving mag-net preamp inputs, tuner inputs, and AUX-1 andAUX-2 inputs of a preamplifier all need to betested. The required levels will be different at eachof the phono preamp inputs versus the high-level in-puts. Different tests will be performed on each chan-nel; RIAA equalization will be used on the gener-ator for the phono input tests, different noise limitvalues will be appropriate for each input, etc. Eachinput will thus normally be tested via a series oftests in a procedure, and each of those tests willspecify the required switcher configuration simplyby setting it on the SWITCHER panel as the test isset up and saved. Each preamplifier to be testedwill then be connected to the switcher outputs (per-haps via a plug-in fixture) and the procedure will
18-8 Audio Precision System One User's Manual

automatically select the correct connections as itloads and runs the appropriate tests. An example ofsuch a set of tests is described later in this chapter.
As with generator amplitude and frequency, theSWITCHER panel determines what the conditionswill be before and after a sweep or scan if theswitchers are specified on the SOURCE-1 orSOURCE-2 lines of the SWEEP (F9) DEFINI-TIONS panel as described below.
18.4.3. Sweep (F9) Definitions Panel
The switchers may also be controlled in a scan-ning or sweeping fashion during a test, or from themouse or keyboard in bargraph mode, via theSWEEP (F9) DEFINITIONS panel; see Figure 18-11. The one or two analyzer parameters selected atDATA-1 and DATA-2 may be measured across anumber of channels by selecting SWI as SOURCE-
1, then selecting the scanning mode. If F2 ispressed for bargraph display, the horizontal arrowkeys or mouse can select the switcher channel or theincrement <+> and decrement <Del> keys can beused to step the switcher in one-channel increments.This can be particularly convenient when aligning amulti-track tape recorder. The available scanningmodes and their functions are:
• A-OUT: sequentially scans the outputswitcher’s A channel (which typically is fedfrom the generator A output) to the selectedoutput channels. The output switcher B chan-nel and the input switcher channels remainconnected as selected on the SWITCHERpanel.
• B-OUT: scans the output switcher’s B chan-nel (typically fed from the generator B output)in sequence to the selected output channels.The output A channel and input channels re-main as selected on the SWITCHER panel.
Figure 18-11 Sweep Test Definitions Panel for Switcher Scans
SWITCHER MODULES 18-9

• AB-OUT: synchronized but offset scan ofboth the A and B channels of the outputswitcher, with the B channel offset from theA channel selection by the value entered onthe SWITCHER panel as B OFFSET. For ex-ample, if A is connected to channel 9 and theB OFFSET value is 4, B will be connected tochannel 13. A common application is scan-ning paired outputs of stereo systems usingSTEP SIZE 2 and B OFFSET of 2, andscanned crosstalk measurements to the adja-cent track of multi-track tape recorders. Theinput channels remain as selected on theSWITCHER panel.
• A-IN: scans the input switcher’s A channel(typically connected to the analyzer A input)sequentially across the selected input chan-nels. The input B channel and output chan-nels remain as selected on the SWITCHERpanel.
• B-IN: scans the input switcher’s B channel(typically connected to the analyzer B input)in sequence to the selected input channels.The input A channel and output channels re-main as selected on the SWITCHER panel.
• AB-IN: synchronized but offset scan of boththe A and B channels of the input switcher,with the B channel offset from the A channelselection by the number of channels enteredas B OFFSET on the SWITCHER panel. Ap-plications include scans of stereo systems ordevices using B OFFSET 2 and STEP SIZE2, and scanned crosstalk measurements to theadjacent track of multi-track tape recorders.The output channels remain as selected on theSWITCHER panel.
• A-I/O: scans both the output switcher A chan-nel and the input switcher A channel in se-quence across the specified output and inputchannels. If OUTPUT OFFSET on theSWITCHER panel is 0, both input and outputchannel numbers will the same. If OUTPUTOFFSET is any other value, the outputswitcher will be offset from the input switcher
by that specified number of channels. The Bchannels remain as selected on theSWITCHER panel.
• B-I/O: scans both the output switcher B chan-nel and the input switcher B channel in se-quence across the specified output and inputchannels. OUTPUT OFFSET functions as de-scribed above. The A channels remain as se-lected on the SWITCHER panel.
• AB-I/O: synchronized but offset scan of boththe A and B channels of both the input andoutput switchers. The B channel will be off-set from the A channel by the B OFFSETvalue on the SWITCHER panel. The outputchannel will be offset from the input channelby the OUTPUT OFFSET selection on theSWITCHER panel. Applications includescans of stereo systems or devices usingSTEP SIZE 2, and scanned crosstalk measure-ments to the adjacent track of multi-track taperecorders.
• NONE: no switcher scanning takes place; con-nections remain as specified on theSWITCHER panel.
18.4.4. Nested Switcher Scans
The switchers may also be scanned in a nestedfashion with other parameters such as generator am-plitude or frequency, analyzer bandpass filter fre-quency, or external frequency, amplitude, or time.The parameter selected as SOURCE-1 on theSWEEP (F9) DEFINITIONS panel will proceedthrough one sweep or scan with the value of theSOURCE-2 parameter specified on the GRAPHBOTTOM line at the center of the panel (usualDATA-2 area). The SOURCE-2 parameter willthen take one step toward the GRAPH TOP valueand the SOURCE-1 parameter will scan or sweepagain, etc. See Figure 18-14 on page 18-13 for anexample.
18-10 Audio Precision System One User's Manual

18.5. Typical Switcher Applications
18.5.1. Stereo Control Preamplifier
Assume that a stereo preamplifier/control centeris to be tested. It has inputs for moving coil phonocartridges, moving magnet cartridges, and three setsof high level inputs. The moving coil inputs havethe greatest gain (and equivalent input noise), fol-lowed by the moving magnet inputs. All high levelinputs have less gain. Both sets of phono inputs areRIAA-equalized. Assume that gain, signal-to-noise,frequency response, and thd versus frequency testsare to be run from each set of phono inputs and oneset of high level inputs, plus gain tests only on theremaining high level inputs.
A single output switcher module with no inputswitchers is sufficient, as shown in Figure 18-12Four moving-coil tests would be set up and saved,with generator levels appropriate for the moving coilpre-amp sensitivity, with RIAA pre-emphasis filesattached to the generator and EQSINE selected. Wewill name them MC-GAIN.TST, MC-SIGNO.TST,MC-FRQRS.TST, and MC-THD.TST. All wouldbe STEREO tests (DATA-2 line); all four wouldhave their SWITCHER panels set as follows:
CHANNEL A INPUT 0
CHANNEL B INPUT 0
CHANNEL A OUTPUT 1
CHANNEL B OUTPUT 2
Four moving-magnet pre-amp tests would besaved by modifying the four tests above to thehigher generator level appropriate for this input, andchanging the SWITCHER panel to read:
CHANNEL A INPUT 0
CHANNEL B INPUT 0
CHANNEL A OUTPUT 3
CHANNEL B OUTPUT 4
They would be saved as MM-GAIN.TST, MM-SIGNO.TST, MM-FRQRS.TST, and MM-THD.TST.
OUTPUTSWITCHER
A
B
GENERATOR
ANALYZER
STEREOPRE-
AMPLIFIER
MOVINGCOIL IN
MOVINGMAGNET IN
TUNER IN
CD IN
AUX IN
1
2
3
4
5
6
7
8
9
10
11
12
A
B
L
R
L
R
L
R
L
R
L
R
L
R
Figure 18-12 Switcher for Stereo Preamplifier Tests
SWITCHER MODULES 18-11

These tests would then be further modified to astill-higher generator level appropriate for the highlevel inputs, the RIAA equalization file would be re-moved and SINE selected instead of EQSINE, andthe SWITCHER panel set to:
CHANNEL A INPUT 0
CHANNEL B INPUT 0
CHANNEL A OUTPUT 5
CHANNEL B OUTPUT 6
They would be saved as HL1-GAIN.TST, HL1-SIGN.TST, HL1-FRQ.TST, and HL1-THD.TST.
Finally, a test called HL2-GAIN.TST would besaved with the SWITCHER panel set to
CHANNEL A INPUT 0
CHANNEL B INPUT 0
CHANNEL A OUTPUT 7
CHANNEL B OUTPUT 8
and a test called HL3-GAIN.TST would be savedwith SWITCHER positions
CHANNEL A INPUT 0
CHANNEL B INPUT 0
CHANNEL A OUTPUT 9
CHANNEL B OUTPUT 10
These fourteen tests could then be linked into aprocedure. Acceptance limits could be created forall of them, and an error file named for the final testreport. See the chapters following for more informa-tion on these capabilities.
18.5.2. Multi-track Tape Recorder
A multi-track tape recorder is basically a numberof semi-independent monaural signal channels. As-sume that a 24-track machine is to be tested for fre-
OUTPUTSWITCHER
OUTPUTSWITCHER
INPUTSWITCHER
INPUTSWITCHER
24 TRACKTAPE
RECORDER
ADDRESS0000
ADDRESS0001
ADDRESS0000
ADDRESS0001
STACKINGCONNECTIONS
GENERATOR ANALYZER
STACKINGCONNECTIONS
A
B
A
B
TR 24
TR 23
TR 24
TR 23
TR 14
TR 13
TR 14
TR 13
TR 12
TR 11
TR 12
TR 11
TR 2
TR 1
TR 2
TR 11 1
2 2
11
12
11
12
13
14
23
24
13
14
23
24
Figure 18-13 Switchers for Multi-Track Tape Recorder Tests
18-12 Audio Precision System One User's Manual

quency response, THD vs amplitude (MOL), THDvs frequency, and spectral distribution of noise oneach channel. Furthermore, “gap scatter” (phasevariation from a center track to all other tracks) is tobe measured and crosstalk is to be measured fromall tracks (simultaneously) to each track under test.
Two output switchers and two input switchers arerequired to automate the testing of a 24-track tape re-corder, as shown in Figure 18-13. The rear paneladdress switches of the second output and second in-put switcher would be set to binary 0001, whichwill make them respond to the software as channels13 through 24. The frequency response, two thd
sweeps (one versus amplitude and one versus fre-quency), noise spectral distribution sweeps, andworst-case crosstalk can each be set up as a singlexx.TST file by using nested sweep capability. Thesame limit file(s) will then apply to a given parame-ter for all 24 channels, and a single error file willshow any outside-specification measurements identi-fied by channel number. The gap scatter test will bea sixth test.
SWEEP (F9) DEFINITIONS panels will beshown for all six tests. For frequency response onall 24 tracks, the panel will be as shown in Figure18-14. Note that OUTPUT OFFSET on theSWITCHER panel must be set to 0 so that both in-put and output switchers will connect to the samechannel at all times.
The switchers will select the input and output oftrack 1, and response will be measured from 20 kHzto 20 Hz; the switchers will step to track 2 and theresponse sweep will be repeated, etc. All 24 re-sponse sweeps will be drawn on the same graph ifDISPLAY MONO-GRAPH or DISPLAY COLOR-
Figure 18-14 Sweep Panel for 24 Track Freq Resp
FREQRESP 31 MAY 86 12:47:04FREQ(Hz) AMPL(dBr) SWI(#)
15.8866 kHz 2.56 dBr 2 # above 2.0020.0000 kHz -2.07 dBr 13 # below -2.0012.6191 kHz -3.74 dBr 17 # below -2.00
Figure 18-15 Error File from 24 Track ResponseTest
Figure 18-16 Sweep Panel for 24 Track MOL
SWITCHER MODULES 18-13

Figure 18-17 Sweep Panel, 24 Track THD+N Figure 18-18 Sweep Panel for 24 Track Noise
Figure 18-19 Switcher and Sweep Panels for Gap Scatter
18-14 Audio Precision System One User's Manual

GRAPH is chosen. If DISPLAY TABLE is se-lected, the response measurements will be tabulatedin the second column and the selected track numberwill be shown in the third. One pair of limit filesfor the permissible upper and lower limits of fre-quency response will be applied to all 24 tracks.Any outside-limits measurements will be writteninto the error file, with the frequency, amplitudemeasurement, and track number (switcher channelnumber) printed along with the value of limit whichwas exceeded. An example is shown in Figure 18-15 of such an error file from the frequency responsetest, where channels 2, 13, and 17 failed the +/-2.0dB upper or lower limits.
The panel for THD+N versus amplitude at afixed frequency (MOL) is shown as Figure 18-16.The switchers will select the input and output oftrack 1 and an amplitude sweep from -10 dBu to+20 dBu will be made at the frequency set on thegenerator panel (typically 1 kHz). MeasuredTHD+N will be plotted, though 3rd harmonic could
also be selected with the appropriate option filter.The switchers will step to track 2 and the MOLsweep will be repeated, etc.
For THD+N as a function of frequency, the panelis set up as shown in Figure 18-17. The switchersstart on track 1 and THD+N is measured versus fre-quency from 10 kHz to 20 Hz. The switchers stepto track 2 and the sweep repeats, etc.
For a spectral distribution of noise of each track,obtained by sweeping the one-third octave bandpassfilter, the panel will be as shown in Figure 18-18.
The switchers select track 1; the generator outputbeing set to OFF provides a back-termination of theselected track input. The analyzer bandpass filtercenter frequency is swept from 20 kHz to 20 Hz, theswitchers step to track 2 and the filter sweep re-peats, etc. The result is a display of the spectral dis-tribution of noise of each track, all overlaid on thesame graph or displayed as 24 successive sets ofdata in DISPLAY TABLE mode.
Figure 18-20 Analyzer, Switcher, and Sweep Panels for Worst-Case Crosstalk
SWITCHER MODULES 18-15

For the gap scatter test, where track 12 will beused as the phase reference channel and all channelsmeasured with respect to track 12, the SWITCHERpanel will be set up as shown in Figure 18-19.
As a high frequency reference tape is played, theinput switcher scans the analyzer A input across all24 tracks. At each track, phase is measured with re-spect to track 12 which remains connected to theanalyzer B channel input via the SWITCHER panelsince the B input is not scanned.
For the worst-case crosstalk test, the switcher andsweep panels will be set as shown in Figure 18-20.
Selection of the complement mode (CHANNELB OUTPUT set to -1) means that all output switcherchannels will be turned on except for the one speci-fied as CHANNEL A. The A channel selection isscanned from track 1 to track 24 as the SOURCE-2parameter of the SWEEP (F9) DEFINITIONSpanel. Thus, when the test begins, the output switch-ers will connect the generator A channel output toall tracks except track 1 while the input switcherconnects track 1 into the analyzer. The generator
then sweeps from 20 kHz to 20 Hz while the ana-lyzer (in BANDPASS mode to permit measurementof crosstalk below wide-band noise level) measurescrosstalk from all other tracks into track 1. Theswitchers then step so as to drive all tracks excepttrack 2 while measuring track 2 output, and thesweep repeats. The end result is measurement ofcrosstalk across the entire audio spectrum from alltracks into all tracks, in one test with one limit file.
18.5.3. Audio Chain or MixingConsole Channel
The patch-point switcher SWR-122P (or terminalstrip version SWR-122T with jumpers and switchesset to configure it as a patch point switcher) is de-signed for insertion at a number of points in anaudio chain. Examples include the patch points in amixing console input channel, or at the connectionsbetween the output of one piece of equipment andthe input of the following one in a recording studio,broadcast station, or sound reinforcement installa-tion. Figure 18-21 shows how two patch-pointswitchers might be installed at a stereo broadcast sta-
OUT IN
L
R
L
R
L
R
L
R
OUT IN OUT IN OUTSTUDIO-
XMTRLINK
LINEAMPL.
AUDIOPROCESSOR XMTR MODUL.
MONITOR
PATCH-POINTSWITCHER “A”
PATCH-POINTSWITCHER “B”
GENERATOR CHAN A OUTPUTANALYZER CHAN A INPUT
GENERATOR CHAN B OUTPUTANALYZER CHAN B INPUT
OUT
IN
OUT
IN1 2 3 4 12
124321
Figure 18-21 Patch Point Swiitcher in Audio Chain
18-16 Audio Precision System One User's Manual

tion at the studio-transmitter link output, line ampli-fier (if present) input and output, processor inputand output, transmitter input, and modulation moni-tor output. All connections are balanced, but areshown as single connections in the figure for thesake of simplicity. If it is not necessary to do stereotests such as phase, a single patch-point switchercould be installed to monitor and control both chan-nels of a stereo system. With a single switcher,however, only one channel could have a normalled-through connection broken at any time.
The patch point switcher will normally be control-led from the SWITCHER panel, rather than in ascanning fashion from the SWEEP (F9) DEFINI-TIONS panel. Assume that the patch point switch-ers are installed as shown above, with the switcherinstalled in the left channel designated (by rearpanel switches) as the A channel switcher, and theright channel switcher designated as B. With theSWITCHER panel set as shown below, all nor-malled-through connections are made and no signalmonitoring takes place:
CHANNEL A INPUT 0
CHANNEL B INPUT 0
CHANNEL A OUTPUT 0
CHANNEL B OUTPUT 0
To monitor the signal at the processor output-transmitter input point in both channels, select
CHANNEL A INPUT 3
CHANNEL B INPUT 3
CHANNEL A OUTPUT 0
CHANNEL B OUTPUT 0
Normal signal flow will continue and the ana-lyzer, by selecting A or B input on the ANALYZERpanel, can measure signal in either the left or rightchannel.
To break the connection between the right chan-nel line amplifier output and processor input whilemeasuring line amplifier output signal on both chan-nels, select
CHANNEL A INPUT 2
CHANNEL B INPUT 2
CHANNEL A OUTPUT 0
CHANNEL B OUTPUT 2
Selecting 2 as the CHANNEL B OUTPUTbreaks the circuit, meaning that the level at B IN-PUT is now the unloaded output of the right channelline amplifier. The left channel line amplifier is stillloaded by the left processor input. If the generatorB OUTPUT is turned on, the generator will feed theright channel processor input. It is thus possible toproceed through both stereo channels, measuring sig-nal with normal loading, breaking a connection tomeasure unloaded signal level, and driving the gener-ator into the following input as desired.
SWITCHER MODULES 18-17

18-18 Audio Precision System One User's Manual

19. DIGITAL SIGNAL PROCESSOR
Digital Signal Processor modules may be in-stalled in the lower left-hand compartment of Sys-tem One, underneath the generator. When the DSPmodules are installed, System One becomes an SYS-200 series or SYS-300 series. The SYS-200 seriesis capable of a number of enhanced measurementsof analog domain signals, including waveform dis-play, spectrum analysis via FFT, highly selective am-plitude measurements by use of digitally-imple-mented narrow-band filters, extremely rapid audiotesting with multi-tone signals (FASTest), and quasi-anechoic loudspeaker testing by the MLS technique.The SYS-300 also performs these measurements andis further distinguished by its ability to measureand/or stimulate digital audio devices in the digitaldomain, in both parallel and the AES/EBU andSPDIF serial formats, and to perform bit error ratetesting. This capability, added to the existing Sys-tem One capability for audio signal generation and
measurement in the analog domain, allows the SYS-300 models to test analog and digital audio devicesin any of the four possible combinations; A/A, A/D,D/A, or D/D.
The Digital Signal Processor modules includetwo or three DSP chips, memory, A/D and D/A con-verters, and supporting circuitry. For the varioustypes of enhanced measurements on signals in theanalog domain, analog signals are converted into thedigital domain by two 16-bit A/D converters. All re-maining processing and measurement is then digital.The SYS-300 series can additionally acquire andgenerate digital audio signals in the AES/EBU andSPDIF serial formats at front panel connectors, paral-lel-format signals at ribbon connectors at the rear ofthe enclosure, or in a wide variety of other serial for-mats with the SIA-322 Serial Interface Adapter.
Figure 19-1 Residual Distortion of System One Analog Generator and Analyzer at 1 kHz; 8,192 Line FFT,16x Averaged
19-1
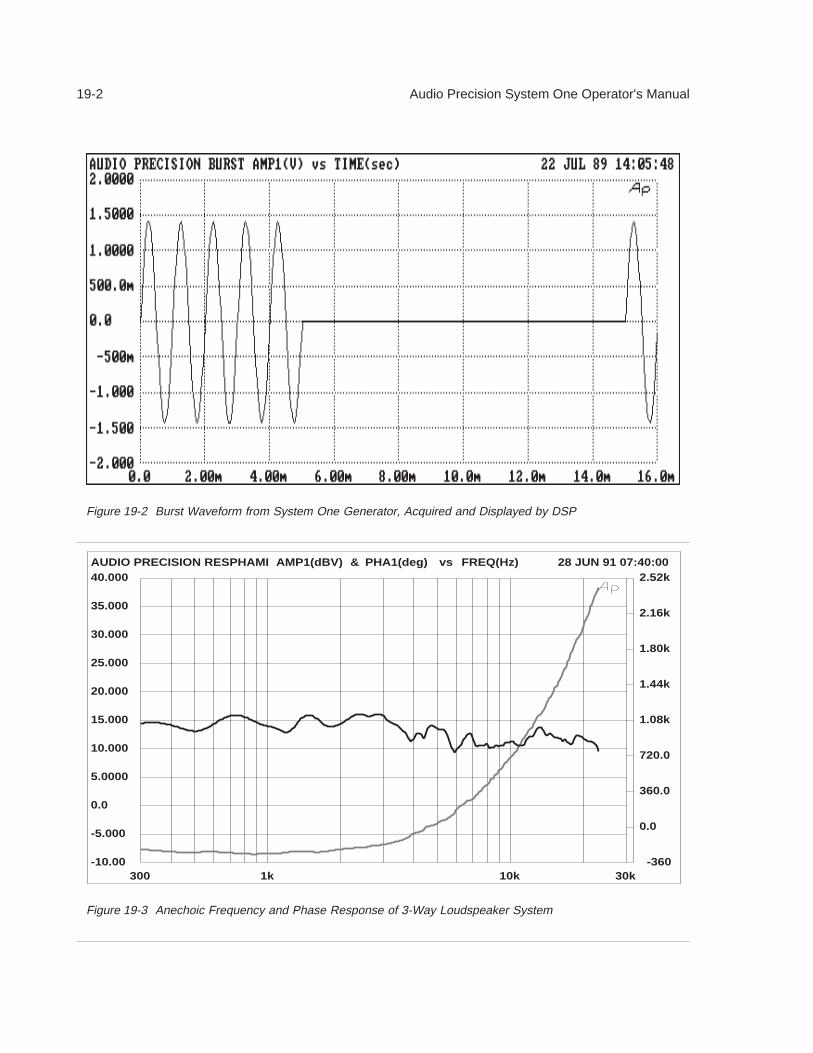
Figure 19-2 Burst Waveform from System One Generator, Acquired and Displayed by DSP
300 1k 10k 30k
FREQ(Hz)
-360
0.0
360.0
720.0
1.08k
1.44k
1.80k
2.16k
2.52kPHA1(deg)
-10.00
-5.000
0.0
5.0000
10.000
15.000
20.000
25.000
30.000
35.000
40.000AMP1(dBV)AUDIO PRECISION RESPHAMI & vs 28 JUN 91 07:40:00
Figure 19-3 Anechoic Frequency and Phase Response of 3-Way Loudspeaker System
19-2 Audio Precision System One Operator's Manual

19.1. Typical DSP Applications
Figure 19-1 is a high-resolution spectrum analy-sis via FFT (Fast Fourier Transform) program of theresidual distortion of a System One generator andanalyzer at 1 kHz. The fundamental signal, attenu-ated by the analog notch filter, is visible at -122 dB.Several harmonics are visible in the -135 to -145 dBarea, plus the noise floor at about -150 dB. The dis-play is the averaged result of 16 acquisitions andFFT transforms.
Figure 19-2 is an example of the waveform dis-play function possible with the FFT programs. Thesignal is the SINE BURST mode available from Sys-tem One’s BUR-GEN option.
Figure 19-3 shows the quasi-anechoic frequencyresponse and phase of a three-way loudspeaker sys-tem as measured with the MLS (Maximum LengthSequence) technique. All room reflections were ex-cluded from this measurement by selecting only the
portion of impulse response before arrival of thefirst reflection. This measurement requires less thanfive seconds.
Figure 19-4 shows total distortion (harmonic andintermodulation) and noise of an audio device. Thismeasurement plus frequency response, inter-channelphase (if a stereo device), and several other audio pa-rameters can all be measured in 2-4 seconds totalwith only 1-2 seconds of multi-tone stimulus signalrequired. Thus, broadcasting systems can be meas-ured during normal programming, perhaps with themulti-tone signal serving as a time signal. In high-volume production test applications, the last devicecan be disconnected and the next device connectedduring the 2-3 seconds of additional analysis whichtakes place following the 1-2 seconds of stimulus.
Figure 19-5 shows THD+N versus frequency fora 16-bit PCM digital recorder, measured in each ofthese possible combinations of domain. The D/Dcurve at -98 dB demonstrates in practical measure-ment the theoretical quantization noise and distor-tion value of a 16-bit PCM system. The D/A curve
20 100 1k 10k 20k
FREQ(Hz)
-120.0
-100.0
-80.00
-60.00
-40.00
-20.00
0.0AMP1(dBV)AUDIO PRECISION DISTORT vs 29 JUN 91 11:40:32
Figure 19-4 Total Distortion and Noise vs Frequency, Measured Along with Response, Phase, Noise, andCrosstalk from Multi-Tone Stimulus of Less Than Two Seconds.
Digital Signal Processor 19-3

D-D
D-A
A-AA-D
Figure 19-5 RDAT THD+N vs Frequency In All Combinations of Analog and Digital Inputs and Outputs
CHAN ARANGING
GAIN/ATTEN.
CHAN BRANGING
GAIN/ATTEN.
INPUTMULTPLX
READING METER:BP/BR, HP, LP, OPT & EXT
FILTERS, IMD, W&F
RDNG
A/DCH-1
A/DCH-2
TRIG-GER
DSP
D/A
CHAN AINPUT
CHAN BINPUT
ANALOG INPUT AANALOG INPUT B
GEN MONGEN SYNC
AC LINE
PARALLELAES-EBU
SPDIF (2-CHAN MULTPLX)
SPDIF
AES-EBU
PARALLEL
ANALOG OUT D/A
TO GEN.“DGEN”
WAVEFORMSELECTION
TO RDNGDETECTOR
(2-CHAN MULTPLX)
(2-CHAN MULTPLX)
(2-CHAN MULTPLX)
LINEGEN-SYNC
GENDSP-BDSP-A
ANLR-AANLR-B
ANALOGMULTPLXR
ANALYZER (ANALOG)
DSP MODULES
SERIAL G.P.
SERIAL G.P.
Figure 19-6 Simplified Block Diagram, DSP Inputs and Outputs
19-4 Audio Precision System One Operator's Manual

shows the recorder’s output DAC adding about 6 dBdistortion above theoretical minimum. The A/D andA/A curves show the recorder’s input A/D converterto be the dominant source of distortion, adding some10-12 dB above theoretical minima.
19.2. DSP Architecture
The Digital Signal Processor modules includetwo or three DSP chips, memory, 16-bit A/D andD/A converters, and supporting circuitry. For thevarious types of enhanced measurements on signalsin the analog domain, analog signals are convertedinto the digital domain by two A/D converters. Allremaining processing and measurement is then digi-tal. The points at which the analog signal may beacquired include (in effect) the CHANNEL A,CHANNEL B, and READING monitor connectorsof the analyzer, the MONITOR connector of the gen-erator, and two additional BNC input connectorsdedicated to the DSP.
The SYS-300 series additionally acquires and gen-erates 24-bit digital audio signals in the AES/EBUand SPDIF (coaxial and optical) serial formats atfront panel connectors, and general-purpose serialand parallel-format signals at the rear of the enclo-sure. See Figure 19-6 for a simplified block dia-gram of the signal connections to and from the DSPmodules. An accessory device, the SIA-322 SerialInterface Adaptor, supports easy connection of Sys-tem One Dual Domain to a wide variety of non-standard serial interfaces.
19.3. Downloading DSP Programs
As a special-purpose digital computer, the DSPmodule requires programs to tell it what to do.These files (identified by the file extension .DSP)are downloaded from the personal computer to theDSP modules within System One by the NAMESPROGRAM command. If a .TST file is loaded towhich a DSP program had previously been attachedvia the NAMES PROGRAM command, the DSP
Figure 19-7 DSP Panel With No DSP Program Loaded
Digital Signal Processor 19-5

program automatically downloads when the .TSTfile is loaded into memory (unless that same DSPprogram is already there from the previous test).
The DSP panel is reproduced in Figure 19-7. Un-til a DSP program is downloaded to the DSP mod-ule, most of the panel is blank. The control and dis-play fields which load into the DSP panel dependupon which program is downloaded. Only thefields at the bottom of the panel are common to allDSP programs. These fixed fields permit selectionof the sample rate at which the input data is ac-quired, whether the input is analog or digital, andwhat signal drives each input. If a generator capabil-ity is included in the DSP program, these fields willselect the destination of the internally-generated sig-nal and its sample rate. The HELP DSP menu selec-tion presents a screen of information which is alsoloaded by each .DSP program selected.
19.4. DSP Input Operation
19.4.1. Rate vs Bandwidth
The RATE choices available in the hardware are1 kHz, 8 kHz, 32 kHz, 44.1 kHz, 48 kHz, 176.4kHz, and 192 kHz. Not all rates are available in all.DSP programs. The digital input and/or output ca-pability functions only with the 32 kHz, 44.1 kHz,and 48 kHz rates. The remaining rates, if availablein a particular program, function only as effectivesampling rates of the A/D converters for acquiringanalog signals.
The bandwidth available with any rate cannot ex-ceed half the sample rate, as originally shown byNyquist. In practice, the useful bandwidth is some-what less than half the sample rate. System One’sDSP module, when acquiring analog signals, actu-ally functions with the A/D converters always oper-ating at a 192 kHz or 176.4 kHz sample rate andwith an anti-alias low-pass filter bandwidth fromzero to 80 kHz. When a lower sample rate is se-
32 kHzRate
44.1 kHzRate
48 kHzRate
192 kHz,176.4kHz
Rates
8 kHzRate
1 kHzRate
Figure 19-8 Frequency Response vs Sampling Rate, DSP
19-6 Audio Precision System One Operator's Manual

lected, a second DSP chip functions as a decimator,effectively scaling down both the sample rate andthe anti-alias filter corner frequency to lower values.Figure 19-8 shows the typical measured frequencyresponse of the analog input channels at each sam-ple rate. Typical -3 dB points are 375 Hz at the 1kHz rate, 3.94 kHz at the 8 kHz rate, 15.7 kHz atthe 32 kHz rate, 21.6 kHz at the 44.1 kHz rate, 23.5kHz at the 48 kHz rate, and 85.3 kHz at the 176.4and 192 kHz rates. Linear phase acquisition of ana-log signals is only available at sample rates of 48kHz and lower. The 1 kHz sample rate is intendedonly for acquisition and spectral analysis of verylow frequency signals such as wow and flutter.
19.4.2. Dither
Dither is noise combined with the signal to im-prove linearity, reduce distortion at low amplitudes,and extend the linear operating range below the theo-retical minimum for undithered PCM signals of anyparticular resolution. Both rectangular and triangu-lar probability function dither with flat noise spectraare selectable, plus triangular probability functionwith a spectrally-shaped frequency distribution to re-duce the audibility of the dither.
19.4.3. AES/EBU Status Bytes
The AES/EBU digital audio transmission stand-ard (AES3-1985, also ANSI S4.40-1985) reserves24 8-bit status bytes in addition to two channels ofdigitized audio signals. The UTIL AES-EBU RE-CEIVE and UTIL AES-EBU TRANSMIT menucommands permit control over the status bytes trans-mitted at the AES output connector of Dual Domain(SYS-300 family) units, and display of the bytes re-ceived at the AES input connector.
For specific information on the use of each DSPprogram, see the DSP program documentationwhich is furnished with each DSP program.
Digital Signal Processor 19-7

19-8 Audio Precision System One Operator's Manual

20. BURST-SQUAREWAVE-NOISE GENERATOR
20.1. Tone Burst Waveforms
The tone burst capability of the BUR-GEN mod-ule provides sinewave bursts which switch betweennormal amplitude and a lower amplitude. Switchingbetween the higher and lower levels always occursat a positive-going zero crossing. The duration andrepetition rate of the burst are controllable, as is thelower amplitude. The sinewave is produced by thegenerator oscillator. Thus, its frequency is deter-mined by the FREQUENCY field on the GENER-ATOR panel and the higher amplitude is at the cali-brated AMPLITUDE value on the GENERATORpanel. In addition to the free-running, repetitivemode of SINE BURST, bursts may be either exter-nally triggered (SINE TRIG) or the signal may begated on and off (SINE GATE) by an external sig-
nal. The tone burst parameters may be swept as aSOURCE-1 or SOURCE-2 independent variable dur-ing a sweep test.
Figure 20-1 shows the burst control area of theGENERATOR panel. All three of these lines willbe visible only when BURST mode is selected onthe WAVEFORM line. Only the BURST ON andLOW LVL lines will be displayed when TRIG is se-lected, and only the LOW LVL line will be dis-played when GATE is selected. See Figure 20-22for a graphic explanation on these parameters,which are explained below.
The maximum burst ON time is 65,535 cycles ofsinewave. The burstON time may be set in any ofthree units.
• CYCLES is the basic unit, and refers to inte-gral cycles of the sinewave being generated.
• ThesecB(seconds of burst) unit causes a com-putation (using the sinewave period) fromtime to cycles, with a round-off to the nearestintegral cycle. For example, if the generatorGENERATOR panel FREQUENCY is 1.00kHz (1 millisecond period) and 3.7 msecB isentered for BURST ON, the software willround off to the nearest integral number of cy-cles and produce a 4-cycle burst. The panelindication will also show 4.0 msecB, the ac-tual value produced, rather than the 3.7msecB entered by the user. Each time thegenerator frequency is changed (panel, bar-graph, or sweep mode), a new computationand round-off to the nearest integer number ofcycles will take place.
• %ON is also a computed unit, interactingwith the burst interval (and the sinewave pe-riod when necessary) to produce a burst of thestated duty factor. For example, if the INTER-VAL is 500 CYCLES, and 50% is entered as%ON, a burst of 250 cycles will result. If theINTERVAL were set as 250 msecB and theFigure 20-1 Burst Control Areas, GEN1 Panel
20-1

generator frequency were 1.00 kHz, computa-tions will be made from time to cycles totime; a burst on time of 125 millisecondswould result from the 50% ON selection. Ifthe INTERVAL were set as 3 Bps (bursts persecond), the software will calculate the inter-val in cycles using the generator frequency,then compute the number of “on” cycles clos-est to the selected duty factor. With a 1.00kHz frequency, the 3 Bps rate will actuallyproduce a 333 cycle interval (the actual dis-played Bps value will be 3.003). The 50%ON selection (theoretically 166.5 cycles) willthen be rounded to 167 cycles which will bedisplayed as 50.15% ON.
The maximum burst INTERVAL is 65,536 cy-cles of sinewave. The burstINTERVAL may alsobe controlled in any of three units. Interval is thetime from the beginning of one burst to the begin-ning of the next burst, not the time between the endof one burst and the beginning of the next.
• CYCLES is the basic unit, and refers to inte-gral cycles of the sinewave being generatedby generator.
• secB(seconds of burst interval) is computed,using the period of the sinewave, with aroundoff to the nearest integral number of cy-cles. The displayed time will be the nearest le-gal value after rounding, rather than the en-tered value.
• Bps is bursts per second. It is computed us-ing the period of the sinewave and roundingto the nearest integral number of cycles. Thenearest legal value will be displayed.
Burst ON and INTERVAL values may be typedinto their control fields from the keyboard. Thesevalues may also be incremented and decrementedthe the <+> and <Del> keys when the cursor isplaced on the field. The increment size is alwaysone unit; one cycle in CYCL units, one percent in%ON, one second in time units, etc. If TB-ON or
Figure 20-2 Burst Amplitude and Time Calibration
20-2 Audio Precision System One User's Manual

TB-INT is selected at SOURCE-1 and bargraph(<F2>) display selected, the increment and decre-ment features will also function on the bargraph.
TheLOW LVL (low level) line controls the am-plitude of the generator output between bursts. Thisis set relative to the amplitude during bursts deter-mined by the generator AMPLITUDE field. In trig-gered and gated mode, the generator output will beat the LOW LVL amplitude between triggeredbursts or gated-on portions. The LOW LVL ampli-tude may be set in any of three units.
• % The % unit states the lower level ampli-tude as a percentage of the voltage of the up-per amplitude.
• dB The dB unit states the lower level ampli-tude in dB below the upper amplitude.
• X/Y The X/Y unit states the ratio of thelower level amplitude to the upper level ampli-tude.
The lower level amplitude may equal the upperlevel amplitude, in which case no burst, gated, ortriggered effect will be visible. At large amplituderatios, the amplitude resolution of the lower levelwill become poorer. The display will show the ac-tual available resolution steps, rather than the en-tered value. The lower level is limited to -80 dB(0.01%).
20.1.1. Triggered Bursts
In triggered operation (SINE TRIG mode), oneburst of the specified BURST ON duration will begenerated for each trigger presented to the TRIG-
Figure 20-3 Timing Relationships, Triggered Bursts
BURST-SQUAREWAVE-NOISE GENERATOR 20-3
20-3
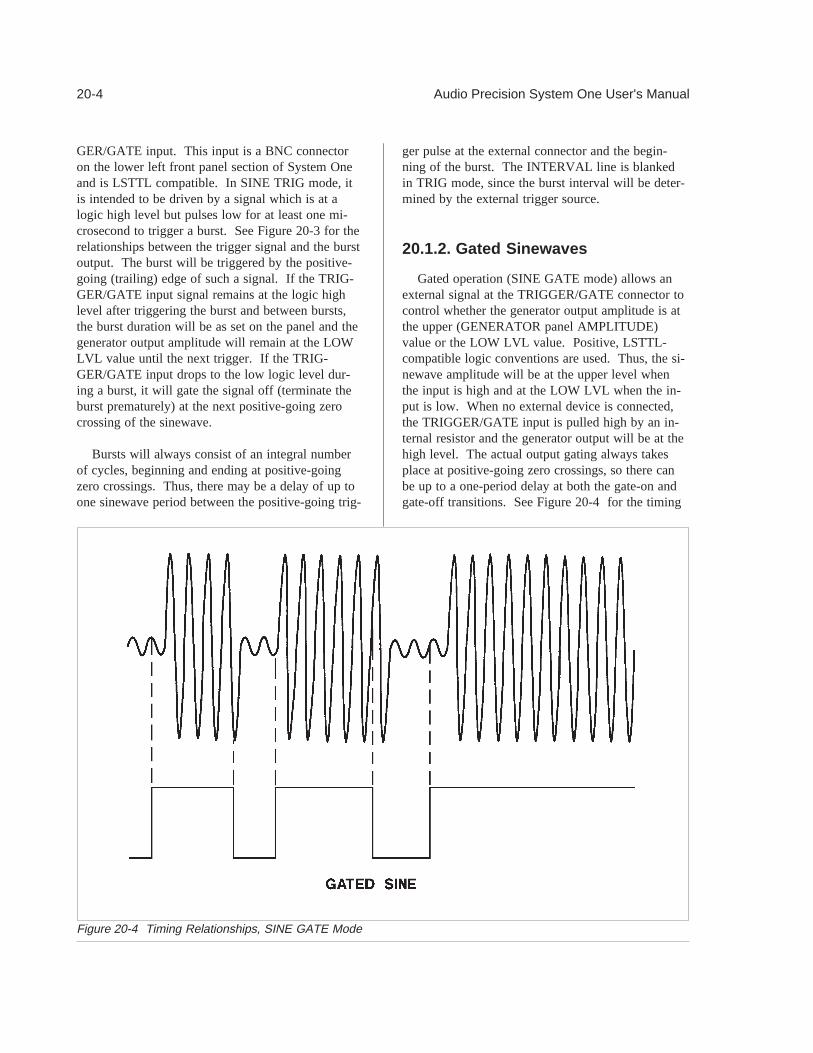
GER/GATE input. This input is a BNC connectoron the lower left front panel section of System Oneand is LSTTL compatible. In SINE TRIG mode, itis intended to be driven by a signal which is at alogic high level but pulses low for at least one mi-crosecond to trigger a burst. See Figure 20-3 for therelationships between the trigger signal and the burstoutput. The burst will be triggered by the positive-going (trailing) edge of such a signal. If the TRIG-GER/GATE input signal remains at the logic highlevel after triggering the burst and between bursts,the burst duration will be as set on the panel and thegenerator output amplitude will remain at the LOWLVL value until the next trigger. If the TRIG-GER/GATE input drops to the low logic level dur-ing a burst, it will gate the signal off (terminate theburst prematurely) at the next positive-going zerocrossing of the sinewave.
Bursts will always consist of an integral numberof cycles, beginning and ending at positive-goingzero crossings. Thus, there may be a delay of up toone sinewave period between the positive-going trig-
ger pulse at the external connector and the begin-ning of the burst. The INTERVAL line is blankedin TRIG mode, since the burst interval will be deter-mined by the external trigger source.
20.1.2. Gated Sinewaves
Gated operation (SINE GATE mode) allows anexternal signal at the TRIGGER/GATE connector tocontrol whether the generator output amplitude is atthe upper (GENERATOR panel AMPLITUDE)value or the LOW LVL value. Positive, LSTTL-compatible logic conventions are used. Thus, the si-newave amplitude will be at the upper level whenthe input is high and at the LOW LVL when the in-put is low. When no external device is connected,the TRIGGER/GATE input is pulled high by an in-ternal resistor and the generator output will be at thehigh level. The actual output gating always takesplace at positive-going zero crossings, so there canbe up to a one-period delay at both the gate-on andgate-off transitions. See Figure 20-4 for the timing
Figure 20-4 Timing Relationships, SINE GATE Mode
20-4 Audio Precision System One User's Manual

and logic relationships in SINE GATE mode. Boththe BURST ON and the INTERVAL lines areblanked in GATE mode, since both these parametersare determined by the external gating signal.
Note that the TRIGGER/GATE input connectoris functional in the SINE BURST, SINE GATE,AND SINE TRIG modes. If this control input ispulled to a logic low condition, it will gate the sig-nal to the LOW LVL amplitude even during inter-nally-controlled burst mode or during an externally-triggered burst.
20.2. Squarewaves
Selecting SQUARE on the WAVEFORM linewill produce squarewaves from the generator outputwhen the BUR-GEN module is installed. Thesquarewave is calibrated in peak equivalent sine-wave terms. Thus, selecting a squarewave with anAMPLITUDE value of 1.000 Vrms on the GENER-ATOR panel will produce a 2.828 V peak-to-peaksignal. The maximum available amplitude of thesquarewave is limited to half the amplitude select-able in sinewave mode. The frequency range forsquarewaves is from 20 Hz to 20 kHz. Note thatthe BAL/UNBAL selection must match the externalload. Connecting to an unbalanced load from theBAL output configuration will produce distortedsquarewaves.
20.3. Noise Waveforms
Several varieties of noise waveforms are avail-able from the BUR-GEN option. Both PSEUDOand RANDOM selections will produce noise wave-forms.
20.3.1. Pseudo and Random Noise
The PSEUDO noise mode produces noise whichis random during a 262 millisecond period, butwhich then repeats every 262 milliseconds. Thisrepetition cycle synchronizes with the nominal 4/secreading rate of the analyzer, producing stable dis-plays. The RANDOM mode is truly random and
never repeats. Readings made using RANDOMmode will not be stable at any reading rate. Thenoise spectrum in the RANDOM mode will have en-ergy at all frequencies within its specified band-width; that is, the spectral lines will be infinitesi-mally closely spaced. In PSEUDO noise mode, thespectral lines will be spaced at the repetition rate ofthe pseudorandom cycle, or approximately every 4Hz from 4 Hz to the upper bandwidth limit. Thissignal may not be acceptable for certain applica-tions, particularly at very low frequencies. How-ever, if the measurement interval is limited, it doesno good to have a noise signal which repeats lessoften.
Amplitude calibration in the PSEUDO noisemode is in terms of equivalent sinewave peak, aswith other complex waveforms such as intermodula-tion test signals and squarewaves. The PSEUDOnoise mode of the BUR-GEN has a crest factor (ra-tio of peak to rms) of 4:1 (12 dB). Since a sine-wave has a crest factor of 1.414:1 (3 dB), the rmsvalue of the PSEUDO noise waveform at any givenAMPLITUDE setting will be 9 dB less than that ofa sinewave at the same AMPLITUDE. In the RAN-DOM noise mode, amplitude calibration is to ap-proximately the same rms value as in PSEUDOmode. The result is that in RANDOM noise mode,occasional noise peaks may exceed the peak-to-peakvalue of a sinewave of the same AMPLITUDE.While the theoretical crest factor in RANDOMmode is infinite, a 4:1 crest factor will be exceededonly 0.01% of the time. The maximum availableAMPLITUDE setting in the noise modes is half thatof the sinewave modes.
In either PSEUDO or RANDOM mode, addi-tional selections of the noise spectral distributionmay be made among WHITE, PINK, BPASS, andEQBPN.
20.3.2. White Noise
WHITE selects white noise mode. This mode isbandwidth limited to 22 kHz to maximize the noiseenergy falling within the audio band. The spectraldistribution of white noise is characterized by equalnoise energy per Hz of bandwidth. The spectral
BURST-SQUAREWAVE-NOISE GENERATOR 20-5

range between 100 Hz and 200 Hz will thus havethe same energy as the range between 10,000 Hzand 10,100 Hz. If analyzed by a constant band-width spectrum analyzer such as a superheterodyneor FFT analyzer, white noise will show a flat energycharacteristic versus frequency (up to the bandwidthlimitation). Analysis with a constant-percentage-bandwidth (constant Q) filter such as System One’sbandpass mode or most real-time analyzers willshow a rising characteristic versus frequency, at therate of 3 dB per octave.
20.3.3. Pink Noise
PINK selects pink noise mode. Pink noise ischaracterized by equal noise energy per fractional oc-tave, fractional decade, or equal percentage band-width. Thus, the octave of pink noise between 5kHz and 10 kHz will contain the same energy as theoctave between 300 Hz and 600 Hz. A constant-per-centage-bandwidth analyzer such as System One’sbandpass mode and most real-time audio analyzerswill show a flat characteristic with frequency. Aconstant bandwidth spectrum analyzer such as a su-perheterodyne or FFT analyzer will display pinknoise as having a fall-off with increasing frequency,at the rate of 3 dB per octave. The BUR-GEN’spink noise is generated by filtering the basic whitenoise source through a 3 dB per octave filter. Pinknoise will sound subjectively flat to the ear becausethe sounds are perceived on a constant bandwidth ba-sis. When checking response of devices such asmultiway loudspeaker systems, pink noise will sup-ply more equal levels to low, midrange, and high fre-quency drivers than will white noise.
20.3.4. Bandpass Noise
BPASS mode selects the pink noise mode, butfurther processes the noise by passing it through a1/3 octave tunable bandpass filter whose center fre-quency is controlled by the FREQUENCY field ofthe GENERATOR panel. This filter is, in fact, thebasic state-variable oscillator circuit of generator,used as a bandpass filter. The filter center fre-quency can thus be tuned from 10 Hz to 204 kHz.The center frequency can be controlled in Panel
mode from the GEN FREQUENCY field or by useof <+> and <Del> keys in conjunction with theFREQSTEP value, in bargraph mode by the arrowkeys, mouse, or <+> and <Del> keys, and can beswept as GEN FREQ at either SOURCE-1 orSOURCE-2 on the sweep test definitions panel.Units may be Hz and kHz or any of the generatorrelative frequency units.
20.3.5. Equalized Bandpass Noise
EQBPN stands for equalized bandpass noise.EQBPN furnishes 1/3 octave bandpass-filtered pinknoise, as described above under BPASS. EQBPNdiffers from BPASS in that, if an equalization file(xx.EQ) has been attached to the current test file bythe NAMES GEN-EQ command and EQBPN modeis selected, the amplitude of the generator will befurther modified by the value (interpolated if neces-sary) from the equalization file at the current fre-quency value. The narrowband noise vs frequencyrelationship can thus be made to follow any desiredcharacteristic. The value after the equalization com-putation is displayed in the POST-EQ field of theGENERATOR panel. EQBPN mode is effectiveduring Panel mode with numeric entry into the FRE-QUENCY field or by FREQSTEP control, in bar-graph mode with mouse, arrow key, or <+> and<Del> control, and in swept operation of SystemOne. See the EQUALIZATION chapter of this man-ual for more details on how to create, modify, andattach xx.EQ files to tests.
20.3.6. USASI Noise
A specific spectral distribution of noise has beendefined by the United States of America StandardsInstitute (USASI). This noise distribution consistsof white noise filtered to peak at approximately 200Hz, with 6 dB per octave falloff below 100 Hz andabove 320 Hz. This shape was chosen to simulatelong-term average spectra of typical audio programmaterial.
USASI noise can be generated by the BUR-GENmodule by loading an overlay called USASI.OVLfrom the Tests and Utilities diskette. This overlay
20-6 Audio Precision System One User's Manual

file may be loaded onto a test file which has alreadyset up the desired amplitude, output configuration,etc. The generator conditions may also be changedas desired for the specific application after loadingthe overlay. Since these parameters are blanked inthe .OVL file, <Alt>R (restore) may be used tomake them visible after the file is loaded.
USASI noise pulsed between two amplitudes caneven more fully simulate program material. PulsingUSASI noise at a 2.5 Hz repetition rate with a12.5% duty cycle with a LOW LVL of -20 dB hasbeen selected as a standard test signal. This signalis used, along with RF spectrum analyzer measure-ments, to determine the occupied bandwidth ofbroadcast stations while signal processing devicesand filters are adjusted. To obtain this pulsedUSASI noise, load the overlay B_USASI.OVL fromthe Tests and Utilities diskette and make any addi-tional adjustments required.
BURST-SQUAREWAVE-NOISE GENERATOR 20-7

20-8 Audio Precision System One User's Manual

21. DCX-127 DC AND DIGITAL I/O MODULE
The DCX-127 is a versatile dc and digital input-output device for use with System One or inde-pendently. It measures dc voltage and resistanceand acquires a parallel digital input word of up to 21bits plus sign. It provides two controllable dc volt-age outputs in the range between10.5000 Volts,and a digital output word of 21 bits plus sign. TheDCX-127 also features three rear-panel 8-bit outputports for control of external logic or relays, a front-panel program control output connector with anumber of signals synchronized with sweeps andtests, and a front-panel program control input to sup-port custom, limited-function keyboards. The frontpanel of the DCX-127 is normally located at the cen-ter of the second page of System One screens, ob-tained from the menu by the <Esc> <P> <PgDn>keystroke sequence. The DCX-127 software controlpanel is reproduced as Figure 21-1.
21.1. Voltage and ResistanceMeasurements
The DCX-127 includes a 4 1/2 digit autorangingdc voltmeter-ohmmeter. Measurements are dis-played digitally on the DCX panel, on the DMMline; on monitors with intensity control, these digitswill be brighter. The voltage or resistance measure-ments may also be selected as DATA-1 or DATA-2values on the SWEEP (F9) DEFINITIONS panel.Thus measurements can become lines on a graph,columns in a tabular data display, or viewed in ana-log fashion in bargraph <F2> mode. As with anyother System One measurement, limits files for dcvoltage or resistance may be created and connectedto a test, with measurements then compared to thelimits. See the ACCEPTANCE TEST LIMITSchapter for more details.
Figure 21-1 DCX-127 Control Panel
21-1

21.1.1. Dc Voltage Measurements
Dc voltage mode is selected by either the Vdc orf(V) selections on the DMM (digital multi-meter)line of the DCX panel. Vdc provides a direct read-out in voltage; f(V) further processes the measure-ment with the offset and scale factors on the nexttwo lines before display.
In voltage mode, the meter will automatically se-lect among its 200 mV, 2 V, 20 V, 200 V, or 500 Vranges for best resolution of the measured signal.Resolution versus range and reading rate are shownin Figure 21-2.
If autoranging is not desired, the AUTO fieldmay be changed to FIX. The adjacent field willthen display the currently-selected range. Anotherrange may be selected by typing in the highest ex-pected reading; the system will automatically selectthe compatible range.
Reading rates of 6/second or 25/second are select-able on the RATE line. The 6/second selection pro-vides the full 4 1/2 digit resolution (20000 countsfull scale). The 25/second selection will still display4 1/2 digits, but the last digit will always be either a0 or a 5. Normal and common mode rejection willalso degrade by approximately a factor of four whenthe 25/second reading rate is selected.
21.1.2. Resistance Measurements
The DCX-127 DMM also functions as a resis-tance-measuring device by selecting the OHMS orf(Ω) functions on the DMM line. OHMS providesdirect readout of resistance in Ohms, while f(Ω) is acomputed value using the offset and scale parame-ters underneath the DMM line.
The resistance mode operates by forcing a cali-brated value of current through the unknown resis-tance and measuring the consequent voltage drop.
The DCX-127 input configuration permits mak-ing these resistance measurements on either a 2-wireor 4-wire basis. If only one pair of test leads isused, connected from the (+) and (-) terminals of theDCX-127 to the unknown resistance, a 2-wire meas-urement results. Current from the internal currentsource flows through a internal resistor, the testleads and resistance being measured, and another in-ternal resistor back to the current source. The twointernal resistors are indicated schematically on thefront panel of the DCX-127. Voltage drop pro-duced by this current is internally measured at the(+) and (-) terminals. The resistance of the two testleads is thus included in the measurement. For mod-erate and high values of unknown resistance, the ad-ditional error introduced by resistance of the testleads is usually negligible.
For the highest accuracy when measuring low val-ues of resistance, a 4-wire measurement (Kelvinlead connection) is recommended. For this measure-ment, one pair of test leads is connected from thetwo current source connectors (marked SOURCE) tothe unknown resistance. A second pair of test leadsis connected from the voltmeter input terminals (+and - jacks) to the unknown. Current from the cur-rent source now does not flow through the voltmeterleads, so the resistance of the test leads is not in-cluded in the measurement.
21.1.3. Offset and Scaling
Both voltage and resistance measurements mayhave any desired offset and scaling factor applied be-fore the result is displayed. This mode is obtained
RESOLUTION RESOLUTIONRANGE 6/sec RATE 25/sec RATE
——- ————— —————200 mV 10 uV 50 uV
2 V 100 uV 500 uV20 V 1 mV 5 mV
200 V 10 mV 50 mV500 V 100 mV 500 mV
Figure 21-2 Range & Resolution vs Rate
21-2 Audio Precision System One User's Manual

for voltage measurements by selecting f(V) ratherthan Vdc, and for resistance measurements by select-ing f(Ω) rather than OHMS. This feature permitsdisplay in other units such as temperature, ratherthan directly in the electrical unit, when the outputof a transducer is being measured.
When f(V) or f(Ω) is selected, the value enteredon the OFFSET line immediately below the DMMline on the DCX panel is first added to the actualmeasurement. The resulting number is then multi-plied by the SCALE value on the next line, with thefinal resulting computation displayed on the DMMline. Thus, in f(V) or f(Ω) modes:
display = (measurement + OFFSET) * SCALE
21.2. DC Voltage Outputs
Two independent dc voltage outputs are availableat the DCX-127 front panel. Each may be set with20 microvolt resolution to any voltage in the10.5000 Volt range.
The dc output values may be directly controlledfrom the DCX panel by entering the desired numberin the DC OUT 1 or DC OUT 2 fields. Either DCOUT 1 or DC OUT 2 may also be selected asSOURCE-1 or SOURCE-2 on the SWEEP (F9)DEFINITIONS panel. Thus, either dc output maybe swept in a test and will form the independentvariable calibration on the x axis, either output maybe varied via mouse or arrow keys in bargraphmode, and either dc output may be used in nestedsweep fashion with other sweepable parameters suchas generator frequency or amplitude.
Example applications of the dc outputs includesweep control of the gain, offset, or both ports ofvoltage-controlled amplifiers (VCAs) while measur-ing their gain, distortion, or noise and plotting thosevalues versus control voltage. The dc output couldalso be used to control the position of a dc-control-led turntable while measuring polar response pat-terns of a loudspeaker or microphone. Manually op-erated test equipment with a dc control port (such asthe VCF input of a function generator) may be con-trolled by the dc outputs. Tape machines with dc-controllable bias oscillators may be connected, ena-bling MOL, SOL, sensitivity, and other data to betaken automatically.
The dc outputs may be floated up to 2 Voltsaway from ground. See Figure 21-3 for the equiva-lent output circuit of both dc outputs. The maxi-mum current which may be drawn from them is 20milliamperes. When OFF is selected rather thanVdc on the DCX-127 control panel, the dc outputbecomes an open circuit.
21.3. Digital Input
A parallel digital word of up to 21 bits plus signbit, at LSTTL-compatible levels, may be connectedto the digital input connector of the DCX-127. Thevalue of this word is displayed on the DCX panel atthe DIGITAL IN line. The data may be displayedin DECimal or HEXadecimal representations, or thedecimal value may be multiplied by the SCALEvalue on the next line and displayed in g(x) mode.In addition to display on the DCX panel, DCXDIGIN may be selected at DATA-1 or DATA-2 on
≈50Ω ≤2Vpk
Vout
Figure 21-3 Equivalent Output Circuit, DC Outputs
DCX-127 DC AND DIGITAL I/O MODULE 21-3

the SWEEP (F9) DEFINITIONS panel to producegraphs, tabular displays, and bargraphs. Limit filesmay be created for the DIGIN parameter and con-nected to a test for automatic comparisons of meas-urements to limits. See the ACCEPTANCE TESTLIMITS chapter beginning on page 24-1 for moredetails.
This digital word reading capability is compatiblewith data in either two’s complement format (binaryplus a sign bit) or in 8-4-2-1 binary coded decimal(BCD) format, selected by the 2sC (two’s comple-ment) or BCD choices on the same line as theSCALE value. The relationship between digital in-put connector pin number and data in either of theseformats is shown in Figure 21-4.
The RATE line permits selection of four softwaresampling rates of the data presented to the connec-tor, or selection of EXTERNal. EXTERNal modewill be used for data presented along with a “datagood” pulse or “conversion completed” pulse. Inthis mode, the data at the input connector will besampled and displayed on each positive-going edgeat the strobe line (pin 25) of the connector. Themaximum sampling rate is approximately 30 read-ings per second with an 8088-based computer and150 readings per second with an 80286-based com-puter..
One application of the digital input capability isstatic (dc) linearity testing of analog-to-digital con-verters. Stimulus to the converter would be fromone of the dc outputs. A typical test would use theDCX DCOUT1 or DCOUT2 as SOURCE-1 (graphhorizontal axis) and DCX DIGIN as DATA-1(graph vertical axis). Another application of digitalinput is to connect a parallel output digital measure-ment device such as a capacitance meter or high-resolution dc meter to System One. The digital in-put would also permit connection of a SMPTE timecode reader to allow tracking of tape position duringtiming.
21.4. Digital Output
An LSTTL-compatible parallel digital outputword of up to 21 bits plus sign may be created atthe digital output connector. The value of this wordmay be entered in DECimal or HEXadecimal repre-sentations, or h(x) may be selected and the enteredvalue will be divided by the SCALE value on thefollowing line before it controls the output word andthe DIGITAL OUT display.
With HEXadecimal representation selected andthe values a through f (decimal 10 through 15) de-sired, a leading 0 (zero) must be entered since thesystem will not accept a leading alphabetic characterin a numeric entry field.
When DECimal or HEXadecimal representationis selected, it is also possible to enter data from thekeyboard in octal representation by using the alpha-betic character “o” (not zero) after the digits. For
CONN. FUNCTION FUNCTIONPIN 2sC MODE BCD Mode
—— ———— ————1 ground ground2 bit 0 (lsb) LS digit 13 bit 1 LS digit 24 bit 2 LS digit 45 bit 3 LS digit 86 bit 4 5th digit 17 bit 5 5th digit 28 bit 6 5th digit 49 bit 7 5th digit 8
10 bit 8 4th digit 111 bit 9 4th digit 212 bit 10 4th digit 413 ground ground14 bit 11 4th digit 815 bit 12 3rd digit 116 bit 13 3rd digit 217 bit 14 3rd digit 418 bit 15 3rd digit 819 bit 16 2nd digit 120 bit 17 2nd digit 221 bit 18 2nd digit 422 bit 19 2nd digit 823 bit 20 (msb) MS digit 124 sign sign25 strobe strobe
Figure 21-4 Pin Assignments, Digital I/O
21-4 Audio Precision System One User's Manual

example, entering 10o will result in a display of 8DECimal (8 HEXadecimal), entering 12o will resultin 10 DECimal (a HEXadecimal), and entering 22owill result in a display of 18 DECimal (12 HEXa-decimal). In DECimal representation, hexadecimaldata may be entered by using the character “x” afterthe digits. Thus, 10x will produce a 16 DECimal ac-tion.
The format of the word presented at the connec-tor (bit-to-pin relationship) may be selected as 2sC(two’s complement) or BCD (8-4-2-1 binary codeddecimal) on the same line with DIGITAL OUTSCALE. The pin connections are identical to thedigital input connector, shown in 21-4. The strobeline (pin 25) will be pulsed low each time a newvalue is entered from the DCX panel or in a sweep.
In addition to direct entry on the DCX panel, theDIGITAL OUT word may be selected as DCXDIGOUT at the SOURCE-1 or SOURCE-2 fieldson the SWEEP (F9) DEFINITIONS panel. The out-put word may then be swept as the independent vari-able (horizontal axis of a graph or first column of atable), may be operated in nested sweep fashionwith another sweepable parameter, or may be con-trolled in quasi-analog fashion from the arrow keysor mouse in bargraph mode.
A typical application of digital output is in static(dc) linearity testing of digital-to-analog converters.The digital output word drives the converter; the ana-log output of the converter is measured with theDCX-127 DMM. With DCX DIGOUT selected asSOURCE-1 and DCX DMM selected as DATA-1, agraph of linearity will result. For high-resolutionconverters at output voltages more than200 mVaway from zero, it will be desirable to use one ofthe DCX-127 dc outputs in conjunction with theDMM input in differential voltmeter fashion so thatthe DMM can be on its highest resolution range.
Another application of the digital output is con-trol of digitally-controllable turntables during polarresponse testing of microphones and loudspeakers.Still another application is in testing multiplyingdigital-to-analog converters (MDACs) used as vari-able resistors, attenuators, or in other audio applica-tions.
Each bit output has a five milliampere currentdrive capability and 390 Ohms output impedance.
21.5. Program Control Input
The program control input capability is designedprincipally for production test applications where itmay be best for test station operators to not have ac-cess to a full PC keyboard. Up to eight pushbut-tons, foot switches, or other types of momentary con-tacts to ground can be wired to this connector. Clo-sure of a contact will cause a stored keystroke se-quence to be “re-played”. The keystroke sequenceassociated with each connector pin is created in theEdit Macro mode, and a set of definitions of the se-quences for one or more pins is saved to disk orloaded from disk with the Save Macro and LoadMacro commands. Thus, a given set of switchesmay have their functions re-defined as desired fordifferent applications.
Macros may be typed directly into the Macro edi-tor, may be “learned” into the Procedure editor inUtil Learn mode and then copied into the Macro edi-tor with the <Alt><F6> and <F5> keys, or a combi-nation of the two methods. The Util Learn and
Figure 21-5 Example Macro Editor for Three Proce-dures
Figure 21-6 Example Macro Editor for Normal MenuControl from Limited Keyboard
DCX-127 DC AND DIGITAL I/O MODULE 21-5

copy technique is required if any of the desired key-strokes cannot be directly generated during Editmode. Examples include the arrow keys,<Ctrl><Home> key, etc. See the Edit Macro sec-tion of the MENUS chapter for full information onthe required formats for macros.
One possible use of the Program Control Inputand macro capability is to directly load and run spe-cific procedures at a single keystroke. This mightbe typical at a production test station where a rela-tively small number (eight or fewer) of proceduresneed to be selected among at a given time. In thismode, it may not even be necessary for a monitor tobe connected to the computer. Different sets of pro-cedures could be exchanged by loading differentmacros and perhaps changing an overlay card whichlabels the key switches connected to the ProgramControl Input connector. Figure 21-5 is an exam-ple of a macro file for such an approach.
Another possible use of the Program Control In-put is to permit the operator to use the normal menuselection capability of System One software withoutany possible intimidation or confusion factors due toa full computer keyboard. This can be accom-plished by defining the user-added switches as thefour arrow keys, the <+> key to move among the se-lections on the menu line, the <Enter> and <Esc>keys, and the <F1> key to abort procedures and turnoff the generator. The operator may then selectamong any previously-prepared tests and proceduresin the current directory and may run the tests, butcannot change directories or make alphabetic or nu-meric input. See Figure 21-6 for an example ofsuch a macro file.
21.6. Program Control Outputs
The Program Control Output connector providessix pulse or gate signals controlled by various ac-tions of System One software. The pin assignmentsare shown in Figure 21-7. All lines are LSTTL com-patible.
The Reset output, pin 2, pulses high when theDCX-127 power is turned on and whenever a UtilRestore menu command is executed. The Reset out-
put would typically be used to normalize the condi-tion of external logic devices connected to a SystemOne test station at power up. It may also be in-voked in a procedure by inserting a Util Restorecommand into the procedure.
The Data Acquired output, pin 3, pulses higheach time that a set of data satisfies the settling algo-rithm. See the Sweep Settling section of theSWEEP (F9) DEFINITIONS PANEL chapter forfull details on the settling algorithm. This signalcould be used, for example, to cause a CompactDisc player to automatically advance to the nexttrack whenever a successful set of measurements iscompleted on the preceding track. This is usefulduring an EXTERNal FREQuency or EXTERNalAMPLitude test across a series of tracks of a testdisc.
The Trigger output, pin 4, pulses high at the endof each DELAY portion of the settling process.SETTLING DELAY, in a generator-based sweep, isthe time after the generator steps to a new value be-fore the software starts examining data samples tosee if they are settled. This signal could be viewedon a dual-trace oscilloscope along with the signal be-ing measured, to verify that the DELAY has beenoptimally set to discard “left over” data from the pre-vious generator step when measuring systems suchas 3-head tape recorders or satellite paths whichhave significant time delays. The Trigger output ofthe DCX-127 could also be connected to the TRIG-GER/GATE input of the generator when the BUR-
CONNECTOR PIN FUNCTION——————- ————
1 Delayed Sweep Gate2 Reset3 Data Acquired4 Trigger5 Undefined6 Sweep Gate7 Channel A/B8 Ground9 Ground
Figure 21-7 Program Control Output Connector
21-6 Audio Precision System One User's Manual

GEN module is present. This will synchronize tonebursts in the SINE TRIG mode with the system’sreadiness to make a measurement. The Trigger out-put could also be used to strobe an external devicebeing tested, such as an analog-to-digital converter.This will help insure that the source is stable beforethe conversion takes place.
The Sweep Gate output, pin 6, drips low at thebeginning of a sweep test and goes high at the com-pletion of a test. In a nested sweep, it will go highmomentarily at the end of each SOURCE-1 sweepand drop low again for the next SOURCE-1 sweepafter the SOURCE-2 parameter is incremented. Oneexample application of the Sweep Gate output is intesting of the attack characteristics of compressors,limiters, and similar audio processors. With theSweep Gate connected to the TRIGGER/GATE in-put of the generator when the BUR-GEN module ispresent and the SINE GATE mode is selected, timezero on a time sweep graph and the start of the sig-nal will be synchronized.
The Channel A/B output, pin 7, goes low when-ever analog analyzer input channel A is selected andhigh whenever input channel B is selected. Thelevel at this pin thus indicates which channel is be-ing measured during a STEREO sweep.
The Delay Gate output, pin 1, is similar to theSweep Gate signal but with the addition of a user-settable delay time between the actual beginning ofa sweep test and the leading edge of the gate outputsignal. This delay time is entered at the bottom ofthe DCX software panel, in the GATE DELAYfield.
An example application is power amplifier turn-on and turn-off transient (“thump”) testing. The am-plifier power could be turned on by the sweep gateand off by the delayed gate. The output of the am-plifier may be measured during a time sweep. To al-low correct capture of transients, the LEVEL metershould be used along with a fixed input range.
Another example application is to start a tape ma-chine or turntable for run-up time testing. The basicmeasurement technique is to perform a time sweepwhile measuring frequency from a pre-recorded tape
or disc. Use of the Delayed Sweep Gate to start therecorder or turntable permits System One to drawthe graph when <F9> is pressed, start the timesweep, and then start the machine at a predeter-mined time into the sweep when the software isready to take continuous, rapid measurements.
21.7. Digital Control Output Ports
Three rear-panel 9-pin connectors are providedon the DCX-127 for control of external devices.These output ports are intended for direct interfaceto LSTTL circuitry, or via LSTTL-compatible driv-ers to relays. Control of power, lights, annunciators,etc., are among the possible applications. The pinconnections of these ports are shown in Figure 21-8.The current drive capability of each bit line is fivemilliamperes; the output impedance is 390 Ohms.
An 8-bit parallel word at each of these connectorsmay be controlled in either of two fashions. Onecontrol method is via entry of a number into thePORT OUT fields near the bottom of the DCXpanel. The second method is via the UTIL OUTmenu command.
The PORT OUT A, B, and C fields refer to theconnectors labeled A, B, and C on the DCX-127rear panel. Numbers may be entered into thesefields in either DECimal, HEXadecimal, or OCTalrepresentations. Any numbers in these fields whena .TST or .OVL file is saved will be reloaded andthus will control the port conditions when that test
CONNECTOR PIN FUNCTION——————- ————1 bit 7 (msb)2 bit 63 bit 54 bit 45 bit 36 bit 27 bit 18 bit 0 (lsb)9 ground
Figure 21-8 Digital Control Outputs A, B, C
DCX-127 DC AND DIGITAL I/O MODULE 21-7

or overlay file is next loaded. DCX panel control ofthe ports will thus normally be used when a specificexternal condition is to be set up for a specific test.When only a small number of lines are to be control-led, individual pins can be treated as independentlines. OCTal representation of the data may be sim-plest in this case, since each octal digit can be men-tally decoded to a three-bit binary word with eachbit representing a control line. For complex controlsituations, external decoding can be used to obtainup to 256 logic states from each 8-bit port. In sucha case, the DECimal or HEXadecimal repre-sentations may be preferred.
The alternate method of controlling ports A, B,and C is with the UTIL OUT menu command. TheUTIL OUT command, in general, permits writingany data word to any address of an IBM-compatiblepersonal computer. The DCX-127 A, B, and Cports are three special cases of address. Only deci-mal representation is acceptable in the UTIL OUTcommand. Thus, to set the least significant andmost significant bits high at port B, the menu com-mand would be:
UTIL OUT B,129 <Enter>
The Util Out method is useful for controllingPass/Fail lamps in a procedure since the commandmay be placed inside an IF ERROR[ or IF NOTER-ROR[ command.
21-8 Audio Precision System One User's Manual

22. REMOTE MODE FOR TRANSMISSION TESTINGAND LAPTOP COMPUTER OPERATION
22.1. Introduction
In normal operation of System One, control com-mands and measurement data flow back and forthbetween S1.EXE software and the System One hard-ware via a PCI interface card plugged into a com-puter expansion slot. The REMOTE mode ofS1.EXE software instead functions by re-directingportions of the control and data flow between com-puter and instruments to an alternate serial communi-cations (RS-232) path. REMOTE mode was devel-oped for two types of applications:
• measuring audio transmission links where theaudio input and output are at different physi-cal locations (“split site”), as in typical broad-casting, satellite, and microwave operation
• to permit the use of a System One “S” (serialinterface) version with a laptop or notebookcomputer which does not have expansion slotsfor a PCI interface card.
REMOTE operation involves the REMOTE-LO-CAL choice in the top borders of several panels, theRun Remote, Run Local, and Run Slave menu com-mands, the DOS MODE command, and several com-mand line options used when starting S1.EXE soft-ware. When LOCAL is selected at the top of theGENERATOR, ANALYZER, DCX-127,SWITCHER, or DSP panels, S1.EXE software ex-pects to find that particular device connected to aPCI interface card plugged into the computer.When S1.EXE has been started with the proper com-mand line options, the Run Remote menu commandhas been executed, and REMOTE is selected on any(or all) of those panels, S1.EXE attempts to commu-nicate with the selected device(s) via the computer’sserial port. A computer (typically laptop or note-book) may thus control a nearby serial interface ver-sion System One by a direct RS-232 cable. For dis-tant location of the RS-232-controlled System One,modems and a data communications link may inter-
connect the controlling computer’s serial port witheither a distant serial interface System One, or withthe serial port of a distant computer which is alsoconnected via PCI card to a System One locatednearby.
A distant System One and SWR-122 switchers,even at an unstaffed repeater or remote transmitterlocation, can be operated via modems and a datacommunications link from another computer at anypoint. With SWR-122P insertion type switchers, sig-nal can be monitored at many points at the repeateror transmitter without interrupting normal programflow. Additionally, an engineer at the control pointcan break normal signal paths to inject test signalsfrom the System One at that location or measure un-loaded output of a device.
22.2. System Architecture, Testingat Two Locations with TwoComputers and “A” Version Systems
The system diagram for two computers, “A” ver-sion System Ones, and data communications equip-ment is shown in Figure 22-1. The digital interfacecabling between the PCI card installed in the com-puter and the System One at the same physical loca-tion is identical to normal, local operation. If SWR-122 switchers are used at either end, their control ca-bles are also connected to the Audio Precision Inter-face Bus.
Both computers must have serial (RS-232) com-munications ports. For remote operation at moder-ate distances within a facility (up to approximately300 meters), a direct RS-232 cable connection canbe made between the computers with no modems re-quired. Larger separations will involve a data com-munications line and modems. The serial port ofeach computer then connects to a modem. The two
22-1

modems connect to a data communications link,such as a dial-up telephone line or dedicated datacomm link, between the locations.
The slave computer software must be in RunSlave mode. The computer at the master end of theRS-232 link can then select the Run Remote menucommand and select REMOTE operation in the topborder of the GENERATOR, ANALYZER, DSP, orSWITCHER panels, or any combination of them.The operator at the master unit has control over theselected generator, analyzer, DSP, or switcher hard-ware at either end of the system. Settings such asimpedances, frequencies, filters, detectors, etc., atthe selected generator or analyzer are controlledfrom the master computer in identical fashionwhether local or at a great distance. Measurementsmade by the selected analyzer or DSP unit, even ifthousands of miles away, will appear on the mastercontrol computer screen in PANEL, bargraph, orgraphic modes. Data can be stored at the master lo-cation. If the link is bidirectional, master and slaveroles can be interchanged to test the audio transmis-sion link in either direction by pressing any key atthe slave unit to put it into normal mode and then se-lecting Run Remote. At the former master unit,press <Esc> Run Slave to place it into slave mode.
22.3. System Architecture, Testingat Two Locations with “S” VersionSystem
If one location will never be the control point, an“S” version System One can be used with no com-puter required at that location, as shown in Figure22-2. The modem then connects directly to the RS-232 connector on the rear of the “S” version system.Any SWR-122 switchers at that remote location con-nect to the APIB connector on the rear of the “S”version unit. The “S” version then convertsswitcher control commands from RS-232 protocol tonormal APIB functions in order to control theswitchers. Any SWR-122 switchers used at the mas-ter control point are connected to the APIB runningbetween computer and “A” version system.
The computer at the master end of the RS-232link can then select the Run Remote menu com-mand and exercise control over part or all of the “S”version system, which is effectively always in “RunSlave” mode when operating from RS-232. Themaster unit can select REMOTE operation in the topborder of the GENERATOR, ANALYZER, DSP, orSWITCHER panels, or any combination of them.The operator at the master unit then has control overthe selected generator, analyzer, DSP, or switcherhardware at either end of the system. Settings such
MODEMDATACOMMLINK
APIB
RS-232
AUDIO TRANS-MISSION LINK
MODEM
RS-232
APIB
Figure 22-1 Block Diagram, Remote Testing of Transmission Link with Two Computers, Two Modems, and Two“A” Version Systems
22-2 Audio Precision System One User's Manual

as impedances, frequencies, filters, detectors, etc., atthe selected generator or analyzer are controlledfrom the master computer in identical fashionwhether local or at a great distance. Measurementsmade by the selected analyzer or DSP unit, even ifthousands of miles away, will appear on the mastercontrol computer screen in PANEL, bargraph, orgraphic modes.
22.4. System Architecture,Laptop/Notebook Computers
Laptop and notebook computers without expan-sion slots for a PCI interface card can control a Sys-tem One “S” version via RS-232. Figure 22-3shows the interconnection between a computer withno expansion slot and an “S” version System One.The RS-232 port on the computer connects directlyto the RS-232 port on the serial version SystemOne, using a “null modem” cable. Null modem ca-bles or adapters can be purchased at most computerstores. No modems are required in this architecture.Switches on the rear of the “S” version select baudrate and other communications-related parameters.
22.5. Master and Slave; GeneralConcepts
With computers at both ends, the System One atthe distant (remotely controlled) location is placedinto slave mode by the Run Slave command ofS1.EXE software. An “S” version System One is al-ways effectively in slave mode when the rear panelAPIB/RS-232 switch is set to RS-232. The master
AUDIO TRANS-MISSION LINK
MODEM MODEM
RS-232
RS-232
DATACOMMLINK
APIB
Figure 22-2 Block Diagram, Remote Testing of Transmission Link with “S” Version System One at Remote Loca-tion
RS-232NULL
MODEMCABLE
RS-232 CONNECTOR
Figure 22-3 Block Diagram, Laptop Computer with“S” Version System One
REMOTE AND LAPTOP OPERATION 22-3

mode at the controlling unit is selected by the RunRemote command. A sophisticated packeted datatransmission scheme is used between the two endsof the link, featuring error detection and correctionby re-transmission of faulty packets. Both masterand slave send data to the other unit in packets, us-ing a 16-bit CRCC (cyclic redundancy check code)for error detection.
When the master sends new settings instructionsto the slave, the slave unit checks each packet for er-rors and either acknowledges correct reception or re-quests that the packet be re-sent. If the master unitdoes not receive acknowledgement within the com-munications time-out interval, it assumes the packetwas lost and re-sends it.
When the master requests measurements datafrom the slave (assuming the slave unit analyzer isenabled), the slave sends the data as a packet. Themaster checks the packet for errors and requests a re-transmission if errors are found. If the requesteddata is not received within the communications time-out interval, the master makes another request.
At 300 baud rates, the communications time-outmust be set to four seconds because of additional de-lays involved in 300 baud transmission. The /Tcommand line option is used at System One soft-ware loading to set the communications time-out toany value other than one second. See the commandline options section on page 22-12 for more details.
22.6. Control Computer Operation
In all three of these architectures, operation of thecontrolling computer is similar or identical. Theseare the key operational points for the controllingcomputer:
a. S1.EXE software must be started with eitherthe /C1 (to select the COM1 port) or /C2 (COM2port) option. The /An and /Tn options may also bedesirable; see the “Command Line Options” sectionon page 22-12 for information on them.
b. REMOTE must be selected in the top borderof one or more of the GENERATOR, ANALYZER,SWITCHER, DCX-127, and DSP panels. TheANALYZER, DSP, and DCX-127 are mutually de-pendent and must all be either REMOTE or LO-CAL; when any one of these is switched betweenREMOTE and LOCAL or vice-versa, all areswitched together. For laptop computer operation ofan “S” version system, REMOTE will be selected inall these panels. For “split site” testing of audiotransmission links, REMOTE will be selected in thepanels of the instrument modules which will be usedat the distant location and LOCAL will be selectedfor the instrument modules which will be in use atthe control location.
c. The Run Remote menu command must be exe-cuted.
22.7. Remote System Operation
The controlled unit hardware and software func-tions differently for each of the three architectures.
1. For operation from a laptop or notebook com-puter with no PCI card, an “S” version System Oneis required. This unit operates in its RS-232 inter-face mode, typically at a fast baud rate such as 9600or 19200. No modems are required. See the “Lap-top Computers with S-Version Systems” section be-low for full details.
2. For audio transmission link testing with nocomputer at the distant point, an “S” version SystemOne and a Hayes Smartmodem-compatible modemare required. The S-version system operates in itsRS-232 interface mode at the baud rate which themodem and data communications link can support.Often, the S-version system operates in Auto An-swer mode so that it and the modem can answerwhenever the modem is called from a controllingcomputer and modem. See the “Transmission Test-ing with S-Version System” section on page 22-6for full details.
3. For audio transmission link testing with com-puters at both ends, modems are also required atboth ends. The modems in this case need not be
22-4 Audio Precision System One User's Manual
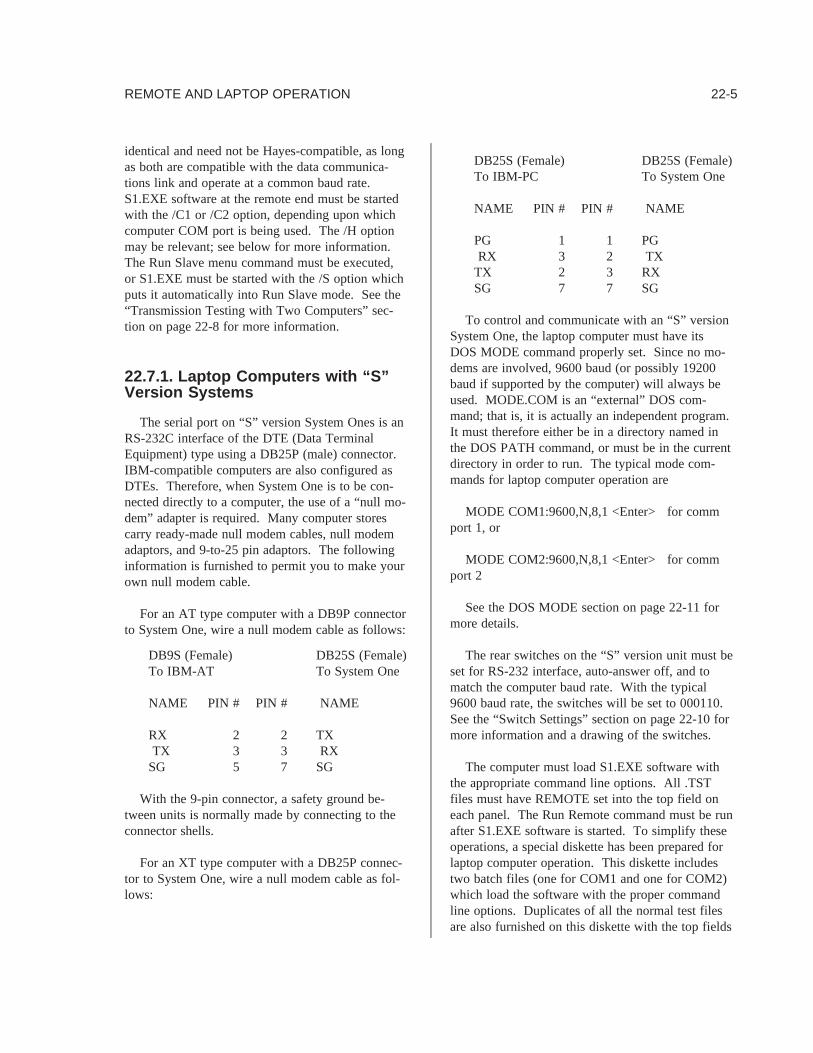
identical and need not be Hayes-compatible, as longas both are compatible with the data communica-tions link and operate at a common baud rate.S1.EXE software at the remote end must be startedwith the /C1 or /C2 option, depending upon whichcomputer COM port is being used. The /H optionmay be relevant; see below for more information.The Run Slave menu command must be executed,or S1.EXE must be started with the /S option whichputs it automatically into Run Slave mode. See the“Transmission Testing with Two Computers” sec-tion on page 22-8 for more information.
22.7.1. Laptop Computers with “S”Version Systems
The serial port on “S” version System Ones is anRS-232C interface of the DTE (Data TerminalEquipment) type using a DB25P (male) connector.IBM-compatible computers are also configured asDTEs. Therefore, when System One is to be con-nected directly to a computer, the use of a “null mo-dem” adapter is required. Many computer storescarry ready-made null modem cables, null modemadaptors, and 9-to-25 pin adaptors. The followinginformation is furnished to permit you to make yourown null modem cable.
For an AT type computer with a DB9P connectorto System One, wire a null modem cable as follows:
DB9S (Female) DB25S (Female)To IBM-AT To System One
NAME PIN # PIN # NAME
RX 2 2 TXTX 3 3 RX
SG 5 7 SG
With the 9-pin connector, a safety ground be-tween units is normally made by connecting to theconnector shells.
For an XT type computer with a DB25P connec-tor to System One, wire a null modem cable as fol-lows:
DB25S (Female) DB25S (Female)To IBM-PC To System One
NAME PIN # PIN # NAME
PG 1 1 PGRX 3 2 TX
TX 2 3 RXSG 7 7 SG
To control and communicate with an “S” versionSystem One, the laptop computer must have itsDOS MODE command properly set. Since no mo-dems are involved, 9600 baud (or possibly 19200baud if supported by the computer) will always beused. MODE.COM is an “external” DOS com-mand; that is, it is actually an independent program.It must therefore either be in a directory named inthe DOS PATH command, or must be in the currentdirectory in order to run. The typical mode com-mands for laptop computer operation are
MODE COM1:9600,N,8,1 <Enter> for commport 1, or
MODE COM2:9600,N,8,1 <Enter> for commport 2
See the DOS MODE section on page 22-11 formore details.
The rear switches on the “S” version unit must beset for RS-232 interface, auto-answer off, and tomatch the computer baud rate. With the typical9600 baud rate, the switches will be set to 000110.See the “Switch Settings” section on page 22-10 formore information and a drawing of the switches.
The computer must load S1.EXE software withthe appropriate command line options. All .TSTfiles must have REMOTE set into the top field oneach panel. The Run Remote command must be runafter S1.EXE software is started. To simplify theseoperations, a special diskette has been prepared forlaptop computer operation. This diskette includestwo batch files (one for COM1 and one for COM2)which load the software with the proper commandline options. Duplicates of all the normal test filesare also furnished on this diskette with the top fields
REMOTE AND LAPTOP OPERATION 22-5
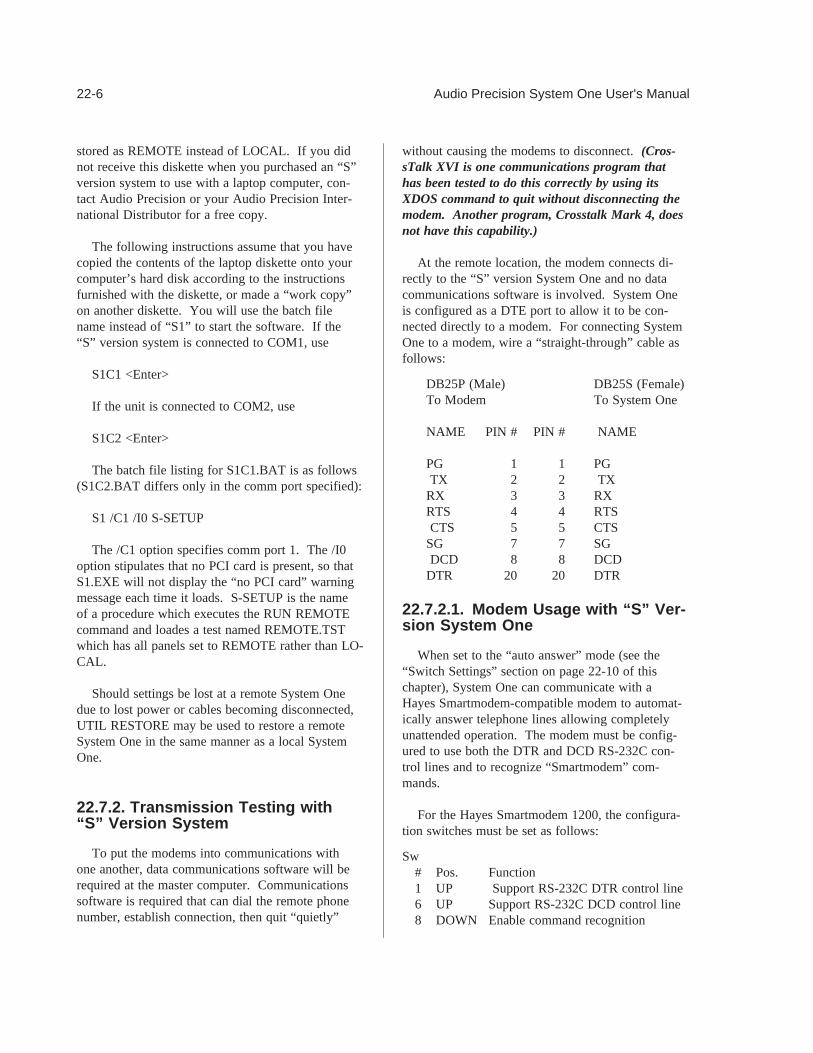
stored as REMOTE instead of LOCAL. If you didnot receive this diskette when you purchased an “S”version system to use with a laptop computer, con-tact Audio Precision or your Audio Precision Inter-national Distributor for a free copy.
The following instructions assume that you havecopied the contents of the laptop diskette onto yourcomputer’s hard disk according to the instructionsfurnished with the diskette, or made a “work copy”on another diskette. You will use the batch filename instead of “S1” to start the software. If the“S” version system is connected to COM1, use
S1C1 <Enter>
If the unit is connected to COM2, use
S1C2 <Enter>
The batch file listing for S1C1.BAT is as follows(S1C2.BAT differs only in the comm port specified):
S1 /C1 /I0 S-SETUP
The /C1 option specifies comm port 1. The /I0option stipulates that no PCI card is present, so thatS1.EXE will not display the “no PCI card” warningmessage each time it loads. S-SETUP is the nameof a procedure which executes the RUN REMOTEcommand and loades a test named REMOTE.TSTwhich has all panels set to REMOTE rather than LO-CAL.
Should settings be lost at a remote System Onedue to lost power or cables becoming disconnected,UTIL RESTORE may be used to restore a remoteSystem One in the same manner as a local SystemOne.
22.7.2. Transmission Testing with“S” Version System
To put the modems into communications withone another, data communications software will berequired at the master computer. Communicationssoftware is required that can dial the remote phonenumber, establish connection, then quit “quietly”
without causing the modems to disconnect.(Cros-sTalk XVI is one communications program thathas been tested to do this correctly by using itsXDOS command to quit without disconnecting themodem. Another program, Crosstalk Mark 4, doesnot have this capability.)
At the remote location, the modem connects di-rectly to the “S” version System One and no datacommunications software is involved. System Oneis configured as a DTE port to allow it to be con-nected directly to a modem. For connecting SystemOne to a modem, wire a “straight-through” cable asfollows:
DB25P (Male) DB25S (Female)To Modem To System One
NAME PIN # PIN # NAME
PG 1 1 PGTX 2 2 TX
RX 3 3 RXRTS 4 4 RTSCTS 5 5 CTS
SG 7 7 SGDCD 8 8 DCD
DTR 20 20 DTR
22.7.2.1. Modem Usage with “S” Ver-sion System One
When set to the “auto answer” mode (see the“Switch Settings” section on page 22-10 of thischapter), System One can communicate with aHayes Smartmodem-compatible modem to automat-ically answer telephone lines allowing completelyunattended operation. The modem must be config-ured to use both the DTR and DCD RS-232C con-trol lines and to recognize “Smartmodem” com-mands.
For the Hayes Smartmodem 1200, the configura-tion switches must be set as follows:
Sw# Pos. Function1 UP Support RS-232C DTR control line6 UP Support RS-232C DCD control line8 DOWN Enable command recognition
22-6 Audio Precision System One User's Manual

“S” version System One does not care about theposition of the other modem switches.
For the Hayes Smartmodem 2400, all settings aredone using commands from the “S” version unit asthere are no switches. Make sure that the “dumbmode strap” is in the “smart” position to enable com-mand recognition. No further setup needs to bedone for the 2400. Also, System One will notchange anything in the modem that is not requiredfor its operation. This allows selection of speakerusage, telco jack and line type, pulse dial ratios, etc.to remain intact.
Note that there are some obscure S registers set-tings in both the Hayes 1200 and 2400 that couldcause problems with System One operation. (Thereare some settings that can prevent the modem fromfunctioning at all.) The assumption is made that theS registers are at factory default.
Once the modem is connected to the System Oneserial port and both System One and the modemhave power turned on, the modem will be automat-ically configured to answer the phone. To preventthe modem from unexpectedly answering by itself,System One does the actual answer using Smart-modem commands. The Auto Answer light (nor-mally labeled “AA” on the modem) will thus notcome on. This is normal. The order in whichpower is applied to System One and the modem isnot critical.
The following sequence of actions must takeplace for a master computer to successfully controlmodules of both the local “A” version and remote“S” version System Ones, assuming a dial-up tele-phone line is being used as the data comm link.
a. the DOS MODE command must be runto select the proper parameters for the com-puter-RS-232 port linkage. Some data com-munications software automatically sets theparameters
b. the “originate” (master) unit modem mustgo off-hook (equivalent to picking up thetelephone)
c. the originate unit modem must dial thetelephone number of the distant (“answer”,or slave) unit
d. the answer (slave) unit modem must an-swer by going off-hook and putting its car-rier on the line
e. the originate unit modem responds by put-ting carrier on the line
f. both modems detect carrier. The mastermodem notifies the master computer and theslave modem notifies the computer imbed-ded in the “S” version unit
g. the data communication software at themaster computer quits to DOS without dis-turbing the COM port. Note that many typesof data communication software do not havethis capability and effectively break commu-nications when they exit or quit; such datacomm software cannot be used with SystemOne REMOTE mode
h. the remote “S” version unit must havehad its rear-panel switches set for RS-232control. The auto answer switch, if on, se-lects auto answer mode. The “S” versionunit automatically starts in the equivalent ofRun Slave mode when power is turned on
i. at the master unit, the command S1 /Cn(with any other appropriate command line op-tions) is run to load S1 software with the ap-propriate comm port selected, followed byRun Remote to enable the REMOTE/LO-CAL selections on any panels
At the completion of remote testing operation,this sequence must take place:
j. master unit quits from S1 software to datacomm software. Quitting S1.EXE at the mas-ter control location will cause the DTR con-trol line on the RS-232C port to go low,causing the master modem to hang up (itshould be configured to recognize DTR)
k. slave unit modem detects loss of carrier,notifies the “S” version System One of car-rier loss, and System One hangs up phone.
REMOTE AND LAPTOP OPERATION 22-7

The “S” version unit goes back into auto an-swer mode if the selection switch has beenset to that position and waits for modemcommunications to be re-established.
System One’s REMOTE operation has beentested with the Crosstalk XVI (TM) data communi-cations software. It should operate with other typesof data comm software if that software quits (toDOS) without changing the parameters which thesoftware set up while operating. Data communica-tions software is often capable of automatically dial-ing a telephone number (autodial). With the “scriptfile” capability of Crosstalk software and the batchfile capability of DOS, it is practical for all the op-erations listed above to be executed automatically.
Should settings be lost at a remote System One(due to lost power or cables becoming discon-nected), UTIL RESTORE may be used to restore aremote System One in the same manner as a localSystem One.
22.7.3. Transmission Testing withTwo Computers
To put the modems into communications withone another, data communications software will berequired. At the master end, communications soft-ware is required that can dial the phone number, es-tablish connection, then quit “quietly” without caus-ing the modems to disconnect.(CrossTalk XVI isone communications program that has been testedto do this correctly by using its XDOS command toquit without disconnecting the modem. Anotherprogram, Crosstalk Mark 4, does not have this ca-pability.)
System One’s REMOTE operation between twocomputers is independent of the particular type andbrand of modem, as long as the modem is RS-232compatible and compatible with the computer anddata comm software being used. The modems at thetwo ends of the data comm link need not be identi-cal.
The following sequence of actions must takeplace for a split-site set of System One units andcomputers to go into successful operation, assuminga dial-up telephone line is being used as the datacomm link.
a. the DOS MODE command must be run atboth computers to select the proper parame-ters for the computer-RS-232 port linkage.Some data communications software automat-ically sets the parameters
b. the “originate” (master) unit modem mustgo off-hook (equivalent to picking up thetelephone)
c. the originate unit modem must dial thetelephone number of the distant (“answer”,or slave) unit
d. the answer (slave) unit modem must an-swer by going off-hook and putting its car-rier on the line
e. the originate unit modem responds by put-ting carrier on the line
f. both modems detect carrier and notifytheir attached computer
g. the data communication software at bothends quits to DOS without disturbing theCOM port. Note that many types of datacommunication software do not have this ca-pability and effectively break communica-tions when they exit or quit; such data commsoftware cannot be used with System OneREMOTE mode
h. at the slave unit, the command S1 /Cn /S/H is run to load S1 software directly intothe Run Slave mode with a specific commu-nications port selected and auto quit at lossof carrier (hang-up) mode. See page 22-12below for more information on commandline options
i. at the master unit, the command S1 /Cn(with any other appropriate command line op-tions) is run to load S1 software with the ap-propriate comm port selected, followed byRun Remote to enable the REMOTE/LO-CAL selections on any panels
22-8 Audio Precision System One User's Manual

At the completion of remote testing operation,this sequence must take place:
j. master unit quits from S1 software and in-structs master unit modem to hang up
k. slave unit modem detects loss of carrier,notifies System One of carrier loss, hangs upphone
l. for continuing readiness for further tests,S1.EXE software at the remote computerquits to the data comm software and a batchfile puts modem into auto-answer mode.
System One’s REMOTE operation has beentested with the Crosstalk XVI (TM) data communi-cations software. It should operate with other typesof data comm software if that software quits to DOSwithout changing the parameters which the softwareset up while operating. Data communications soft-ware is often capable of automatically dialing a tele-phone number (autodial) and of automatically an-swering when called (auto-answer). Some software-modem combinations are also capable of automat-ically setting the baud rate of multi-rate modems tothe fastest rate which can be supported by the mo-dems at both ends of the line (auto baud rate). Withthe “script file” capability of Crosstalk software andthe batch file capability of DOS, it is practical forall the operations listed above to be executed auto-matically.
A batch file at the slave unit can be in a continu-ous loop. Then, whenever carrier is lost and SystemOne quits, the data comm software is again loadedand waits for the number to be called again. Thefirst action of the slave batch file is to load Cros-stalk software with a crosstalk command file whichsets the MODE parameters and goes into autoan-swer mode. An attached Crosstalk script file tellsCrosstalk to quit using Crosstalk’s XDOS commandafter connection has been made. The next line ofthe batch file causes System One to select commport 1 and load directly into the Run Slave and auto-matic quit at carrier loss modes via the /S and /Hcommand line options. The complete batch filemight thus be:
:BEGINXTALK ANSWERS1 /C1 /S /HGOTO BEGIN
This monitoring could be on a 24-hour-per-daybasis. Alternately, the computer and System Onecould be turned on and off by timeclocks or a sepa-rate remote control link into the facility if available.Devices are also available which turn on power tothe computer when a ring is detected by the modem.
Note that data communications software such asCrosstalk also allows users at the two computers tocommunicate with one another in real time, similarto teletype operation. Crosstalk also permits trans-mission of any files between the computers, such asthe xx.TST files created by System One.
22.8. “S” Version System One,General Information
On the rear panel of “S” version System One aretwo DB25P (male) connectors. The top connector isfor the APIB (Audio Precision Interface Bus). Thisis the same connector as found on “A” version Sys-tem Ones. In the APIB mode, an “S” version sys-tem functions exactly like an “A” version system.The bottom connector is the serial port and isunique to “S” version System Ones. A miniatureswitch assembly on the rear panel selects betweenAPIB and RS-232 interface and sets baud rate whenin RS-232 mode. These switch settings are read bythe microprocessor only at power-up, so power mustbe turned off and back on for any changed switchsettings to become effective.
The “S” version of System One contains theequivalent of a high performance IBM-compatiblecomputer with a serial port and a PCI card. Thiseliminates the need for a computer at the slave endof a “split site” installation, allowing direct serialcommunications between System One and a com-puter running the S1.EXE software. It also permitsuse of laptop and notebook computers, which nor-mally do not have expansion slots which accept aPCI card, for more portable test systems.
REMOTE AND LAPTOP OPERATION 22-9

The firmware in “S” version System Ones runs aprogram that emulates the “RUN SLAVE” portionof S1.EXE. It can also communicate with Hayes-compatible modems to automatically answer tele-phone lines allowing completely unattended opera-tion.
The “S” version System One provides completeoperation of the hardware when using the serialport, with the following exceptions:
1. The Program Control Inputs and Outputs on aDCX-127 module are not functional when con-nected to an “S” version System One being control-led by the serial port.
2. Panel indication of generator overload is notfunctional for a generator in an “S” version SystemOne being controlled by the serial port.
3. LIB-C, LIB-BASIC, and the older LIB-MIXfunction libraries cannot be used to control an “S”version System One by the serial port.
4. The HELP screen will show the various Sys-tem One modules as “not connected”, since it looksonly at instruments connected to the PCI card.
The firmware in “S” version System Ones is spe-cifically matched to certain versions of S1.EXE.Mis-matched firmware and software will be indi-cated by “remote setting timeout” error messages.A label is located on the rear panel of each “S” ver-sion System One indicating the firmware versionand which versions of S1.EXE are compatible. All“S” version shipped before August, 1991, containedversion 1.60C firmware. For information on upgrad-ing these units to version 2.10 firmware in orderthat they can work with a computer running S1.EXEv2.10, contact Audio Precision or your Audio Preci-sion Distributor.
22.8.1. “S” Version Switch Settings
A six-pole rear-mounted miniature DIP switch as-sembly (see Figure 22-4) selects between the RS-232 (lower) connector or the APIB (upper) connec-tor on the rear. When in the RS-232 mode, addi-
tional switches select baud rate and the auto answermode. All these switches are read by the internalmicroprocessor only when power is first turned onto System One. Thus, if any switch positions arechanged, power must be turned off and then back onfor the new settings to become effective.
The leftmost switch on this assembly sets whichinterface will be used by the hardware. When set toAPIB (Audio Precision Interface Bus), System Onewill behave like an “A” version, using the APIB con-nected to a PCI card installed in an IBM-PC. Theserial port will be ignored.
When this switch is set to RS-232, the serial portwill be used. All commands received are repeatedon the APIB port so that switchers, DCXs, etc. maybe connected. Any devices connected to APIB willthen be fully controllable from the serial port, withthe exception of the DCX-127 Program Control in-puts and outputs. The APIB port cannot be con-nected to a PCI card when RS-232C is in use.
The second leftmost switch sets the “auto an-swer” mode. When set to the “auto answer” posi-tion, System One will not operate unless a Hayescompatible modem connected to a dial-up phoneline is attached to the serial port. Thus, this switchshould not be in the “auto answer” position whenused with a local laptop computer. When a Hayescompatible modem is attached, the modem will be
1
0
APIB
RS232
AUTO ANSWER
BAUD
111 = 19200110 = 9600101 = 4800100 = 2400011 = 1200010 = 600001 = 300000 = 150
Figure 22-4 Rear-Panel Switch Assembly, “S” Ver-sion Systems
22-10 Audio Precision System One User's Manual

set to automatically answer any incoming phonecalls. See the “Modem Usage” section of this chap-ter on page 22-6 for more details.
Note that when set to “auto answer”, the RS-232C control lines RTS, CTS, DCD, and DTR areused. When not set to “auto answer”, these lines arenot used.
The third switch is not used.
The three remaining switches on the right controlthe baud rate of the serial port. When System Oneis connected directly to a computer, 9600 baud maybe used. When a modem is used, 1200 or 2400baud is typical.
Baud rates below 1200 baud are not recom-mended because of degradations in system perform-ance. If slower baud rates must be used because ofmodem or comm line limitations, the /T option mustbe used for S1.EXE to change the default communi-cation time-outs.
22.8.2. “S” Version Technical Details
The serial port on “S” version System Ones is anRS-232C interface of the DTE (Data TerminalEquipment) type using a DB25P (male) connector.A subset of the EIA RS-232C standard is used utiliz-ing only RX, TX, DTR, CTS, DCD, and groundsPG and SG. Pin assignments are as follows:
PIN# NAME DESCRIPT. DIRECTION
1 PG Protective Ground2 TX Transmit Data From System One3 RX Receive Data To System One4 RTS Ready To Send From System One5 CTS Clear To Send To System One7 SG Signal Ground8 DCD Data Carrier Detect To System One
20 DTR Data Term. Ready From System One
Note that the control lines CTS, DCD, RTS, andDTR are only required for operation with a modem.
22.9. DOS Mode Command
The MODE command of DOS sets several criti-cal computer parameters for data communications in-cluding baud rate, byte width, parity, and stop bits.The MODE command is an “external” DOS com-mand; that is, a separate program stored on disk,rather than being built into the basic DOS programwhich is always in memory. Thus, the programMODE.COM must be in the current directory or adirectory named in the PATH command beforeMODE can be set. The mode command can be runfrom DOS before loading S1.EXE (typically by anAUTOEXEC.BAT program), or can be run afterloading S1.EXE during use of the XDOS menu func-tion. The computers at both ends of the RS-232communications link (or the “S” version SystemOne at the remote location when only one computeris used) must be set to the same baud rate, 8-bit-wide bytes, no parity, and one stop bit before suc-cessful communications can be set up. The com-mand to be run at each computer is:
MODE COMx: baud,N,8,1 <Enter>,
where COMx: is COM1: or COM2:, depending onwhich serial port is being used for remote operation.S1.EXE software must be started with the /Cn com-mand line option if remote operation is to be used,where n is the number of the computer serial port tobe used. For example, if the COM1 port is to beused, start the software
S1 /C1 <Enter>
If no /C option is specified, remote mode will notfunction.
The number entered instead of “baud” is a suit-able baud rate for the computers, modems, and datacommunications link involved. Baud rates availablefrom most computers include 110, 300, 1200, 2400,4800, and 9600. Most modems available are 300,1200, or 2400 baud, with still-faster modems avail-able at premium prices. When a direct metallic RS-232 link is used rather than modems, the fastestbaud rate available from the computer may be used(up through the maximum 19200 baud available ifan “S” version system is connected at the “remote”
REMOTE AND LAPTOP OPERATION 22-11

point). See the documentation for your specificcomputer to see if 19200 baud operation is availableand how to select it. Early DOS versions only sup-ported rates through 9600 baud. REMOTE opera-tion at 300 baud will be quite slow compared to nor-mal operation. For 300 baud or slower operation,the communications time-out value must be changedwhen S1.EXE is loaded; see the discussion underMaster and Slave operation and the command lineoptions section at the end of this chapter. At 1200baud, operational speed for most real-time audio test-ing will be only moderately degraded compared tonormal operation. At 2400 baud and faster, RE-MOTE operation speeds will be comparable to nor-mal System One operation for real-time audio test-ing. With DSP units, transfer of DSP programsfrom master computer to system, upload or down-load of waveforms between master computer andsystem, and graphing of FFT spectra and waveformsinvolve transfer of large amounts of data and will bemuch slower, even at 9600 baud, than over theAPIB with a PCI card.
N in the MODE command stands for no parity,required by System One software. The 8 representsthe number of bits per character (byte) and must be8 for System One REMOTE operation. The 1 desig-nates one stop bit.
For 9600 baud communications via serial port 1,the command would be MODE COM1: 9600,N,8,1.For 300 baud modem communication via serial port2, the command would be MODE COM2: 300,N,8,1.
When DOS accepts a MODE command, it willecho back a message such as:
COM1: 1200,N,8,1,-
If the DOS program MODE.COM is not in a cur-rent directory, the computer’s response will be:
Bad command or file name.
If MODE is typed with the designation of a serialport not installed in the computer, such as COM2:when only one serial port is present, the responsewill be
Illegal device name.
Specifying an unavailable baud rate will result inthe error message:
Invalid baud rate.
22.10. Command Line Options
The following command line options are avail-able for use with REMOTE mode. In each casewhere “n” appears, it represents a number value forthe command.
/An sets number of attempts the masterwill make at sending a particular packet or re-questing a data packet from the slave, beforedisplaying or updating an error message. De-fault value is four. This option is applicableonly to the master unit.
/Cn selects COMn: as the serial port whichSystem One will use for remote operation.This option must be run at both master andslave when two computers and “A” versionsystems are used.
/H automatic quit when carrier is lost.This option is applicable only to the slavecomputer. When an “S” version system isused at the remote location, a rear-panelswitch turns the equivalent to the /H modeon and off. It would normally be off for usewith a laptop computer, but on for automaticoperation with modem at an unstaffed loca-tion.
/S load S1 directly into Run Slave mode.This option is applicable only to the slave.The “S” version (serial interface) SystemOne is always effectively in Run Slave modewhen turned on with its rear-panel switchesset to the RS-232 (rather than APIB) mode.
/Tn sets the communications time-out value(in seconds). This is the length of time themaster will wait for acknowledgement fromthe slave of correct settings packet receipt be-fore re-sending the packet, or the length oftime the master will wait after requesting a
22-12 Audio Precision System One User's Manual

data packet from the slave before making an-other request. The default value is 1 second.For 300 baud operation, /T4 should be used.At even slower baud rates, still longertimeouts should used. This data communica-tions time-out should not be confused withthe TIMEOUT parameter on the SWEEPSETTLING panel. This option is applicableonly to the master.
Any number of these options may be combinedon the command line, along with other commandline options as described in the CREATING YOURCUSTOM SOFTWARE STARTUP chapter andelsewhere in this manual. For example, System Oneat a master unit could be started with the command
S1 /T6 /C2 /A6 /R96 /L <Enter>
This would cause System One to load with a datacommunications timeout of six seconds, usingCOM2: as the serial port for remote operation, withsix attempts to be made a obtaining a correct packetbefore displaying an error message, reserving 96 ki-lobytes of memory for operations under DOS andXDOS, and loading the last test file(APLAST$$.TST) which was in use when the soft-ware was last QUIT in the current disk directory.Note that a space is required between each of multi-ple command line options.
22.11. Error Messages
If the master needs to attempt a transmissionmore than a specified number of times, the com-puter “beeps” and an error message is indicated atthe bottom of the screen of the master computer.Even though the error message is given, the masterwill continue attempting to achieve correct commu-nication until any key is pressed by the operator.The error message will be periodically updated toshow the number of attempts which have beenmade. If the operator presses any key, the systemwill stop making attempts and the test will beaborted if the problem developed during a test. Ifthe problem developed while the master unit was inpanel mode, the system will display another errormessage but continue to attempt to obtain readingsdata from the slave until the operator goes to the
menu or disables the REMOTE selection on all pan-els. After the data communications problem hasbeen corrected, a Util Restore menu commandmust be sent to up-date the slave unit to the set-tings status specified by the master.
The number of attempts which the master willmake before displaying or updating the error mes-sage is controlled by the /A command line option.The default value is four.
22.12. Creating, Running, Viewing,and Editing Remote Test Files
Test files set up for use at the Master locationwill have REMOTE selected in the top border ofone or more of the GENERATOR, ANALYZER,DCX, DSP, and SWITCHER panels. An additionalmenu action, Run Remote, is required to enable thesystem to run REMOTE tests with a full system con-nected including modems, data communicationslink, and a distant computer and System One or se-rial interface System One. Unless a full remote sys-tem is connected and operational, executing Run Re-mote and selecting REMOTE or loading a pre-viously-created xx.TST file with REMOTE selectedon a panel will result in system delays and timeouterrors. Thus, unless a full remote system is con-nected, creating tests for use at a master location orviewing or editing such tests, should be done onlyafter the Run Local command is executed. SystemOne normally loads into the Run Local mode.
REMOTE AND LAPTOP OPERATION 22-13

22-14 Audio Precision System One User's Manual

23. EQUALIZATION
23.1. Equalization Concepts andApplications
The computer and software base of System Onemakes it possible to provide the powerful feature ofgenerator equalization. This capability enables thegenerator to sweep through a specified frequencyrange while producing any desired, arbitrarily fur-nished amplitude function instead of the usual flat re-sponse with frequency. The equalization functioncan be any of a number of standard files furnishedwith System One such as RIAA or inverse RIAAphono equalization, or pre-emphasis or de-emphasisat any of several industry-standard time-constantcurves. The equalization function can also be cre-ated by table entry, with the user typing in the de-sired data from information in a reference curve ortable in the literature. System One software per-forms a log-log interpolation between the datapoints of the equalization file.
The equalization curve can be measured data oran inversion of measured data. Thus, System Onecan measure the frequency response of any linear de-vice under test, normalize and invert that responsewith simple menu-selectable utilities, attach the re-sulting curve to the generator, and then produce aflat output from the device on succeeding sweepssince the generator creates an equal but oppositefunction at the device’s input. This feature is ex-tremely useful in applications such as testing equal-ized power amplifiers at their rated power outputacross their bandwidth, in testing systems such asfm and tv transmitter audio channels which includepre-emphasis but should be tested at constant modu-lation percentages, in calibrating out even the minorvariations from perfect flatness of System One itself,and (assuming that a reference flat microphone isconnected to the analyzer input) in calibrating acous-tical chambers and “artificial voices” used in acousti-cal testing.
Generator equalization makes use of the SINEand EQSINE selections of generator waveform, ofthe .EQ file type and the Save EQ and Load EQ filehandling utilities, and of the Names GEN-EQ, Com-pute Normalize and Compute Invert menu com-mands. A BASIC program and a System One proce-dure which calls it are also furnished which can cre-ate an equalization file from a user-supplied alge-braic equation. New .EQ files can be created by useof EQCREATE.PRO, which calls a BASIC programcalled EQCREATE.BAS.
23.2. Using Furnished EQ Files
To cause a generator sweep equalized by one ofthe .EQ files furnished with System One software,use Names GEN-EQ with the cursor control keysand <Enter> key to attach one of the furnished .EQfiles. You can double-check via the NAMES panelthat the desired .EQ file is attached. Select EQSINEas the generator waveform, and a new label andfield called POST-EQ will appear (following a mo-ment’s computation) immediately under the AMPLI-TUDE field near the top of the generator panel; seeFigure 23-1 for an example. Varying the generatorfrequency with FREQSTEP or by direct entry will
Figure 23-1 Generator Panel with EQ Active
23-1

show the POST-EQ amplitude (actual amplitude re-quested from the generator) varying from the panel-entered AMPLITUDE according to the attachedequalization function.
Depending on the selected AMPLITUDE, on thegenerator output configuration (BAL, UNBAL, orCMTST), and on the value of the attached equaliza-tion curve at the selected frequency, an error mes-sage will result if the requested POST-EQ amplitudeis outside the generator’s capability. If the SWEEP(F9) DEFINITIONS panel is properly set up for afrequency response sweep, pressing <F9> will resultin a measurement which includes the effects of theequalization file. The <F7> and <F9> keys can beused, changing the GENERATOR panel from SINEand EQSINE between the sweeps, to see responsewith and without the generator equalization. At fre-quencies between the data points in an attachedequalization file, System One software will performa log-log interpolation to compute the value towhich to set the generator amplitude.
Equalized sweeps will run fastest when the direc-tion of frequency change (high to low, or low tohigh) of the .EQ file matches the sweep direction ofthe .TST file it is used with. Speed is also maxi-mized by having the smallest number of points inthe .EQ file which will produce an equalization func-tion of the desired accuracy. If it is desired tochange the frequency end points of a supplied .EQfile, to change the number of points in the file, or toreverse the direction of frequency change in the fileto match the frequency sweep direction of a particu-lar .TST file, use EQCREATE.PRO andEQCREATE.BAS (see below) to create new .EQfiles as desired. When a .TST file with .EQ file at-tached has been loaded, starting a sweep (<F9> or<F7>) will cause the system to load the .EQ file (upto the first 200 points) into memory for maximumtesting speed. If an equalization file with more than200 points is required, test operation will slow mark-edly as the test progresses into the frequency region
beyond 200 points since it then must access the disk-stored .EQ file for data. This 200 point restrictionassumes that S1.EXE software was loaded in thesimplest fashion, so that normal memory space allo-cation procedures were followed. It is possible toload S1 such that much larger (or smaller) .EQ fileswill load into memory. See the Controlling Mem-ory Usage section of the CREATING YOUR CUS-TOM SOFTWARE START-UP PROCESS chapterfor more details.
If the SWEEP (F9) DEFINITIONS panel is set toproduce a sweep which begins and/or ends outsidethe frequency limits of the attached equalization file,the generator amplitude will be reduced to zerowhen the sweep frequency is outside the end pointsof the equalization file. This capability may also beused when it is desired to produce a gated sweep,even without equalization. An .EQ file can be sim-ply created in Edit Data mode, consisting of the twodesired end points for the gated-on portion of thesweep in the first column and the value 1.0 for am-plitude at those points in the second column; seeFigure 23-2 for an example which would produce agated-on sweep only between 15 kHz and 50 Hz.With this .EQ file attached, EQSINE selected, andthe SWEEP (F9) DEFINITIONS panel set for asweep over still-wider limits such as 30 kHz to 20Hz, the result will be a flat-amplitude sweep be-tween 15 kHz and 50 Hz (actually, between the firstand last steps computed between those limits accord-ing to the # STEPS and LOG/LIN selections made)with no generator output prior to or following thatportion of the sweep. This is a useful capability toproduce a test tape or other recorded signal for usewith System One’s EXTERnal sweep mode. Whenplayed back, the recording output level will be be-low the EXT MIN LVL amplitude selected on theSWEEP SETTLING panel until the gated-on portionof the recorded sweep is reached, providing easysynchronization between System One and the tapeplayer.
Hz V OFF15000.000000000, 1.000000000
50.000000000, 1.000000000
Figure 23-2 Equalization File for Gated Sweep
23-2 Audio Precision System One User's Manual
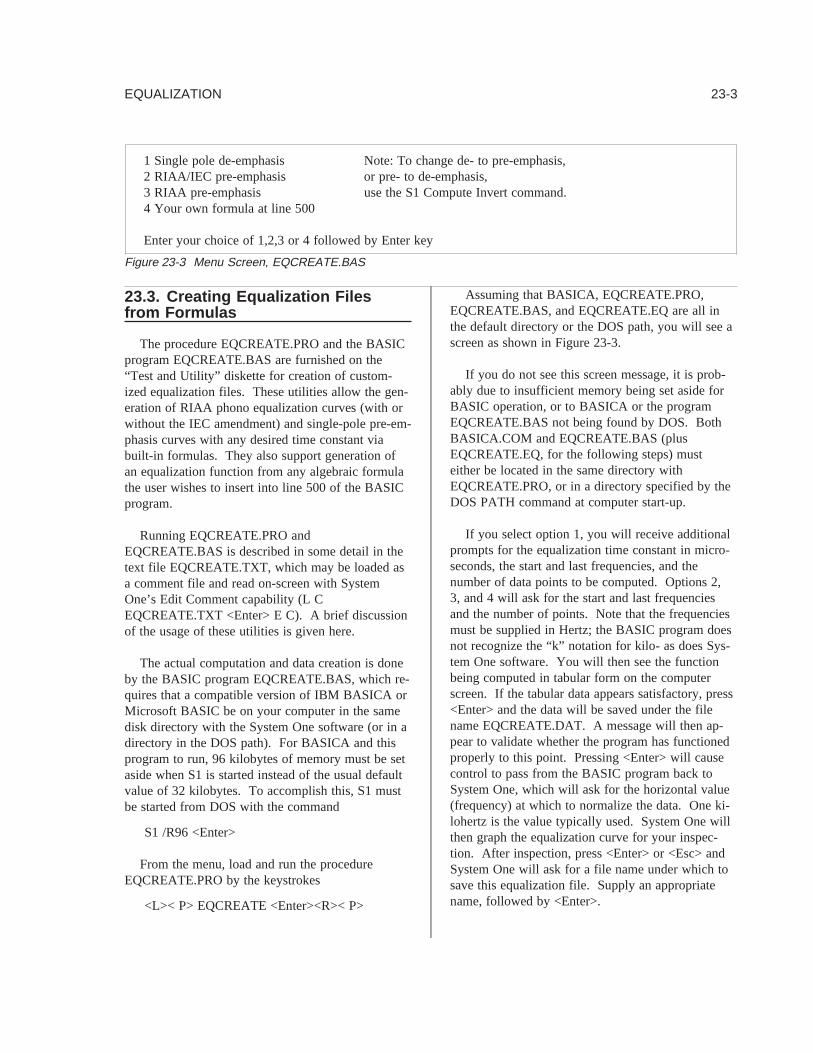
23.3. Creating Equalization Filesfrom Formulas
The procedure EQCREATE.PRO and the BASICprogram EQCREATE.BAS are furnished on the“Test and Utility” diskette for creation of custom-ized equalization files. These utilities allow the gen-eration of RIAA phono equalization curves (with orwithout the IEC amendment) and single-pole pre-em-phasis curves with any desired time constant viabuilt-in formulas. They also support generation ofan equalization function from any algebraic formulathe user wishes to insert into line 500 of the BASICprogram.
Running EQCREATE.PRO andEQCREATE.BAS is described in some detail in thetext file EQCREATE.TXT, which may be loaded asa comment file and read on-screen with SystemOne’s Edit Comment capability (L CEQCREATE.TXT <Enter> E C). A brief discussionof the usage of these utilities is given here.
The actual computation and data creation is doneby the BASIC program EQCREATE.BAS, which re-quires that a compatible version of IBM BASICA orMicrosoft BASIC be on your computer in the samedisk directory with the System One software (or in adirectory in the DOS path). For BASICA and thisprogram to run, 96 kilobytes of memory must be setaside when S1 is started instead of the usual defaultvalue of 32 kilobytes. To accomplish this, S1 mustbe started from DOS with the command
S1 /R96 <Enter>
From the menu, load and run the procedureEQCREATE.PRO by the keystrokes
<L>< P> EQCREATE <Enter><R>< P>
Assuming that BASICA, EQCREATE.PRO,EQCREATE.BAS, and EQCREATE.EQ are all inthe default directory or the DOS path, you will see ascreen as shown in Figure 23-3.
If you do not see this screen message, it is prob-ably due to insufficient memory being set aside forBASIC operation, or to BASICA or the programEQCREATE.BAS not being found by DOS. BothBASICA.COM and EQCREATE.BAS (plusEQCREATE.EQ, for the following steps) musteither be located in the same directory withEQCREATE.PRO, or in a directory specified by theDOS PATH command at computer start-up.
If you select option 1, you will receive additionalprompts for the equalization time constant in micro-seconds, the start and last frequencies, and thenumber of data points to be computed. Options 2,3, and 4 will ask for the start and last frequenciesand the number of points. Note that the frequenciesmust be supplied in Hertz; the BASIC program doesnot recognize the “k” notation for kilo- as does Sys-tem One software. You will then see the functionbeing computed in tabular form on the computerscreen. If the tabular data appears satisfactory, press<Enter> and the data will be saved under the filename EQCREATE.DAT. A message will then ap-pear to validate whether the program has functionedproperly to this point. Pressing <Enter> will causecontrol to pass from the BASIC program back toSystem One, which will ask for the horizontal value(frequency) at which to normalize the data. One ki-lohertz is the value typically used. System One willthen graph the equalization curve for your inspec-tion. After inspection, press <Enter> or <Esc> andSystem One will ask for a file name under which tosave this equalization file. Supply an appropriatename, followed by <Enter>.
1 Single pole de-emphasis Note: To change de- to pre-emphasis,2 RIAA/IEC pre-emphasis or pre- to de-emphasis,3 RIAA pre-emphasis use the S1 Compute Invert command.4 Your own formula at line 500
Enter your choice of 1,2,3 or 4 followed by Enter key
Figure 23-3 Menu Screen, EQCREATE.BAS
EQUALIZATION 23-3

To convert any pre-emphasis curve to a de-em-phasis curve or vice-versa, load the appropriateequalization file, use the Compute Invert function,and save the newly inverted curve under another filename. For example, if you have created a 20-pointRIAA pre-emphasis curve via EQCREATE.PROand saved it under the name RIA-PR20.EQ, you cancreate and save the companion de-emphasis curveby the keystroke sequence
<L> < E >RIA-PR20.EQ <Enter>
(Load EQ RIA-PR20.EQ)
<C>< I>< S>< E> RIA-DE20 <Enter>
(Compute Invert Save EQ RIA-DE20.EQ)
Selecting option 4 in EQCREATE will generate afunction according to the formula in line 500 of theprogram EQCREATE.BAS. The formula
V=1000/W (where W is the angularfrequency in radians per second)
is supplied in line 500 as an example. Another for-mula is easily substituted by use of System One’sEdit Comments capability. Load EQCREATE.BASinto the comments editor and view the program via
<L> < C> EQCREATE.BAS
(Load Comments EQCREATE.BAS)
<E> < C>
(Edit Comments)
Use the arrow keys or <Ctrl><PgDn> to move tothe end and substitute your own formula in line 500.Pre-defined variables include
V (amplitude in Volts)
F (frequency in Hertz)
W (angular frequency in radians/sec)
X (angular frequency squared)
Save the revised program under the same filename by
<S> <C> <Enter> <Y>
(Save Comments; the system will have retained thename EQCREATE.BAS from when the file wasloaded, so pressing <Enter> will initiate saving themodified file. Since the file name already exists,the system will ask your permission to over-write,which you give with Y for yes.)
You may now run EQCREATE.PRO, select op-tion 4, provide the desired start and stop frequenciesand number of points, and save the equalization file.
23.4. Entering and EditingEqualization Files
If a tabular listing is available of a desired equali-zation curve (or a graph from which you can readand interpolate data), you can create an .EQ file inthe Edit Data mode. It may be simplest to first useLoad EQ to bring into memory one of the standardfiles furnished with System One, since the formatand column headings will thus be guaranteed cor-rect. You may then overtype or insert as desired tochange or replace the data points with those youwish to create, and Save the resulting EQ file underan appropriate new name.
23.5. Creating EQ Files fromMeasured Data
To create an equalization file from measureddata, you must first use or set up a test to measurethe frequency response of the device which will bethe basis for the curve. Be sure the settling algo-rithm is tight enough to guarantee settling to the de-sired accuracy, and that a sufficient number ofpoints are selected for the frequency sweep to pro-vide the desired amplitude accuracy when the sys-tem later performs its log-log interpolation betweendata points. Run the test and store the results underan appropriate .TST file name.
It is usually most convenient when the equaliza-tion curve has a value of unity at some mid-band fre-quency (typically 1000 Hz) so that the generator out-put level will be unchanged as you change back andforth between SINE and EQSINE with the generatorat that frequency. To accomplish this, use the Com-
23-4 Audio Precision System One User's Manual

pute Normalize menu command. The system willask you for the horizontal value at which to normal-ize the data; if 1000 Hz is the desired value, enter1000. You may graphically re-examine the data af-ter this normalization with the <F7> key if you wish.
If the desired equalization curve is the inverse ofthe measured response, as it will be when the de-sired end result is flat response at the output of thesystem even though the system has a non-flat re-sponse, the curve must now be inverted. This is ac-complished with the Compute Invert menu com-mand. A message in the lower left of the screenwill indicate that the inversion is taking place, andthe result can be examined with the <F7> key. As-suming that it is satisfactory, use Save EQ to savethe data as an equalization file. It may now be at-tached to any test via the Names GEN-EQ menucommand as described above, EQSINE selected asthe test waveform, and the resulting test saved.
One useful application of this capability is provid-ing even better flatness than the specified flatness ofSystem One, for highly critical measurements. Thiscan be particularly valuable at frequencies above 50kHz, or even beyond 100 kHz where flatness is notspecified. Connect the generator output to the ana-lyzer input with the cables, source impedance, andload impedance which will later be used to test exter-nal devices.
Specify extremely tight settling conditions on theSWEEP SETTLING panel, such as DATA SAM-PLES of 4 or more and a TOLerance of 0.1% (0.01dB). You may wish to change from EXPONTL toFLAT to force all specified consecutive measure-ment samples to agree within the selected TOLer-ance before the generator steps on. Selection of theAVG, rather than RMS detector on the LVF1 panelwill also improve system flatness slightly. Resolu-tion, and therefore flatness, above 80 Hz may alsobe improved (at the expense of test time) by select-ing 4/sec or 8/sec instead of AUTO on the DETEC-TOR line of the LVF1 panel. Run the test, useCompute Normalize and Compute Invert as de-scribed above, and Save the EQ file under an appro-priate name. Attach it to the test with the NamesGEN-EQ command and select EQSINE. Succeed-ing test runs should produce extremely flat response,
limited only by noise, thermally induced drift, andother “repeatability” factors. The system may nowbe connected to the device to be tested with thesame cables and the actual tests made.
EQUALIZATION 23-5

23-6 Audio Precision System One User's Manual

24. ACCEPTANCE TEST LIMITS
In many applications such as production test, in-coming inspection, and quality assurance, it is desir-able to establish a definition of acceptable perform-ance levels for a product. Test results can then becompared to those acceptable levels and a pass/failor go/no-go decision can be made. System One sup-ports this mode of operation via a limits and com-parison capability which uses the Names Upper,Names Lower, Names Error-file, and Names Offmenu commands and an If Error[ statement in a pro-cedure. The Edit Data capability is normally usedto help create the limit files.
A defined limit (or pair of limits, if both upperand lower limits are used) is normally created as alimit file (xx.LIM file type), though xx.TST andxx.SWP files are identical in format and could beused. It is possible to either create such a file fromthe beginning, to make a measurement or average anumber of measurements of actual devices as the ba-sis of a limit, or to start with an actual device meas-urement and then further edit it into the desiredform as a limit file. When the file has been created,it can be attached to a test file via the Names menucommand.
24.1. Creating A Limit File
As an example, let’s assume that we need to cre-ate a file to be used as an upper limit in a distortionversus frequency test, and that acceptable perform-ance is defined as 0.01% between 100 Hz and 10kHz, with permissible degradation to 0.02% from 20Hz to 100 Hz and 0.05% from 10 kHz to 20 kHz.First, set the sweep definition panel for a five-stepfrequency sweep from 20 kHz to 20 Hz, withRDNG (THD+N from the ANALYZER panel) se-lected as the DATA-1 value and DATA-2 set toNONE. Press <F9> to run this test; at the comple-tion of the graph or table, press <Esc> Edit Data,which will move you into the data buffer. Go into
the overtype mode by using the <Ins> key. Then,modify the data as necessary to look like Figure 24-1.
Commasmustbe used to separate the numeric en-tries; spaces can be added between the columns forreadability. Column heads in the proper units (asshown on the panels or tabular displays) are re-quired, and the third column must be headed Off ifno DATA-2 parameter will be specified in the testfile.
Use <Esc> to go back to the top menu. You mayview the limit file graphically by pressing <F7>. Tosave the limit file to disk, press Save Limit and sup-ply some easy-to-remember name such as DIST-UP.The system will automatically add the xx.LIM exten-sion.
When a simple horizontal limit file is desired,with the same limit at all values of the independentvariable, only one data row need be entered in EditData mode. The limit value in the second columnwill then be applied across the entire range tested.Figure 24-2 is an example of a 0.5% distortion limitat all frequencies; the specific frequency entered in
Hz % OFF20000.0, 0.05,10000.0, 0.05,9999.9, 0.01,100.0, 0.01,99.9, 0.02,20.0, 0.02,
Figure 24-1 Example Limits File
Hz % OFF20000.000000000, 0.500000000, 0.000000000
Figure 24-2 Example Single-Point Limits File
24-1

the first column is irrelevant. Such a single-pointhorizontal limit file cannot be graphed via F7 whenthe limit file is loaded. It will graph properly whenattached to a test and the limits are displayed via<Alt><F7>.
24.2. Creating the Test for Use WithLimits Files
Now, from panel mode, create the test which willuse this file as its upper limit. It will need to useTHD+N mode with % as the units, and will need tobe a FREQ sweep on the SWEEP (F9) DEFINI-TIONS panel, preferably sweeping from a high to alow frequency since the DIST-UP file was createdin high-to-low order. Test speed will be slower ifthe test and limit file frequency sequences are in op-posite orders. RDNG must be selected as theDATA-1 parameter and % as its units. DATA-2will not be used since no limit was entered in thethird column of the limit file. All other parameters,such as generator amplitude and source impedance
and analyzer filter selection should be set as desired.Then, press Names Upper and use the cursor to se-lect DIST-UP.LIM in response to the request for afile name to attach. If you wish a summary of allout-of-limits measurements to be saved into an errorfile, use Names Error-file and supply a file namesuch as ERRSUMRY. Finally, Save the Test (withlimit file and error report file now specified) undersome appropriate name such as DISTEST. Fromthis time forward, when DISTEST.TST is loadedand run via <F9> or Run Test, comparisons will bemade to the DIST-UP.LIM file and out-of-specifica-tion values will be saved in tabular form to theERRSUMRY.TXT file.
To see the names which are attached to a test file,press N from the menu (see Figure 24-3). In addi-tion to the names of limits, delta, sweep, error-re-porting, equalization files, and DSP program files,this display shows the name of the test file currentlyin memory. If it is desired to disconnect all thelimit, etc., files for a fresh start, the Names Clearmenu command may be used.
Figure 24-3 Names Display
24-2 Audio Precision System One User's Manual

It is important to understand when working withlimit files and test files thatonly one section ofmemory exists in System One software for setup in-formation and binary data, whether the file is a.TST file, .LIM file, .EQ file, .SWP file, or .OVLfile. Whichever of those files is loaded by theLOAD command displaces the last file of any ofthese types in memory. Only the file in memorycan have its panels shown in PANEL mode, onlythat file’s data will be displayed by <F7>, and onlythat data can be edited in EDIT DATA mode.As-sume, for example, that you have loaded a .TST filein order to attach limits to it and experiment withthe test. If you decide to change the limit, LoadLimit and the limit file you load will replace the.TST file in memory. After you have modified andre-saved the limit file, you must again Load Testand press <Enter> to bring the .TST file back intomemory. When you select Load Test, the systemwill suggest the name of the last test file which wasloaded and you can load it merely by pressing <En-ter>. You must take this action to load it, however,since it was removed from memory when the limitfile was loaded.
24.3. Creating Limits Files By ActualTests
When it is desired to use the measured data froma “golden unit” (a perfectly representative sample)as a limit file, the Compute Normalize and SaveLimit commands can be used with test data run onthe golden unit. Compute Normalize can offset thecurve by any desired amount. The curve can thusbe offset upwards and the result saved as an upperlimit. Compute Normalize can then be used againto offset the curve downwards and this result savedas the lower limit.
24.4. Running Tests With Limits
When measurements are made at values of the in-dependent variable (horizontal axis) which fall be-tween data points in the limit file(s) in use, interpola-tion will be made between the two “bracketing”limit points to obtain a limit number for comparison.Log-log interpolation (logarithmic on both horizon-
tal and vertical axes) will be used if both limit filepoints are positive values. If either limit file pointis zero or negative, lin-lin interpolation will beused. The values in limits files must be arrangedmonotonically; that is, in continuously increasing orcontinuously decreasing order, with no reversals.Maximum testing speed will occur if the limits fileand the test file proceed in the same direction. If itis desired to see any errors indicated while the testis in process, the test must specify DISPLAY TA-BLE rather than graphic form. If the data is dis-played graphically, however, the comparisons willstill be made and an error file will still be generated.
It is also possible to show the limits graphicallyon the screen and then plot test data onto the samescreen. With VGA and EGA color displays, thelimit(s) will graph in a different color from the data.Displaying any attached limits is done by pressing<Alt><F7>. Only the first 200 points of a limit file(the memory-resident portion) will graph when<Alt><F7> is pressed. The test is then run as usualby pressing <F9>. If the sweep-erase-repeat cycleof testing is desired (typically for making adjust-ments), the keystroke sequence <Alt><F7><Alt><F8> <Alt><F9> will graph the limits, storethem in video memory, and then run the repeatingsequence. Note that sweep-erase-repeat does notfunction if S1.EXE was started with the /8 DOScommand line option to conserve memory.
The error file is an ASCII file and can be dis-played via any editor, or printed to an attachedprinter via the usual DOS commands. A file usedas a limit must either be in the same disk directoryas the file using it, or its location must be identifiedwith a specific path name.
When a sweep is initiated (F9, F7, etc.) with atest file which has limit files attached, System Onewill load the limit file(s) into memory up to the first200 points (if standard memory allocation was usedat start-up). This helps tests with limits attached torun almost as rapidly as those without. If limit fileslarger than 200 points are used, the computer mustaccess the disk-stored limit files and operation willslow down markedly. See the TESTING SPEEDchapter for more details. It is possible to specify
ACCEPTANCE TEST LIMITS 24-3

much larger numbers of points to automatically loadinto memory. See the “Controlling Memory Usage”section of the CREATING YOUR CUSTOM SOFT-WARE START-UP PROCESS chapter, on page 28-5, for more details.
24.5. Master Error Files
A given error summary file may be attached tomore than one test file by using the Names Error-file command on each xx.TST file as it is created.When tests are run, new error data is appended toany existing data in the named error file, rather thanreplacing it. It is thus possible to run a sequence oftests (see the PROCEDURES chapter following) inwhich many or all of the tests name the same errorfile. The result will be an error file listing every de-viation from limits for the entire sequence of tests.Even a test which is successfully passed with no out-of-limits measurements will produce a three-line list-ing in the error file, including the name of the test,the date and time it was run, the column heads show-ing the measured parameters and the independentvariable, and a message stating that all values werewithin limits. An error file can thus become themaster test record, showing all deviations and alltests for which no deviations occurred. Since the ap-pending process will go on indefinitely, you will nor-mally wish to begin the procedure with a DOS com-mand which erases the existing error file for a cleanstart. Using the example file name from the preced-ing paragraph, the line in the procedure could be:
DOS ERASE ERRSUMRY.TXT/R
If it is desired to temporarily “disconnect” the er-ror file while a test is run, the Names Off commandcan be used. This is normally necessary when theCompute command will be used to process raw databefore decisions or actions based on limit compari-son. In these cases, the error file should not be writ-ten into until after the Compute operation. AfterCompute Xxxxx, the error file can be re-connectedvia Names Error-File <Enter>. An F7 operationwill then compare the adjusted data to the limits andwrite the appropriate message into the error file. Ina procedure (see next chapter), the sequence wouldbe:
LOAD TEST testname/RNAMES OFF/F9/ECOMPUTE XXXXXXNAMES ERROR-FILE/R/F7/E
24-4 Audio Precision System One User's Manual

25. PROCEDURES
A procedure, in System One terminology, is afile which executes an entire series of tests and othernecessary actions in a specific order. The proceduremay include:
• loading and running xx.TST files (with orwithout upper and lower limits and error-mes-sage files attached)
• calling and running sub-procedures
• branching to different procedures or differentportions of the same procedure, depending onwhether the preceding test contained any out-of-limits measurements
• branching dependent upon which keyboardnumber key the operator presses, permittingconstruction of menus
• jumping to any arbitrary point, or looping
• changing setup panel fields of a test
• making prompting messages to an operator
• controlling an external device via the PORTOUT capability of the DCX-127, a spare paral-lel (printer) port on the computer, or a pur-chased interface card
• delays and pauses between steps
• issuing DOS commands to erase files, changesub-directories, run other programs, and ac-complish actions such as data print-out or filemanagement.
Procedures are particularly useful in productiontest and quality assurance applications, so that a non-technical operator can perform complete tests on anitem to standards established by the Production TestEngineering or Quality Assurance departments. Pro-cedures are also highly useful in the Engineeringlaboratory for any repetitive testing such as perform-ance measurements during environmental tests or
for evaluation of multiple samples of components,and for quick checkout of devices in Maintenanceshops.
25.1. Loading and RunningProcedures
Previously-saved procedures may be loaded via<L> <P>, selecting the desired procedure with thecursor, and pressing <Enter>. The procedure canthen be run via <R> <P>, or by pressing <Enter>twice since Run is the first item in the CommandMenu and Procedure is the first item in the Runmenu. Thus, after pressing <L> <P> and movingthe cursor onto the desired procedure name, threeconsecutive operations of the <Enter> key will loadand run the procedure.
If attempting to run a procedure results in the er-ror message “Procedure Buffer Empty or Invalid”,there are two probable reasons. A conflict betweenthe S1 software version in use and the version underwhich the procedure was stored is the most likelyreason. Whenever a procedure is created, the firstline contains a reference to the software version inuse (PROCEDUREv2.10, for example). If an at-tempt is made to run a procedure created under ver-sion 1.60 or 2.00 with version 2.10 software, the er-ror message will result. The “Procedure BufferEmpty or Invalid” error can also result if the firstline of a procedure is blank due to inadvertent useof the <Enter> key in Edit Procedure mode. Thispushes the procedure header line down into the sec-ond line of the buffer. The cure is to pull the headerback up into the first line with the <Del> key.
If the procedure is otherwise compatible with thesoftware version currently in use, the cure is to sim-ply change the version number of the procedureheader in Edit Procedure mode and then re-save theprocedure, replacing the earlier version.
25-1

Earlier procedures are normally compatible withlater software versions except for two possible rea-sons:
• use of keystroke movements on the panel dur-ing the procedure
• use of any of the commands NAMES ER-ROR-FILE, NAMES GEN1#1-EQ, orNAMES RENAME
In the case of keystroke movements on the panel,incompatibility may exist where new fields or addi-tional choices have been added. The section of theprocedure must be replaced with a new section withthe correct number and type of keystrokes. The newPanel Mnemonics feature of two-character key-strokes to jump to key panel fields may be used toreplace the original keystrokes, resulting in faster op-eration, a more self-documenting procedure listing,and greater likelihood that future changes will notbe necessary even if new panel fields are added infuture software revisions. See page 25-10 for a de-tailed discussion of the two-character Panel Mne-monic codes feature.
25.2. Generating Procedures
Procedures may be generated in one of two fash-ions: by “recording” a series of key-strokes as youproceed through the set of actions which you wishto be accomplished automatically, or by using theEdit Procedure editor to create the procedure. Thekeystroke recording process is typically simpler andmore error-free when creating a new procedure.Making small changes in an existing procedure iseasily done in the Edit Procedure mode.
25.2.1. Generating Procedures byLearning Keystrokes
The keystroke recording process is both startedand stopped from the Util command of the top levelmenu. Util Learn is the command to begin record-ing a sequence and Util End is the command tostop. When completed, a procedure can be run be-fore saving it by the Run Procedure command fromthe top level (COMMAND) menu. After any neces-
sary de-bugging, Save Procedure will save the proce-dure to disk under a name you supply; the systemsupplies the xx.PRO file type automatically. EditProcedure is used to examine or edit the procedure,whether it was generated by learning keystrokes orfrom the editor.
After starting the keystroke recording processwith Util Learn, simply press the keys and type inthe file names as you would when going through thesame actions one step at a time. File names shouldbe specified by explicitly typing in the name, ratherthan using the arrow keys and <Enter> to select aname in the displayed directory. The reason for thisis that arrow key operations are recorded duringLearn mode as relative movements sideways or upand down. Any additions or deletions to a direc-tory, or changes in the beginning cursor position,will cause faulty operation of a pre-recorded arrowkey sequence. Remember to use the <Esc> key asnecessary to move to the top level menu before en-tering a menu command by pressing its first letter.Enter menu items via their first letters, rather thanthe space bar and <Enter> technique.
25.2.1.1. Learn Mode Procedure Ex-ample
An example is probably the best way to see howa procedure is generated. If any procedure has al-ready been loaded into the procedure buffer, itshould be deleted before starting to generate a newprocedure, since the new procedure will otherwiseappend to the bottom of anything presently in thebuffer. Use the Edit Procedure menu commands tocheck for existence of a procedure, and the <F6>key to mark its beginning and end for deletion ifnecessary.
Assume that we desire to test a power amplifierby measuring frequency response, distortion versusfrequency at maximum output power, and distortionversus amplitude at a fixed frequency.
First, create a frequency response test. In Panelmode, set the generator amplitude, output configura-tion, analyzer units and detector type, sweep endpoints and number of steps, etc. Run the test to besure it works; make any necessary changes, and
25-2 Audio Precision System One User's Manual

Save the Test as (for example) RESPONSE.TST.Similarly, set up the panel for a distortion versus fre-quency sweep and save it as THDVSFRQ.TST. Cre-ate a panel for a distortion versus amplitude sweepat a constant 1 kHz, and store it asTHDVSAMP.TST. You are now ready to create theprocedure.
Use <Esc> to go to the menu. To erase any pro-cedure in the procedure buffer, press <E> <P> forEdit Procedure. Use the <Ctrl><PgUp> keys tomove to the top of the buffer. If any text is in thebuffer, use the <F6> key to eliminate it. When thebuffer is empty, use the <Esc> key to go to themenu.
Press the keys <U> <L> for Utility Learn. Thename of the menu (COMMAND in the case of thetop level menu) will change appearance to indicatethat the system is learning your keystrokes. Pressthe keys <L> <T> for Load Test. Type in the testname RESPONSE, followed by the <Enter> key.Do not use the cursor to select RESPONSE.TSTfrom the directory on screen, but type in the explicitname. It is not necessary to add the .TST extension.Press the <F9> key to run the test. It is not neces-sary to wait for the test to run; press <Esc> to returnto the menu. Press the keys <L> <T> for LoadTest, and type in the test name THDVSFRQ, fol-lowed by <Enter>. Press <F9> and <Esc>. Press<L> <T>, type in THDVSAMP, and press <Enter>.Press <F9> followed by <Esc>. To halt the key-stroke learning process, press <U> <E> for UtilityEnd. The name of the menu will stop flashing.
To see the results of the keystroke learning proc-ess, press <E> <P> for Edit Procedure. You shouldsee a listing similar to Figure 25-1. Note that the
system automatically performs a number of actionsto make the procedure listing more readable; thecomplete command LOAD TEST is written out, forexample, even though only the keys <L> <T> werepressed during creation of the sequence. /R is in-serted for an operation of the <Enter> (<return>)key, and /E for the escape key. The header is auto-matically generated by the Util Learn command.Line feeds are inserted for readability.
To save this procedure to disk, <Esc> Save Proce-dure and supply an appropriate file name. To runthe procedure, <Esc> Run Procedure. You shouldthen see all of the actions which you entered pro-ceed in order, with each test being graphed or pre-sented in tabular format, as set up in each test.
25.2.2. Creating or ModifyingProcedures in Edit Mode
Some people may prefer to create the entire pro-cedure by typing in the commands, rather than usingUtil Learn mode. Procedures created in Learn modemay require corrections and modifications, whichare usually most easily done in Edit Mode.
To edit any procedure, load it via Load Procedureand select Edit Procedure to display the contents inthe procedure editor. Operation of the editors is de-scribed in the MENUS chapter, and the Help Editfunction lists the control keys useful in this mode.Upper-case versus lower-case characters are not im-portant in a procedure.
Figure 25-2 shows in the first column how vari-ous commonly-used keys are represented in Edit Pro-cedure mode. The second column shows how theyare shown in this manual text, and the third columnbriefly explains their function.
Certain keyboard codes cannot be generated inEdit mode by pressing a single key, but may be gen-erated in Util Learn mode. These include key-strokes such as produced by the <Ctrl><Home>keys, <Del> key, <PgUp> key, etc. You can useUtil Learn to start learn mode, press each of the nec-essary keys in order, stop learn mode via Util End,and then use the <F6> and <F5> “cut and paste” ca-
PROCEDUREv2.10LOAD TEST RESPONSE/R/F9/ELOAD TEST THDVSFRQ/R/F9/ELOAD TEST THDVSAMP/R/F9/EUTIL END
Figure 25-1 Keystroke-Generated Procedure Listing
PROCEDURES 25-3

pability in Edit Procedure mode to move and copythese keystroke symbols to the desired locations. Al-ternately, some ASCII text editors (but not Edit Pro-cedure mode) can generate these keystrokes by hold-ing down the <Alt> key while entering via the nu-meric keypad a two or three digit number which rep-resents the ASCII code for the particular symbol.The first column of Figure 25-3 shows a number ofthe graphic symbol representations. The second col-umn shows which keystrokes in Util Learn modethese symbols correspond to. The third columnshows the ASCII code whereby they may be enteredin ASCII text editors, while the last column brieflydescribes their function.
25.3. Adding to Existing Procedures
Additions to an existing procedure may be madeby learning keystrokes or in edit mode. Additionsby learning keystrokes can be made with Util Learn,the keystrokes, and Util End; this will append thenew information to the end of the procedure pres-ently in the Edit Procedure buffer. You can thenuse Edit Procedure to delete the UTIL END fromthe original procedure and the header inserted by thelatest Util Learn command. If the new addition is tobe located somewhere other than at the end of theexisting procedure, use <F6> to remove the new ad-dition to the delete buffer, then move the cursor tothe desired place and copy the new addition back
Procedure ManualListing TextAppearance Representation Function——————— —————————-—————
/F10 <F10> Pause/A9 <Alt><F9> Run sweep, erase repeating test/C9 <Ctrl><F9> Run test without erasing previous dat/F9 <F9> Run test/S9 <Shift><F9> Run external test, terminate on reversal to generator panel frequency/A8 <Alt><F8> Store graphic image of screen/F8 <F8> Display stored graphic image/A7 <Alt><F7> Graph limits/F7 <F7> Re-graph data in memory/F6 <F6> Re-transform (DSP only)/A6 <Alt><F6> Re-send data to PC without new transform (DSP)/F4 <F4> Set analyzer dBr reference/A4 <Alt><F4> Set analyzer relative frequency reference/F3 <F3> Set generator dBr reference/A3 <Alt><F3> Set generator relative frequency reference/C3 <Ctrl><F3> Initiate one REGULATION cycle/F2 <F2> Display bargraph/A1 <Alt><F1> Abort procedure without turning generator off/F1 <F1> Turn off generator and abort procedure/E <Esc> Go to command menu/R <Enter>* <*> Dump screen to printer
Figure 25-2 Special Keystroke Appearance in Procedure Listings
25-4 Audio Precision System One User's Manual

from the delete buffer with the <F5> key. Theheader and UTIL END from the addition can be de-leted after it is moved.
If you add portions of a procedure in the Edit Pro-cedure mode rather than via keystrokes, rememberthat you must explicitly type /R wherever you wantthe <Enter> key action to occur, such as when enter-ing a file name. Pressing the <Enter> key while inEdit Procedure mode simply starts a new line in thelisting, but will not be interpreted as an <Enter> ac-tion when the procedure runs. If you delete portionsof a procedure in Edit Procedure mode, rememberthat the first line must always remain PRO-CEDUREv(x.xx), where (x.xx) is the System Onesoftware version. If the first line is blank or con-tains other data, an error message will be obtainedwhen attempting to run the procedure.
Anything inserted after a semi-colon (;) on a linewill be ignored when a procedure is run. The per-son creating the procedure can thus add remarks to
help him or someone else to later understand justwhat the procedure does. Note that System Onesoftware’s interpretation of the semi-colon meansthat a semi-colon may not be used as part of a UtilPrompt or Util Message, since nothing following iton the same line will be displayed or printed.
25.4. Program Flow Control
The basic flow of a System One procedure is lin-ear, from top to bottom. Each line in the procedurewill be executed in order unless flow is diverted byanother command such as UTIL GOTO, RUNCALL, RUN EXIT, LOAD PROCEDURE, or an IFstatement.
Figure 25-3 Screen Appearance of Keystrokes Which May Be Used in Procedures and Macros
PROCEDURES 25-5

25.4.1. Jumping to AnotherLocation: UTIL GOTO
The Util Goto statement followed by a line labelwill cause procedure flow to jump to the line carry-ing that label. A label in a procedure is indicated bythe colon (:) symbol at the beginning of the line, fol-lowed by the label (name) and the /R symbol for<Enter>. The /R following the label name is criti-cal. Thus, a procedure as shown in Figure 25-4 willrun in a continuous loop. After loading and execut-ing the test, the Util Goto line will cause it to jumpback to the STARTHERE label and repeat forever.
25.4.2. Conditional Branching: IF
To permit change of procedure flow dependingupon a test passing or operator keyboard input, theIF commands are part of System One’s procedure“language”.
Four IF commands will cause conditional actiondepending upon how all measurements of the imme-diately-preceding test related to any LIMIT files at-tached to that test. These four IF commands are IFERROR[, IF NOTERROR[, IF ABOVE[, and IF BE-LOW[. Note that all IF statements have the squarebracket ( [ ) as their last character. There cannot beany spaces between the last alphabetical characterand the bracket. The conditional action statementmust then be terminated by a left-facing squarebracket ( ] ). For example:
LOAD TEST xxxx/R/F9/EIF ERROR[ UTIL GOTO DIAGNOSTIC/R ]
where DIAGNOSTIC might be the line label of an-other section of the procedure which loads a test tohelp the operator diagnose the source of the problem.
25.4.3. Conditional Branching UponOperator Input
An additional set of IF statements permits an op-erator keyboard input to control the procedure flowduring execution. This capability allows the con-struction of menus within a System One procedure,simplifying use of procedures by less-experiencedoperators. These IF statements are the ten com-mands from IF 0[ through IF 9[. As with the otherIF statements, the square brackets must surround theportion describing the conditional action, and theleading bracket cannot have any space between itand the numeral.
The <Ctrl><F10> keystroke ( /C10 in the proce-dure editor) creates a pause in the procedure, wait-ing for operator input. Any key other than the tennumeral keys will be ignored. Any number keypressed causes the procedure flow to jump to thestatement inside the square brackets of the IF n[statement corresponding to the number key pressed.
A simple example of use of this technique mightbe:
UTIL PROMPT/RDID RED INDICATOR ILLUMINATE?PRESS 1 FOR YES, 0 FOR NO/C10/EIF 0[ UTIL GOTO FAILURE/R ]IF 1[ UTIL GOTO SUCCESS/R ]
SUCCESS and FAILURE would be line labelsfor different portions of the procedure which will beexecuted depending upon the operator’s observationof the indicator and consequent keyboard input.
25.4.4. Sub-Procedures
The procedure flow described in the two preced-ing simplified examples used the UTIL GOTO state-ment to jump to another portion of the procedure;they ignored what might happen after that portionwas executed. A common requirement is for condi-
PROCEDUREv2.10: STARTHERE/RLOAD TEST firstest/R/F9/EUTIL GOTO starthere/RUTIL END
Figure 25-4 Procedure for Continuous Loop
25-6 Audio Precision System One User's Manual

tional action to be taken, but for the program flowto then return to the point immediately after the con-ditional action was requested. The RUN CALL andRUN EXIT commands allow this sub-procedureflow.
RUN CALL, followed by a sub-procedure nameand <Enter>, causes the named sub-procedure to beloaded and executed. A sub-procedure is identicalto any other System One procedure except that itmust contain a RUN EXIT statement following itsother actions. The RUN EXIT statement jumps con-trol back to the calling procedure at the point imme-diately following the RUN CALL statement whichcalled it. A sub-procedure must have a UTIL ENDstatement as their final line, following the RUNEXIT statement.
A sub-procedure may be nested, meaning that itcan be called from another sub-procedure. In thatcase, the RUN EXIT statement in the second sub-procedure will return control to the calling point inthe first sub-procedure. The first sub-proceduremay then execute additional commands if desired,with control finally being returned to the main proce-dure when the RUN EXIT statement in the first sub-procedure is reached. Sub-procedures calling sub-procedures may be extended to a depth of fifteensub-procedures.
25.4.4.1. Sub-Procedure Example:Printing Only Upon Error
In production testing applications, it is frequentlyconvenient to print an error message only if a devicefails a test. If all tests are passed, the device will beshipped. If any test fails, the resulting paper print-out will be attached as a failure tag and the devicewill be returned to a repair station where the failuretag helps with the diagnosis.
The sub-procedure capability (RUN CALL) ofSystem One software, coupled with several features,simplifies this process. The main procedure (seeFigure 25-5) is a straight-forward process of loadingeach test and running the test. It assumes that eachtest has limit files attached, but no error file. Fol-lowing the /F9/E which runs the test and returns tothe menu, the RUN CALL PRINTERR/R statementcalls the sub-procedure PRINTERR.PRO which willcause a printout only if any data point failed the lim-its.
The sub-procedure called PRINTERR.PRO isshown in Figure 25-6. Whenever this sub-procedureis called, it does nothing but return control to themain procedure if there was no error in the test justperformed. If an error occurred, the IF ERROR[statement names PRN (the DOS identification for anattached printer) as the “error file”, performs an /F7to re-compare the data to limits, and prints the errorfile which contains out-of-limits readings along withtest name, date, and time. The RUN EXIT state-ment (required in all sub-procedures) then returnscontrol to the calling point in the main procedure.
PROCEDUREv2.10LOAD TEST 1/R/F9/ERUN CALL PRINTERR/RLOAD TEST 2/R/F9/ERUN CALL PRINTERR/RLOAD TEST 3/R/F9/ERUN CALL PRINTERR/RUTIL END
Figure 25-5 Main Procedure to Accomplish Testing(Against Limits)
PROCEDUREv2.10IF ERROR[NAMES ERR-FILE PRN/R/F7/E]RUN EXITUTIL END
Figure 25-6 PRINTERR.PRO; Sub-Procedure toPrint Only Upon Out-of-Limits Measurements
PROCEDURES 25-7

25.4.5. Example: Looping On Error
During production testing or maintenance activi-ties when the device under test has adjustmentsavailable, it is often desirable to test in this sequence:
1. Test to acceptance limits2. If device passes, move on to next test3. If device fails, ask operator to adjust,then loop back to (1) and test again
Furthermore, it may be desirable to loop back far-ther than the last test when it is known that the ad-justments may also have affected a still-earlier test.Figure 25-7 shows an example procedure for thistype of application.
If the device passes all three tests (1.TST, 2.TST,and 3.TST), no branching will take place. If anytest fails, the following IF ERROR[ statement callsa sub-procedure consisting of appropriate tests, per-haps with bargraph (F2) displays and promptingmessages, to help the operator perform the adjust-ments. When the sub-procedure is completed andflows to its RUN EXIT statement, control is re-turned to the calling point in the main procedure.
For this example, it was assumed that the adjust-ments called for by sub-procedure ADJUST2.PROcould only affect the results of test 2.TST, but thatthe adjustments called for by sub-procedure AD-JUST3.PRO could potentially affect measurementsmade by both 2.TST and 3.TST. Thus, the UTILGOTO statement inside the IF ERROR[ brackets fol-lowing test 2.TST loops back only to the label :SECOND, while the UTIL GOTO statement after3.TST also loops back to the label : SECOND andwill thus cause both 2.TST and 3.TST to be repeated.
25.4.6. Sub-Procedure Example:Test Menu
An example incorporating both the IFn[ branch-ing upon operator input and sub-procedures isshown in Figure 25-8. The prompt showing the test
PROCEDUREv2.10: first/r LOAD TEST 1/R/F9/EIF ERROR[ RUN CALL adjust1/rUTIL GOTO first/R]: second/rLOAD TEST 2/R/F9/EIF ERROR[ RUN CALL adjust2/rUTIL GOTO second/R]: third/rLOAD TEST 3/R/F9/EIF ERROR[ RUN CALL adjust3/rUTIL GOTO second/R]UTIL END
Figure 25-7 Procedure to Assist Operator to AdjustUpon Failure, Then Re-Test
PROCEDUREv2.10: begin/rUTIL PROMPT /R/R
CHOOSE DEVICE TO TEST/R/R/R 0. Exit Procedure/R
1. MODEL 14/R2. SYSTEM EIGHT/R3. XYZ-120/R9. Quit System One software/R
/R/R
Press the appropriate number key/Rto select the test./C10/E
IF 1[RUN CALL model14/R ]IF 2[RUN CALL system8/R ]IF 3[RUN CALL xyz-120/R ]IF 0[util break]IF 9[QUIT]UTIL GOTO begin/r ;returns to menu if /R
;any other number selectedUTIL END
Figure 25-8 Procedure to Display Test SelectionMenu
25-8 Audio Precision System One User's Manual

menu is preceded by the line label BEGIN. Notethat the line label must be followed by the /R codefor <Enter>.
The menu prompt shows the three test typechoices (1, 2, and 3) plus the options of 0 to exitfrom the procedure and 9 to quit from S1.EXE soft-ware to DOS. The <Ctrl><F10> keystroke (/C10 inthe procedure listing) causes the software to pausefor a number key input from the operator. The IF1[, IF2[, and IF3[ statements each call a sub-proce-dure which would consist of the appropriate seriesof tests and other actions for the device to be tested.Each of those sub-procedures must contain the RUNEXIT statement following all their other actions.
The IF0[ Util Break ] statement halts the proce-dure. The IF9[ Quit ] statement quits from S1.EXEback to DOS. Non-number keys are ignored. Anynumber key without a corresponding IFn[ statementwill bring the procedure to the UTIL GOTO BE-GIN/R statement just before UTIL END; that state-ment takes the procedure back to the menu for an-other choice.
25.5. Changes in Panel SetupDuring a Procedure
When changes in panel setup are desired, it isgenerally preferable to create each desired setup inPANEL mode and save it as a xx.TST file beforethe procedure generation is begun; then simplyLOAD the xx.TST file to bring in the setup. Forcertain applications it may be desirable to makechanges in a panel setup as part of a procedure. Ar-row keystrokes, space bar operations, <+> and<Del> keystrokes, and <Enter> keystrokes can be re-corded in Util Learn mode, just as any other key-stroke. Since the cursor position is not stored fromtest to test, any series of arrow keystrokes to be re-corded in a procedure must be preceded with<Ctrl><Home>, which will put the panels in the nor-mal (power-up) reference position with the cursoron the generator OUTPUT field.
Figure 25-9 Two-Character Codes to Jump to Panel Fields
PROCEDURES 25-9

25.5.1. Two-Character Codes toJump to Panel Fields
Many of the most-used panel fields also have two-character mnemonic abbreviations which cause thecursor to jump directly to that field when typed inPANEL mode. Figure 25-9 is a listing of those ab-breviations. This same listing can be instantly dis-played on screen in PANEL mode by pressing the<?> key, or is available from the menu via HELPPANEL. The two-character method of jumping to afield is not only faster than a series of arrow key-strokes, but the resulting procedure listing is moreself-documenting (easier to read and interpret).Fields which cannot be directly accessed with a two-character code can be reached by jumping to thenearest field which has a code, then using arrowkeys to move to the desired field.
The most reliable selection of choices from a mul-tiple-choice field is accomplished by first using a<Ctrl><Left Arrow> keystroke to jump to the left-most end of the selections. The <+> key can thenbe used to move to the selection, followed by the<Enter> key to make the new selection. This tech-nique can guarantee that a particular selection willbe made, regardless of the previous selection in thatfield. If only the <+> or <Del> keys are used afterjumping to a field, they will create a relative changein the choices rather than an absolute choice. Forexample, assume that it is desired to change the DIS-PLAY field of the SWEEP (F9) DEFINITIONSpanel to TABULAR. If this panel field was inCOLOR-GRAPH mode when the procedure wasgenerated in UTIL LEARN mode, the keystroke se-quence would be <S><D> <+> <+> <Enter> (jumpto Sweep Display field, change to the choice twoitems to the right, and select it). If this procedure islater run on a test which was in MONO-GRAPHmode, the “two choices to the right from existingchoice” technique will select DISPLAY NONE. Ifinstead the sequence learned is <S><D> <CtrlLeftArrow> <+> <+> <Enter>, the selection will beTABULAR regardless of the previous choice, sincethe <Ctrl LeftArrow> will always jump the choicescursor to the beginning of the line and the <+> <+>will always move it two choices to the right.
An alternative to two-character codes or arrowkeystrokes in many applications is the overlay capa-bility described below.
25.6. Partial Loads (Overlays) toProtect Panel Fields
It is sometimes desirable to maintain certain val-ues from one test to following tests in a procedure.
An example occurs in compact disc player test-ing. One track on a test disc will contain a refer-ence level track, typically 0 dB (maximum level) at1 kHz. Several tests may need to be referred to thislevel, such as quantization distortion, linearity, andS/N ratio. Each of these tests would be a separatexx.TST file, but it would be preferable to set the ana-lyzer dBr REFERENCE value from the referencetrack only once and then retain that dBr REFER-ENCE value through the several tests.
Another example of overlay use is when desiringto make several successive types of distortion testsin a procedure on the same device, such as THD+Nversus amplitude, followed by SMPTE versus ampli-tude, followed by DIM versus amplitude. Instead ofgoing to the effort of setting up three separate testswith the appropriate values of impedances, frequen-cies, sweep limits, graphic coordinates, etc., the sec-ond and third tests could be set up as nearly-blankoverlays which specify only generator WAVE-FORM, FREQUENCY, and IMD frequency plusanalyzer function. When these overlays load follow-ing a properly-set up THD+N test, they will leaveunchanged all other parameters from the previoustest.
The overlay capability of System One permits re-taining earlier-established fields. An overlay file(xx.OVL) is identical to a test file (xx.TST) exceptthat one or more fields have been “punched out”.The Load Overlay menu command functions simi-larly to Load Test, but shows only a directory of thexx.OVL fields in the current directory. When anoverlay file is loaded, it leaves unmodified the val-ues which the previous test had established in those“blanked” fields. An earlier-established parameterin any field can thus remain through a series of tests
25-10 Audio Precision System One User's Manual

as long as each of those tests is an overlay with thefield punched out, rather than a complete test filewhich specifies every field on every panel.
25.6.1. Creating Overlays
An overlay file is created like any other test file,by setting all the required conditions with use of thecursor. To punch out a field so that it will not mod-ify values established earlier in a sequence of tests,put the cursor on the field and press <Alt><P>(Punch). To restore a previously punched-out field,put the cursor on it and press <Enter>. If most ofthe fields on the panels are to be punched out, it willbe faster to blank the entire set of panels with<Alt><B> (Blank), then to restore only the desiredfields by putting the cursor on each and pressing<Enter>. To restore all punched-out or blankedfields, press <Alt><R> (Restore). When an overlayfile has been created, the Save Overlay commandmust be used to save it to disk. If Save Test is at-tempted, an error message will result telling you thatpanels with one or more fields punched out can onlybe saved as overlays.
The Help Overlay command will display the func-tions of the keys used with Overlay mode.
25.6.2. Appearance of Blanked Fields
The appearance of a “blanked” or “punched-out”field depends on the type of display system used inthe particular computer. It can be controlled by theuser within the limits of the display system. WhenSystem One is loaded normally (by S1 <Enter>,with no V command line options), punched-outfields will be underlined on a Hercules monochromedisplay system, dark blue on black on an IBM colorgraphics system with color monitor, and dimly vis-ible on a Compaq CGA-compatible monochromedisplay system. This condition is represented asnumber 1 (decimal) of a possible 256 conditions.
Other appearances may be preferable to individ-ual users. On color monitors, the 256 differenttypes of appearance are the various combinations ofeight foreground colors, eight background colors,two levels of intensity, and blinking versus steady il-lumination. These combinations are internally con-trolled by an eight-bit word as shown in Figure 25-10.
For example, an intense red foreground on ablack background, flashing, would be defined by thebinary word 10001100 (decimal 140). Non-flashinggreen, normal intensity, on a magenta backgroundwould be represented as 01010010 (decimal 82).
| MSB | | | | | | | LSB |
| Flash | Background Color | Intensity | Foreground Color |
Three Bit Color Code Color—————————— ——-000 Black001 Blue010 Green011 Cyan100 Red101 Magenta110 Brown111 White
Figure 25-10 Overlay Panel Video Attributes
PROCEDURES 25-11

Any desired appearance that you prefer to the nor-mal power-up default can be selected each time youload S1. Type the command line option /V# (Vstands for video) after typing S1 and before pressing<Enter>, where # is the decimal number derived asdescribed above. To choose non-flashing,normal in-tensity green on a magenta background for thepunched-out field appearance, for example, start Sys-tem One software by typing
S1 /v82 <Enter>.
To view the various combinations on your com-puter, punch out several fields (or blank the entirepanel with <Alt><B>). Then press <Alt><A>(Add) to cycle upwards or <Alt><S> (Subtract) tocycle downwards through the possibilities.<Alt><Z> (Zero) will re-set the video attribute tothe decimal zero condition. This is blank on mono-chrome monitors and black foreground on blackbackground on color monitors. Appearances of par-ticular value on Hercules monochrome systems aredecimal 0 (blank), decimal 1 (underline), and deci-mal 112 (inverse video). Appearances worth consid-ering on a Compaq display system are 0 (blank), 3or 4 (dim), 15 (intense), 131 or 132 (dim flashing),135 (normal intensity flashing), and 143 (intenseflashing).
25.7. Interrupting or PausingProcedures
To pause during execution of a procedure, pressthe <F10> key. <F10> is a toggle; when pressedagain, the procedure will resume execution. If it isnecessary to abort a procedure before it is complete,the <F1> Function Key (generator off, when inpanel mode) works as a procedure abort key andalso turns off the generator output. If you wish toabort the procedure without turning off the gener-ator, press <Alt><F1>. If you go into Edit Proce-dure mode after aborting a procedure, the cursor inthe procedure editor will be at the point where theprocedure was interrupted.
25.8. Prompts, Pauses, and Delays
To create a prompting message to the test opera-tor, use Util Prompt and type in the message, termi-nating it with an <Esc>. For example:
UTIL PROMPTSET FADER TO 40 DB AND PRESS EN-TER KEY WHEN READY <Esc>.
When the procedure is executed, the message willdisplay on the screen and the procedure will pauseuntil the operator presses the <Enter> or <Esc> key.Do not use a semi-colon as part of a prompt mes-sage; the semi-colon is reserved in the System Oneeditor to set apart remarks from the instructionswhich will be acted upon.
A pause (until operator presses the <Enter> or<Esc> key) can be inserted at any desired place in aprocedure by inserting an <F10> key operation.When the procedure is executed, it will pause at thatpoint until <Enter> or <Esc> is pressed. This pausecan be inserted for operator input; for example, theoperator can be asked to insert a filename or otherinformation needed by the system to continue withthe procedure.
A procedure can load a test, go to PANEL mode,move to a numeric entry or multiple choice field us-ing two-character mnemonic commands or key-strokes, and then insert <F10>. When this proce-dure is executed, it will pause at that point for theoperator to enter a new value or choice (or signifyapproval of the existing choice by pressing <Enter>.
PROCEDUREv2.10LOAD COMMENT NULL/REDIT COMMENTTEST DATA, MODEL 123 POWER AMPLIFIER /ROPERATOR NAME: /F10/RAMPLIFIER SERIAL NUMBER: /F10/R/ESAVE COMMENT HEADER/RYUTIL END
Figure 25-11 Procedure for Operator Entry of Infor-mation
25-12 Audio Precision System One User's Manual

See the sections Creating a Form to be Filled Inand Storing Data in Subdirectories, below, for exam-ples of how pause and operator input might be used.
A specified time delay between other actions of aprocedure may be created in a procedure by use ofthe Util Delay command from the menu. For exam-ple, the keystroke sequence <U><D>3 <Enter> willcause a 3 second delay at the point in a procedurewhere it is executed.
25.9. De-Bugging Procedures bySingle Stepping
Like other forms of computer instructions, proce-dures may not always do what their creator intendedand must be de-bugged. It is frequently difficult tode-bug procedures because many actions take placetoo fast to be observed, especially with faster com-puters such as AT and 386 compatibles. Proceduresmay be operated in a single-step mode by first start-ing the procedure, pressing <F10>, then single-step-ping by repeatedly pressing <Alt><F10>. This willcause the procedure to be executed step by step. In-formation which was typed in from the keyboard,such as operator prompts and file names to beloaded, will execute character by character as<Alt><F10> is pressed. A procedure may be editedfor de-bugging by inserting an /F10 at the desiredpoint to pause, after which manual <Alt><F10> op-erations from the keyboard will cause single steps.Normal procedure operation can be resumed bypressing the <F10> key.
25.10. Creating a Form to be Filled In
It is possible for a procedure to include a form tobe filled in by the operator with information such asoperator’s name, serial number of the device undertest, or any other desired information. The form canbe saved or printed out with an error file at the endof a procedure. Such a form is created by first sav-ing an empty Comments file, then using the EditComments capability, with pauses for the operatorto fill out the items.
An example will assume that the operator’s nameand device serial number is the data to be saved in afile which will later be printed as a header to the er-ror file. To save the empty Comments file, first useEdit Comments to check whether there is currentlyany text in the comments buffer. If there is, deleteit using the <F6> key. When you have an emptybuffer, save it with an appropriate file name such asNULL.TXT by the sequence <Esc> Save CommentsNULL <Enter>; the system will automatically sup-ply the xx.TXT extension. Then, presumably at thebeginning of generating a procedure in the UtilLearn mode, create the steps shown in Figure 25-11.
The /F10 is the indication of use of the pausekey. When the procedure runs, it will pause aftertyping that line of the form on the screen. When theoperator responds by typing in his or her name fol-lowed by <Enter>, the next line will be written tothe screen. The /E after the second operator-inputline takes the system back to the menu for the com-ments file to be saved under the nameHEADER.TXT. The character Y following the /R(return, or enter) symbol is the necessary YES re-sponse to the system, giving permission to over-write the existing file named HEADER.TXT. Thiswill be necessary each time the procedure runs fol-lowing the first time.
The remainder of the procedure then follows, in-cluding all test file loading and saving. For the ex-ample, assume that at the end of the procedure wewish to print out the header generated above, fol-
DATA LINE CONNECTOR PIN————- ——————-
0 21 32 43 54 65 76 87 9
grounds 18 thru 25
Figure 25-12 Pin Connections, Parallel Port
PROCEDURES 25-13

lowed by the error file which we will assume is ti-tled ERRORS.TXT. After the last test of the proce-dure is run, the final steps could then be:
DOS COPY HEADER.TXT PRN
DOS COPY ERRORS.TXT PRN
The DOS COPY command, frequently used tocopy files between disk directories, can also copy afile to a printer. PRN is the standard designation forthe printer.
25.11. Control of External Devices
To more fully automate a test, it may be desirableto control some device external to System One dur-ing a procedure. The device under test may itself becontrollable (a remotely controlled tape recorder, forexample), or it may be desirable to control power toa circuit board, change the value of load resistanceon a power amplifier, etc. If you have the DCX-127module, it has three 8-bit ports for external devicecontrol. If your computer has an unused parallelport, it may be used as a control port in applicationswhere up to eight binary lines will satisfy the need.
The addresses of the DCX-127 output ports areA, B, and C. They may be controlled in paralleledfashion from the DCX-127 software panel, or writ-ten to during a procedure from the Util Out com-mand. See the DCX-127 chapter for more informa-tion.
The address of the parallel port (also often re-ferred to as the printer port or Centronics port) onIBM PCs and compatibles is either decimal 888,632, or 956. A schematic diagram of the pin con-nections of the parallel port is shown in Figure 25-12.
The Util Out command may be used to controlthe logic levels of any of the eight lines by writingthe appropriate (decimal) word to the port. If yourparallel port address is 956, for example, the com-mand
UTIL OUT 956,0 <Enter>
will reset all eight lines to logic zero. To turn onthe least significant bit (data 0), use
UTIL OUT 956,1 <Enter>.
To turn on the fourth-from-least and next-to-leastsignificant bits (data 3 and data 1) simultaneously,send
UTIL OUT 956,10 <Enter>.
Eight logic lines can thus be individually control-led from a parallel port, or low-power relay coilscan be driven directly from the LSTTL-compatiblelines of the parallel port. If more than eight controlstates are required, the 8-bit word could be exter-nally decoded to provide up to 256 states.
For more complex applications, or where nospare parallel port is available, several manufactur-ers make plug-in circuit cards for the IBM PC andcompatibles which have relays or logic circuits con-trollable from the computer for interfacing with ex-ternal devices. The Util Out menu command per-mits writing any data word to any port in the com-puter. Documentation furnished with the manufac-turer’s interface card should tell at what address thecard is located, and what data words are necessaryto produce the card’s various output conditions.
Util Out is the one menu command which doesnot return to the menu level immediately after com-pletion, in order to allow several consecutive com-mands in rapid sequence.
CAUTION:
Util Out must be used with caution; acci-dentally specifying an address port which isused by a hard disk drive or other criticalcomponent, or by System One itself, andwriting to that port, could cause seriousmalfunction of the computer or damage toSystem One.
25-14 Audio Precision System One User's Manual

25.12. Inserting DOS Commands ina Procedure
Many functions can be performed from DOS,such as copying, erasing, moving, or re-namingfiles, printing to a serial or parallel printer, etc. TheDOS menu command was created to let any of thosecommands be inserted in a procedure. An exampleof a DOS command could be a batch file to print anerror file at the end of a procedure, then erase the er-ror file from disk so that the same error file namecan be used the next time the procedure runs. If theerror file is named ERRORFIL, the batch file (cre-ated under Edit Comments or with another editor)would look like this:
COPY ERRORFIL.TXT PRNERASE ERRORFIL.TXT
Save this batch file under a name such as PRIN-ERAS.BAT. Then, for the last line of the proce-dure, use
DOS PRINERAS/R
Running another program as part of a procedurewill also be done via the DOS command. A com-mon example would be in using an IEEE-488 inter-face card to control another instrument such as a dcpower supply. The IEEE-488 control codes anddata processing code could be written in MicrosoftBASIC (BASICA). Another example would be run-ning a BASIC program to do smoothing or averag-ing on an ASCII data file (xx.DAT file type) justsaved from a preceding test. In either case, the teststep is included in a procedure by the command
DOS BASICA filename/R
DOS commands may also be used in conjunctionwith operator input (during a procedure pause) re-quired to complete the DOS command; see the sec-tion Storing Data in Subdirectories, below, for an ex-ample.
25.13. Limits, Error Files, and DataManagement
Procedures will commonly be used to link a se-ries of xx.TST files which have upper and/or lowerlimits attached and an error file specified. Thoughtmust be given to how the organization using SystemOne wishes to manage their test data during proce-dures. It is possible to save all data from all tests,to save all data from certain tests but not others, andto save only out-of-limits data from some or alltests. A caution is in order; it may be appealing toconsider saving all test data for possible later statisti-cal analysis, but a test system of System One’sspeed can amass huge amounts of data in a shorttime if testing is comprehensive and the unit volumeis high. Even 20 megabyte hard disks can becomefilled in a few days at realistic unit volumes if somethought is not given to the relative utility of differ-ent sorts of data. A good solution may be to testquite comprehensively in order to assure productquality, to print on paper (but not save on disk) anyout-of-limits measurements to serve as a failure tagfor the people who will repair the unit to meet speci-fications, and to then save to disk only a limitedsummary of final test data on every unit for possiblelater statistical analysis.
As noted in the ACCEPTANCE TEST LIMITSchapter beginning on page 1, out-of-limits informa-tion is appended to any specified error file each timea test is run. A useful application of this feature isto name the same error file for every test in a proce-dure. At the completion of execution of the proce-dure, the error file can then be printed as a completerecord of the unit’s quality. Tests which werepassed are documented by the test name, date andtime of testing, and a message that all values werewithin limits. Since it would probably not be desir-able for this error file to continuously grow by ap-pending data from unit after unit, the procedure will
MKDIR C:\TESTFILE\%1CHDIR C:\TESTFILE\%1
Figure 25-13 DOS Batch File to Name and ChangeSubdirectories
PROCEDURES 25-15

probably make use of the DOS menu command andDOS commands to erase any existing file at the be-ginning of a procedure.
25.13.1. Storing Data inSubdirectories
If it is desired to save test or error files on disk,but to keep the data from the tested units separatefrom one another, it is possible to use DOS sub-di-rectory naming and changing commands to create aseparate sub-directory for each unit tested. The sub-directory may be named with the serial number ofthe unit (up to eight characters); each sub-directorymay then contain error files, data files, or test fileswith identical names to other sub-directories, identi-fiable by the sub-directory in which they are lo-cated. To operate in this manner, a DOS batch file(.BAT file type) must be created and System One’sDOS menu command will be used in conjunctionwith operator input during a pause. As an example,use the Edit Comments capability to create the fileshown in Figure 25-13.
The first line is the DOS Make Directory com-mand (MKDIR); this example assumes a hard-disk-based system, and also assumes that a first-level sub-directory named TESTFILE has been created in theroot directory of disk C; see your DOS manual formore details. The \%1 following TESTFILE tellsDOS to create a second-level subdirectory under thefirst-level subdirectory TESTFILE. The %1 symbol
is a substitution command to DOS, telling it to usethe next item on the command line, following thebatch file name, in place of the %1 symbol.
If this batch file is named NEWSERIL.BAT, forexample, and you type from DOS
NEWSERIL ABCDE <Enter>
DOS will create a new subdirectory under TEST-FILE called ABCDE. The full path name specifica-tion of this new subdirectory would be C:\TEST-FILE\ABCDE. The second line of the batch file isthe DOS Change Directory command (CHDIR). Ittells DOS to change the current directory to \TEST-FILE\ABCDE, since the %1 symbol will again be re-placed by the characters which were typed in follow-ing the batch file name. Save this batch file by se-lecting or typing Save Comment and furnishingNEWSERIL.BAT <Enter> as the file name. To testits function, use the XDOS command to exit fromSystem One temporarily. At the system prompt (as-suming for the sake of example that you are in theroot directory of a hard disk based system and thatyou have already created a first level subdirectorynamed TESTFILE by using the MKDIR command),type:
NEWSERIL 12345 <Enter>
On screen, you should see the following (if theDOS command PROMPT $L$P$G has been exe-cuted so that the DOS prompt displays the currentsubdirectory along with the default disk drive desig-nation):
C: MKDIR C:\TESTFILE\12345
C: CHDIR C:\TESTFILE\12345
C:\TESTFILE\12345>
The third line indicates that the new directory isnow the current directory.
Type EXIT <Enter> to move back into SystemOne software, and create a procedure which will usethis batch file. Either Util Learn to record key-strokes, or Edit Procedure can be used to create aprocedure as shown in Figure 25-14.
PROCEDUREv2.10UTIL PROMPT/R
PRESS <ENTER> KEY/RTYPE IN SERIAL NUMBER/ROF UNIT TO BE TESTED/RTHEN PRESS <ENTER> KEY
AGAIN/EDOS NEWSERIL /F10/RLOAD TEST C:\TESTFILE\TESTSTD/R/F9/ESAVE TEST FINALTST/R
Figure 25-14 Procedure to Create Subdirectory fromSerial Number
25-16 Audio Precision System One User's Manual

This example assumes that you have already cre-ated a test called TESTSTD.TST which is stored inthe \TESTFILE subdirectory, that you wish to runthat test on each unit of a series of production itemsto be tested, and that you wish a permanent recordof that test (renamed to FINALTST.TST so as not toconfuse it with the original setup) in a subdirectorywhose name is the serial number of the unit. Any.LIM, .EQ, .SWP, etc. files used must also be storedin the \TESTFILE directory. Furthermore, this sub-directory must be specified along with the xx.LIM,xx.SWP, etc., file name when the Names menu com-mand is used. You must thus type
Names Lower \TESTFILE\AMPLOW <En-ter>
rather than the usual practice of selecting NamesLower, using the cursor to highlight the desiredlimit file name, and pressing <Enter>. The totallength of the filename and directory names, includ-ing backslashes, cannot exceed 26 characters. If thebackslash and directory name is not used, the sys-tem will look for the limit file in the newly-estab-lished subdirectory, not find it, and halt with an er-ror message. This example is simplified; a realisticapplication might perform a number of tests andstore a number of sets of results and/or error files inthe subdirectory.
The procedure works like this: the operator willbe prompted to enter the unit serial number; the firstrequested operation of the enter key is to erase theprompt and get ready to accept the serial number.The DOS NEWSERIL /F10 causes the system topause, waiting for operator input, to complete thecommand line. If the operator types in B010237<Enter>, the batch file NEWSERIL.BAT then runswith B010237 as the value to substitute for the %1symbols. A new subdirectory named B010237 willbe created in the TESTFILE first level subdirectory.That new subdirectory will be made the current di-rectory. System One will load the test TESTSTD(plus any specified .LIM, .SWP, and .EQ files) fromthe TESTFILE directory. The test will be run andthe setup and results saved. Since the Save Testcommand specifies no path name, the test will besaved in the current directory (\TEST-FILE\B010237).
When the procedure is run again and a new serialnumber entered by the operator, the process will berepeated. The test TESTSTD and associated .SWP,.EQ, .LIM, etc. files will always be drawn from theTESTFILE directory, if the path name is explicitlydesignated.
The batch file NEWSERIL.BAT must be locatedin a directory which has its path designated in a pathcommand typed in at system startup or (preferably)executed as part of an AUTOEXEC.BAT file, sothat the system knows where to look for it eventhough the current directory is being changed everytime the procedure is run. The PATH command is aDOS command to tell the system which other direc-tories to search for an executable program if that pro-gram is not located in the current directory. IfNEWSERIL.BAT is stored in a first level directorycalled UTILITY, for example, the path commandtyped or included in AUTOEXEC.BAT would be:
PATH C:\UTILITY;
25.14. System Startup WithProcedure Running
A procedure name can be typed following S1when starting System One from DOS; the result willbe System One loading the procedure and executingit, with no operator actions required to start the pro-cedure. This capability can be incorporated into anAUTOEXEC.BAT file and System One will run aprocedure automatically when the computer isturned on. See the CREATING YOUR CUSTOMSOFTWARE START-UP PROCESS chapter formore details.
PROCEDUREv2.10LOAD TEST SIGNOIRA/R/F4/F1/F9/EUTIL END
Figure 25-15 Signal to Noise Ratio MeasurementProcedure
PROCEDURES 25-17

25.15. Continuously-RunningProcedures
In a production test application, it is often desir-able for a procedure to repeat continuously as theitems to be tested flow across the test station. Acontinuously-recycling procedure is created eitherby inserting <R> <P> (Run Procedure) as the laststep of a procedure, immediately before the UtilEnd, or by using a UTIL GOTO command at thatpoint with the line label of the first line of the proce-dure. A continuously-running procedure would nor-mally start with either an operator prompt or a pause(/F10), requiring an <Enter> key operation from theoperator to signify that the next device to be testedhas been connected and is ready to go.
25.16. Signal-to-Noise Ratio Tests inProcedures
A signal-to-noise ratio test in panel mode isstraightforward; supply the specified generator am-plitude to the input of the device under test (orREGULATION mode to automatically adjust inputamplitude until a specified value of output is ob-tained from the device under test), press <F4> to es-tablish the analyzer dBr REF level at the presentvalue, turn the generator off, and read the analyzerlevel (in dBr) for the signal to noise ratio. A vari-ation on this technique can be created as a xx.TSTfile to insert in a procedure.
First, set up the System One generator panel toprovide the desired signal frequency and amplitudeto create the reference level for s/n testing. Selectthe AMPLITUDE mode of the main voltmeter, andselect the desired analyzer band limiting filters anddetector; 8 readings per second is appropriate forbandwidths down to 20 Hz. Set the SWEEP DEFI-NITIONS panel with GEN NONE selected atSOURCE-1. Select dBr for the display units.SAVE this TEST under an appropriate name (let’sassume SIGNOIRA). Now, create a procedure asshown in Figure 25-15.
Note that this technique produces a negativenumber; an 80 dB s/n ratio will be displayed as -80dBr. Thus, if you wish to establish -75 dB as theminimum s/n ratio acceptable, you must create theupper limit file as -75 dBr.
25-18 Audio Precision System One User's Manual

26. REGULATION
26.1. Introduction
Many audio measurements are made by fre-quency sweeps at a constant stimulus amplitude tothe device under test. Sometimes, however, it is nec-essary to vary the amplitude of the stimulus at eachdifferent frequency in order to produce the desiredoutput conditions from the device under test formeasurement of some parameter. Examples include:
• measuring power bandwidth: the power out-put from a power amplifier at a specified dis-tortion percentage across the audio spectrum
• measuring distortion of a power amplifier atits rated power output across the audio spec-trum, even though the frequency response isnot perfectly flat and the power output wouldthus not be held constant during a sweep atconstant generator amplitude
• making broadcast proof-of-performance meas-urements, which require measuring the fre-quency response and distortion of a broadcasttransmitter at a constant modulation percent-age at all frequencies (even though the trans-mitter has imperfect frequency response andmay also employ pre-emphasis)
• measuring the frequency response of a micro-phone at constant sound pressure level, eventhough practical loudspeakers and acousticalmeasurement chambers produce varyingsound pressure levels at different frequencies
• measuring MOL (maximum output level): theoutput level at which an analog tape recorderand tape produce 3% distortion across theaudio frequency range
• measuring SOL (saturated output level): themaximum output available from magnetictape across the audio frequency range
Still other measurements involve varying the gen-erator frequency as a function of measurements todetermine a key point on the amplitude-frequencycharacteristic of a device under test. Examples in-clude:
• determining the center frequency (maximumresponse point) of a bandpass filter such asone section of an equalizer
• determining the center frequency (maximumrejection point) of a notch or bandreject filter
• determining a specific point such as the lower-3 dB or upper -3 dB response point of an am-plifier
Such measurements can be difficult and time-con-suming with manual test equipment or automaticequipment not fitted with the special software fea-tures necessary to automate these tests.
System One’s REGULATION mode permitsthese tests to be made automatically.
26.2. Regulation Concept
REGULATION is essentially a software servo-mechanism. Each time a regulation cycle is manu-ally triggered by operation of the <Ctrl><F3> key orautomatically triggered at each SOURCE-1 step dur-ing a sweep, the generator amplitude (or frequency,as selected) will be automatically adjusted by thesoftware in an attempt to bring a specified measuredoutput parameter of the device under test to a speci-fied value.
26.3. Regulation Panel
The REGULATION panel of System One per-mits such measurements to be set up and run auto-matically, without tedious operator adjustments.The REGULATION panel is shown in Figure 26-1.
26-1

The ENABLE line permits selection of manual orautomatic (sweep) means of triggering REGULA-TION mode, or turning the mode OFF. If <Ctrl-F3> or SWEEP modes are selected, regulation maybe manually triggered by pressing <Ctrl><F3>.Regulation will be automatically triggered at everySOURCE-1 step in a sweep by selecting SWEEP.
The fields following REGULATE permit selec-tion of the analyzer LEVEL voltmeter or the READ-ING voltmeter (RDNG) as the analyzer-measuredparameter to be regulated. The target numeric valueat which the parameter is to be regulated (except forMAXIMUM and MINIMUM algorithms), in theunits desired, is entered after TO on the next line.
The field following BY VARYING GEN permitsselection of generator AMPL or FREQ as the pa-rameter to be automatically varied.
The HI BOUND and LO BOUND fields permitsetting boundaries outside which the generator am-plitude or frequency will not be taken by the soft-ware while attempting to regulate the parameter.Setting these bounds is a safety factor for devices
such as high-power AM transmitters. Settingbounds may also be necessary to prohibit excursionsinto noise-limited or other undesired areas, or to pre-vent location of other maxima or minima whensearching for a specificlly-known maximum or mini-mum response point.
26.4. Regulation Algorithms
The selections on the OPERATION line deter-mine the search algorithm which is used to arrive atthe target value of the regulated parameter:
• LINEAR assumes a linear relationship be-tween generator amplitude or frequency andthe output parameter of the device to be regu-lated. This is normally a good assumptionwhen regulating by varying generator ampli-tude in order to hold an output amplitude pa-rameter constant while testing a linear deviceunder test such as an amplifier (not a compres-sor or expander). Linear mode will not nor-mally be used when varying generator fre-quency, since few devices (other than F-to-V
Figure 26-1 REGULATION Mode Panel
26-2 Audio Precision System One User's Manual

converters) have output amplitude charac-teristics which are linear functions of input fre-quency.
The LINEAR function regulation cycle startsat the GENERATOR panel AMPLITUDE, orthe generator amplitude which produced regu-lation at the previous point in a sweep. Itmeasures the amount by which the specifiedparameter deviates from the target value, andadjusts the generator amplitude by exactlythat deviation. The LINEAR algorithm thusdoes not use the STEP SIZE parameter of theREGULATION panel. If the device is linearand the first measurement was not noise-lim-ited, the LINEAR function will arrive at thetarget value in a single step. If the device isnot exactly linear and the target value doesnot result from the first step, further iterationswill be made with the amplitude being ad-justed by the amount of deviation from the tar-get on the previous measurement. LINEAR isthe recommended mode to use in testing abroadcast transmitter at a constant, specifiedmodulation value across the band. LINEARis also recommended when testing power am-plifiers at constant power across the spectrum.LINEAR would also be used to maintain con-stant sound pressure level in an artificial voiceor acoustical test chamber, by using the outputof a reference (flat response) microphone asthe parameter to be regulated.
• +NORMAL does not assume linearity be-tween generator amplitude or frequency andthe measured parameter to be regulated. Itdoes assume that increasing generator ampli-tude or frequency will increase the measuredparameter and decreasing generator amplitudeor frequency will decrease the parameter, butnot necessarily linearly. This is typically therelationship at moderate-to-high signal levelsbetween signal amplitude and distortion in ananalog tape recorder, for example. It is alsothe typical relationship between generator fre-quency and output amplitude when testing abandpass filter below its peak response point,or testing an amplifier in its low-frequency re-gion to determine its lower -3 dB responsepoint.
Like LINEAR mode, +NORMAL modestarts from the generator amplitude (or fre-quency) setting or the previous regulatedpoint in a sweep. If the initial measured valueof the parameter to be regulated is below thetarget, the generator amplitude (or frequency)will be increased by the STEP SIZE and theparameter measured again. If still below thetarget value, the generator amplitude or fre-quency will again be increased by the STEPSIZE. At the first step where the measuredparameter exceeds the target value, the gener-ator amplitude or frequency will be decreasedby one-half the previous step size and the di-rection of change will be reversed. A binarysearch continues, with the step size cutting inhalf each step and the direction of generatoramplitude or frequency change reversing eachtime the measured parameter crosses the tar-get value until successful regulation isachieved. +NORMAL is the recommended al-gorithm for holding distortion at a constantvalue in tape recorders and in most electronicsdevices operating near their clipping level.
• -NORMAL is a similar algorithm to +NOR-MAL, except that it assumes that the meas-ured parameter decreases as generator ampli-tude or frequency increases. This is a typicalbehavior for distortion measurements (espe-cially wideband measurements such asTHD+N) in electronic devices in the lowerportions of their dynamic range, where theyare commonly noise-limited. It is typical ofthe output-amplitude-vs-input-frequency char-acteristic of bandpass filters above their maxi-mum response frequency, and of amplifiers athigh frequencies, as when determining the up-per -3 dB point.
• MAXIMUM andMINIMUM algorithms donot use the target number and units entered onthe “TO” line below REGULATE, but insteadcontrol the generator amplitude or frequencyso as to maximize or minimize the measuredparameter specified on the REGULATE line.
Both MAXIMUM and MINIMUM modesstart each cycle of regulation from the LOBOUND generator amplitude or frequency
REGULATION 26-3
value. In MAXIMUM mode, for example,the generator amplitude or frequency will beincreased by the specified STEP SIZE as longas the measured value also increases. If themeasured value goes through a peak and startsto fall off, the direction of generator ampli-tude or frequency change reverses and thestep size is cut in half. These half-size stepscontinue until the measured value again goesthrough a peak and starts decreasing, at whichtime the direction of change again reversesand the step size is again cut in half. Thisprocess will continue until the number of peakcrossings equals the value entered into the IT-ERATIONS field at the bottom of the panel.If the minimum generator amplitude or fre-quency resolution is reached before the peakcrossings equals the ITERATIONS value, thesearch will also end. MINIMUM modeworks similarly except that the algorithm ex-pects decreasing measurements as the norm.It thus reverses direction and cuts step size inhalf when it passes a minimum in the measure-ment and the measured value starts to increase.
MAXIMUM is the algorithm to use in deter-mining saturated output level (SOL) frommagnetic tape. It is also the mode, while vary-ing generator frequency, to locate the resonantfrequency of a bandpass filter. MINIMUMcan be used to determine the minimumTHD+N point of an amplifier, where it be-comes noise-limited at lower amplitudes anddistortion-limited at higher amplitudes. Inmany amplifiers, this point lies just below thethreshold of clipping. MINIMUM, when vary-ing generator frequency, will locate the fre-quency of maximum rejection of a notch(band-reject) filter.
In both MAXIMUM and MINIMUMmodes, a value of 5 is a good starting pointfor ITERATIONS. Values as low as 3 maywork satisfactorily. Depending on how wellknown the location of the maximum or mini-mum is when the test is set up, test speed maybe optimized by using a large value for STEPSIZE and increasing ITERATIONS to a valueas high as 7 to assure that the peak or dip isaccurately located.
STEP SIZE defines the size of amplitude or fre-quency steps the generator will take in +NORMAL,-NORMAL, MAXIMUM, or MINIMUM modes asit begins its search at the beginning of each newregulation cycle.
ITERATIONS limits the maximum number ofREGULATION attempt steps the generator willmake at any SOURCE-1 value before exiting thesearch and moving on to the next SOURCE-1 step.With LINEAR mode, only a single step or a few it-erations are normally needed. In MAXIMUM andMINIMUM modes, values from 3 to 7 are typicallyappropriate. In other modes, particularly when thestarting value is far removed from the final target,many iterations may be required and the panel set-ting should be increased from its normal default.
26.5. Success In Regulation
The search algorithms will exit their search, plotthe data, and move on to the next SOURCE-1 step(assuming SWEEP mode) when the specified pa-rameter has been brought to the numerical target,plus or minus the TOLERANCE value for that pa-rameter on the SWEEP SETTLING panel. If, forexample, THD+N is the parameter being regulated,2% has been set as the target value, and the THD+NTOLERANCE on the SETTLING panel is 5%, thealgorithm defines success as arriving at a measuredvalue between 1.9% and 2.1% THD+N.
Success may not be achieved for a number of rea-sons. If success cannot be reached, the computerwill signify its problem with a double “beep”, willplot the data but write a “U” (for Unregulated) inthe lower horizontal margin of the graph or display“UNREGULATED” next to the data in a table, andmove to the next frequency (if in SWEEP mode).“UNREGULATED” will also be written into an er-ror file if one has been named. Reasons for failureto regulate include:
• Not reaching regulation within the number ofattempts (steps) specified in the ITERA-TIONS field
• Hitting the HI BOUND or LO BOUND valuetwice during a search
26-4 Audio Precision System One User's Manual

• Bracketing the specified target value of the pa-rameter to be regulated when changing thegenerator amplitude or frequency by the mini-mum generator resolution available.
When using REGULATION mode with noisy sig-nals, regulation may sometimes be achieved but avalue then displayed which is outside the regulationtolerance. This is due to the fact that the displayedvalue (if the regulated parameter is also being dis-played) is the following reading obtained from thehardware after regulation is achieved. When mak-ing MOL measurements on cassette tape recorders,for example, the sample-to-sample variation maycause the next reading after regulation to be outsidethe tolerance bounds on the regulated parameter. Ifthe UNREGULATED flag did not appear, it can beassumed that regulation was successfully achieved.
26.6. Setting Up A Regulation Test
It is frequently most productive to use the manual(<Ctrl><F3>) trigger mode during REGULATIONtest setup. It is also helpful to have the GENER-ATOR panel, ANALYZER panel, and the REGU-LATION panel simultaneously visible during setup.This panel arrangement is accomplished by startingfrom the usual GENERATOR-ANALYZER-SWEEP (F9) DEFINITIONS panel layout, puttingthe cursor on the SWEEP (F9) DEFINITIONSpanel, and operating <Ctrl><PgDn> until the REGU-LATION panel appears in the right-hand section ofthe screen.
First select the analyzer measurement function(THD+N, AMPLITUDE, etc.). After making the in-itial settings for the parameter to be regulated andits value, generator AMPL or FREQ to be varied,the HI and LO BOUNDS, algorithm type selection(+NORMAL vs LINEAR, etc.), STEP SIZE, and IT-ERATIONS, select <Ctrl><F3> mode on the EN-ABLE line and press the <Ctrl> and the <F3> func-tion keys simultaneously. Assuming generator am-plitude is being varied, dual cursors will appear onthe GENERATOR AMPLITUDE field and the se-lected analyzer parameter display field, and you canwatch the algorithm search for the target value.You may wish to enter a value of several hundred
milliseconds in the SETTLING DELAY field of theSWEEP SETTLING panel in order to slow downthe operation for easy visual monitoring. Watchingthe operation gives a good feel for REGULATIONmode and can quickly show incorrectly-set parame-ters such as improper generator amplitude bounds.When you are satisfied with regulation in<Ctrl><F3> mode at two or three key frequencies,you may wish to go to SWEEP mode and try a full-range frequency sweep. (Don’t forget to reset thesettling delay to a short value for fastest testing).
The diskette of sample tests and procedures in-cludes tests using REGULATION mode. Thesemay be examined and used to gain experience withREGULATION function. The REGULATIONmode tests include:
• FREQ-CON.TST for frequency response ofbroadcast transmitters at constant modulationpercentage
• GAIN.TST for measuring gain or loss of de-vices at a 0 dBu output level
• DIST-PWR.TST for measuring distortion ver-sus frequency at a constant output power froman amplifier
• PWR-BAND.TST for measuring the powerbandwidth of an amplifier (power versus fre-quency at a constant distortion percentage)
26.7. Data Display
The parameters to be displayed during a sweeptest are selected at DATA-1 and DATA-2 of theSWEEP (F9) DEFINITIONS panel as in any othertest. Note that the parameter being regulated doesnot necessarily need to be graphed. For a tape re-corder example, it may be desired to plot tape re-corder output amplitude as DATA-1 and generatoramplitude as DATA-2 while using regulation modeto assure that these measurements are made at the3% THD+N point across the audio range.
Generator amplitude is a selectable display pa-rameter as the DATA-1 or DATA-2 value. The gen-erator amplitude may be displayed as AMPL or IN-VAMP. AMPL produces a conventional plot of gen-
REGULATION 26-5

erator amplitude, while INVAMP plots the gener-ator amplitude in dBr units. The INVAMP mode isuseful in applications such as measuring broadcasttransmitter frequency response at constant modula-tion percentage. In this and similar cases when thedevice-under-test output is deliberately held con-stant, the response of the device-under-test is the in-verse of the generator amplitude required to produceconstant output amplitude across the frequencyrange. INVAMP thus produces a conventional fre-quency response plot.
26-6 Audio Precision System One User's Manual

27. TESTING SPEED
Testing speed is affected by many factors, mostof which are under the control or influence of theperson setting up the tests and the system.
27.1. Time Per Step
Time per measurement point (step) varies with anumber of parameters.
• DISPLAY NONE is faster than graphic or ta-ble display. DISPLAY MONO-GRAPH orDISPLAY COLOR-GRAPH is usually fasterthan DISPLAY TABLE unless the test con-sists of a very small number of points, inwhich case the time required to draw the gridmay cause graphic display to be slower thantabular.
• FAST mode of generator frequency control isfaster than HIGH-ACCURACY mode.
• THD+N and SMPTE measurements takelonger to settle than amplitude, frequency, orphase measurements.
• All measurements take longer at low frequen-cies.
• Specifying fewer SAMPLES and looser TOL-ERANCE values on the SWEEP SETTLINGpanel will speed tests. The EXPONENTIALsettling algorithm “window” shape will nor-mally produce faster tests than the FLATchoice. Increasing the value of RESOLU-TION may speed tests when very small valuesare being measured.
• Using both DATA-1 and DATA-2 to take twosets of data in a sweep may add only a smallincrease in time compared to a single-parame-ter-sweep of the slower of the two measure-ments. The result is faster than running twoseparate tests, each with one DATA parame-ter. For example, since THD+N is usually the
slowest measurement, a second DATA linefor LEVEL can usually be added to a THD+Ntest with negligible speed penalty.
• With instruments with serial number SYS1-20300 or higher, stereo amplitude measure-ments can be made much faster in 2-CHAN-NEL mode (READING and LEVEL assignedto DATA-1 and DATA-2) than by using theSTEREO mode, which uses only one voltme-ter and makes two successive sweeps.
• FIXED range is faster than AUTO range. InAUTOrange mode, when the measured signalamplitude moves outside its present 6 dB“window”, the analyzer input gain or attenu-ation is changed. When the signal is re-moved, the instrument autoranges to its mostsensitive range. When the signal is restored,the instrument autoranges back to the mostsensitive range which will not clip signalpeaks at the present level. Depending uponreading rate, this up-ranging and down-rang-ing can take many hundreds of millisecondsor even seconds at low frequencies. If themaximum possible signal amplitude is knownin advance, tests can be saved with the fixedrange selected which will safely handle thatmaximum amplitude and significantly fasteroperation will result. However, if the signalamplitude should increase above the fixedrange maximum, clipping can occur with seri-ous measurement errors resulting. See theANALYZER chapter for more detailed infor-mation of range fixing.
• The AVG detector is slightly faster than theRMS detector, while the Peak, Q-Pk, and S-Pk detectors are much slower. However, theAVG detector should be used only when thesignal is known to be a sinewave or a band-pass-filtered signal which has similar charac-teristics to a sinewave.
27-1

27.2. Sweep Time
Test time is only approximately proportional tothe number of points in a sweep. For simple sweep-and-graph or sweep-and-display-table operation, thetime will not increase linearly with the number ofpoints due to the action of the SWEEP SETTLINGalgorithm. As any given frequency span or ampli-tude span is stepped across in smaller steps, the tran-sient change in the measured values will normallybe less and settling occurs more rapidly. However,adding points will always add to the test time. In atime-critical application where data is required atonly a few points, specify only what is needed. Ifthe required points are not either linearly or logarith-mically distributed between the end points, use thesweep table capability.
27.3. Limits and Speed
Attaching upper or lower limits to a test signifi-cantly increases test time due to the necessity ofloading limits files into memory and to the computa-tions at each point to determine whether the meas-urement is inside or outside limits. Limits fileswhich are simple rectangular limits specified byonly one or a few points will run faster than limitsfiles with many points. Faster operation will be ob-tained when the limits file and the test file gothrough the steps in the same direction (both high-to-low, or both low-to-high). Attaching an error file toa test with limits will slow the test still further dueto the time necessary to write out-of-spec valuesinto the error file.
Limit (and equalization and sweep) files up to200 points are loaded into memory when a sweep isstarted (<F9> or <F7>) with their associated testloaded. This assumes that S1 software was notloaded with the /B option. Test speed with limits upto 200 points is thus independent of the type of diskused in the computer, after the limit (and equaliza-tion and sweep) files are loaded. If limits fileslarger than 200 points are used, the portions beyond200 points will be accessed on disk and test speedswill slow down markedly, especially with floppydisks. If larger limit (or EQ or sweep) files are re-quired, S1 software can be loaded with the /B op-
tion so that the larger files can still load into mem-ory. See the “Controlling Memory Usage” sectionof the CREATING YOUR CUSTOM SOFTWARESTART-UP PROCESS chapter for more details.
27.4. Equalization and Speed
Use of the EQSINE feature and a xx.EQ file alsoslows testing since the computer must usually inter-polate between xx.EQ file values to obtain the valueto use at the generator frequency value. As in thecase of xx.LIM files above, the best speed is ob-tained with the smallest xx.EQ files and with xx.EQfiles arranged in the same frequency order as thexx.TST sweep is proceeding. With standard mem-ory allocations, the first 200 points of the xx.EQ fileare loaded into memory when a sweep is started.Operation will slow due to disk accesses if largerequalization files are used. If larger files are re-quired, S1 software can be loaded with the /B op-tion in such a way that they will automatically loadinto memory. See the “Controlling Memory Usage”chapter of the CREATING YOUR CUSTOM SOFT-WARE START-UP PROCESS chapter for more de-tails.
CONFIG.SYS file:
DEVICE=VDISK.SYS BUFFERSIZE100K
AUTOEXEC.BAT file:
ASTCLOCKMOUSEC:COPY A:*.TSTCOPY A:*.PROCOPY A:*.LIMCOPY A:*.EQCOPY A:*.IMGCOPY A:*.DATCOPY A:*.TXTCOPY A:*.SWPCOPY A:*.OVLB:S1
Figure 27-1 CONFIG.SYS and AUTOEXEC.BATFiles for Virtual Disk
27-2 Audio Precision System One User's Manual

27.5. Graphics Save Mode and Speed
If S1.EXE software is started with /G option toenable saving high-resolution .GDL files to disk,testing speed will be significantly slowed. In the /Gmode, every graph vector drawn to the screen is alsowritten into a .GDL disk file with a consequent slow-ing of operation.
27.6. Disk Types and Testing Speed
Files used during a testing operation may bestored in three ways; on diskettes (floppy disks), ona hard (fixed) disk, or on virtual disk (ram disk).Diskettes have the slowest access times and datatransfer times. Hard disks are much faster in bothaccess and data transfer times and yield faster-run-ning tests. Hard disks also hold large amounts ofdata, typically 20 megabytes and up. They are there-fore much more convenient for operation, eliminat-ing the frequent changing of diskettes often requiredin diskette-based systems. Hard disks also permitconvenient accumulation of test data over a periodof time. The data may then be accessed by spread-sheet or statistical programs to perform statisticalanalysis on the data.
27.6.1. Virtual Disks
Virtual disks are portions of the computer mem-ory (ram) set aside during operating system start-upand made to look like another disk drive. If yourcomputer has no hard disk, but has substantiallymore memory than that required for System One op-eration plus reasonable DOS activities under theDOS or XDOS commands, virtual disks may be agood solution to testing speed. If you have a harddisk, there is little speed to be gained by use of vir-tual disks. With recent DOS versions, your DOSmanual will describe how to use the VDISK.SYSand CONFIG.SYS capability to create virtual disksat system start-up. For regular daily testing typicalof ongoing production test activities, you may alsowish to add commands into your AUTOEXEC.BATfile which copy from diskette onto the virtual diskthe test files and limits files which are regularly
used. A typical CONFIG.SYS and AUTO-EXEC.BAT file for this type operation are shown inFigure 27-1.
This example assumes that the files VDISK.SYS(a DOS file), CONFIG.SYS, ASTCLOCK (if youhave one of the AST (TM) clock-calendar units inyour computer), MOUSE.COM, and the test, proce-dure, limit, equalization, etc. files are all on a boo-table diskette in the A: drive. It assumes that S1 ison a diskette in your B: drive. The CONFIG.SYSfile causes VDISK.SYS to run at start-up, settingaside 100k bytes of memory (amount controlled bythe BUFFERSIZE parameter) which is automat-ically designated as the C:\ drive on a computerwith no hard disk. The AUTOEXEC.BAT file thensets system date and time from the clock-calendarcard (ASTCLOCK), runs the MOUSE driver soft-ware, changes the current disk drive to C: (the newvirtual disk), copies onto it the desired files fromdisk A:, and finally loads System One software fromdrive B. However, it leaves C: as the current driveso that the system will look for all files and store allfiles there.
Since a virtual disk is computer memory whichwill be lost at power-down or system re-start, opera-tional procedures must be established to copy fromvirtual disk to diskette any files desired to be kept af-ter system shut-down. A procedure may includedisk drive designators in any Save commands, or ex-plicitly in the file name of an error file. For exam-ple, when operating from a virtual disk designatedC:, which contains all the procedures, tests, limits,equalization files, sweep tables, etc., the error filename attached to each test may be specified as B:er-rorfile. This will not provide the absolute fastest op-eration since the flexible disk in drive B will be ac-cessed frequently for test summary information. Itwill eliminate the risk of error file data loss and thenecessity of copying the error file from the virtualdisk to the diskette before turning off computerpower or re-booting the system.
TESTING SPEED 27-3

27.7. Computer Types and Speed
Five families of microprocessors are in wide useas the central processors of the various computermodels compatible with System One. The originalIBM PC, PC Portable, XT, the Compaq Portable,and many other machines use the 8088 processor.The original Compaq Deskpro, AT&T 6300,Olivetti M21 and M24, IBM System 30, and certainother computers used the somewhat faster 8086.The IBM PC-AT, Compaq Portable II, IBM System50 and 60, AT&T 6300 Plus, and Compaq Deskpro286 use the 80286, which is faster yet. Still morepowerful computers in this category, such as theCompaq Deskpro 386 and IBM System 80, use the80386. The fastest PC-compatible computers nowavailable use the 80486 processor. Various comput-ers using the same microprocessor may run it at dif-ferent clock rates. The clock rate will directly affectits computational speed.
Although the microprocessor is capable of per-forming mathematical operations, it does not do soefficiently. Integrated circuits which perform mathoperations in hardware are available for all of theIBM and compatible computers.A math co-proces-sor should be installed in any computer used withSystem One for the maximum speeds. It will makethe largest difference on the slowest computers(8088-based).
The actual measurement times of System Onewithin any test (xx.TST file) are determined largelywithin the instrument hardware. Actual test timeswill thus not vary as much with the type of com-puter used as will purely computational activitiesand disk access actions. However, speed improve-ments of as much as 30% have been noted with AT-compatibles (80286-based) over PC-compatibles(8088-based). In a sweep test with a log horizontalaxis and one or two dB units on the vertical axis,the faster computers will produce reductions insweep times. This is because they are much fasterin the computationally-intensive activities such aslog conversions. Faster computers also speed thecomparisons involved in testing with limits andequalization files.
In a procedure, many different tests must beloaded into the System One software in sequence,and many computations are required to translate thestored information into panel settings and instruc-tions to the hardware. Assuming that a hard disk orvirtual disk is used so that diskette access time anddata transfer rate are not the limiting factors, thefaster computers will make quite significant reduc-tions in this test loading activity. Benchmark testshave been run which show the 80286-based comput-ers to cut test loading times from the 3-4 secondstypical of 8088 machines down to approximately 1second. Depending on the number of different testsin a procedure and the length of each test, the 80286-based machines have been seen to cut proceduretimes typical of real world applications almost inhalf.
27.8. FASTEST.DSP and Speed
A new program for the DSP-based versions ofSystem One can produce on the order of ten-times-faster testing for most common audio measurements.This program and technique, called FASTEST,stimulates the device under test with many sine-waves simultaneously, acquires the output signaland performs an FFT analysis, and then can measurefrequency response, noise, total distortion and noise,interchannel-phase (if stereo), and can also measureharmonic or intermodulation distortion separatelyfrom the total distortion measurement. On the orderof one to two seconds of stimulus are required, withall the measurements listed above then made withintwo-four additional seconds. Contact Audio Preci-sion for more information on DSP units and theFASTEST technique.
27.9. Software and Speed
Most of the discussion above assumes thatS1.EXE, System One’s panel-and-menu orientedsoftware, is being used. This software permits fasterand easier preparation of tests and procedures thanany other approach to automated testing. For the ab-solute fastest testing speed, experienced program-mers can develop programs in the Microsoft BASICProfessional Development System v7.10 (which in-
27-4 Audio Precision System One User's Manual

cludes the Microsoft QuickBASIC Extended Envi-ronment) or in Microsoft C language v5.1 or later,using Audio Precision’s LIB-BASIC or LIB-C func-tion libraries to control System One hardware. Insome cases, such programs cut testing time in halfcompared to S1.EXE tests and procedures.
TESTING SPEED 27-5

27-6 Audio Precision System One User's Manual

28. CREATING YOUR CUSTOM SOFTWARESTART-UP PROCESS
Getting from power turn-on to a status ready torun tests and procedures can involve several steps:
• booting DOS
• setting the computer time and date (if not auto-matically maintained in your computer)
• running the MOUSE program (if you have amouse)
• changing the default drive or directory to thedrive or directory where the test, limit, proce-dure, etc. files are located
• loading S1 with the desired memory set-asides for DOS operations, proper display sys-tem selected, desired graphic print-out size se-lected, etc.
• going to PANEL mode after System One soft-ware loads and selecting the generator outputconfiguration, levels, analyzer filter selectionand units, sweep conditions, etc.
It is possible to automate this entire sequence.You can then begin each day’s work from your ownpreferred starting conditions merely by turningpower on to your computer and System One.
28.1. Making A Bootable Diskette
First, format a blank diskette with your DOS onit according to the instructions in your computer’smanual. With a two-drive computer, the DOS diskin drive A, and the blank diskette in drive B, thisnormally is done by typing
FORMAT B:/S <Enter>
If you will be using the mouse option, replace theA: diskette with the mouse software diskette andtype
COPY MOUSE.COM B: <Enter>.
Note that newer versions of mouse software fromMicrosoft come with an installation routine.
Proceed by then copying all the xx.TST, xx.PRO,xx.EQ, etc., files which you will regularly use ontothe new diskette by placing the disk or disks contain-ing those files in the A drive and typing
COPY *.TST B: <Enter>COPY *.PRO B: <Enter>COPY *.EQ B: <Enter>COPY *.SWP B: <Enter>COPY *.TXT B: <Enter>COPY *.DAT B: <Enter>COPY *.LIM B: <Enter>COPY *.OVL B: <Enter>COPY *.DSP B: <Enter>COPY *.WAV B: <Enter>COPY *.MAC B: <Enter>
28.2. Creating an AUTOEXEC.BATFile
AUTOEXEC.BAT is a special file name to DOS;whenever DOS is started, it looks on the defaultdrive to see if a file of that name is present. If it is,DOS will automatically execute the instructions inthat file.
Create an automatic startup batch file on the newdiskette so that it will run the various utilities, estab-lish the desired drive (where the test, procedure, etc.files are located) as the default drive, and load Sys-tem One software after DOS loads. This can bedone directly from DOS using the COPY CON(copy from console) command. Instead, it is much
28-1

more convenient to create the batch file from a texteditor which gives you the ability to view the fileand make insertions or deletions before saving it.
The following example assumes you are usingthe Edit Comments capability of System One as thetext editor. To use the S1 editor, place the S1 disk-ette or a copy of it in drive A and type S1 <Enter>.After the software loads and the Audio Precisionlogo appears, type <E> <C> to go to the Edit Com-ments feature and type the following:
MOUSE <Enter>
(assuming that you wish to use a Microsoft Mousewith your system)
Now enter any other commands or programs tobe run before System One starts. A common exam-ple for XT type machines is a program to set thecomputer time and date. If you have a clock/calen-dar card such as the AST 6-Pack (TM) installed, thecommand would be
ASTCLOCK <Enter>.
If you have no clock/calendar card, type in thecommands
TIME <Enter>
DATE <Enter>
so that the system will prompt the operator to enterthe correct time and date upon start-up.
B:S1 <Enter>
or:
B:S1 filename <Enter>
or
B:S1 filename filename <Enter>
or
B:S1 /r100 <Enter>
or
B:S1 /R64 /D2 /P3 filename <Enter>
or
B:S1 /D1
These various alternative commands tell DOS toload and run S1.EXE from the B: drive, withoutchanging the default drive from A:. It is not neces-sary to type the xx.EXE extension. This must bethe last line of the AUTOEXEC.BAT file. The op-tions of including a xx.TST filename or or xx.PROfilename or both on the command line will cause S1to load a specific test and/or or start up with a spe-cific procedure; see COMMAND LINE OPTIONSbelow for more details. The /D option specifies thetype of display system in the computer. The /R op-tion specifies the amount of memory set aside forDOS and XDOS operations. The /P option specifiesthe printer mode.
The final version in the Edit Comments buffermay look like this:
MOUSEASTCLOCKB:S1
or possibly
MOUSEDATETIMEB:S1 /P3 /D1 /R120 /F PERFCHEK
Save this text to the new diskette in the B drivewith the menu commands <Esc> Save Commentsand the filename B:AUTOEXEC.BAT. The exten-sion xx.BAT must be explicitly supplied; if not, thesystem supplies the extension xx.TXT since it as-sumes you are saving a System One comments file.The xx.BAT extension is mandatory for DOS to rec-ognize it as a batch file.
28.3. Testing The Startup Process
To verify function, move your new diskette to theA drive. Place a copy of the appropriate S1 versionin the B drive. Restart the computer by pressing
28-2 Audio Precision System One User's Manual

<Ctrl>, <Alt>, and <Del> all simultaneously. Thisis called a “warm boot” by computer people, as dis-tinguished from a “cold boot” which is done atpower up. The “cold boot” goes through a completecomputer memory check which can take up to a m-inute with a memory-loaded machine, while the“warm boot” goes directly to the software start rou-tine. If all was done correctly, the computer will goautomatically through the process you defined, cul-minating in the Audio Precision logo (or into an op-erating procedure, if a procedure name was suppliedfollowing S1) without further assistance.
28.4. STD.TST File to Set InitialConditions
To further customize System One software sothat it starts with your choice of panel conditions,go to Panel mode and set every parameter as youwish it to be at startup. You are likely to have pre-ferred choices for units, generator source impedanceand balanced/unbalanced condition, output level,analyzer input termination, principal voltmeter func-tion, bandwidth, detector type, dBr REF anddBm/W REF values, sweep start and stop valuesand number of steps, color versus monochromegraphs, etc. You may also wish to use the NamesTitle function to replace AUDIO PRECISION in theupper left corner of monochrome graphs with a titleof your choice. You will possibly wish to changesome of the parameters on the SWEEP SETTLINGpanel.
When you have the entire set of panels as youwish them to be at startup, <Esc> Save Test andtype in STD <Enter> for the test name. System Onesoftware, whenever it loads, looks in the defaultdisk directory for a file with the name STD.TST andloads it if it exists. You may now test the functionof your complete automated start by doing anotherwarm boot (<Ctrl> <Alt> <Del>). System Oneshould load automatically, and examination of thepanels should show them all exactly as you set upthe STD.TST file.
28.5. Command Line Options
A number of different modes of operation of Sys-tem One software can be obtained. Some of thesemodes are selected by typing the slash symbol “/”and characters after the “S1" when loading S1. Anon-screen listing of the available options can be ob-tained by typing either S1 /? or S1 /HELP at theDOS prompt. These command line options permitSystem One to:
• start with a specific test already loaded( S1 testname )
• start with a specific procedure loaded and run-ning ( S1 procedurename )
• start in the correct graphics mode for the com-puter graphics board and monitor in use( S1 /D# )
• find the Audio Precision interface board at aspecific address in the computer, or notify thesoftware that no interface card is installed( S1 /I# )
• start with the last test and procedure loadedbut not running ( S1 /L )
• control the amounts of memory set aside fordata and various buffers ( S1 /B#,#,#,#,#,#and S1 /R# )
• disable Image Store and sweep-erase-repeat ca-pability (<Alt><F8>, <F8>, <Alt><F9>) in re-turn for 16k to 38k additional available mem-ory (S1 /8)
• select the mode in which the buffer contentsare swapped to disk during XDOS and DOSactions (S1 /&filename)
• specify the printer type which is connected,and the exact height and width of the print-outs which result from pressing the <*> key( S1 /P#,#,# )
• disable the two-per-page formatting and auto-matic page feeds of <*> graphic printouts( S1 /F )
• enable graphics reporting to a .GDL file forlater transmission to a plotter or laser printer( S1 /G )
CREATING YOUR CUSTOM SOFTWARE START-UP PROCESS 28-3

• set some video attribute other than standarddefaults with which to display “punched-out”fields in overlay (xx.OVL) files ( S1 /V# )
• use the “European” impedance values for gen-erator output and analyzer terminated inputs,if the “EURO” option is installed in the Sys-tem One hardware being used ( S1 /E )
More than one of these options may be invokedon the same command line. A space must be usedbetween the last character of each option and theslash of the following option. For example:
S1 /L /R96 /V82
28.5.1. Starting With a Specific Testor Procedure
A method for starting S1 with a desired test filealready loaded, or running a desired procedure, is toinclude those file names on the command line, afterS1. The STD.TST approach is preferable if you al-ways wish the system to start up in a specific condi-tion. If you wish it to start in different conditions atdifferent times, however, it may be preferable to usethe command line approach. To cause S1 to load afile called ABC.TST as soon as S1 itself loads, typeS1 ABC <Enter> instead of S1 <Enter>; the effectis identical to typing S1, waiting for it to load, thentyping Load Test ABC <Enter>. To cause S1 to be-gin executing a procedure called XYZ.PRO as soonas S1 loads, type S1 XYZ <Enter>; the effect isidentical to typing S1 <Enter>, waiting for it toload, then typing Load Procedure XYZ <Enter> RunProcedure. This can be a very desirable loading op-tion, as part of the AUTOEXEC.BAT file, in produc-tion test operations with low-skilled operators. Sim-ply turning on the computer, with the proper disk inthe drive, will launch them directly into an operatingprocedure.
Both a xx.TST file and a xx.PRO file can be in-cluded on the command line, in either order. Usingthe file name examples above, type either S1 ABCXYZ <Enter> or S1 XYZ ABC <Enter>. Since
most procedures start out by loading a test file, how-ever, this two-file command line may not be re-quired in most cases.
When one or more of the “/” command-line op-tions and a procedure or test file name are to be in-cluded, the “/” options should all precede the test orprocedure file name. For example:
S1 /R96 /V0 /F AMP-FREQ
28.5.2. Starting Up With the Last Test
As noted in the MENU chapter, when you QUITSystem One it automatically saves to the defaultdisk the test, procedure, and macro currently in useas APLAST$$.TST, APLAST$$.PRO, andAPLAST$$.MAC. If you would like to begin thenext time where you last left off, start System One(assuming you are starting with the same disk direc-tory which was the current directory when you quit)with the command line option
S1 /L
System One will then start with the test, proce-dure, and macro stored as APLAST$$ in place,though it does not automatically start executing theprocedure as it would if a procedure name were ex-plicitly typed in on the command line.
28.5.3. Graphics SystemCompatibility
S1.EXE supports many different graphics displaysystems typically found in IBM-compatible comput-ers, including CGA, EGA, VGA, Hercules high-reso-lution monochrome, and the plasma display of theToshiba 3100. In most cases, the software can deter-mine which graphics system is present and config-ures itself accordingly. In some cases this automaticconfiguration may not be satisfactory. In thesecases, a specific graphics system mode can beforced by use of the /D# command line option. Seethe table on page 5- 7 for full details.
28-4 Audio Precision System One User's Manual

28.5.4. Interface Card Locations
The original PCI-1 computer interface card is al-ways located at address 238, and all software ver-sions before 1.60 worked only with that address.The PCI-2 card address can be set via jumpers to ad-dresses 238, 298, 2B8, or 2D8. “S” (serial) versionSystem One can be operated from lap-top computerswith no interface card installed. To eliminate an er-ror message each time the software is loaded, it canbe started with the /I0 option.
S1.EXE software normally conducts a search, inorder, through the addresses listed above to locatethe interface card. It is possible to start the softwareso that it looks at only one address, or so that it doesnot look for an interface card at all. The commandline options are:
/I0 no interface card/I1 PCI-1 at 238/I2 PCI-2 at 238
/I3 PCI-2 at 298/I4 PCI-2 at 2B8/I5 PCI-2 at 2D8
28.5.5. Controlling Memory Usage
When you first turn on computer power or re-boot with the <Ctrl><Alt><Del> keys, the softwareoperating system (DOS) is loaded into the lowestmemory addresses. Many versions of DOS in usetoday occupy 40k-60k bytes of memory.
A special file called CONFIG.SYS will then run,if it exists. Some of the actions taken by CON-FIG.SYS will cause memory to be used. For exam-ple, CONFIG.SYS can specify a number of buffersto be used to speed many computer operations.Each buffer occupies 528 bytes. Thus, a BUFF-ERS=20 command would use 10k of memory. IfCONFIG.SYS creates a “ram disk” (virtual disk) inthe 640k bytes of DOS-addressable memory, thatspace is unavailable for other applications.
AUTOEXEC.BAT then runs, if it exists. AUTO-EXEC.BAT may load one or more programs called“TSR”s. TSR stands for “Terminate but Stay Resi-dent”. This class of programs includes things such
as mouse drivers and DOSEDIT, a public-domainprogram distributed by Audio Precision. Mousedrivers may occupy from 3k to 15k bytes;DOSEDIT occupies about 3k of memory. TSR pro-grams also include the many “DOS management”programs which permit users to change directories,make directories, erase files, etc., without learningDOS commands. Many of these programs occupylarge amounts of memory such as 50k to 80k ormore.
28.5.5.1. System One Memory Re-quirements
So, by the time you are ready to type “S1”,60,000 to 150,000 or more of the 655,000 bytes ofmemory may already be occupied by various pro-grams. At the beginning of its loading, S1.EXEchecks the amount of memory remaining. If there isnot approximately 475 kbytes or more (assumingv2.10), S1 will not load and this message will result:
Cannot reserve the requested amount of memory.S1 /? will give information on /R and /B options.See Command Line Options section of manual oruse “/?” for option info.
If 475 kbytes or more are available, S1 normallydecides how to occupy that memory according to aset of built-in rules. A decision and rules are neces-sary since the total memory occupied is made up ofan irreducible 367k bytes (version 2.10) which the“core” S1.EXE program must occupy in any case,plus eight other functional areas of memory occu-pancy which are potentially controllable. SeeFigure 28-1 for a representation of typical memoryoccupancy by DOS, a few small TSR programs, andS1.EXE as determined by the built-in rules. Theuser has the ability to over-ride the standard internalrules with her or his own better judgement on howthat memory should be used. The /R, /8, /B, and/&filename command line options are the methodsthe user has to control memory occupancy in detail.
CREATING YOUR CUSTOM SOFTWARE START-UP PROCESS 28-5

28.5.5.2. Memory Reserved for Pro-grams to Run Under XDOS or DOSExit
S1.EXE was designed with the ability to remainin memory during a temporary exit to the operatingsystem to run other programs. The XDOS and DOSmenu commands leave S1.EXE in memory to avoidthe time that would be taken by a QUIT and re-start.The most common reason to temporarily exit is prob-ably to change to another directory on a hard diskwhere other tests are stored. Some complex testingapplications also call for special programs to processtest data into a more suitable form for viewing; theCDLINEAR.EXE and COMBINE.EXE programsfurnished on the Compact Disc Player Testing appli-cation note diskette are examples. The built-in rulefor S1.EXE is to set aside 64k (65,536 bytes) ofmemory for such programs to run. The user can usethe /R option to specify larger or smaller amounts tobe set aside. For example, starting the software
S1 /R28 <Enter>
will cause only 28k instead of 64k to be reservedfor programs running during an XDOS or DOS exit.
28.5.5.3. Screen Display Memory
The <Alt><F8> feature of System One softwarepermits a monochrome version of any graph to becaptured as a “snapshot” into memory. A later<F8> operation instantly returns that graph to thescreen. The <Alt><F9> command creates a continu-ous sweep-erase-repeat cycle of taking and display-ing test data. Both these features use memory tostore the screen image. The memory occupied is ap-proximately 38k for VGA, 33k for Hercules, 28k forEGA, and 16k for CGA display systems. If neitherthe <Alt><F8>/<F8> feature nor the <Alt><F9> fea-ture is necessary for your testing, you can start thesoftware
S1 /8 <Enter>
which frees screen memory for other uses.
MINIMUM S1.EXE(NO <ALT>F8
IMAGE STOREFEATURE)
367k
AVAILABLE TOPROGRAMS
UNDER XDOS ORDOS (SHELL)
65k
EDIT DATA48k
200 .EQ, .LIM,.SWP POINTS
800 DATAPOINTS
TYPICALDOS & SMALL TSR
70k
EDIT PROCEDURE26k
EDIT COMMENTS26k
<ALT>F8 IMAGE STOREVGA 38k, CGA 16k
EDITMACRO
6k
/Boption
controls
/8option
controls
/Roption
controls
0
640K
Figure 28-1 Typical Memory Occupancy, 640 k Computer with Small TSRs and Normal S1.EXE Load
28-6 Audio Precision System One User's Manual

28.5.5.4. Internal Buffers of S1.EXE
S1.EXE sets aside six memory areas for use dur-ing testing. These six buffers are:
Data Point bufferLimit/sweep/EQ file bufferEdit Data bufferEdit Procedure bufferEdit Comment bufferEdit Macro buffer
The amount of memory presently set aside foreach of these buffers may be read at any time by dis-playing the HELP screen.
28.5.5.5. Data Point Buffer
The Data Point buffer is where test results arestored during a test (<F9>). The <F7> key re-graphs from this buffer, and the Save Test or SaveData commands copy the information from this buff-er to disk. If a test sweep consists of more datapoints than the buffer can hold, a re-graph via <F7>will show only the number of points which the buff-er holds even though all points appeared on screenduring the <F9> sweep. Similarly, saving such atest to disk will save only the points from the startof the test up to the buffer size limit. Each measure-ment point during a test requires 13 bytes of mem-ory; four bytes for the SOURCE-1 value, four bytesfor DATA-1, four bytes for DATA-2 (whether ornot DATA-2 is actually used in the particular test),and one byte for “overhead”. If a test is set up forSTEPS 20 at SOURCE-1, for example, there will ac-tually be 21 data points (since data is taken at theSTART value in addition to each of 20 steps), and21*13 or 273 bytes of the Data Point buffer will befilled.
28.5.5.6. Limit/Sweep/EQ File Buffer
The limit/sweep/EQ buffer area is loaded withdata from all limit (.LIM), sweep (.SWP), andequalization (.EQ) files attached to the test (.TST)file presently in memory. These three file typesmay be thought of as cross-reference files and are at-tached by use of the NAMES command. S1.EXEsoftware must look up values in these files at everystep of a sweep. To avoid the slow operation which
would result if S1.EXE had to go to the computerdisk for these values at each step, the data fromthose files is copied into this memory buffer areawhen the <F9> key is pressed to start a sweep.Each point requires 36 bytes of memory. If asweep, limit, or EQ file is used which is longer thanthe buffer memory available, the test will be seen toslow down greatly at the point where the softwaremust go to computer disk for each value instead ofreading it from the memory buffer.
28.5.5.7. Edit Data Buffer
When the EDIT DATA menu command is used,S1.EXE software converts the data presently in theData Point buffer from its normal, efficient binaryformat to a human-readable ASCII format and dis-plays it on screen. The user may then choose to de-lete or modify values, typically as part of the proc-ess of creating limit files. When the user exitsEDIT DATA mode with the <Esc> key, the editedASCII data is converted back to the binary formatand copied back into the Data Point buffer. SinceASCII data is quite inefficient, especially when for-matted for convenient human reading and editing,65 bytes of memory per Data Point is required forthe Edit Data buffer.
28.5.5.8. Edit Procedure Buffer
System One procedures are ASCII files which arecreated, viewed, and modified in the Edit Procedurebuffer. One byte of memory per character (includ-ing imbedded spaces, carriage returns, etc.) is re-quired for the Edit Procedure buffer. A typical “one-screen-full” procedure may thus occupy 500 to1,000 bytes, since many of the lines are usuallyshort.
28.5.5.9. Edit Comment Buffer
Another ASCII buffer, entered by the EDITCOMMENT menu command, may be used to storemiscellaneous notes and comments. These com-ments are saved to disk with the test data and testsetup when the SAVE TEST command is used, andare printed underneath the graph in the normal“screen dump” (<*>) print-out mode. One byte ofmemory per character is required.
CREATING YOUR CUSTOM SOFTWARE START-UP PROCESS 28-7

28.5.5.10. Edit Macro Buffer
The DCX-127 Multifunction unit includes the ca-pability to initiate upon hardware switch contact anyof eight different macros. This feature is useful inproduction test and QA activities, where non-com-puter-proficient operators may initiate different pro-cedures or other actions by pressing a pushbutton orfoot switch, rather than dealing with a full computerkeyboard. The macros which are triggered are cre-ated, edited, and stored in the Edit Macro buffer.They are ASCII files, occupying one byte of mem-ory per character.
28.5.5.11. Buffer Size Control
Available memory will normally be apportionedamong these six buffer sizes according to built-inrules which are a compromise for “typical” opera-tions. You can optimize the size of each buffer foryour specific application by use of the /B commandline option. The full form of this option is
S1 /Bn,n,n,n,n,n <Enter>
where each n is a number typed by the user. Thesequence of these six numbers corresponds to thepreceding discussion and to the format of the HELPscreen display of these buffers. Thus, the firstnumber specifies the number of Data Points whichcan fit in the buffer, the second number is thenumber of limit, sweep, and EQ file points whichwill be copied to memory for fast testing, etc. Aspecial form of the /B option to maximize datapoints at the expense of all other buffers is
S1 /Bn
The result will be to load S1.EXE to permit ndata points, setting all the other five buffers to theminimum permissible size, and leaving all remain-ing memory available for programs running duringDOS and XDOS exits.
If the number entered for any buffer is above themaximum permissible, the error message “Invalidbuffer sizes specification” will be displayed. It ispossible to specify sizes for the various memory ar-eas which add up to a large enough number that
MEMORY BUFFERAREA
TYPICALDEFAULT SIZE RANGE BYTES PER
MEMORYUSAGERANGE(BYTES)
CONTROLOPTION
DATA POINTS 800 POINTS(10k bytes) 4-16000 POINTS 13 /PT 0 TO
+207948 /B N,n,n,n,n,n
.LIM, .EQ, .SWPPOINTS IN MEMORY
200 POINTS(7k bytes) 4-16000 POINTS 36 /PT 0 TO
+575856 /Bn, N,n,n,n,n
EDITDATA 48k CHARACTERS 64-65000
CHARACTERS1 /CHAR-ACTER
0 TO+64936 /Bn,n,N,n,n,n
EDITPROCEDURE 26k CHARACTERS 64-65000
CHARACTERS1 /CHAR-ACTER
0 TO+64936 /Bn,n,n,N,n,n
EDITCOMMENT 26k CHARACTERS 64-65000
CHARACTERS1 /CHAR-ACTER
0 TO+64936 /Bn,n,n,n,N,n
EDITMACRO 6k CHARACTERS 64-65000
CHARACTERS1 /CHAR-ACTER
0 TO+64936 /Bn,n,n,n,n,N
<ALT>F8 SCREEN IM-AGE MEMORY
VGA 38k bytesCGA 16k bytesEGA 28k bytes
Hercules 33k bytesON OR OFF
+38k VGA+16k CGA+28k EGA+33k Herc
/8
Table 1 S1.EXE Memory Usage Above Minimum 367k (v2.10)
28-8 Audio Precision System One User's Manual

S1.EXE cannot load. In this case, you will receivean error message indicating that there is insufficientmemory. You must then either reduce some of theallocations or see if there are memory-resident utili-ties which could be deleted. The /R option and the/B options may be used in conjunction as long asthe requested sizes are compatible. If the intent is toreserve the maximum possible memory the /B op-tion with minimum usable buffers will have that ef-fect without use of the /R option. If the intent is tomaximize data points at 16,000, for example, the /Roption must also be used with a minimal set-aside orS1 cannot load.
28.5.5.12. Buffer Swap to Disk
The /&filename command line option is a power-ful tool to allow large programs to run duringXDOS and DOS exits without compromising thebuffer sizes for data points, procedures, etc. This isaccomplished by copying the contents of all six buff-ers to a disk file at each XDOS or DOS exit, thencopying the disk file back into the buffer areas whenreturning to S1.EXE. The cost of this flexibility isspeed. With typical buffer sizes set by the built-inrules, 5-10 seconds may elapse between the XDOSor DOS command and appearance of the DOSprompt which permits the next program to run. Asimilar length of time is taken at the end of the exitfrom S1.EXE to copy the disk file back into mem-ory and erase the disk file. If the buffer sizes havealready been reduced by use of the /B command, thetime required will be proportionately less. If yourcomputer has more than 1 Megabyte of memory andyou have software which permits creating a virtualdisk in that higher memory, the time to copy a nor-mal set of buffers into that virtual disk may be asshort as 1 second. To take advantage of such a vir-tual disk, the full path name must be specified forthe “swap” file. For example, assuming the virtualdisk to be D:, System One software might be startedby
S1 /&D:\tempfile <Enter>
summarizes all the controllable memory areasand the command line options which control them.Multiple command line options may be used, sepa-rated by spaces. For example,
S1 /B30,6,2100,1000,200,64 /8 /&temp <Enter>
would control the six buffer sizes as specified,disable the screen memory, and swap all buffers to adisk file named “temp” during XDOS or DOS exits.
It is necessary to use the /R option to reduce thememory set aside for XDOS activity below 64kbytes if data points are to approach their maximumof 16,000, as might be required for long time re-cords such as wow and flutter or phase versus time.
If /R and /B are used simultaneously, S1 may setaside more than the “R” value for XDOS activitysince there is nowhere else to put surplus memory af-ter the /B command rigidly defines all six buffers.
28.5.6. Screen Appearance ofPunched-Out Fields
Panel set-up fields which have been blanked orpunched out and saved as xx.OVL files can have dif-ferent screen appearances. Monochrome display sys-tems provide several choices, while color systemsprovide 256 choices of appearance. The choice ofappearance can be specified on the command line bythe V (video) option. For example, to causepunched-out fields to be completely blank, type atstart-up
S1 /V0
See the PROCEDURES chapter for an explanationof the control technique and choices.
28.5.7. Printer Mode and PrintedGraph Size Selection
S1.EXE software can be configured for a number ofdifferent printer dot densities and print modes. Itcan also be loaded so as to print graphs of any de-sired size, and the graphs may be rotated 90 degreesif desired. The /P#,#,# option controls these func-tions. See the description beginning on page 15-5.
CREATING YOUR CUSTOM SOFTWARE START-UP PROCESS 28-9

28.5.8. Formatting of Graph Printout
Normal operation of System One’s graphic print-out mode, initiated with the <*> key, assumes thattwo graphs per page are desired. Thus, followingthe first graph and comments, line feeds are issuedto the printer to move to approximately the center ofthe page. Following the next graph printed, a pagefeed command is issued to the printer.
When this type of formatting is not desired, Sys-tem One should be started with the command lineoption
S1 /F
which disables the formatting. The printer will sim-ply stop after the last line of comments or the bot-tom of the graph if no comments are present. Fur-thermore, the graph will be located at the left-handmargin of the page rather than centered horizontally.For more details on the /F option including numericarguments to cause bi-directional or uni-directionalprinting, see page 15-3.
28.5.9. Plotter and Laser PrinterCompatibility
System One software can save the information nec-essary for an HPGL-compatible plotter, HP Laserjetlaser printer, or Postscript-compatible laser printer.After starting S1.EXE with the /G option, the infor-mation may be saved into a user-named file with the.GDL (Graphics Data List) extension. After exitingfrom S1.EXE, a driver program called PLOT.EXE(for HPGL-compatible plotters and HP Laserjetprinters) or POST.EXE (for Postscript-compatibleprinters) must be run. These programs define plot-ting parameters, specify a .GDL file as input, andmake the plot. See the plotter section on page 15-7of the HARD COPY PRINTOUT chapter for full in-formation.
28.5.10. Command Line Query
If S1 /? or S1 /HELP is typed from DOS, a briefsummary will be presented on the screen of theavailable command line options for starting S1.
28.5.11. Batch Files for LoadingS1.EXE
Since it can be time-consuming and error-proneto type in the buffer option command each time youstart System One software, a DOS batch file may bewritten to take over this task. Use of the DOS envi-ronment is often an even better solution; see the sec-tion immediately below for a discussion of this tech-nique.
To make a batch file, use Edit Comments to cre-ate a command line as desired. For the buffer sizeexample given above, the line would thus be:
S1 /B 100,30,64,6000,200,200 <Enter>
Press <Esc> and Save Comments. Supply a simplename such as SYS1.BAT. You must type the .BATextension, otherwise the standard .TXT extension ofComments files will be furnished. In the futurewhen starting System One from DOS, you can type:
SYS1 <Enter>
The batch file will execute, loading System One soft-ware with the buffer sizes specified. You could cre-ate several different batch files with different namesand different buffer sizes for various applications.If you prefer to stay with your present habit of start-ing System One by:
S1 <Enter>
you must first rename S1.EXE to another name byuse of the DOS RENAME command. If you chooseto rename S1.EXE to REAL_S1.EXE, for example,the command from DOS is:
RENAME S1.EXE REAL_S1.EXE <Enter>
The batch file would then be:
REAL_S1 /B 100,30,64,6000,200,200 <Enter>
and it would be saved under the name of S1.BAT.Typing:
S1 <Enter>
28-10 Audio Precision System One User's Manual

will then execute the batch file S1.BAT which inturn calls the renamed System One software withthe buffer option.
After System One software loads, select the Helppanel and you should see a display similar to Figure28-4. The size of the six areas will be as you speci-fied on the command line. Note that the copy buff-er (accessed by F6 and F5 keys) of each editor isalso part of the size assignment. For example, if2,000 bytes is reserved for Edit Comments and a500-byte section of text has been deleted into thecopy buffer with the F6 key, there will only be1,500 bytes remaining into which a new Commentsfile could be loaded. To empty the copy buffer ofany editor, select the editor and press F6 twice with-out moving the cursor. This copies a zero-length“text” into the copy buffer, effectively erasing theprevious contents.
The last line, “Bytes Reserved for DOS”, willshow the remaining computer memory usable forother program operation under a System One shellduring XDOS and DOS exits. The exact amount ofremaining memory will depend on the memory sizeof the computer, on the DOS version in use, and onwhether any memory-resident programs were loadedbefore S1. Examples of memory-resident programsare MOUSE.COM, GRAPHICS.COM, HGC.COM,and utilities permitting instant access to simulated in-dex cards, calendars, calculators, etc.
28.5.12. Using the Environment toControl Start-Up
An alternative to use of batch files is to issuefrom DOS a “SET S1OPTS” statement. Such astatement writes into a DOS memory area called theEnvironment. Each time S1.EXE is started, it looksinto that Environment area to see which commandline options it should execute when loading. Thistechnique has an advantage over the batch file ap-proach in that S1.EXE need not be re-named toavoid conflict with a batch file named S1.BAT, ifyou prefer to stay with your habit of starting the soft-ware via S1 <Enter>. The SET S1OPTS statement
can be included in the AUTOEXEC.BAT file formaximum convenience. An example SET S1OPTSstatement would be:
SET S1OPTS=/B100,6,64,2000,2000,64 /D2 /L
The present contents of the Environment can al-ways be viewed from DOS by typing SET <Enter>.
Note that any options included on the commandline when S1 is started will add to or over-ride op-tions specified by the Environment.
CREATING YOUR CUSTOM SOFTWARE START-UP PROCESS 28-11

28-12 Audio Precision System One User's Manual

29. MOUSE OPERATION
29.1. Introduction
The Microsoft Mouse provides an alternate to thearrow keys, <+> and <Del> keys, space bar, and<Enter> key for moving around the panel and mak-ing selections. The mouse also permits smooth, ana-log-like control of the generator amplitude and gen-erator frequency.
29.2. Mouse Compatibility, PCI-1Card
Audio Precision has built three versions of inter-face card. The original version, the PCI-1, con-tained connectors both for the digital interface cableto System One and for the original version of theMicrosoft bus (parallel) mouse. This version of themouse, with a 9-pin D subminiature connector, is nolonger available. A custom integrated circuit re-quired on the PCI-1 card to support the bus mouseis also no longer available. The PCI-1 card con-tained circuitry at the same I/O address used by thebus mouse. The newer version bus mouse cannot beused when this card is installed due to I/O addressconflict.
With recent versions of MOUSE.COM, the pro-gram can be loaded so that it will look only for a se-rial mouse at a specific serial port. A serial mouseand this version of MOUSE.COM can be used inconjunction with the PCI-1 card. The command toinvoke the software is
MOUSE /C1
if the serial mouse is connected to COM1:, or
MOUSE /C2
if the serial mouse is connected to COM2:
29.3. Mouse Compatibility, PCI-2Card
Audio Precision is now furnishing the PCI-2 andPCI-3 cards. The result is that either bus or serialmice may be used with System One.
29.3.1. PCI-2 Installation with BusMouse
The bus mouse is normally sold with its own in-terface card which installs into an empty expansionslot of the personal computer. The PCI-2 card in-stalls into another empty slot. When both busmouse and the Audio Precision PCI-2 card are to beinstalled, jumpers on the PCI-2 card must be movedto one of three other addresses available to avoidI/O address conflict with the bus mouse card. Seethe PCI-2 card preparation section of the Installingthe Interface Card chapter for more details.
29.3.2. PCI-2 Installation with SerialMouse
The serial mouse plugs onto a serial (RS-232)connector. The PCI-2 card contains a serial port inaddition to the digital interface connector to SystemOne. Thus, a computer with no available serial portcan support a serial mouse via the PCI-2 card.(Note, however, that a maximum of two serial portsare permitted by the IBM-PC and compatible archi-tecture.)
The PCI-2 card is shipped without this serial portbeing enabled. To enable the port and configure itas COM1: or COM2:, jumpers must be correctly setat P121 and P421. See the Installing the InterfaceCard chapter for more details.
29-1

29.4. PCI-3 Installation with Mouse
The PCI-3 card is designed for the MicrochannelBus in the more powerful models of the IBM PS/2series. This card operates at a fixed address as-signed to Audio Precision by IBM and will not con-flict with either bus or serial mice.
29.5. Mouse Software Installation
Software installation of the mouse consists of run-ning the program MOUSE.COM each time the com-puter is started. The most convenient way to accom-plish this is by including the command MOUSE inan AUTOEXEC.BAT file, and copying the programMOUSE.COM onto the disk with the AUTO-EXEC.BAT file which will be used to start the com-puter. MOUSE.COM will be furnished by themouse supplier.
29.6. Mouse Usage
In panel mode, the mouse controls the location ofthe cursor on the computer screen. Rolling themouse along its long axis will move the cursor upand down within a given panel section. Rolling themouse perpendicularly to its long axis moves thecursor between fields on the same line within apanel section, or between panel sections. Just aswith the arrow keys, when the cursor moves be-tween panel sections it jumps to the field it last occu-pied in that panel.
When the mouse-controlled cursor is located on amultiple-choice field, the left and right mouse but-tons can be used to move the “choices” cursor leftor right, just as the <+> and <Del> keys on the key-board. Pressing both buttons simultaneously then se-lects the current choice, just as pressing the <Enter>key does. When the cursor is located on either thegenerator dBr REF field or the analyzer dBr REFfield, pressing either the left or right mouse buttonwill transfer the current amplitude value to that fieldas the new dBr REF, just as pressing the <+> or<Del> key will. Similarly, the cursor can be posi-tioned on either the AMPLITUDE numeric field orthe AMPSTEP numeric field and the amplitude in-
cremented with the right mouse button or decre-mented with the left mouse button. FREQUENCYand FREQSTEP incrementing and decrementingwork similarly.
If neither left nor right button has been pressed tostart scanning through the choices, pressing both but-tons simultaneously has the same effect as the<Esc> key, taking you to the top level (COM-MAND) menu. Once the mouse is on the COM-MAND line, the cursor is moved among the com-mands by rolling the mouse and the current com-mand is selected by pressing either left or rightmouse button.
29-2 Audio Precision System One User's Manual

30. COMPUTER MONITOR NOISE FIELDS
Cathode ray tube monitors of computers producestrong magnetic fields. Noise can be induced at twofrequencies: approximately 60 Hz from the verticalsweep, and at the horizontal sweep frequency, whichis 15.75 kHz for CGA-compatible color monitors,approximately 18 kHz for most monochrome moni-tors, and somewhere in the 16-32 kHz area for mostdisplay systems. System One is quite well shieldedto reduce its pickup of such noise to acceptably lowlevels under nearly all circumstances. The deviceunder test and audio interconnection cables, how-ever, may not be effectively shielded against suchfields. The simplest solution to preventing monitormagnetic field pickup in the device under test is tomaintain adequate physical space between them.Magnetic shielding materials may be helpful if it isimpossible to position the monitor far enough fromthe device under test to eliminate the problem.
One of System One’s capabilities makes it easyto identify this problem and experiment with spac-ing or shielding until it is solved. This is done via aBANDPASS mode sweep from approximately 100or 50 kHz through 20 Hz. The graphic result is aplot of the spectral distribution of noise. Any exces-sive noise induced into the device under test willproduce a noticeable “hump” in the curve at eitherthe vertical or horizontal sweep frequencies. Re-peated sweeps can be made between changes inphysical spacing, equipment location, or shieldinguntil a satisfactory installation is obtained. SeeFigure 30-1 for an example of such a test on agraphic equalizer, placed close to a CGA computermonitor (color monitors generally have the strongestfields). Note the noise peaks at 60 Hz (power mainsfrequency), 120 Hz, 180 Hz, 240 Hz, and 300 Hz.Odd harmonics generally indicate magnetic cou-pling; even harmonics are normally due to insuffi-
Figure 30-1 Residual Noise Sweep Showing Monitor Noise
30-1

cient filtering of a full-wave power supply in the de-vice under test. The noise peak at about 15 kHz(with harmonics at 31 kHz and 47 kHz) is due tomagnetic coupling of the horizontal sweep signalfrom the computer crt monitor.
30-2 Audio Precision System One User's Manual

31. AUDIO TESTING
31.1. Introduction
The majority of audio testing consists of eitheramplitude (level) measurements or measurements ofthe effects of non-linearity. Other categories ofaudio measurements include phase, frequency, andwow and flutter. The concepts behind most com-mon audio measurements will be discussed in thischapter, along with specific advice on how to makethese measurements with System One. In manycases, this chapter will refer to standard tests pre-pared for System One and distributed on diskettewith the software.
31.2. Amplitude or LevelMeasurements
Examples of amplitude measurements includegain, loss, power, frequency response, noise, signal-to-noise ratio, and many acoustical device measure-ments.
The equipment required for most amplitude meas-urements consists of a sine wave generator and aflexible ac voltmeter with a selection of filters anddetectors. Most amplitude measurements are stimu-lus-response measurements. Stimulus, usually fromthe generator output, is applied to the input of thedevice under test (DUT). The analyzer (voltmeter)measures the resulting output. For devices whichare not real-time amplifiers, such as compact discplayers, tape machines in playback mode, and re-cord players, the stimulus may consist of a test discor tape previously prepared by recording test signalson it, rather than the output of a generator. Fornoise measurements (except for quantization noisein digital systems), stimulus will not be used duringnoise measurements. Instead, the input of the de-vice under test is back-terminated in its specifiedsource impedance and the internally-generated noiseamplitude is measured.
When the signal for amplitude measurements is asinewave at least 20 dB above the internal noise ofthe device under test, neither the bandwidth nor thedetector type of the analyzer is highly critical.Either true rms or average-responding, rms cali-brated detectors will give essentially the same re-sults. Neither noise-weighting nor bandwidth-limit-ing filters should be used if they have significant ef-fect on the amplitude flatness and accuracy of theanalyzer at any of the stimulus frequencies to beused.
31.2.1. Frequency Response
Frequency response measurements are most com-monly made by stepping or sweeping a sinewave os-cillator, at a fixed amplitude, across the spectrum ofinterest. The resulting output amplitude of the de-vice under test (DUT) at each frequency is measuredwith the analyzer. Frequency response is usuallystated in terms of dB variation from some referencemidband frequency. In certain applications, it maybe desired to measure frequency response at a con-stant output amplitude from the device under test.In this case, the generator amplitude may require ad-justment at each frequency. The test results thenwill consist of the final adjusted value of generatoramplitude required at each frequency for constantoutput from the device. The generator amplitudewill normally be graphed inverted in this case, toprovide a conventional frequency response graph.
The test file FREQRESP.TST on the Tests andUtilities diskette is a typical stimulus-response fre-quency response test for balanced-input line level de-vices. Loading the test, pressing the <F4> key to es-tablish the midband reference value, and pressing<F9> for the test will result in a graphed measure-ment.
The test may be easily modified, and the result-ing modified versions saved under other names sup-plied by the user, for other types of devices. The
31-1

frequency range or direction of sweep can bechanged from the 20 kHz-20 Hz range stored by en-tering new values for START and STOP underSOURCE-1 GEN FREQ on the SWEEP (F9) DEFI-NITIONS panel. If the device has rapid changes inresponse and better resolution is desired, increasethe number of STEPS from the value of 30 enterednear the bottom of the SWEEP (F9) DEFINITIONSpanel.
If a stereo device is to be tested, select STEREOinstead of DATA-2 on the SWEEP (F9) DEFINI-TIONS panel and select ANLR RDNG followingSTEREO as the parameter to be plotted. If the de-vice is not line level input, change the AMPLI-TUDE of the generator (GENERATOR panel) from0 dBu to the desired level. If the device input is un-balanced rather than balanced, change the generatoroutput configuration from BAL to UNBAL. If the+/-5 dB provision of the graph vertical scales is notappropriate, change the GRAPH TOP and BOT-TOM values as desired. If the data should be set-tled to tighter than 0.1 dB repeatability before plot-ting, change the AMPL TOLERANCE on theSWEEP SETTLING panel from 1% (approximately0.1 dB) to an appropriate smaller value. COLOR-GRAPH or TABLE displays may be selected as de-sired.
Frequency response measurements on equalizerstypically graph well with GRAPH TOP and BOT-TOM values of +/-15 dBr. Between 50 and 100step sweeps usually provide adequate resolution forequalizer testing.
31.2.2. Frequency Response atConstant Output Amplitude
FREQ-CON.TST is a test file prepared for appli-cations where frequency response must be measuredat constant output amplitude from the device undertest. Proof-of-performance testing of broadcasttransmitters and stations is one application for thistype of testing. Such testing techniques may be re-quired by regulatory agencies due to the pre-empha-sis characteristics of many frequency modulationand tv aural transmitters, which would producewidely varying frequency deviation levels and possi-
ble over-deviation if sweeps were run at constantgenerator amplitude. These techniques have alsobeen required due to the typical non-linear charac-teristics of some amplitude modulation transmittersat high modulation levels.
FREQ-CON.TST uses the REGULATION modeof System One to automatically adjust the generatoramplitude at each step of a frequency sweep so as toproduce a constant measured output amplitude fromthe device or system under test. After achieving theconstant amplitude at each frequency step, FREQ-CON.TST will then plot (inverted) the final gener-ator amplitude which was required to achieve theregulated level. FREQ-CON.TST is initially set upto regulate for a constant 1.000 Volt amplitude fromthe device under test. Replace this value on the TOline of the REGULATION panel with the desiredtarget voltage.
For broadcast station testing, the target will bethe output voltage from the station modulation (de-viation) monitor at the specified percentage of modu-lation for the measurement. Note that this mustnotbe a de-emphasized output in the case of a fre-quency modulation monitor. The generator HI andLO BOUND values on the REGULATION panelmay have to be changed depending on whether thegenerator is feeding a microphone level input, linelevel input, or the transmitter input directly. TheDATA-1 GRAPH TOP and BOTTOM values on theSWEEP (F9) DEFINITIONS panel will need to bechanged correspondingly. If it is desired for thegraph to pass through 0 dB at a mid-band frequencyvalue such as 1 kHz, the DATA-1 units can bechanged to dBr, a single regulation cycle initiatedwith <Ctrl><F3> while the GENERATOR panelFREQUENCY is set to the desired reference fre-quency, and <F3> then pressed to transfer the gener-ator amplitude to the generator dBr REF field.
31.2.2.1. Testing Pre-EmphasizedTransmitters
When testing pre-emphasized broadcast transmit-ters and stations, it may also be desirable to attachthe appropriate xx.EQ de-emphasis curve to FREQ-CON.TST and to select EQSINE waveform on theGENERATOR panel. The ultimate measured re-
31-2 Audio Precision System One User's Manual

sults will be the same with or without de-emphasisapplied to the generator. However, the first ampli-tude setting at each new frequency of the sweep, be-fore the regulation cycle begins, will be corrected bythe de-emphasis curve. The amplitude will thus becloser to the correct value, producing smaller tran-sients during testing. Both 75 microsecond(75US_DE.EQ) and 50 microsecond(50US_DE.EQ) de-emphasis curves are stored ondiskette for U.S. and European broadcasting stand-ards.
31.2.3. Frequency Response ofCompact Disc Players
Two forms of test signals on CD test discs aresuitable for frequency response testing of CD play-ers. One is a continuous analog sweep (glide tone);the other is a series of tracks recorded at differentfrequencies but the same amplitude.
The test file CDPHASE.TST is provided for usewith analog-swept signal tracks such as track 65 onthe Denon Audio Technical CD test disc 38C39-7147 or track 41 on the Japan Audio Society AudioTest CD-1 test disc YDDS-2. CDPHASE.TST is anEXTERN FREQ test set up for an increasing-fre-quency swept signal. The test as set up measuresfrequency response of the left channel and interchan-nel phase. By deleting the PHASE selection asDATA-2, the test could be used for frequency re-sponse on track 2 (left channel) or 3 (right channel)of the Philips Audio Frequency Test SampleNumber 3 test disc 410 055-2.
To run CDPHASE.TST, load the test and selectPANEL mode. Select the track on the test CD withthe sweep. All three of the test CDs have a shortsection of 1 kHz reference tone before the beginningof the sweep. Start the CD player while SystemOne is in PANEL mode, press <F4> as soon as the1 kHz signal readings appear on the panel displays,then press <F9>. The test should continually ac-quire and plot data. Pressing <F4> sets the zero dBrREFERENCE to the 1 kHz amplitude (left track inthe case of stereo tests) so that the graph will passthrough 0 dBr at midband. Since the amplitude ofthe swept tone is quite different on the three discs (0
dB on the Philips, 15 dB on the Denon, 20 dB onthe JAS), the data is likely to plot off the top or bot-tom of the graph if the <F4> dBr REFERENCE set-ting is not done properly. After a test is complete,the GRAPH TOP and BOTTOM values on theSWEEP (F9) DEFINITIONS panel can be changedif desired to best display the data, with the data thenre-graphed with the <F7> key.
With hardware after serial number 20300, it ispossible to measure frequency response on bothchannels simultaneously with a glide-tone signal.AVCDFRQ1.TST is set up for this purpose and maybe used as described above with the JAS or Denontest discs. AVCDFRQ1.TST uses 2-CHANNELfunction to measure the left channel with the READ-ING meter and the right channel with the LEVELmeter.
CDFREQ2.TST was set up for the case of a se-quence of tracks in order of ascending frequency,each with a fixed frequency signal. Examples aretracks 4 through 16 on the Technics CD Test DiscVolume 1 (SH-CD001), tracks 46 through 55 on theDenon disc, tracks 2 through 13 on the Sony TestCD Type 3 (YEDS 7) test disc, and tracks 8 through38 on the Japan Audio Society disc. Since most testdiscs have a duration of 20 to 60 seconds (the JASdisc is only 10 seconds) on each of these tracks, themost efficient process is usually to manually ad-vance the CD player to the next track as soon as Sys-tem One acquires the data from the current track.System One, in EXTERNal SWEEP mode, signifiesthat it has acquired data by sounding a “beep” fromthe computer. To run the test, load it, select thestarting track on the test CD, press <F9>, and thenadvance the CD player one track each time the com-puter beeps. Setting the dBr REFERENCE valuecan be done by first selecting a mid-band (usually 1kHz) track and pressing <F4> before going to the be-ginning of the sequence of tracks. GRAPH TOPand BOTTOM can be changed after the test is com-pleted to best display the data, using <F7> for the re-display.
With units after s/n 20300, AVCDFRQ2.TSTmay be used for frequency response testing with thetracks just described. It differs fromCDFREQ2.TST in that it uses 2-CHANNEL func-
AUDIO TESTING 31-3

tion to measure and plot both channels simultane-ously, rather than the CDFREQ2.TST technique ofSTEREO mode to sequentially switch the READ-ING voltmeter back and forth between channels oneach track of the test disc and then plot both meas-urements simultaneously. AVCDFRQ2.TST willthus run somewhat faster than CDFREQ2.TST if aunit above serial 20300 is being used.
31.2.4. Frequency Response of TapeRecorders and Players
The testing technique appropriate for tape ma-chine testing depends on whether the machine hastwo or three heads.
31.2.4.1. Three Head Machines
Three head machines can usually record and playsimultaneously, though with a time delay betweenrecording and playback. The time delay depends onthe tape speed and the distance between the recordhead and the playback head. The test 3HD-FREQ.TST was set up for frequency response test-ing of professional tape recorders. Load the test,put the tape machine in record mode and monitoringfrom the reproduce head, press <F4>, and then press<F9>. The test is set up to measure both channelsof a stereo recorder, sweeping each channel fromhigh frequency to low. AV3HDFRQ.TST is a simi-lar test which takes advantage of the 2-CHANNELfunction of A version hardware. AV3HDFRQ.TSTmeasures both stereo channels with a single sweepof the generator. It is set up with more points forfiner response detail.
3HD-FREQ.TST assumes that the machine is setup for +4 dBu as its “0 VU” input level. If this isnot appropriate, enter a new value into the AMPLI-TUDE field of the GENERATOR panel. The test isset for a 30 kHz to 20 Hz sweep; other values maybe entered as START and STOP under SOURCE-1on the SWEEP (F9) DEFINITIONS panel. TheSETTLING DELAY value on the SWEEP SET-TLING panel, initially 250 milliseconds, may needto be adjusted for various machines. Measure thedistance between the gaps in the record and repro-duce heads and divide that amount by the tape
speed. For example, if the distance is 2 inches andthe tape speed is 15 inches per second, the delaywill be 2/15 of a second or approximately 130 milli-seconds. Enter a marginally larger number into theSETTLING DELAY field so that the software willnot start applying settling criteria to the measureddata while the last portion of tape recorded at theprevious frequency step is still passing by the repro-duce head.
31.2.4.2. Determining Tape RecorderDelay
If you wish to experimentally determine the mini-mum acceptable SETTLING DELAY for use with a3-head tape recorder, load the test 3H-DELAY.TST.This test is an amplitude sweep from -20 dBu to 0dBu in 2 dB steps, while measuring the output am-plitude from the tape machine. The stored value ofSETTLING DELAY is 1 second, adequate for anybut the slowest-speed recorders. Run this test <F9>while the tape machine is in record mode, monitor-ing from tape. The result should be a diagonal linefrom lower left to upper right of the screen. Press<Alt><F8> to store this image. Now, reduce theSETTLING DELAY to a short value such as 100milliseconds, press <F8> to restore the image, andpress <F9> to run a new test graphing onto thestored image. If the delay is too short, many or allmeasured points will be plotted to the right of thereference line. This is due to System One measur-ing and settling on the amplitude from the previousstep, on tape which was still in transition betweenthe two heads, but plotting at the horizontal pointcorresponding to the new generator amplitude. Ex-perimentally adjust SETTLING DELAY to the mini-mum value which results in all data plotting on topof the reference line. Add a small safety margin tothen provide reliable data in the shortest possibletest time.
31.2.4.3. Two Head Machines
Two head machines have a shared record-play-back head and thus cannot record and play simulta-neously. They must be tested in playback modewith a previously-recorded test tape containing
31-4 Audio Precision System One User's Manual

sweeps or a sequence of fixed-frequency tones. Thetest tape may be a purchased reference tape, or maybe recorded by use of System One.
31.2.4.4. Recording a Test Tape
Use the test file 2HD-RCRD.TST to record an ap-propriate test sequence to later be used in playbacktesting. 2HD-RCRD.TST records a 30-step sweepfrom 20 Hz to 20 kHz on both tracks of a stereo ma-chine. It is set up for consumer machines which nor-mally have unbalanced inputs. Most consumer-grade tape machines, especially cassette machines,will saturate the tape at high frequencies when re-cording at levels much higher than 20 dB with re-spect to zero VU. Since recording level indicatorsseldom have much resolution at 20 VU, the pre-ferred level setting technique is to first make record-ing level adjustments at zero VU, then reduce thegenerator level by 20 dB before making the record-ing. 2HD-RCRD.TST is set up with 0 dBV (1 Volt)as the generator AMPLITUDE. Load this test, setthe recording level for 0 VU, and then change GEN-ERATOR AMPLITUDE to -20 dBV to record atape which will be used for frequency response orphase testing. If the tape will be used for testingTHD+N versus frequency, -20 dBV is too low inamplitude and will produce noise-limited distortionmeasurements. The best recording level for distor-tion measurements will probably between 0 and -10dBV.
Professional two-head machines such as vide-otape and videocassette recorders normally have bal-anced inputs and outputs. 2HD-RCRD.TST is eas-ily modified for professional balanced machines bychanging the GENERATOR panel from UNBAL toBAL. You will also normally wish to change thegenerator AMPLITUDE from 0 dBV to +4 dBu, themost common zero VU reference level on profes-sional machines. Tape saturation is not normally aproblem on professional machines at 0 VU and be-low, so it will not be necessary to reduce the gener-ator amplitude after adjusting the tape machine inputlevel controls for 0 VU and the same recording maybe used for both frequency response and distortionplayback tests.
Start the machine in record mode; let it run pastany tape leader and for several seconds more, thusrecording a portion of reference level tape at 1 kHzwhich can be used to set the <F4> reference duringplayback. Press <F9> to start the frequency sweep.SETTLING DELAY is set to 1.5 seconds, so thegenerator will dwell on each frequency step for 1.5seconds before moving to the next step. This will al-low sufficient time for frequency response, phase, orTHD+N versus frequency measurements in EXTER-Nal FREQ mode during playback, using tests de-scribed below.
31.2.4.5. Playback Frequency Re-sponse
The test 2HD-FREQ.TST is designed for use inplayback frequency response measurements, usingeither a tape recorded with 2HD-RCRD.TST or apurchased reference tape with a series of tonesacross the audio spectrum in order of increasing fre-quency. Such reference tapes are usable even ifthey have voice announcements between the tones,since the settling algorithm will ignore the con-stantly-changing voice signal but will measure andplot the stable tone signal. Load the test, go toPANEL mode, and start the tape playing. If there isa midband reference portion, press <F4> while it isplaying to set the ANALYZER dBr REFERENCEvalue. Press <F9> and the frequency response ofboth channels should plot as the tape plays.
Analog tape machines have significant flutter,which produces frequency modulation of recordedtones. They also have amplitude variations in thesignal, particularly at high frequencies. Since 2HD-FREQ.TST runs in EXTERNal FREQ mode andmeasures the frequency of the signal from the tape,these frequency and amplitude variations can makeit difficult to collect data at high frequencies. TheFREQ TOLERANCE parameters (SWEEP SET-TLING panel) of 2HD-FREQ.TST are looser com-pared to most other testing situations and bothDATA SAMPLES and SOURCE SAMPLES havebeen set to 2 to improve the ability to measure thenoisy data from tape. On poor machines, these val-ues may need to be loosened still further. On profes-sional machines, they may be tightened to increasethe repeatability of data.
AUDIO TESTING 31-5

31.2.5. Gain and Loss
Gain or loss are measured by applying an inputsignal within the linear range of a DUT, and measur-ing and stating the output level with reference to theinput level. If the device is linear, it is not impor-tant for the measurement to be made at a specificlevel since the gain or loss will be constant acrossthe linear range.
GAIN.TST is supplied to measure gain or loss ona DUT. It is set up for balanced input deviceswhose useful output range including the area aroundline level (0 dBu, or 0.7746 Vrms). If the DUT tobe tested is linear and not noise limited at 0 dBu out-put levels, the test can be run unmodified by loadingit, pressing <Ctrl><F3>, and then pressing <F9> af-ter the REGULATION cycle of <Ctrl><F3> hascompleted. The starting point for generator outputis 60 dBu which is appropriate for microphone inputlevels. REGULATION mode will function, trig-gered by pressing <Ctrl><F3>, by “searching” withthe generator output amplitude until the DUT outputlevel is brought to 0 dBu. The test, triggered by<F9>, will then display the generator amplitude.Since the device output is 0 dBu, the gain or loss isthe generator amplitude with the algebraic sign in-verted.
GAIN.TST will measure gain at 1 kHz but can bemodified to another frequency by changing the gen-erator FREQUENCY. For unbalanced DUTs, thegenerator output configuration should be changedfrom BAL to UNBAL. If 0 dBu is not comfortablywithin the linear and noise-free output range of theDUT, change the dBr REF values on both the GEN-ERATOR panel and the ANALYZER panel to amore appropriate figure. Changing both dBr REFvalues is required since both the REGULATIONpanel and the DATA-1 display use dBr units so thatdevice gain can be directly read without further com-putations.
Remember that source and load impedances havea significant effect on the gain or loss of mostDUTs. Therefore, select the appropriate OUTPUTimpedance on the GENERATOR panel to match thesource impedance that the DUT is normally usedwith. Be sure that the DUT output is loaded with
the correct value of load resistance. 150 and 600Ohm values may be selected on the ANALYZERpanel; any other values must be supplied externallyand used with the 100k selection of analyzer inputimpedance.
31.2.6. Signal to Noise Ratio
Signal-to-noise ratio, as a relative measurement,must be made with reference to a specific output am-plitude from the device under test. The rated DUToutput amplitude must therefore be calibrated as the0 dBr reference of the analyzer. The stimulus (ifused for calibration) is then removed and the DUTinput back-terminated with the source impedance itis usually driven from. The DUT residual outputamplitude (noise) is then measured and expressed indB relative to the reference. Since the measuredvalue is noise, a true RMS detector must be used.Measurement bandwidth will strongly affect themeasurement and must be specified. Noise weight-ing filters are sometimes used in order to obtainnumbers which correlate well with human observa-tions.
SIGNOISE.TST is furnished to make signal-to-noise ratio tests on stereo or monaural devices. Be-fore use, the ANALYZER dBr REFERENCE valuemust be set to the rated DUT output amplitude forsignal to noise ratio measurements. Load SIG-NOISE.TST, go to the ANALYZER panel, and en-ter the DUT rated output amplitude (in any of theavailable units such as Watts, Volts, dBu, etc.) asthe dBr REFerence value. If the DUT output israted in Volts or dBu, no other entries need bemade. If the DUT is rated in dBm or is a power am-plifier rated in Watts, you must both enter the powervalue as the dBr REFERENCE and also change thedBm/WATTS REFERENCE value on the nextlower line to the value of load resistance into whichthe amplifier is working. After changing these refer-ence values, press <F9> for the test. The value willbe expressed in dBr (dB relative) and will be a nega-tive number; that is, a 75 dB S/N ratio will be ex-pressed as -75.00 dBr.
31-6 Audio Precision System One User's Manual

SIGNOISE.TST is initially set up with a 22 Hz-22 kHz bandwidth; the bandwidth can be changed toother values on the ANALYZER panel. If aweighted measurement is desired, select the weight-ing filter on the FILTERS line. The back termina-tion for the DUT is 50 Ohms as originally set up;this can be changed to 150 or 600 Ohms as re-quired.
31.2.7. Absolute Noise Tests
SIGNOISE.TST may be easily modified to an ab-solute noise level test rather than a signal-to-noise ra-tio test, merely by changing the DATA-1 andDATA-2 units from relative dB (dBr) to an absoluteunit such as dBu or Volts.
31.3. Non-Linearity Tests
The effects of device non-linearity may be testedby several distortion measurement methods. SystemOne is capable of THD+N (total harmonic distortionplus noise), of individual harmonic distortion at spotfrequencies by use of optional bandpass filters, andof intermodulation distortion testing by the SMPTE,CCIF, and DIM/TIM standards. Distortion testingis commonly done both as a function of amplitudeand of frequency.
31.3.1. Harmonic Distortion Concepts
Harmonic distortion may be measured and ex-pressed as individual harmonic amplitudes, as totalharmonic distortion, and as total harmonic distortionplus noise (THD+N). In all cases, stimulus from avery pure sinewave generator is fed to the input ofthe device under test. The generator must have sig-nificantly lower distortion than that of the DUT,since there is no way to separate generator distortionfrom DUT distortion at the DUT output and the twomay actually cancel to produce an erroneously lowreading.
Individual harmonic amplitude measurementsmay be made with a heterodyne spectrum analyzeror digitizer plus FFT software. The resulting high
selectivity separates the measurement of a selectedharmonic component from the fundamental, adjacentharmonic components, and wideband noise. SystemOne can measure the amplitude of a few individualharmonics by using optional fixed-frequency band-pass filters in addition to the fundamental rejectionof THD+N mode. The notch filter in THD+N modeeliminates the fundamental frequency, and selectingan optional bandpass filter at the 2nd or 3rd har-monic provides a measurement of the amplitude ofthat particular harmonic.
The term total harmonic distortion (THD), prop-erly used, refers to measurement methods which in-dividually measure the amplitude of each significantharmonic in a narrow measurement bandwidth, thencombines them in root-mean-square fashion to pro-duce a single number. Total harmonic distortionplus noise (THD+N), on the other hand, refers to themeasurement technique in which the fundamentalcomponent is removed by a bandreject (notch) filterand all remaining energy measured, including har-monics and noise. The majority of modern audioanalyzers are of the THD+N architecture. The termi-nology distinction between THD and THD+N is rela-tively recent, however, so many audio analyzers de-signed prior to about 1980 which use the THD termi-nology are really THD+N analyzers.
31.3.2. SMPTE/DIN IntermodulationConcepts
The SMPTE (and the very similar DIN) tech-nique of intermodulation distortion measurementuses a low frequency tone combined in a 4:1 peakamplitude ratio with a high frequency tone. TheSMPTE standard specifies 60 Hz and 7 kHz for thetwo frequencies. The DIN standard allows severalchoices; 250 Hz and 8 kHz is a frequently-used com-bination. The analysis technique involves measur-ing the amplitude modulation of the high frequencytone caused by the low frequency tone as they passthrough a non-linear device.
AUDIO TESTING 31-7

31.3.3. CCIF IntermodulationConcepts
The CCIF intermodulation distortion testing tech-nique is also variously referred to as the IHF-IMmethod, the twin-tone method, and sometimes thedifference-tone method. The stimulus consists oftwo relatively-closely spaced tones of equal ampli-tude, usually at high frequency. Common combina-tions are 13 kHz and 14 kHz, or 19 kHz and 20kHz. System One’s implementation of this testmeasures only the amplitude of the second-order dif-ference product which falls at a frequency equal tothe frequency difference between the two stimulustones.
31.3.4. DIM/TIM IntermodulationConcepts
Several dynamic intermodulation distortion ortransient intermodulation distortion testing tech-niques have been proposed. The most popular pres-ently uses a stimulus consisting of a squarewave anda sinewave. A standard is expected in the near fu-ture to specify a 3.15 kHz squarewave except in 15kHz band-limited broadcasting systems, where a2.96 kHz squarewave will be used. The squarewaveis combined with a relatively high frequency sine-wave (“probe tone”), and some of the resultant inter-modulation products are isolated and measured. Sys-tem One’s implementation of this technique is a sim-plified method in which only the imd products fold-ing down below the squarewave frequency are meas-ured.
31.3.5. Distortion Versus Amplitude
THD-AM.TST, SMPTE-AM.TST, CCIF-AM.TST, and DIM-AM.TST are all amplitudesweeps for measuring the results of device non-linearity as a function of amplitude. THD-AM.TSTmeasures total harmonic distortion plus noise at asignal frequency of 1 kHz as a function of ampli-tude, but can be easily changed to any other fre-quency. SMPTE-AM.TST uses the standardSMPTE test conditions of a 60 Hz low frequencytone mixed in a 4:1 amplitude ratio with a 7 kHz
high frequency tone, but either frequency may bechanged and the amplitude ratio may be changedfrom 4:1 to 1:1. CCIF-AM.TST uses two equal am-plitude tones at 13 and 14 kHz, but other frequencyspacing values are available and any center fre-quency above 4 kHz may be used. DIM-AM.TSTuses the DIM-30 test signal consisting of a 3.15 kHzsquarewave, band limited to 30 kHz, combined in a4:1 peak amplitude with a 15 kHz sinewave. Twoother variations of DIM and TIM testing (DIM-B,DIM-100) may be substituted. All four of thesetests are set for unbalanced input devices and allfour sweep amplitude from 100 mV to 2 Volts, butbalanced devices and different generator amplitudesweep ranges may be easily substituted.
31.3.6. Distortion Versus Frequency
Three of System One’s distortion measurementmethods may be usefully swept in frequency to ob-tain information about the device’s linearity acrossportions of the audio spectrum. The fourth method,DIM, is designed principally for operation at spe-cific frequencies, although DIM sweeps can providesome additional information with relatively sophisti-cated analysis techniques. THD+N, SMPTE, andCCIF tests are easily swept.
THD-FRQ.TST, SMPT-FRQ.TST, and CCIF-FRQ.TST are test files to measure distortion whilesweeping the generator frequency or frequenciesacross useful ranges. THD-FRQ.TST sweeps a sin-gle sinewave across the complete 20 Hz-20kHz spec-trum while measuring THD+N in an 80 kHz meas-urement bandwidth. SMPT-FRQ.TST sweeps theupper frequency of the two-tone test signal from 2.5kHz to 20 kHz while maintaining the low frequencytone at 60 Hz. CCIF-FRQ.TST sweeps the two-tonepair from a center frequency of 4 kHz to 20 kHzwhile maintaining a 1 kHz spacing between thetones. These tests are all set for balanced input de-vices and a 0 dBu generator output amplitude, butmay be easily changed to unbalanced output andany other generator amplitude desired.
31-8 Audio Precision System One User's Manual

31.3.7. Distortion at Constant PowerTests
DIST-PWR.TST is designed to graph the distor-tion (THD+N) across the frequency spectrum at therated power output of an amplifier. It uses SystemOne’s REGULATION mode. At each frequency, itwill adjust the generator output amplitude until itproduces the output power specified on the REGU-LATION panel (50 Watts as the test is stored) fromthe amplifier, then will measure and graph the distor-tion. For power outputs different from 50 Watts,change the value on the REGULATION panel. Fordummy load resistance values other than 4 Ohms,change the dBm/W REF value on the ANALYZERpanel. Similarly, adjust analyzer bandwidth, fre-quency range extremes, number of steps, and distor-tion display graphic limits as required to best fit theparticular amplifier under test. DIST-PWR.TST hasgenerator amplitude limits of 5 Volts and 0.1 Voltsset, which should handle most models of power am-plifier. If the power amplifier under test requires ahigher or lower input signal for rated power output,change the HI BOUND and LO BOUND values onthe REGULATION panel accordingly.
PWR-BAND.TST is a power bandwidth test for apower amplifier. It uses REGULATION mode toadjust generator amplitude until the amplifier outputsignal distortion has approximately 0.1% distortion(THD+N). This will be a fairly critical adjustmentwith many amplifiers, since their distortion will bewell below this value until clipping and well above0.1% with very small generator amplitude increasesabove the clipping threshold. After arriving at thetarget distortion value, the test will measure andgraph the amplifier output power. The test willsweep across the audio spectrum and plot the avail-able power output at which the specified value ofdistortion occurs. Note that the THD+N TOLER-ANCE on the SWEEP SETTLING panel has deliber-ately been set quite broad to improve operation withlow-distortion amplifiers which clip abruptly. Am-plifiers with a “softer” overload or clipping charac-teristic may be tested to more consistent distortionvalues by reducing the THD+N TOLERANCEvalue. Other values of distortion may be entered on
the REGULATION panel. As in DIST-PWR.TSTabove, adjust the HI BOUND and LO BOUND val-ues for the generator if required.
31.3.8. Tape Recorder Non-Linearity
MOL (Maximum Output Level) is the most com-mon non-linearity test applied to analog tape re-corders. MOL is commonly measured as a distor-tion versus amplitude sweep at a midband fre-quency. MOL.TST is a generator amplitude sweepfor three head tape recorders, using a SETTLINGDELAY of 200 milliseconds. MOL.TST sweepsthe generator amplitude from 6 dBu to +24dBu at400 Hz while measuring THD+N (total harmonicdistortion plus noise). If third harmonic distortiononly is desired, an FBP-xxxx filter may be orderedat the third harmonic of the desired fundamentaltone and plugged into an option socket. MOL.TSTmay then be modified by selecting that optionsocket in addition to THD+N mode. If the tape re-corder is operating properly, the 3% distortion level(normally defined as Maximum Operating Level)will be the same in THD+N or third harmonicmode, since tape distortion is almost purely thirdharmonic. MOL.TST is set for balanced input de-vices, but may be changed.
31.3.8.1. Distortion Versus Fre-quency of Tape Recorders
Though perhaps less common than MOL tests, itis useful to measure distortion across the audio fre-quency spectrum on tape recorders. The test TAPE-THD.TST is designed for a stereo three-head tape re-corder. It sweeps the spectrum from 10 kHz to 20Hz, measuring THD+N at 15 logarithmically-spacedfrequencies. The test is set up for professional ma-chines (balanced input with +4 dBu as normal re-cording level), but can be easily changed to unbal-anced generator output and can run at any ampli-tude. The sweep does not extend above 10 kHzsince harmonic distortion is not a meaningful meas-urement above one-third to one-half the upper bandlimit in band-limited systems such as tape recorders.SETTLING DELAY should be set to the value deter-mined for a particular recorder and tape speed as de-scribed above.
AUDIO TESTING 31-9

2HD-THD.TST is set up for use in distortion ver-sus frequency testing of stereo two-head tape ma-chines such as broadcast cartridge machines, vide-otape and videocassette machines, etc. It uses as asignal source the same tape recorded for frequencyresponse testing by file 2HD-RCRD.TST as de-scribed earlier in this chapter. It could also use anypre-recorded reference tape which proceeds in stepsfrom low to high frequency, if the duration of eachstep is approximately one to one and one half sec-onds. The frequency axis calibration extends to 20kHz since 2HD-RCRD.TST will record to 20 kHzand most reference tapes extend to at least 18 kHz,but the actual harmonic distortion data will not bemeaningful above approximately one-third the upperband limit of the tape machine being tested.
31.3.9. Compact Disc PlayerNon-Linearity
It is useful to measure compact disc player linear-ity in several fashions. THD+N may be measuredacross the audio spectrum with test signals furnishedon all known test discs. Quantization distortion canbe measured across the dynamic range of the CDsystem with signals furnished on some test discs.Most test discs also furnish one or two intermodula-tion distortion test signals which may be analyzedby System One.
31.3.9.1. CD Player THD+N VersusFrequency
The same increasing-frequency sets of tracks men-tioned above for CD player frequency response test-ing can also be used to measure THD+N versus fre-quency. These tracks include tracks 4 through 16on the Technics CD Test Disc Volume 1 (SH-CD001), tracks 46 through 55 on the Denon disc,tracks 2 through 13 on the Sony Test CD Type 3(YEDS 7) test disc, and tracks 8 through 38 on theJapan Audio Society disc.
The test file CD-THD.TST is provided for usewith any of these test discs. As with the CD fre-quency response test CDFREQ2.TST, the fastest testwill result from manually advancing the CD playerto the next trip each time the computer signifies ac-
quisition of the current track data with a “beep”.CD-THD.TST measures THD+N with a bandwidthof 22 kHz; other bandwidths may be selected.
It may be interesting to note that the rapid in-crease in “distortion” common at higher frequencieswith most less-expensive CD players is not actuallyharmonic distortion, but the feed-through of a beatproduct between the CD player sampling clock fre-quency and the tones recorded on the disc. An oscil-loscope or spectrum analyzer fed from SystemOne’s “PROCESSED SIGNAL OUTPUT” connec-tor (terminology on units below s/n 20300) orREADING connector (terminology on units aboves/n 20300) will show what the measured “distortionproducts” consist of. With a 20.00 kHz tone play-ing from the test disc, for example, the measured sig-nal will often be found to consist of a clean, stable24.100 kHz sinewave caused by the beat with the44.100 kHz sample clock.
31.3.9.2. Quantization Distortion
Several test discs include a series of decreasing-amplitude tracks at a fixed frequency, usually onekHz or nearby. CDQUANTZ.TST is provided tomeasure the quantization distortion of a compactdisc player with these tracks. The usable signals in-clude tracks 22 through 33 on the Technics test discSH-CD001 or tracks 14 through 22 on the Sony testdisc YEDS 7. By converting CDQUANTZ.TSTfrom STEREO to a single-channel test plottingDATA-1 only, it could be used with the Philips TestSample 3 disc (410 055-2) tracks 7 (left channel) ortrack 11 (right channel).
CDQUANTZ.TST is set up with EXTERNalLEVEL as SOURCE-1, expecting a decreasing-am-plitude progression from 0 dBr to -90 dBr. TheANALYZER dBr REF is set to 2.000 Volts, whichis a relatively standard value for output amplitudefrom a consumer compact disc player while playinga full-scale amplitude track. This dBr REF can beset to the exact value of the CD player under test byplaying a test disc track with a 1 kHz maximum am-plitude track and pressing the <F4> key before start-ing the series of test tracks for CDQUANTZ.TST.
31-10 Audio Precision System One User's Manual

To use CDQUANTZ.TST, cue the CD player tothe first in the series of tracks described above, startthe player, and press <F9>. Except for the Philipsdisc, each time the computer “beeps”, advance theplayer to the next track. The Philips disc has eightamplitudes recorded in sequence in each of thetracks mentioned above rather than the separatetracks of the Technics and Sony, so the player ismerely started and allowed to run.CDQUANTZ.TST will graph the quantization distor-tion and noise (both stereo channels with the Sonyor Technics discs) vertically, as a function of the out-put amplitude of the player (horizontally).
CDQUANTZ.TST is set with distortion ex-pressed in absolute units (dBr, relative to the outputof the CD player on a maximum-amplitude track)rather than units relative to the present output ampli-tude such as % or dB. This is to better demonstratethat quantization distortion is a constant-distortion-amplitude phenomenon relating to the least signifi-cant bit size of the digital system, rather than an ana-log phenomenon related to the present amplitude.The theoretical quantization distortion level in a 16-bit PCM system such as compact disc players is ap-proximately -98 dBr. Practical high quality playersapproach the -94 dBr area.
The player output amplitude is expressed in dBrwith reference to maximum output, as measuredwith the LEVEL voltmeter. The horizontal dataplotting points at the -80 and -90 dBr levels can beexpected to deviate somewhat from the theoreticalvalues for three reasons. First, the D-to-A converter(and digital filters, if used) of the CD player will notbe perfectly linear at these amplitudes. Errors of 1-4 dB are common.
Secondly, the signal at these levels is traversingonly the few least bits of the CD player D-to-A con-verter and is thus highly distorted. The LEVEL volt-meter’s RMS converter will respond to the totalpower in the signal, which is different from a puresinewave at the same peak amplitude.
Thirdly, the LEVEL voltmeter is operating far be-low its specified quality range at these levels. TheLEVEL voltmeter is specified down to 10 millivoltsand is typically usable at these frequencies down to
one millivolt. On the -80 and -90 dBr tracks, it isbeing asked to measure signals of approximately200 microvolts and 60 microvolts, respectively; itmay therefore contribute one or two dB of error inaddition to the nonlinearity and waveform problems.
Since the exact recorded amplitudes of thesetracks are specified in the documentation of the testCD, the measured data is easy to correct. Use<Esc> to go to the menu, and Edit Data to view andmodify the data. Press the <Ins> key to go from in-sert to overtype mode. Replace any values in thefirst column of the data editor which deviate bymore than a few tenths of a decibel with the exactvalues provided by the test CD manufacturer. Press<Esc> to move back to the menu and re-display thedata with <F7> or save the test.
A value which may need to be changed for opti-mum testing with different models of CD players isSETTLING DELAY on the SWEEP SETTLINGpanel. SETTLING DELAY in EXTERNal sweepsis the length of time after settling of the swept exter-nal source (amplitude as read by the LEVEL voltme-ter, in this case) before the system will attempt tostart obtaining settled data (THD+N in this case).Various models of compact disc players have widelyvarying times required for them to move ahead tothe next track and provide stable output signals fromthat track when advanced by their “next track” con-trol buttons. SETTLING DELAY must be set to theplayer’s stabilization time as a minimum in order toprevent the test from attempting to measure and set-tle on the noise coming from the CD player while itis seeking from one track to the next. Fast-indexingCD players may permit reduction of the two secondvalue stored in CDQUANTZ.TST for SETTLINGDELAY, and slow players may require that it be in-creased. This same SETTLING DELAY will alsobe invoked when System One switches to channel Bto measure the alternate track, sinceCDQUANTZ.TST is set up as a stereo test.
AUDIO TESTING 31-11

31.4. Phase Measurements
Electronic phase measurements at audio are nor-mally either measurements of input-output phaseshift through a device, or measurements of the inter-channel phase error of a stereo system. System Onemakes both types of measurements.
31.4.1. Input-Output PhaseMeasurements
The basic System One hardware compares phaseof a signal at the A input to that at the B input. Ifthe B input signal source is selected as GEN-MONI-TOR and the generator output configuration is se-lected as A&B, System One will measure the input-output phase shift of a device connected between thegenerator A output and the analyzer A input. Testfile I-OPHASE.TST is set up for this configuration.In addition to phase, I-OPHASE.TST also measuresthe frequency response of the device under test.The test is set up for balanced devices with line-level inputs such as most equalizers, but may be con-verted to unbalanced devices with other input levelsby changing the generator output configuration andamplitude. Graphic limits are set as typical for para-metric and graphic equalizer testing, but may be ad-justed as desired.
Certain types of signal processors have largeamounts of phase shift at high frequencies. SystemOne, unlike most other measurement systems, canplot this shift as a continuous function of frequencyeven when the phase shift is many thousands of de-grees. With “deg” selected as the data display unit,System One will inspect each phase reading fromthe hardware and add or subtract the integral multi-ple of 360 degrees which will cause that reading toplot closest to the previous reading. I-OPHASE.TST operates in the “deg” display modeand devices with large phase shift can be plottedsimply by changing the DATA-1 GRAPH TOP andBOTTOM values as desired. If “deg1" is selected,System One will plot on a +/-180 degree fixed scalewith abrupt graphic transitions whenever the meas-ured value exceeds either limit, rather than the con-
tinuous function. Similarly, ”deg3" selects a fixed 0to 360 degree scale instead of continuous data plot-ting.
31.4.2. Interchannel PhaseMeasurements
TAP-PHAS.TST is set up for interchannel phasetesting of three-head stereo tape recorders, but canbe easily speeded up for electronic devices simplyby reducing the SETTLING DELAY from 250 milli-seconds to 30 milliseconds. The phase display sensi-tivity can be adjusted as desired by changing theDATA-1 GRAPH TOP and BOTTOM values afterthe test is run and the maximum excursions areknown.
2HD-PHAS.TST is a test for measuring interchan-nel phase of two-head tape machines in playbackmode, using either the test tape recorded with 2HD-RCRD.TST as described earlier or a pre-recordedreference tape with spot frequencies in ascending or-der.
CDPHASE.TST is set up to measure interchannelphase of a CD player plus frequency response of theleft channel. It is designed to operate with continu-ous analog sweeps (glide tones) such as track 65 ofthe Denon disk and track 41 of the Japan Audio So-ciety disc. Load the test, go to panel mode, start theCD player, press <F4> to set the dBr REF value assoon as the 1 kHz reference signal appears, thenpress <F9> for the test. Uncompensated CD playerswith a single D-to-A converter multiplexed betweenthe two channels will show phase shift (actually,time delay) increasing to about 82 degrees at 20kHz if they are single sampling (44.1 kHz clock)units and about 41 degrees at 20 kHz if double over-sampling (88.2 kHz clock). Units with two D-to-Aconverters or single-converter units with time delaycompensation should show no significant phase shifteven at 20 kHz.
31-12 Audio Precision System One User's Manual

31.4.3. Tape Recorder AzimuthAdjustments
Both reproduce head and record head azimuth ad-justments of tape recorders can be best made withphase measurements, or a combination of phase andamplitude measurements. On a three-head tape ma-chine, reproduce head azimuth must first be adjustedwith use of a reference tape. Record head azimuthmay then be adjusted to match the reproduce head.
Reproduce head azimuth adjustment is commonlydone while playing a reference tape section with arelatively-high frequency tone such as 10 kHz. AZ-REPRO.TST is set up to be used in bargraph (<F2>)mode for reproduce head azimuth adjustment. Inbargraph mode, AZ-REPRO.TST will display threemeasured values. The top bargraph is the playbackamplitude from the left track of the recorder.DATA-1 GRAPH TOP and BOTTOM values mayneed to be modified to provide optimum bargraphdisplay sensitivity for the peaking adjustment. Thecenter bargraph is interchannel phase. The bottombargraph is the measured frequency from the tape.Coarse azimuth adjustment can be done by firstpeaking for maximum amplitude on the top bar-graph. Fine azimuth adjustment is then completedby adjusting for an average of zero degrees inter-channel phase, though the instantaneous readingscan be expected to jitter by tens of degrees on mostanalog tape machines at 10 kHz. Note that the fixeddeg1 units are used for the center bargraph to pre-vent autoranging which would confuse the display.The purpose of the bottom bargraph is to alert theoperator if the reference tape has played on past the10 kHz section to another section which might be in-appropriate for azimuth adjustments.
The test file 3HD-AZIM.TST is set up for easyadjustment of record head azimuth after the repro-duce head has been properly aligned. 3HD-AZIM.TST is designed for use in the <Alt><F9>sweep-erase-repeat mode. This will provide a re-peating five-frequency log-spaced sweep from 1kHz to 15 kHz, plotting interchannel phase as a func-tion of frequency. Alignment of the record head tomatch the already-aligned reproduce head is indi-cated when the data plots as a straight horizontalline across the 1 kHz-15 kHz frequency range. Mis-
alignment is indicated by a graph curving upwardsor downwards as the frequency sweeps. Sincephase is being measured at five frequencies acrossapproximately four octaves, it is impossible to acci-dentally adjust for a phase zero at a high frequencywhich is actually 360 degrees off from proper align-ment, as can be done with steady-tone single-fre-quency methods.
AUDIO TESTING 31-13

31-14 Audio Precision System One User's Manual

32. ANALYZER AND GENERATOR HARDWARE
32.1. Analyzer Block Diagram
Figure 32-1 is a simplified block diagram of theanalyzer and generator with all options other thanthe DSP. The DSP hardware is described in theseparate DSP User’s Manual.
The analyzer diagram shown (serial numberSYS1-20300 or higher), consists of the LVF Leveland Frequency Measurement Module, the DIS Dis-tortion Measurement Module, the PHA-LVF DualInput and Phase Measurement option, the IMD-DISanalyzer option, and the Wow and Flutter analyzeroption.
Assuming that the PHA-LVF module is present,there are identical input circuits for Channels A andB. The signal path is through the input attenuatorsand preamplifiers. At the output of the input signalconditioning block, each channel’s signal is pre-sented to the the phase meter input. This same sig-nal for each channel drives the INPUT MONITORconnector through a 6 dB attenuator. The INPUTMONITOR is intended for applications such as oscil-loscope monitoring; the signal is ground-referenced,with an amplitude range between approximately 1.7Volts peak-to-peak and 3.5 Volts peak-to-peak asthe input amplitude varies and the autoranging cir-cuit functions.
The phase meter measures phase by comparingthe zero crossing times (average of both positive andnegative zero crossings to eliminate errors due tonon-symmetrical signals) at the B input with refer-ence to the A input.
The input autoranging control circuits are peaksensitive in order to prevent overload of amplifierstages even with high crest factor signals. Autorang-ing is effected by switching both attenuation and am-plification, and takes place in 6 dB steps from 160Vrms down to 80 millivolts rms, which is the most
sensitive input range. Below 80 mV, the amplitudesof the INPUT MONITOR jack and all other internalsignals drop in direct proportion.
Either A or B is selected to drive the principal(READING) voltmeter. With System One hardwarebelow s/n SYS1-20300, this same selected signal al-ways also drives the LEVEL voltmeter and the fre-quency counter. With hardware of serial SYS1-20300 or higher, the selected signal drives bothLEVEL and RDNG voltmeters and the counter inall functions except 2-CHANNEL and CROS-STALK. In those two functions, the selected chan-nel drives the READING voltmeter while the alter-nate channel drives the LEVEL voltmeter and thefrequency counter.
For selective frequency measurement of one por-tion of a complex signal or simply for increased fre-quency-measurement sensitivity, it is possible to con-nect the counter to the output of the BP/BR filter onunits above serial number SYS1-20300. This con-nection will result while the RDNG meter is ineither BANDPASS, BANDREJECT, or W+F modesif the BP/BR frequency is either swept (SOURCE-1ANLR BP/BR) or the ANLR BP/BR frequency con-trol on the ANALYZER panel is changed fromAUTO to a fixed frequency .
If any of the standard low-pass filters (80 kHz,30 kHz, or 22 kHz) are selected, another low passfilter will be inserted prior to the counter to improveits performance under noisy conditions. The fre-quency counter is a period-average measuring de-sign, with the period reciprocal computed by theLVF microprocessor for display as frequency. Gatetimes, which determine the number of signal periodsaveraged, are selected by the reading rate control.The signal amplitude at the channel selection pointis measured by the LEVEL voltmeter on the DISboard.
32-1

Figure 32-1 Analyzer and Generator Block Diagrams
32-2 Audio Precision System One User's Manual

If THD+N, BANDPASS, BANDREJECT, orCROSSTALK modes are selected, the signal ispassed through the two-stage filter in the appropriateconfiguration. Filter gain is either 0 dB or 12 dB,depending on its output amplitude. In THD+Nmode with relative units (%, dB, etc.), the computercalculates the ratio of distortion products (principalvoltmeter) to original signal amplitude (LEVEL me-ter) and displays the result as READING. No setlevel or automatic gain control is thus needed. Use-ful THD+N measurements may be made with signalamplitudes of tens of microvolts if the BP/BR filterfrequency is fixed at the signal fundamental fre-quency. If AMPLITUDE or W&F is selected, thesignal is simply passed back to the LVF board with-out filtering or additional gain.
If the IMD-DIS option is present and selected inSMPTE mode, the signal flows through a 2 kHzhigh pass filter to remove the low frequency tone.It is then demodulated by an amplitude modulationdetector and the output is processed by a low-passfilter to remove any residual high frequency tone. Ifthe BP/BR filter selection on the ANALYZER panelis AUTO, the DIS filter is configured as a band re-ject filter and positioned to increase rejection of thehigh frequency tone. If the BP/BR filter is changedto a fixed frequency or swept by selecting LVFBPBR as SOURCE-1, the filter is configured as abandpass and can select individual intermodulationproducts.
In CCIF and DIM IMD modes, the signal after in-put signal conditioning is fed to a 16-pole 2.45 kHzelliptical low pass filter. In CCIF mode, the DISbandpass filter is cascaded with the output of theIMD-DIS board. This bandpass filter will be auto-matically tuned to the CCIF difference frequency, asmeasured by the frequency counter when in CCIFanalysis mode. In DIM analysis mode, the output ofthe 2.4 kHz low-pass filter is not processed by theDIS bandpass filter if the ANALYZER panel selec-tion for BP/BR is AUTO. If the selection ischanged to a specific frequency or swept by choos-ing SOURCE-1 as LVF BPBR, the bandpass filterwill further process the output of the IMD-DISboard.
An additional controllable gain stage followingthe DIS module signal return point is controlled bya second peak-sensitive autoranging control circuit.It is this autoranging function which can be over-rid-den by changing the AUTO field near the top of theANALYZER control panel to one of the fixed gainranges. Selectable low pass filters, sockets for op-tional filters (plus the external filter connectionswith A-version hardware), and selectable high passfilters follow. A final amplification stage drives themeasurement detectors. This same signal, through a6 dB isolation pad, feeds the connector labeledPROCESSED SIGNAL OUT on units below s/nSYS1-20300 and READING in units above SYS1-20300. This connector, provided for oscilloscope orspectrum analyzer monitoring, shows the final ac sig-nal which is presented to the detector inputs after allprocessing.
When the Wow and Flutter option is present andselected, the signal after conditioning is fed to eithera 2.4 kHz-4.0 kHz bandpass for normal wow andflutter modes or to a 4 kHz-20 kHz bandpass filterfor the “HB” (scrape flutter) modes. The output ofthe selected bandpass is fed to a frequency modula-tion discriminator. The discriminator output may befed through a wow and flutter weighting filter or feddirectly to a low-frequency-optimized detector onthe W&F board. The dc output of this detector maythen be selected instead of one of the ANALYZERdetectors.
The dc output of the selected detector drives avoltage-to-frequency converter of approximately 100kHz full scale at 2.5 Volts dc input. The v-to-f con-verter’s pulse train output is fed to a frequencycounter with selectable gate times of approximately32 ms (32 readings/second), 64 ms (16 read-ings/sec), 130 ms (8 readings/sec), and 260 ms (4readings/second). The counter full scale resolutionranges from approximately 3,150 counts at 32 read-ings/second to about 25,200 counts at 4 readings/sec-ond.
The autorange circuit control, detector v-to-f con-verter output frequency measurement, frequencycounter, and phase meter are all managed by a 6805
ANALYZER AND GENERATOR HARDWARE 32-3

microprocessor on the LVF Module, which alsomanages other low-level activity where fast re-sponse time is needed.
32.2. Generator Block Diagram
The generator block diagram is shown in thelower portion of Figure 32-1. The main oscillator isa state-variable design using two 13-bit MDACs(multiplying D/A converters) as variable resistors tocontrol frequency over a 10:1 or 20:1 range. Rangeselection is by switched capacitors, with the fourranges being 10 Hz-204 Hz, 204 Hz-2.04 kHz, 2.04kHz-20.4 kHz, and 20.4 kHz-204 kHz. In sinewavemodes, this oscillator output is selected into the fineamplitude control circuitry whose variable elementis another 13-bit MDAC. The signal is then passedthrough a switchable 0/24 dB gain stage and into theoutput power amplifier. The power amplifier outputis transformer-coupled into a compensated resistiveattenuator with a 36 dB range in 12 dB steps. Fol-lowing this attenuator (assuming a two-channel out-put), the signal is resistively split into two pathswith selectable build-out resistors establishing thespecified source impedances. The AMPLITUDEvalue entered by the user into the GENERATORpanel will control the fine amplitude MDAC, 24 dBgain stage, and output attenuators in a manner trans-parent to the user in order to optimize output signal-to-noise ratio while providing better than 0.01 dB(or 1.27 microvolts, whichever is greater). If eitheroutput is OFF, the connector will be reverse-termi-nated in the selected output impedance.
32.2.1. Intermodulation Test SignalGeneration Hardware
When the IMD generator option is present and anIMD waveform selected, the main oscillator signalis fed to the IMD-GEN module to be combined witha second signal generated within this module. InSMPTE (DIN) waveform mode, the IMD-GEN mod-ule generates a low-frequency sinewave at one ofseven selectable frequencies and combines this withthe main oscillator signal in either a 4:1 or 1:1 am-plitude ratio, as selected. This complex signal isthen fed to the fine amplitude MDAC.
In CCIF waveform mode, the same low-fre-quency sinewave generator with the same seven se-lectable frequencies feeds one input of an analogmultiplier (balanced modulator). The main oscilla-tor signal is the other input. The output of the multi-plier is a DSSC (double sideband suppressed carrier)signal, which is fed to the fine amplitude MDAC.The main oscillator signal supplies the suppressedcarrier, typically attenuated more than 50 dB. Thetwo sidebands are spaced above and below the sup-pressed carrier by the frequency of the low-fre-quency oscillator on the IMD-GEN board. Thus,the spacing between the two sidebands is twice thefrequency of the low-frequency oscillator and thesoftware control panel is calibrated by that spacingvalue. To generate the typical 13 kHz/14 kHz CCIFtest tone pair, for example, the main oscillator is setto 13.5 kHz and the IM-FREQ value is selected as 1kHz. This selection actually produces a 500 Hz sine-wave from the low-frequency oscillator. The resultis a calibrated-amplitude two-tone pair at 13 kHzand 14 kHz, with a suppressed “carrier” some 50 dBbelow the 13 kHz and 14 kHz tones.
In DIM (dynamic intermodulation or transient in-termodulation) waveform, the IMD-GEN modulegenerates a squarewave at 3.15 kHz (DIM-30 orDIM-100) or 2.96 kHz (DIM-B). The main oscilla-tor frequency should be set by the user to 15 kHzfor DIM-30 or DIM-100, or to 14 kHz for DIM-B.This main oscillator signal is combined with thesquarewave at a level 12.04 dB below the peak am-plitude of the squarewave and fed to the fine ampli-tude MDAC.
32.2.2. BUR Option Hardware
The BUR option adds sinewave burst, square-wave, and noise generation capabilities to the Sys-tem One generator.
In sinewave burst modes, the sinewave signal isgenerated by the main oscillator. The BUR optionprovides synchronous switching at sinewave posi-tive-going zero crossings between a unity-gain valueand an attenuated value and feeds the fine amplitude
32-4 Audio Precision System One User's Manual

MDAC. Free-running burst, triggered, and gatedmodes are available as described in the BUR-GENchapter of this manual.
Squarewaves are generated by a special circuitthat optimizes symmetry for minimum even-har-monic content. The output of this generator is fur-ther low-pass filtered to control the risetime charac-teristics and limit energy content above 500 kHz tonegligible levels.
In noise modes, random or pseudo-random whitenoise is digitally generated in the BUR-GEN mod-ule and fed to the fine amplitude MDAC. ThePINK selection adds a 3 dB per octave “pinking”(high-frequency attenuation) filter to the path. Inthe BPASS and EQBPN modes, the output of thepinking filter is fed back into the main oscillator cir-cuitry and passed through the main oscillator state-variable filter configured as a two-pole one-third oc-tave bandpass filter. The output of that filter is thenfed to the fine amplitude control. Thus, the FRE-QUENCY field on the GENERATOR panel con-trols the center frequency of this bandpass-filteredpink noise.
32.2.3. Auxiliary GeneratorConnectors
The GEN Generator Module has two auxiliaryoutputs available at BNC connectors on a separatepanel which may be mounted on the front or rear ofthe enclosure.
SYNC is a ground-referenced squarewave suit-able for driving LSTTL circuitry. In sinewavemodes, the SYNC signal is at the generator fre-quency. In SMPTE IMD mode, the SYNC signal isat the low tone frequency. In CCIF IMD mode,SYNC is at one-half the spacing of the two-tonepair. In DIM IMD mode, SYNC is at the DIMsquarewave frequency. In PSEUDO noise mode, apulse at the pseudorandom cycle repetition rate (ap-proximately 4/sec) appears at the SYNC connector.No signal is present in RANDOM noise modes. InSINE BURST, SINE TRIG, and SINE GATEmodes, the SYNC signal follows the envelope of theoutput signal.
MONITOR is also ground-referenced. It is afixed-amplitude (approximately 2.8 Volts peak-to-peak) version of the selected waveform. It will thusbe a sinewave in SINE modes, the intermodulationtest signal in IMD modes, a noise signal in noisemodes, a burst signal in burst modes, etc. This sig-nal is, however, picked off before the GENER-ATOR OUTPUT ON-OFF control and will thus bepresent even when the generator is turned off on theGENERATOR panel.
The panel also includes a BNC connector labeledTRIGGER/GATE input for control of the triggeredand gated sine burst modes of the BUR-GEN mod-ule. See the BURST-SQUAREWAVE-NOISE gen-erator for operational, timing, and logic level details.
ANALYZER AND GENERATOR HARDWARE 32-5

32-6 Audio Precision System One User's Manual

33. S1.EXE ERROR REPORTING DESCRIPTIONS
System One software can report various errors.The following information is a brief discussion ofthe most likely causes, and corrections.
B
bad command
CAUSES : Attempting to enter data into a proce-dure, macro, comments, or data buffer, using the in-sert mode when there isn’t sufficient memory re-maining in the selected buffer to accept the data.
CORRECTIONS : Restart S1.EXE using the /Bcommand line option to define the size of the desti-nation buffer so that it is large enough to contain therequired data.
NOTE : This error alternates with the “no moreroom for insertions” error.
Block too large for buffer and will be lost. Deleteanyway? (y/n)
CAUSES :
1 : Attempting to block delete data with the F6function key to the copy buffer when the amount ofmemory available in the selected procedure, macro,comment, or data buffer is insufficient to contain thedata designated to be moved into the copy buffer.
2 : Attempting to block delete data with the Alt.F6 function key into the macro copy buffer whenthe amount of memory available in the selected pro-cedure, macro, comment, or data buffer is insuffi-cient to contain the data designated to be movedinto the macro copy buffer.
NOTE : The size of the copy or macro copy buff-er that the data is stored into when using the F6 orAlt. F6 function keys is based on the amount ofmemory left over in the selected procedure, macro,comment, or data buffer before removing the data.
CORRECTIONS :
1 : If the goal is to delete, not copy, type “y” forYES to delete the selected data.
2 : If the goal is to copy the block of text, restartS1.EXE using the /B command line option to definethe size of the destination buffer so that it is largeenough to contain the required data.
BURST INTERVAL MUST BE LARGERTHAN ON-TIME
CAUSES : Attempting to set the BURST ON pa-rameter to a value which exceeds the BURST IN-TERVAL.
CORRECTIONS : Increase the BURST INTER-VAL to a value larger than the BURST ON value ordecrease the BURST ON value to a value less thanthe BURST INTERVAL.
C
Cannot compute DATA-2 when HOR-AXIS is se-lected
CAUSES : An attempt was made to compute nor-malize, compute smooth, compute center, computelinearity, compute the wow & flutter 2-sigma value,or compute delta values from DATA-2 data whenthe sweep definitions panel secondary controlssweep measurement mode is set to HOR-AXIS.
CORRECTIONS : Don’t select 2 for the DATAselection in the normalize, smooth, center, computelinearity, compute 2-sigma, or compute delta func-tions when the secondary controls sweep measure-ment mode is set to HOR-AXIS.
CANNOT EDIT PROCEDURE DURING RE-CORD OR PLAYBACK
CAUSES :
33-1

1 : The procedure that is being executed containscommands to edit the procedure that is currently be-ing run.
2 : In the process of creating a procedure usingthe UTIL LEARN mode the EDIT & PROCEDUREcommands are selected to edit the procedure cur-rently in the procedure buffer.
CORRECTIONS : Break out the section of codeto be dynamically altered into a sub-procedure.Then from the main procedure edit the sub proce-dure in the comments buffer using the EDIT &COMMENT commands from the command menu(CMD:). This will allow you to dynamically edit atest procedure.
CANNOT LOAD OR EDIT MACRO WHILERUNNING MACRO — MACRO HALTED
CAUSES :
1 : An EDIT MACRO command was executedfrom within an executing macro.
2 : A LOAD MACRO command was executedfrom within an executing macro.
CORRECTIONS : Eliminate all instances wherea macro edits or loads another macro.
CANNOT RUN SHELL — FILE SPECIFIEDNOT EXECUTABLE
CAUSES : When using the command menu(CMD:) DOS or XDOS function, DOS has returnedan error code designating that the specified file isnot executable because its format does not match theDOS specification for an executable file.
CORRECTIONS : Verify that the file is an ex-ecutable file and that the file name and path is en-tered correctly in the command menu (CMD:) DOSor XDOS function.
CANNOT RUN SHELL — FILE SPECIFIEDNOT FOUND
CAUSES : When using the command menu(CMD:) DOS or XDOS function, DOS has returnedan error code designating that the specified file wasnot located.
CORRECTIONS : Verify that the path and filename are correct.
CANNOT RUN SHELL — NOT ENOUGHMEMORY RESERVED (USE /Rx OPTION)
CAUSES : When using the command menu(CMD:) XDOS or DOS functions, DOS has re-turned an error code designating that sufficient mem-ory is not available to temporarily exit to DOS with-out removing S1.EXE from memory.
CORRECTIONS : Force S1.EXE to reserve atleast 45K of DOS memory before allocating the re-maining memory to the internal buffers. This willguarantee that DOS has 45K of available memory torun executable programs. This is accomplished bystarting S1 .EXE software with the following com-mand line.
EXAMPLE : “S1 /R45”
NOTE : The 45k of available memory required toperform a DOS SHELL is based on requirementsfor DOS version 5.0.
CANNOT RUN SHELL — REASON UN-KNOWN
CAUSES : When using the command menu(CMD:) XDOS or DOS functions, DOS has re-turned an error code designating that an undeter-mined error has occurred that prevents a DOS shellfrom being performed.
CORRECTIONS : Investigate and correct thecause of the abnormal exit condition from the ex-ecutable program.
33-2 Audio Precision System One User's Manual

Cannot set this field in AUTO mode
CAUSES :
1 : An attempt was made to set the reading meterrange field while the range mode field is set toAUTO.
2 : An attempt was made to set the channel 1 or2 input range field while the range mode field is setto AUTO.
CORRECTIONS :
1 : Set the reading meter range units field to(* or dB), then set the range field to the desiredrange setting.
2 : Set the channel 1or 2 input range units fieldto one of the available units, then set the channel 1or 2 input range field to the desired range setting.
Ch A de-emphasis overload detected
NOTE : Error generated by the MLS DSP pro-gram.
CAUSES : In the MLS DSP program clipping ofthe DSP INPUT channel 1 de-emphasis (un-pinking)filter has occurred.
CORRECTIONS :
1 : Reduce the input level for DSP INPUT chan-nel 1.
2 : Select the FLAT weighted MLS sequencefrom the MLS DSP panel right-hand WAVEFORMfield.
NOTE : The un-pinking filter is used with pinkweighted MLS sequencies only.
Ch B de-emphasis overload detected
NOTE : Error generated by the MLS DSP pro-gram.
CAUSES : In the MLS DSP program clipping ofthe channel 2 de-emphasis (un-pinking) filter has oc-curred.
NOTE : The un-pinking filter is used with pinkweighted MLS sequencies only.
CORRECTIONS :
1 : Reduce the input level for DSP INPUT chan-nel 2.
2 : Select the FLAT weighted MLS sequencefrom the MLS DSP panel right-hand WAVEFORMfield.
COMMENTS FILE TOO LARGE TO LOAD
CAUSES : The default or designated edit com-ments buffer size is too small to hold the required in-formation.
CORRECTIONS : Increase the size of the editcomment buffer to a value large enough to accom-modate the largest ASCII file that is required to beloaded. As a rule set the edit comment buffer size tothe file size of the largest file to be loaded as deter-mined by the DOS directory command.
NOTE : The following example sets the com-ments buffer to 1000 characters.
EXAMPLE “S1 /Bn,n,n,n,1000,n”.
COMMENTS TOO LARGE FOR BUFFER —TEXT AT END MAY BE LOST
CAUSES : The default or designated commentsbuffer size is too small to hold the comments con-tained within the test (*.TST), overlay (*.OVL),sweep (*.SWP), equalization (*.EQ), or limit(*.LIM) file that is being loaded.
CORRECTIONS : If the comments are importantand the test is to be re-saved, increase the size of theedit comments buffer to a value large enough to ac-commodate the comments contained within the file
ERROR MESSAGES 33-3

being loaded. If the test will not be saved or if thecomments are not important, the warning messagemay be ignored.
NOTE : The following example sets the com-ments buffer to 1000 characters.
EXAMPLE “S1 /Bn,n,n,n,1000,n”.
Conflict with Maximum amplitude
CAUSES :
1 : A value entered into the generator panel ampli-tude field manually or via a procedure is greaterthan the available generator maximum amplitude forthe selected units, frequency, and output configura-tion.
2 : Attempting to increment or sweep the ampli-tude above the maximum amplitude value for the se-lected output configuration was made.
3 : Attempting to manually set the generator toneburst off amplitude to a level greater than 100%.
4 : Attempting to set the generator tone burst offamplitude, via the sweep definitions panel (TB-LVL), or procedurally, to a value greater than 100%.
CORRECTIONS :
1 : Enter a value into the generator amplitudefield that is less than the generator maximum ampli-tude for the selected units, frequency, and outputconfiguration.
2 : Verify that the sweep definitions generator am-plitude parameter remains below the generator maxi-mum amplitude for the selected units, frequency,and output configuration.
3 : Verify that the generator tone burst off ampli-tude remains below 100%.
4 : Verify that the sweep definitions generatortone burst off amplitude parameter remains below100%.
Conflict with Maximum DC Volts
CAUSES : A value entered manually, in a sweep,or procedurally into the DCX-127 panel DC OUT1&2 volts field is greater than maximum DC voltslevel.
CORRECTIONS : Check that the value enteredmanually, on the sweep definitions panel, or proce-durally into the DCX-127 DC OUT 1&2 volts fieldis less than the DC volts maximum level of 10.5Volts.
Conflict with Maximum frequency
CAUSES :
1 : Attempting to enter a value into the generatorpanel frequency field manually or procedurally thatis above the maximum frequency value for the se-lected waveform.
2 : Attempting to sweep or increment the fre-quency to a value above the maximum frequencyvalue for the selected waveform.
CORRECTIONS : Assure that the value enteredinto the generator frequency field or maximumvalue on the sweep definitions panel falls below thegenerator maximum frequency value for the selectedwaveform.
Conflict with Minimum amplitude
CAUSES :
1 : A value entered into the generator panel ampli-tude field manually, in a sweep, or procedurally isless than the minimum generator amplitude for theselected units, frequency, and output configuration.
2 : Attempting to set or decrement the generatoramplitude below zero for the Vrms, Vp-p, and Wunits.
3: Attempting to manually set the generator burstoff amplitude to a level less than -80.17 dB.
33-4 Audio Precision System One User's Manual

4 : Attempting to set the generator tone burst offamplitude (TB-LVL), via the sweep definitionspanel, to a level below -80.17 dB.
CORRECTIONS :
1 : Enter a value into the generator amplitudefield that is greater than the generator minimum am-plitude for the selected units, frequency, and outputconfiguration.
2 : Verify that the sweep definitions generator am-plitude parameter remains above the generator mini-mum amplitude for the selected units, frequency,and output configuration.
3 : Verify that the generator tone burst off ampli-tude remains above -80.17dB.
4 : Verify that the sweep definitions generatortone burst off amplitude parameter remains above-80.17dB.
Conflict with Minimum dBr reference
CAUSES : An attempt was made to set the gener-ator or analyzer dBr reference field to a value of1.0e-9 or below.
CORRECTIONS : Set the generator or analyzerdBr reference field to a reference value greater than1.0e-9.
Conflict with Minimum DC Volts
CAUSES : A value entered manually, in a sweep,or procedurally into the DCX-127 panel DC OUT1&2 volts field is less than minimum DC volts level.
CORRECTIONS : Check that the value enteredmanually, on the sweep definitions panel, or proce-durally into the DCX-127 DC OUT 1&2 volts fieldis greater than the DC volts minimum level -10.5Volts.
Conflict with Minimum frequency
CAUSES :
1 : Attempting to enter a value into the generatorpanel frequency field manually, via a procedure, dur-ing a sweep, or from a sweep table that is below theminimum frequency value for the selected waveform.
2 : Attempting to decrement the frequency to avalue below the frequency minimum value for theselected waveform.
3: An attached sweep table has a blank line in-be-tween the header and the first data point.
CORRECTIONS :
1-2 : Enter a value into the generator frequencyfield or into the sweep definitions panel that fallsabove the generator minimum frequency value forthe selected waveform.
3 : The most likely cause is that external process-ing was done to the sweep table file, and the headerand data was not reconstructed correctly before itwas loaded and saved as a sweep source file.
Conflict with Minimum reference R
CAUSES : An attempt was made to set the gener-ator or analyzer dBm/W reference field to a valueless than 0.1 ohms.
CORRECTIONS : Set the generator or analyzerdBm/W reference field to a load impedance valueequal to or greater than 0.1 ohms.
D
DATA SAMPLES MUST BE <=6 TO CHANGEFROM AVG MODE
CAUSES : Attempting to set the sweep settlingpanel settling mode to EXPONENTIAL, FLAT orOFF while the data samples value is greater than 6.
CORRECTIONS : Set the data samples to avalue less than or equal to 6, then change the set-tling mode to the desired selection.
ERROR MESSAGES 33-5

DATA TOO LARGE FOR BUFFER — DATAAT END MAY BE LOST
CAUSES :
1 : The default or designated data buffer size istoo small to hold the data (# STEPS plus one) con-tained within the test (*.TST), overlay (*.OVL),sweep (*.SWP), equalization (*.EQ) or limit(*.LIM) file that is being loaded.
2 : The default or designated edit data buffer sizeis too small to hold the acquired or loaded data.
CORRECTION REQUIRED TO VIEW DATAWITH <F7>, PRINT, ETC. :
1 : Increase the size of the points data buffer to avalue large enough to accommodate the data con-tained within the file being loaded.
EXAMPLE “S1 /B500,n,n,n,n,n”.
CORRECTION REQUIRED IN ADDITION TOTHE ABOVE IF YOU WISH TO EDIT THEDATA:
2 : Increase the size of the edit data buffer to avalue large enough to accommodate the data. Thedata header consists of 60 characters and each meas-urement occupies 38 characters for DATA1 measure-ments and an additional 23 characters for DATA2measurements. To edit data consisting of 50DATA1 measurements the edit data buffer shouldbe set to 1960 by using the following command lineoption when starting S1.EXE.
EXAMPLE “S1 /Bn,n,1960,n,n,n”.
To edit data consisting of 50 DATA1 measure-ments and 50 DATA2 measurements the edit databuffer should be set to 3111 by using the followingcommand line option when starting S1.EXE.
EXAMPLE “S1 /Bn,n,3111,n,n,n”.
DIO option not present — A/D or DGEN areonly valid input settings
NOTE : Error generated by FFTGEN,FFTSLIDE, MLS, FASTTEST, & FASTTRIG DSPprograms. “DIO option” refers to digital input-out-put module which is part of System One Dual Do-main (SYS-3nn)
CAUSES : Attempting to select a digital inputwith “System One + DSP” models (SYS-2nn).
CORRECTIONS : Select A/D or DGEN as theDSP input selection only.
DIO option not present — D/A is only valid out-put setting
NOTE : Error generated by FFTGEN, MLS,FASTTEST, & FASTTRIG DSP programs. “DIOoption” refers to digital input-output module whichis part of System One Dual Domain (SYS-3nn)
CAUSES : Attempting to select a digital sourcewith “System One + DSP” models (SYS-2nn).
CORRECTIONS : Select D/A as the DSP outputselection only.
DOS CANNOT RUN A SHELL (COMSPECNOT FOUND IN THE ENVIRONMENT)
CAUSES : The computer operating system can-not locate the command interpreter(COMMAND.COM).
CORRECTIONS : Enter the text in the followingexample into your AUTOEXEC.BAT file and warmboot the computer (Ctrl/Alt/Delete) if a copy ofCOMMAND.COM is located in your (C:\DOS) di-rectory.
EXAMPLE :
“SET COMSPEC=C:\DOS\COMMAND.COM”
DSP does not respond to RESET.
CAUSES :
33-6 Audio Precision System One User's Manual

1 : Interruption of the APIB bus communication.
2 : Software or hardware failure.
CORRECTIONS :
1 : Restart S1.EXE and the System One hardwareafter correcting any problems with the cable connect-ing the PC to System One.
2 : Report error to Audio Precision.
DSP HOST VECTOR NOT AVAILABLE
CAUSES :
1 : Interruption of the APIB bus communication.
2 : Interruption of power to System One.
3 : Incorrect DSP firmware for DSP programsversions 5.0 and higher.
NOTE : All DSP units shipped prior to January30, 1990 must be re-programmed with theEE22.EXE program before the version 5.0 andhigher DSP programs will function properly.
CORRECTIONS :
1 : Restart S1.EXE and the System One hardwareafter correcting any problems with the cable connect-ing the PC to System One.
2 : Use the commands UTIL RESTORE from thecommand menu (CMD:) to reset the System Onehardware to the state defined by the currently loadedtest.
3 : Run the EE22.EXE program specified in theDSP Program Technical Bulletin shipped October1992.
DSP IS NOT RETURNING READINGS
CAUSES :
1 : Interruption of the APIB bus communication.
2 : Failure of DSP to update readings. Softwareor hardware failure.
CORRECTIONS :
1 : Restart S1.EXE and the System One hardwareafter correcting any problems with the cable connect-ing the PC to System One.
2 : Report error to Audio Precision.
DSP READING UNIT SELECTED MUSTHAVE INPUT SOURCE FROM ANLR
CAUSES :
1 : FFTGEN.DSP, FFTSLIDE.DSP, MLS.DSP
1.1 : Attempting to set the AMPL-1 or AMPL-2measurement units to one of the ratio selections (%,dB, PPM, X/Y) while a DSP channel 1 or 2 inputsource is set to GEN, DSP-A, DSP-B, or NONE.
2 : HARMONIC.DSP
2.1 : Attempting to set the FIL LVL 1 measure-ment unit to one of the ratio selections (%, dB)while a DSP channel 1 or 2 input source is set toGEN, DSP-A, DSP-B, or NONE.
CORRECTIONS :
1.1 : Select AMPL-1 and AMPL-2 measurementunits that are not one of the ratio units (%FS, dBFS,V, dBm, dBu, dBV, dBr, W, or NONE) or selectRDNG as the DSP channel 1 and 2 input source.Selecting ANLR-A or ANLR-B for the inputsources will eliminate this error but will produce the“RATIO UNIT NOT SUPPORTED FOR DSPREADINGS FROM ANLR-A or ANLR-B” error.
2.1 : Select a FIL LVL 1 measurement unit thatis not one of the ratio units (Vrms, dBm, dBu, dBV,dBr, W, or NONE) or select RDNG as the DSPchannel 1 and 2 input source. Selecting ANLR-Aor ANLR-B for the input sources will eliminate thiserror but will produce the “RATIO UNIT NOT SUP-PORTED FOR DSP READINGS FROM ANLR-Aor ANLR-B” error.
ERROR MESSAGES 33-7

DSP RECEIVE REGISTER NOT AVAILABLE
NOTE : Error generated by all DSP programs.
CAUSES :
1 : Interruption of the APIB bus communication.
2 : Interruption of power to System One.
3 : Incorrect DSP firmware for DSP programsversions 5.0 and higher.
NOTE : All DSP units shipped prior to January30, 1990 must be re-programmed with theEE22.EXE program before the version 5.0 andhigher DSP programs will function properly.
CORRECTIONS :
1 : Restart S1.EXE and the System One hardwareafter correcting any problems with the cable connect-ing the PC to System One.
2 : Use the commands UTIL RESTORE from thecommand menu (CMD:) to reset the System Onehardware to the state defined by the currently loadedtest.
3 : Run the EE22.EXE program specified in theDSP Program Technical Bulletin shipped October1992.
DSP TRANSMIT REGISTER NOT AVAIL-ABLE
NOTE : Error generated by all DSP programs.
CAUSES :
1 : Interruption of the APIB bus communication.
2 : Interruption of power to System One.
CORRECTIONS :
1 : Restart S1.EXE and the System One hardwareafter correcting any problems with the cable connect-ing the PC to System One.
2 : Use the commands UTIL RESTORE from thecommand menu (CMD:) to reset the System Onehardware to the state defined by the currently loadedtest.
DSP: Conflict with Maximum setting
NOTE : Error generated by all DSP programs.
CAUSES :
1 : BITTEST
1.1 : Attempting to set, sweep, or increment thedigital generator frequency (DGEN FREQ) to avalue greater than 8.007996kHz at a 32kHz samplerate, 11.036kHz at 44.1kHz, 12.011kHz at a 48kHzvia the panel interface, sweep definitions panel, orprocedurally.
1.2 : Attempting to set, sweep, or increment thegenerator amplitude (AMPL) to a value greater than100% FS (Full Scale) or 0 dBFS via the DSP panelinterface, sweep definitions panel, or procedurally.
1.3 : Attempting to set the constant value(VALUE) to a decimal value greater than 7fffffHEX via the DSP panel interface, sweep definitionspanel, or procedurally.
1.4 : Attempting to execute a SOURCE-1 sweepwith the GENFRQ start or stop frequency set to val-ues greater than one-half the sample rate, theGENAMP start or stop set to values greater than100% FS or 0 dBFS, the TIME start or stop set tovalues greater than 341.6 mS.
2 : FFTGEN
2.1 : Attempting to set or increment the generatorfrequency (DGEN FREQ) to a value greater than468.75Hz at a 1kHz sample rate, 3.753kHz at 8kHz,15.01499kHz at 32kHz, 22.533kHz at 48kHz, or20.69188kHz at 44.1kHz via the DSP panel inter-face, sweep definitions panel, or procedurally.
33-8 Audio Precision System One User's Manual

2.2 : Attempting to set or increment the generatoramplitude (AMPL) to a value greater than 100% FS(Full Scale) or 0 dBFS via the DSP panel interface,sweep definitions panel, or procedurally.
2.3 : Attempting to execute a SOURCE-2 sweepwith the digital generator (GENFRQ) start (GRAPHTOP) or stop (BOTTOM) frequencies set to valuesgreater than one-half the sample rate, the digital gen-erator amplitude (GENAMP) start or stop ampli-tudes set to values greater than 100% FS or 0 dBFS.
2.4 : Attempting to make a frequency domain dis-play (SOURCE-1 DSP FREQ) “sweep” with the fre-quency start or stop frequencies set to values greaterthan one-half the sample rate, or a time domain dis-play with the TIME start or stop set to a valuesgreater than 16.39 seconds at a 1kHz sample rate,2.05 seconds at 8kHz, 512.5 mS at 32kHz, 341.6mS at 48kHz, 85.41 mS at 192kHz, 371.8 mS at44.1kHz, and 92.97 mS at a 176.4kHz sample ratevia the sweep definitions panel or procedurally.
3 : FFTSLIDE
3.1 : Attempting to set, sweep, or increment thestart time (FFT START) to a value greater than30.75 sec at a 1kHz sample rate, 3.844 sec at 8kHz,.9609 at 32kHz, 640.6 mS at 48kHz, 160.2 mS at192kHz, 697.3 mS at 44.1kHz, and 174.3 mS at176.4kHz via the DSP panel interface, sweep defini-tions panel, or procedurally.
3.2 : Attempting to set, sweep, or increment theamount of data acquired before trigger (PRE-TRIG)to a positive value via the DSP panel interface,sweep definitions panel, or procedurally. All valuesfor this field should be negative.
3.3 : Attempting to execute a SOURCE-2 sweepwhen the STRT or PRET start (GRAPH TOP) orstop (BOTTOM) times are set to values greater thanthose specified in sections 3.1 or 3.2 for this error.
3.4 : Attempting to make a frequency domain dis-play (SOURCE-1 DSP FREQ) “sweep” with theFREQ start or stop set to values greater than one-half the sample rate, or a time domain display withthe TIME start or stop value set to values greater
than 30.75 sec at a 1kHz sample rate, 3.844 sec at8kHz, .9609 at 32kHz, 640.6 mS at 48kHz, 160.2mS at 192kHz, 697.3 mS at 44.1kHz, and 174.3 mSat 176.4kHz via the sweep definitions panel or pro-cedurally.
4 : GENANLR
4.1 : Attempting to set or sweep the generator fre-quency (DGEN FREQ) to a value greater than15.01499kHz at a 32kHz sample rate, 22.522kHz at48kHz, and 20.69188kHz at 44.1kHz via the DSPpanel interface, sweep definitions panel, or proce-durally.
4.2 : Attempting to set or sweep the generator am-plitude (AMPL) to a value greater than 100% FS(Full Scale) or 0 dBFS via the DSP panel interface,sweep definitions panel, or procedurally.
4.3 : Attempting to set or sweep the filter fre-quency (FILT FREQ) to a value greater than14.62647kHz at a 32kHz sample rate, 21.7897kHzat 48kHz, and 20.01901kHz at 44.1kHz via the DSPpanel interface, sweep definitions panel, or proce-durally.
4.4 : Attempting to execute a SOURCE-1 sweepwith the GENFRQ start or stop frequency valuesgreater than specified in section 4.1 for this error,the GENAMP start or stop values greater than 100%FS (Full Scale) or 0 dBFS, the FILFRQ start or stopvalues greater than specified in section 4.3 for thiserror.
5 : HARMONIC
5.1 : Attempting to set or sweep the bandpass fil-ter frequency to a value greater than 21.76799kHz ata 48kHz sample rate, and 87.07198kHz at 192kHzvia the DSP panel interface, sweep definitions panel,or procedurally.
5.2 : Attempting to set or sweep the bandpass fil-ter harmonic multiplier (HARMONIC) to a valuegreater than 9 via the DSP panel interface, sweepdefinitions panel, or procedurally.
ERROR MESSAGES 33-9

5.3 : Attempting to set or sweep the bandpass fil-ter frequency offset (F OFFSET) to a value greaterthan 21.79046kHz at a 48kHz sample rate, and87.16185kHz at 192kHz via the DSP panel inter-face, sweep definitions panel, or procedurally.
5.4 : Attempting to execute a SOURCE-1 sweepwith the FREQ start or stop frequency valuesgreater than specified in section 5.1 for this error,the HARM start or stop values greater than 9, theF_OFF start or stop values greater than specified insection 5.3 for this error.
6 : FASTTEST
6.1 : Attempting to set the frequency resolution(FREQ RES) for W&F to a value greater than5.00489 or increment the setting to a value greaterthan 5 via the DSP panel interface, sweep defini-tions panel, or procedurally.
6.2 : Attempting to set or sweep the generator am-plitude (DGEN AMPL) to a value greater than100% FS (Full Scale) or 0 dBFS via the DSP panelinterface, sweep definitions panel, or procedurally.
6.3 : Attempting to execute a SOURCE-2 sweepwith the frequency resolution (FREQRS) start(GRAPH TOP) or stop (BOTTOM) percentage setgreater than 5%, the digital generator amplitude(GENAMP) start or stop set to values greater than100% FS (Full Scale) or 0 dBFS.
6.4 : Attempting to execute a SOURCE-1 sweepwith the FREQ start or stop set to values greaterthan one-half the sample rate, the TIME start orstop values greater than the acquisition period(TRANSFORM length/RATE) via the sweep defini-tions panel or procedurally.
7 : FASTTRIG
7.1 : Attempting to set the frequency resolution(FREQ RES) for W&F to a value greater than5.00489 or sweep the setting to a value greater than5 via the DSP panel interface, sweep definitionspanel, or procedurally.
7.2 : Attempting to set or sweep the digital gener-ator amplitude (DGEN AMPL) to a value greaterthan 100% FS (Full Scale) or 0 dBFS via the DSPpanel interface, sweep definitions panel, or proce-durally.
7.3 : Attempting to execute a SOURCE-2 sweepwith the frequency resolution FREQRS start(GRAPH TOP) or stop (BOTTOM) percentage setgreater than 5%, the GENAMP start or stop set tovalues greater than 100% FS (Full Scale) or 0 dBFS.
7.4 : Attempting to execute a SOURCE-1 sweepwith the FREQ start or stop set to values greaterthan one-half the sample rate, the TIME start orstop values greater than two times the generatorwaveform period ((generator waveform samplelength/RATE)* 2) via the panel interface or proce-durally.
8 : MLS
8.1 : Attempting to set or increment the time zeroreference (REF TIME) used to compute FFT phaseto a value greater than 1.025 sec at a 32kHz samplerate, 682.7 mS at a 48kHz sample rate, and 743.0mS at a 44.1kHz sample rate via the DSP panel in-terface or procedurally.
8.2 : Attempting to set or increment the digitalgenerator amplitude (AMPL) to a value greater than100% FS (Full Scale) or 0 dBFS via the DSP panelinterface or procedurally.
8.3 : Attempting to execute a SOURCE-2 sweepwith the REFTIM start (GRAPH TOP) or stop(BOTTOM) percentage set greater than 3%, theGENAMP start or stop set to values greater than100% FS (Full Scale) or 0 dBFS.
8.4 : Attempting to execute a SOURCE-1 sweepwith the FREQ start or stop set to values greaterthan one-half the sample rate, the TIME start or stopvalue is set to values greater than 1.025 seconds at32kHz, 683.3 mS at 48kHz, and 743.7 mS at44.1kHz for full memory.
CORRECTIONS :
33-10 Audio Precision System One User's Manual

1-8 : Enter a value into the appropriate field thatis less than the maximum value for the selectedunits and sample rate as designated in the precedingsections for this error.
DSP: Conflict with Minimum setting
CAUSES :
1 : BITTEST
1.1 : Attempting to set or sweep the generator fre-quency (DGEN FREQ) to a value less than5.722046mHz via the DSP panel interface, sweepdefinitions panel, or procedurally.
1.2 : Attempting to set or sweep the generator am-plitude (AMPL) to a value less than 0% FS (FullScale) or -999.99 dBFS via the DSP panel interface,sweep definitions panel, or procedurally.
1.3 : Attempting to set or sweep the constant(VALUE) value to a value less than -8388608 viathe DSP panel interface, sweep definitions panel, orprocedurally.
1.4 : Attempting to execute a SOURCE-1 sweepwith the generator frequency (GENFRQ) start orstop values set less than specified in section 1.1 forthis error, the generator amplitude (GENAMP) startor stop values set less than specified in section 1.2for this error, the constant (VALUE) start or stopvalues set less than specified in section 1.3 for thiserror, the TIME start or stop values set to less thanzero.
2 : FFTGEN
2.1 : Attempting to set or sweep the digital gener-ator frequency (DGEN FREQ) to a value less thanzero hertz via the panel interface, sweep definitionspanel, or procedurally.
2.2 : Attempting to set or sweep the generator am-plitude (AMPL) to a value less than 0% FS (FullScale) or -999.99 dBFS via the DSP panel interface,sweep definitions panel, or procedurally.
2.3 : Attempting to execute a SOURCE-2 sweepwith the generator frequency (GENFRQ) start orstop frequency values set less than specified in sec-tion 2.1 for this error, the generator amplitude(GENAMP) start or stop values set less than speci-fied in section 2.2 for this error.
2.4 : Attempting to execute a SOURCE-1 sweepwith the FREQ start or stop values with a negativevalue, the TIME start or stop to less than at -16.4sec at 1kHz, -2.05 sec at 8kHz, -512.5 mS at 32kHz,-341.6 mS at 48kHz, -85.41 mS at 192kHz, -371.1mS at 44.1kHz, -92.97 mS at 176.4kHz.
3 : FFTSLIDE
3.1 : Attempting to set or sweep the start time(FFT START) to less than -38.75 sec at a 1kHz sam-ple rate, -3.844 sec at 8kHz, -.9609 at 32kHz, -640.6mS at 48kHz, -160.2 mS at 192kHz, -97.3 mS at44.1kHz, and -174.3 mS at 176 .4kHz via the panelinterface, sweep definitions panel, or procedurally.
3.2 : Attempting to set or “sweep” the amount ofdata acquired before trigger (PRE-TRIG) to lessthan -8.389 sec at a 1kHz sample rate, -1.049 sec at8kHz, -262.1 sec at 32kHz, -174.8 sec at 48kHz,-43.96 sec at 192kHz, -190.2 sec at 44. 1kHz, and-47.55 sec at 176.4kHz via the panel interface,sweep definitions panel, or procedurally.
3.3 : Attempting to execute a SOURCE-2 sweepwith the FFT start time (STRT) start or stop timesset less than specified in section 3.1 for this error,the pre-trigger (PRET) start or stop times set lessthan specified in section 3.2 for this error
3.4 : Attempting to make a frequency domain dis-play (SOURCE-1 DSP FREQ) “sweep” with theFREQ start or stop values with a negative value, ora time domain display with the TIME start or stopto less than at -16.4 sec at 1kHz sample rate, -2.05sec at 8kHz, -512.5 mS at 32kHz, -341.6 mS at48kHz, -85.41 mS at 192kHz, -371.1 mS at44.1kHz, -92.97 mS at 176.4kHz.
4 : GENANLR
ERROR MESSAGES 33-11

4.1 : Attempting to set or sweep the generator fre-quency (DGEN FREQ) to a value less than3.334045Hz at a 32kHz sample rate, 5.001068Hz at48kHz, and 4.594731Hz at 44.1kHz via the DSPpanel interface, sweep definitions panel, or proce-durally.
4.2 : Attempting to set or sweep the generator am-plitude (AMPL) to a value less than 0% FS (FullScale) or -999.99 dBFS via the DSP panel interface,sweep definitions panel, or procedurally.
4.3 : Attempting to set or sweep the filter fre-quency (FILT FREQ) to a value less than13.33427Hz at a 32kHz sample rate, 20.00141Hz at48kHz, and 18.3763Hz at 44.1kHz via the DSPpanel interface, sweep definitions panel, or proce-durally.
4.4 : Attempting to execute a SOURCE-1 sweepwith the generator frequency (GENFRQ) start orstop frequency values set less than specified in sec-tion 4.1 for this error, the generator amplitude(GENAMP) start or stop values set less than speci-fied in section 4.2 for this error, the filter frequency(FILFRQ) start or stop values set less than specifiedin section 4.3 for this error.
5 : HARMONIC
5.1 : Attempting to set or sweep the bandpass fil-ter frequency to a value less than 19.99855Hz at a48kHz sample rate, and 79.9942Hz at 192kHz viathe DSP panel interface, sweep definitions panel, orprocedurally.
5.2 : Attempting to set or sweep the bandpass fil-ter harmonic multiplier to a value less than 1 via theDSP panel interface, sweep definitions panel, or pro-cedurally.
5.3 : Attempting to set or sweep the bandpass fil-ter frequency offset (F OFFSET) to a value less than-21.7687kHz at a 48kHz sample rate, and-87.0748kHz at 192kHz via the DSP panel interface,sweep definitions panel, or procedurally.
5.4 : Attempting to execute a SOURCE-1 sweepwith the FREQ (frequency) start or stop values setless than specified in section 5.1 for this error, theharmonic (HARM) start or stop values set less thanspecified in section 5.2 for this error, the frequencyoffset (F_OFF) start or stop values set less thanspecified in section 5.3 for this error.
6 : FASTEST
6.1 : Attempting to set or sweep the frequencyresolution (FREQ RES) for W&F to a value lessthan 0 via the DSP panel interface, sweep defini-tions panel, or procedurally.
6.2 : Attempting to set or sweep the digital gener-ator amplitude (DGEN AMPL) to a value less than0% FS (Full Scale) or -999.99 dBFS via the DSPpanel interface, sweep definitions panel, or proce-durally.
6.3 : Attempting to execute a SOURCE-2 sweepwith the frequency resolution for W&F (FREQRS)start or stop percentage values set less than specifiedin section 6.1 for this error, the digital generator am-plitude GENAMP start or stop values set less thanspecified in section 6.2 for this error.
6.4 : Attempting to make frequency domain dis-play (SOURCE-1 DSP FREQ) “sweep” with theFREQ start or stop values set to a negative value, orto make a time domain display with the TIME startor stop to set less than -2.05 sec at 8kHz, -512.5 mSat 32kHz, -341.6 mS at 48kHz, -371.1 mS at44.1kHz.
7 : FASTEST
7.1 : Attempting to set or sweep the frequencyresolution (FREQ RES) for W&F to a value lessthan 0 via the DSP panel interface, sweep defini-tions panel, or procedurally.
7.2 : Attempting to set or sweep the generator am-plitude (DGEN AMPL) to a value less than 0% FS(Full Scale) or -999.99 dBFS via the DSP panel in-terface, sweep definitions panel, or procedurally.
33-12 Audio Precision System One User's Manual

7.3 : Attempting to execute a SOURCE-2 sweepwith the frequency resolution for W&F (FREQRS)start or stop percentage values set less than specifiedin section 7.1 for this error or the generator ampli-tude (GENAMP) start or stop values set less thanspecified in section 7.2 for this error.
7.4 : Attempting to make a frequency domain dis-play (SOURCE-1 DSP FREQ) with the FREQ startor stop values set to a negative value, or a time do-main display with the TIME start or stop values setless than -512.5 mS at 32kHz, -341.6 mS at 48kHz, -371.1 mS at 44.1kHz.
8 : MLS
8.1 : Attempting to set or sweep the time zero ref-erence (REF TIME) for FFT phase to a value lessthan -5.12 mS at a 32kHz sample rate, -3.413 mS ata 48kHz sample rate, and -3.715 mS at 44.1kHz viathe DSP panel interface, sweep definitions panel, orprocedurally.
8.2 : Attempting to set or sweep the generator am-plitude (GEN AMPL) to a value less than 0% FS(Full Scale) via the DSP panel interface, sweep defi-nitions panel, or procedurally.
8.3 : Attempting to execute a SOURCE-2 sweepwith the reference time (REFTIM) start or stop val-ues set less than specified in section 8.1 for this er-ror, the generator amplitude (GENAMP) start orstop values set less than specified in section 8.2 forthis error.
8.4 : Attempting to make a frequency domain dis-play (SOURCE-1 DSP FREQ) with the FREQ startor stop values with a negative value, or a time do-main display with the TIME start or stop to lessthan -5.125 mS at 32kHz sample rate, -3.416 mS at48kHz, -3.718 mS at 44.1kHz.
CORRECTIONS :
1-8 : Enter a value into the appropriate field thatis greater than the minimum value for the selectedunits and sample rate as designated in the precedingsections for this error.
E
EDITOR CANNOT READ DATA -1 UNITS
CAUSES : Attempting to load a data file wherethe header (units values in the first line) for theDATA-1 units has been corrupted.
CORRECTIONS : The most likely cause is thatexternal processing was done to the data file and theDATA -1 units in the header was not reconstructedcorrectly.
EDITOR CANNOT READ DATA -2 UNITS
CAUSES : Attempting to load a data file wherethe header (units values in the first line) for theDATA-2 units has been corrupted.
CORRECTIONS : The most likely cause is thatexternal processing was done to the data file and theDATA -2 units in the header was not reconstructedcorrectly.
EDITOR CANNOT READ HORIZONTALUNITS
CAUSES : Attempting to load a data file wherethe header (units values in the first line) for the hori-zontal units has been corrupted.
CORRECTIONS : The most likely cause is thatexternal processing was done to the data file and thehorizontal units in the header was not reconstructedcorrectly.
ENTERED VALUES NOT UNDERSTOOD —OPERATION ABORTED
CAUSES :
1 : A value entered into one of the parameters forthe UTIL OUT command is not understood.
2 : A value entered into one of the parameters forthe UTIL WAIT command is not understood.
CORRECTIONS :
ERROR MESSAGES 33-13

1 : The value for the first parameter must eitherbe a decimal number that designates the address of aport located in the PC or a character (A, B, C) desig-nating a port on the DCX-127. The second parame-ter value must be a decimal number.
2 : All parameter values must be decimal values.
ERROR: At least one input channel must be en-abled in order to acquire
NOTE : Error generated by FFTGEN,FFTSLIDE, MLS, FASTTEST, & FASTTRIG DSPprograms.
CAUSES : Attempting to perform an acquisition(F9) with both input selections set to NONE.
CORRECTIONS : Set one of the DSP inputs to aselection other than NONE.
ERROR: Ch1 & Ch2 generator waveforms notof equal length
NOTE : Error generated by FASTTRIG DSP pro-gram.
CAUSES : An attempt to load different recordlength waveforms into the DSP generator 1G and2G buffers.
CORRECTIONS : Load both generator buffers1G and 2G with the same length waveforms.
ERROR: DSP program does not support EX-TERN sweeps
NOTE : Error generated by FFTGEN,FFTSLIDE, MLS, FASTTEST, & FASTTRIG DSPprograms.
CAUSES : Caused by attempting an EXTERNsweep utilizing any of the FFT based DSP programssuch as FFTGEN, FFTSLIDE, MLS, FASTEST, orFASTTRIG
CORRECTIONS : Select from any of the follow-ing DSP programs that do support external sweepsBITTEST, GENANLR, or HARMONIC.
ERROR: Excessive tones in waveform for properoperation
NOTE : Error generated by FASTTRIG DSP pro-gram.
CAUSES : Attempting to execute a test after load-ing a waveform into the DSP generator buffers thatcontains more than 128 tones.
CORRECTIONS : Disable generator waveform& frequency correction warnings by setting theMEASURE right hand field to OFF on the FAST-TRIG DSP panel or reduce the number of tones inthe generated waveform.
ERROR: Frequency resolution setting conflictswith requested frequency
NOTE : Error generated by FASTTRIG DSP pro-gram.
CAUSES : An attempt to return an FFT fre-quency magnitude or phase reading for a frequencythat is within the frequency resolution (FREQ RES)percentage of one half the sample rate.
CORRECTIONS :
1 : Disable generator waveform & frequency cor-rection warnings by setting the MEASURE righthand field to OFF on the FASTTRIG DSP panel.
2 : Restrict the measurement bandwidth to lessthan one half the sample rate minus the percentagespecified in the FREQ RES field.
ERROR: TRIG & Freq Correction modes re-quire Ch1 & Ch2 generator waveforms
NOTE : Error generated by FASTTRIG DSP pro-gram.
CAUSES : Attempting an acquisition before bothgenerator buffers are loaded.
CORRECTIONS : Load both generator wave-form buffers 1G & 2G before attempting an acquisi-tion.
33-14 Audio Precision System One User's Manual

ERROR: Waveform file is not an MLS impulseresponse
NOTE : Error generated by the MLS DSP pro-gram.
CAUSES : Attempting to load a waveform otherthan an MLS impulse response record.
CORRECTIONS : Load only MLS impulse re-sponse waveform data when using the MLS DSPprogram.
ERROR: Waveform file is not of proper type forselected buffer
NOTE : Error generated by the FFTGEN,FFTSLIDE, MLS, FASTTEST, or FASTTRIG DSPprograms.
CAUSES :
1 : Attempting to transfer a generator waveforminto DSP acquisition memory.
2 : Attempting to load an MLS impulse record.
CORRECTIONS :
1 : Transfer only data saved via the SAVEWAVEFORM (1, 2, or 1T, 2T) commands into ac-quisition memory.
ERROR: Waveform load not of valid length
NOTE : Error generated by the FASTTRIG DSPprogram.
CAUSES : Attempting to load a generator wave-form file that is not of the proper length.
CORRECTIONS : Load a waveform that consistsof one of the following record lengths (256, 512,1024, 2048, 4096, 8192).
ERROR LOADING DSP PROGRAM
CAUSES : Corrupted DSP file.
CORRECTIONS : Replace the corrupted DSPfile from the distribution diskettes.
Error loading sub-procedure
CAUSES : The default or designated edit proce-dure buffer size is too small to hold the required sub-procedure.
CORRECTIONS : Increase the size of the editprocedure buffer to a value large enough to accom-modate the largest procedure file that is required tobe loaded. As a rule set the edit procedure buffersize to the file size of the largest procedure file to beloaded as determined by the DOS directory com-mand.
EXAMPLE “S1 /Bn,n,n,5000,n,n”.
F
F8, ALT- F8, and ALT-F9 disabled
CAUSES : An F8, Alt. F8, or Alt. F9 was exe-cuted after the /8 command line option was used tostart the S1.EXE software. This option eliminatesthe buffer required to store image information.
CORRECTIONS : Remove the /8 command lineoption when starting System One software.
FATAL ERROR: DSP PROGRAM REQUIRESDIO or MEM OPTION
NOTE : Error generated by the FASTTRIG DSPprogram. “DIO OPTION” refers to the digital input-output module which is part of System One DualDomain (SYS-3nn). This module contains addi-tional memory in addition to digital inputs and out-putsl
CAUSES : Attempting to load the FASTTRIGDSP program when System One does not containsufficient memory to run the program correctly.
CORRECTIONS :
ERROR MESSAGES 33-15

1 : If digital input or output is not needed, installthe System One retrofit MEM-DSP memory option.This will add additional memory required by theFASTTRIG DSP program.
NOTE : MEM-DSP memory is not upward com-patible in later conversions to System One Dual Do-main (SYS-3nn) units.
2 : If digital input or output is valuable, installthe System One retrofit DSP-250 to add digital in-put/output and memory which upgrades System One+ DSP (SYS-2nn) units to System One Dual Do-main (SYS-3nn) units.
FILE APLAST$$.GDL COULD NOT BE WRIT-TEN
CAUSES : An attempt to save the temporary fileAPLAST$$.GDL was made when the maximumnumber of files allowed in the floppy disk root direc-tory has been reached.
CORRECTIONS : Change directories or deleteunused files from the current floppy disk root direc-tory.
FILE CANNOT BE READ — DISK ERROR —OPERATION ABORTED
CAUSES :
1 : Attempting to load a corrupt graphics (.GDL)file.
2 : Attempting to load a waveform (.WAV) filewith a corrupt header.
CORRECTIONS : Resave or recreate the file andtry again.
FILE CANNOT BE WRITTEN — DISK ER-ROR OR FULL — SAVE ABORTED
CAUSES : The storage medium doesn’t haveroom to save the required information.
CORRECTIONS : Delete all unnecessary files onthe selected medium to free additional storage mem-ory.
FILE NOT FOUND
CAUSES : The file specified was not located inthe current directory or in the directory explicitlyspecified in the LOAD, SAVE, APPEND, EDIT,DOS, or NAMES functions.
CORRECTIONS : Copy the required file into thecurrent directory or explicitly define the path whenselecting the file to load.
FILE SPECIFIED NOT A VALID DATA FILE— LOAD ABORTED
CAUSES : Attempting to load a data file with alength of zero (0).
CORRECTIONS : The most likely cause is thatinsufficient disk space was available when the filewas saved or copied, creating a file with a recordlength of zero.
FILE SPECIFIED NOT A VALID TEST FILE— LOAD ABORTED
CAUSES : When loading a test, overlay, sweepsource, EQ, or limit file, the format doesn’t conformto the S1.EXE test file format.
CORRECTIONS : Select a valid S1.EXE test,overlay, sweep, EQ, or limit file.
FILE SPECIFIED WRONG VERSION OF DSPFILE — LOAD ABORTED
CAUSES :
1 : Attempting to load a file other than a DSP pro-gram file.
2 : Attempting to load a DSP program that re-quires a specific version of the S1.EXE programwith an earlier version.
CORRECTIONS :
33-16 Audio Precision System One User's Manual

1 : Select or use only DSP programs supplied byAudio Precision with the .DSP extension. To dateall DSP programs released are compatible with the2.10A release of S1.EXE.
2 : Select the appropriate version DSP programsto be run with the selected S1.EXE software or visa-versa.
NOTE : Refer to the technical bulletins issuedwith each update.
FILE WRITE ACCESS DENIED — DIREC-TORY FULL OR WRITE PROTECTED
CAUSES : The selected file cannot be written toa storage medium because the file attribute is set toREAD ONLY, the storage medium does not haveroom to store the file, or the disk is write protected.
CORRECTIONS : Clear the READ ONLY fileattribute using the DOS ATTRIB command, createroom for the desired file, or remove the write protec-tion from the storage medium.
FREQRS may only be a sweep source-2 selection
NOTE : Error generated by the FASTTEST andFASTTRIG DSP programs.
CAUSES : Attempting to select the frequencyresolution (FREQRS) as a sweep SOURCE-1 stimu-lus.
CORRECTIONS : Select frequency resolution(FREQRS) as a sweep SOURCE-2 parameter only.
G
GENAMP may only be a sweep source-2 selection
NOTE : Error generated by the FFTGEN, MLS,FASTTEST and FASTTRIG DSP programs.
CAUSES : Attempting to set the generator ampli-tude (GENAMP) parameter as the sweep SOURCE-1 selection on the sweep definitions panel.
CORRECTIONS : Select generator amplitude(GENAMP) as a sweep SOURCE-2 parameter only.
GENFREQ may only be a sweep source-2 selec-tion
NOTE : Error generated by the FFTGEN DSPprogram.
CAUSES : Caused by trying to select GENFREQas sweep SOURCE-1.
CORRECTIONS : Select generator frequency(GENFREQ) as a sweep SOURCE-2 parameter only.
Generator waveform frequencies too close fortriggering or frequency correction
NOTE : Error generated by the FASTTRIG DSPprogram.
CAUSES : An attempt to execute a test with aDSP generator waveform loaded that has tones thatviolate the minimum frequency spacing of six bins(about 35 Hz with maximum resolution signal).
CORRECTIONS :
1 : Change to a waveform which conforms to theminimum spacing criteria.
2 : Disable generator waveform & frequency cor-rection warnings by setting the MEASURE righthand field to OFF on the FASTTRIG DSP panel.
GOTO CANNOT FIND TARGET LABEL
CAUSES : The procedure currently being runcan’t find the label designated by the GOTO com-mand.
CORRECTIONS : Check to see that the label ex-ists in the same procedure as the GOTO statementand that the characters in the label are the same asdesignated by the GOTO statement.
H
ERROR MESSAGES 33-17

Horizontal minimum cannot = maximum
EXPLANATION : On the sweep definitionspanel there are three major groups of controls. Forthe purpose of error reporting the third group knownas SOURCE-1 is identified as the horizontal con-trols.
CAUSES : An attempt was made to execute atest where the sweep definitions horizontal start andstop values are equal.
CORRECTIONS : Select different start and stopvalues for the sweep definitions panel horizontal val-ues.
I
INVALID ACCESS CODE
CAUSES : System One has displayed an error re-ported by DOS.
CORRECTIONS : The error is located within thecomputer operating system and is most likely hard-ware related.
INTERNAL ERROR
CAUSES : Failure to detect valid panel settingswhen loading a test, overlay, sweep source, EQ, orlimit file.
CORRECTIONS : Delete the corrupted file.
Invalid or missing numeric input
CAUSES : Failure to detect valid panel settings.Software or hardware failure.
CORRECTIONS : Report error to Audio Preci-sion.
INVALID SELECTION
CAUSES : The panel interface is not returningthe correct variables. Software or hardware failure.
CORRECTIONS : Report error to Audio Preci-sion.
M
MACRO FILE TO LARGE TOO LOAD
CAUSES : The default or designated edit macrobuffer size is too small to hold the required informa-tion.
CORRECTIONS : Increase the size of the editmacro buffer to a value large enough to accommo-date the largest macro file that is required to beloaded. As a rule set the edit macro buffer size tothe file size of the largest macro file to be loaded asdetermined by the DOS directory command.
EXAMPLE “S1 /Bn,n,n,n,n,1000".
MISSING ‘]’ IN PROCEDURE
CAUSES : A procedure has terminated withoutexecuting the same number of IF closing brackets asopening brackets.
CORRECTIONS : Debug your procedure so thata closing bracket is encountered for each openingbracket.
MUST USE /C1 OR /C2 OPTION TO ENABLETHIS FUNCTION
CAUSES :
1 : Selection of the RUN REMOTE or RUNSLAVE command menu (CMD:) commands whenthe /C1 or /C2 command line option was not usedwhen starting S1.EXE.
2 : Setting a panel for remote operation withoutusing the /C1 or /C2 command line options whenstarting S1.EXE.
CORRECTIONS : Restart S1.EXE using the /C1or /C2 command line option.
EXAMPLE :
33-18 Audio Precision System One User's Manual

“S1 /C1" for COM port #1
“S1 /C2" for COM port #2
MUST USE /G OPTION TO ENABLE THISFUNCTION
CAUSES : The SAVE GRAPHICS commandmenu (CMD:) function has been selected without us-ing the /G command line option to enable this func-tion.
CORRECTIONS : Restart System One S1.EXEsoftware using the /G option.
EXAMPLE : “S1 /G”
FILE NAME = MUST USE ‘SAVE OVERLAY’BECAUSE OF PUNCHED-OUT FIELDS
CAUSES : An attempt was made to save a set ofset-up panels with punched-out fields as a standardtest file (.TST) using the SAVE & TEST commandsfrom the command (CMD:) menu.
CORRECTIONS :
1 : Save the set-up panels as an overlay (.OVL)using the SAVE & OVERLAY commands from thecommand menu (CMD:).
2 : Restore all punched out fields with the<ALT> <R> while the panels are displayed, beforesaving as a test file (.TST).
N
Negative Number encountered while Logging data
CAUSES : A negative value was encounteredwhile converting values to obtain a LOG display.The value was converted to -999.99.
CORRECTIONS : The most likely cause is thatexternal processing was done to a data file and theDATA -1 or DATA -2 data was not reconstructedcorrectly.
Need at least 2 data points between HIGH andLOW values.
CAUSES : Attempting to execute the COMPUTELINEARITY commands when the number of datapoints between the second (HIGH) and third (LOW)parameters is less than two. Two data points are re-quired to establish a straight line to be used as a ref-erence for the linearity computation.
CORRECTIONS : Define the HIGH and LOWparameters so that at least two SOURCE-1 measure-ment points are made between the values.
NO DSP PROGRAM LOADED OR THIS SAM-PLING RATE NOT SUPPORTED
CAUSES :
1 : Attempting to load waveform data into theDSP without having a DSP program loaded.
2 : Attempting to load waveform data into theDSP that is of a sample rate not supported by theDSP program currently loaded.
CORRECTIONS :
1 : Load the appropriate DSP program for the se-lected waveform data.
2 : Load the appropriate DSP program for the se-lected waveform sample rate.
NO MEASUREMENT SELECTED FORDATA -1
CAUSES : On the SWEEP DEFINITIONS panelthe DATA-1 measurement is set to NONE.
CORRECTIONS : Select a DATA-1 measure-ment other than NONE.
NO MORE FILE HANDLES AVAILABLE
CAUSES : Attempting to open more files thanare permitted as defined in the CONFIG.SYS“FILES = X” parameter.
ERROR MESSAGES 33-19

CORRECTIONS : Increase the number of files al-lowed by increasing the value for the “FILES = X”parameter in the CONFIG.SYS file.
no more room for insertions
CAUSES : Attempting to enter data into a proce-dure, macro, comments, or data buffer, using the in-sert mode when there isn’t sufficient memory re-maining in the selected buffer to accept the data.
CORRECTIONS : Restart S1.EXE using the /Bcommand line option to define the size of the desti-nation buffer so that it is large enough to contain therequired data.
Number too large for field in use
CAUSES : The entered value is larger then the se-lected field is capable of displaying.
CORRECTIONS : Enter a value that can be dis-played in the selected field.
P
PATH NOT FOUND (OR DRIVE NOT READY)
CAUSES :
1 : Attempting to access a non-existent drive.
2 : The drive door for the selected disk is open.
CORRECTIONS : Select a valid drive and makesure the drive door is closed.
PRET may only be a sweep source-2 selection
CAUSES :
1 : An attempt to select PRET (Pre-Trigger) assweep SOURCE-1 for the FFTSLIDE DSP program.
CORRECTIONS :
1 : Select Pre-trigger as a sweep SOURCE-2 pa-rameter only.
Primary minimum cannot = maximum
EXPLANATION : On the sweep definitionspanel there are three major groups of controls. Forthe purpose of error reporting the first group knownas DATA-1 is identified as the primary controls.
CAUSES : An attempt was made to execute atest where the sweep definitions primary start andstop values are equal.
CORRECTIONS : Select different start and stopvalues for the sweep definitions panel primary val-ues.
PROCEDURE BUFFER IS EMPTY OR HASWRONG VERSION HEADER
CAUSES :
1 : Attempting to execute a procedure when theprocedure buffer is empty.
2 : Data residing in the procedure buffer doesn’tcontain the correct version header for the version ofS1.EXE that is running.
CORRECTIONS :
1 : Load a procedure into the procedure buffer us-ing the LOAD & PROCEDURE menu selectionsfrom the command menu (CMD:).
2 : Edit the first line of the procedure residing inthe procedure buffer to reflect the version header forthe version of S1.EXE being used. This can bedone using the EDIT & PROCEDURE menu selec-tions from the command menu (CMD:). The follow-ing example is for version 2.10A S1.EXE software.
EXAMPLE : “PROCEDUREv2.10"
PROCEDURE FILE TOO LARGE TO LOAD
CAUSES : The default or designated edit proce-dure buffer size is too small to hold the required pro-cedure.
33-20 Audio Precision System One User's Manual

CORRECTIONS : Increase the size of the editprocedure buffer to a value large enough to accom-modate the largest procedure file that is required tobe loaded. As a rule set the edit procedure buffersize to the file size of the largest procedure file to beloaded as determined by the DOS directory com-mand.
EXAMPLE “S1 /Bn,n,n,5000,n,n”.
R
RATIO UNIT NOT SUPPORTED FOR DSPREADINGS FROM ANLR-A or ANLR-B
1 : FFTGEN, FFTSLIDE, MLS
1.1 : Attempting to set the AMPL-1 or AMPL-2measurement units to one of the ratio selections (%,dB, PPM, X/Y) while the DSP channel 1 or 2 inputsource is set to ANLR-A or ANLR-B.
2 : HARMONIC
2.1 : Attempting to set the FIL LVL 1 measure-ment units to one of the ratio selections (%, dB)while the DSP channel 1 or 2 input source is set toANLR-A or ANLR-B.
CORRECTIONS :
1.1 : Select AMPL-1 and AMPL-2 measurementunits that is not one of the ratio units (%FS, dBFS,V, dBm, dBu, dBV, dBr, W, or NONE) or selectRDNG as the DSP channel 1 and 2 input sources.
2.1 : Select FIL LVL 1 measurement units that isnot one of the ratio units (Vrms, dBm, dBu, dBV,dBr, W, or NONE) or select RDNG as the DSPchannel 1 and 2 input sources.
READ ERROR ON SECOND CHANNEL
CAUSES : An attempt was made to load a single-record waveform file (containing only data for onechannel) with the “1G,2G”, “1T,2T”, or “1,2” com-mands which expect a two-record waveform file.
EXAMPLE : “LOAD WAVEFORM filename<Enter>1T,2T<Enter>”
CORRECTIONS : Load the waveform data intothe first channel then repeat the process for the sec-ond channel.
EXAMPLE : “LOAD WAVEFORM filename<Enter> 1T <Enter>LOAD WAVEFORM <En-ter>2T <Enter>”
REFTIM may only be a sweep source-2 selection
NOTE : Error generated by the MLS DSP pro-gram.
CAUSES : Attempting to set the REFTIM (Refer-ence Time) parameter as the sweep SOURCE-1 se-lection on the sweep definitions panel.
CORRECTIONS : Select REFTIM (ReferenceTime) as a sweep SOURCE-2 parameter only.
REMOTE DUS FAILURE - CHECK COMLINE OR TRY RESTORE
CAUSES :
1 : An interruption in the communication link be-tween the computer and the “S” version System Oneduring measurement settling.
2 : An interruption of an “S” version System Onevia the escape key during measurement settling.
CORRECTIONS :
1 : Reseat all connections and run UTIL RE-STORE.
2 : Run the required test again allowing time forthe test to complete before pressing escape.
REMOTE SETTING FAILURE - CHECK COMLINE OR TRY RESTORE
CAUSES :
ERROR MESSAGES 33-21

1 : An interruption in the communication link be-tween the master and slave computers.
2 : An interruption in the communication link be-tween the computer and the “S” version System One.
3 : When starting S1.EXE software for the slavecomputer the proper /C1 or /C2 command line op-tion was not used to designate which communica-tion port to use to communicate with the mastercomputer.
4 : When starting S1.EXE software for the slavecomputer the /S command line option or the RUNREMOTE command from the command menu wasnot used to configure the software for remote opera-tion before communication was attempted by themaster computer.
5 : When starting S1.EXE software on a laptopcomputer the proper /C1 or /C2 command line op-tion was not used to designate which communica-tion port to use to communicate with the SystemOne hardware.
CORRECTIONS :
1 : Reseat all connections and run UTIL RE-STORE.
2 : Check that a NULL MODEM cable is beingused for “S” version System Ones.
3 : Check that the proper /C1 or /C2 commandline options have been used with any remote opera-tion configuration for the slave computer.
4 : Check that the /S command line option hasbeen used or that the RUN SLAVE commands havebeen executed from the slave unit software to estab-lish remote operation.
5 : Check that the proper /C1 or /C2 commandline options have been used with any remote opera-tion configuration for the master computer. An ex-ample configuration would be using a laptop com-puter with no slots available for a PCI card to con-trol System One .
RUN EXIT has no Procedure to return to.
CAUSES : A sub-procedure has been loaded andrun directly rather than being called from a mainprocedure, or the main procedure is executing aRUN EXIT before calling a sub-procedure, or theRUN EXIT menu selections have been selectedfrom the command menu (CMD:).
CORRECTIONS : Correct any procedural flowcontrol conditions that could result in calling theRUN EXIT commands before the RUN CALL com-mands are used to call and run a sub-procedure. Donot load and run sub-procedures directly from thecommand menu, or ignore the warning message ifyou choose to run sub-procedures by themselves.
S
SAVED IMAGE NOT COMPATIBLE WITHGRAPHICS MODE
CAUSES : A recall graphics F8 has been at-tempted but the sweep display mode defined on thesweep definitions panel DISPLAY field is not thesame mode (MONO-GRAPH vs COLOR-GRAPH)as the graphics image stored using Alt-F8.
CORRECTIONS : Change the sweep displaymode on the sweep definitions panel to the samemode used when the graphics data was stored.
Secondary minimum cannot = maximum
EXPLANATION : On the sweep definitionspanel there are three major groups of controls. Forthe purpose of error reporting the second groupknown as DATA-2 SOURCE-2, HOR-AXIS, orSTEREO is identified as the secondary controls.
CAUSES : An attempt was made to execute atest where the sweep definitions secondary start andstop values are equal.
CORRECTIONS : Select different start and stopvalues for the sweep definitions panel secondary val-ues.
33-22 Audio Precision System One User's Manual

SETTLING MODE MUST BE AVG TO SETSAMPLES >6
CAUSES : Attempting to set the sweep settlingpanel data samples to a value greater than 6 whilethe settling mode was set to EXPONENTIAL,FLAT, or OFF.
CORRECTIONS : Set the settling mode to aver-age (AVG) then enter any number up to 999.
SHELL PROGRAM RETURNS WITH NON-ZERO ERROR LEVEL
CAUSES : An executable program run from thecommand menu (CMD:) DOS function reported anabnormal exit condition at its termination.
CORRECTIONS : Investigate and correct thecause of the abnormal exit condition from the ex-ecutable program.
Stepping not functional on this field
CAUSES : An attempt was made to increment ordecrement the dBm/W impedance reference field atthe bottom of the generator or analyzer panels.
CORRECTIONS : Incrementing or decrementingthe dBm/W impedance reference field at the bottomof the generator or analyzer panels is not allowed.
STRING FORMAT NOT CORRECT
CAUSES : Attempting to enter an invalid charac-ter into the AES-EBU transmit status bytes.
CORRECTIONS : Enter only HEX values 00through FF with a space between each value.
EXAMPLE : “04 00 00 ...”
STRT may only be a sweep source-2 selection
NOTE : Error generated by the FFTSLIDE DSPprogram.
CAUSES : Caused by trying to select STRT assweep SOURCE-1.
CORRECTIONS : Select STRT (Start Time) as asweep SOURCE-2 parameter only.
SUB-PROCEDURES NESTED TOO DEEP
CAUSES :
1 : An attempt to nest sub-procedures beyond 15times.
2 : A procedure has called and then incorrectlyexited (RUN EXIT command not used) from 16 sub-procedures.
CORRECTIONS :
1 : Don’t nest sub-procedures beyond 15 times.
2 : Correct any procedural flow problems thatcan cause the procedure to exit without using theRUN EXIT command (CMD:)
SWITCHER CHANNEL NUMBER IS BEYONDVALID RANGE OF 0-192
CAUSES : A value entered manually, in a sweep,or by procedural control into the switcher panelchannel selection field is greater than the maximumvalue of 192.
CORRECTIONS : Check that the value enteredmanually, on the sweep definitions panel, or by pro-cedural control into the switcher panel channel selec-tion field is less than the maximum allowable valueof 192.
T
Text area is full, cannot copy from buffer!
CAUSES : Attempting to insert data located inthe copy buffer into a procedure, macro, comments,or data buffer, using F5 or Alt. F5, when there isn’tsufficient memory remaining in the destination buff-er to accept the data in the copy buffer.
ERROR MESSAGES 33-23

CORRECTIONS : Restart S1.EXE using the /Bcommand line option to define the size of the desti-nation buffer so that it is large enough to contain therequired data.
Timeout
CAUSES : A timeout occurred when using theCtrl-F3 regulation technique and the panels are dis-played.
CORRECTIONS : Increase the TIMEOUT valueon the SWEEP SETTLING panel.
Too many digits, backspace and try u,m,k
CAUSES : When editing a numeric panel fieldthe number of characters entered exceeds 18.
CORRECTIONS : Enter less than 18 charactersto define the numeric entry.
NOTE : The u,m,k contained in the error mes-sage stands for micro, mili, and kilo respectively.
U
Use a positive stepsize only
CAUSES : Attempting to input a negative valueinto the AMPSTEP or FREQSTEP fields at the bot-tom of the generator panel.
CORRECTIONS : Enter a positive value into theAMPSTEP or FREQSTEP fields of the generatorpanel.
V
VALUE NOT UNDERSTOOD OR NOTFOUND IN DATA
CAUSES : The second value entered into the pa-rameters of the COMPUTE NORMALIZE com-mand is not understood.
CORRECTIONS : The value for the second pa-rameter must be a decimal number that designates avalue along the horizontal axis which is to be set tothe target value after normalization.
W
Warning: Change panel to match new units
CAUSES : When loading or appending data theunits in the .DAT file do not match the units desig-nated on the sweep definitions panel.
CORRECTIONS : Set the units in the sweep defi-nitions panel to match the units designated by thefile to be appended or loaded. You may use theLOAD COMMENTS and EDIT COMMENTS fea-ture (type *.DAT after LOAD COMMENTS in or-der to see the names of .DAT files in the directory)to view the .DAT file to see what units it contains.
Warning: Ch1 generator waveform should beloaded before ch2
NOTE : Error generated by the FASTTRIG .DSPprogram.
CAUSES : Attempting to load the channel 2 gen-erator buffer (2G) before the channel 1 generatorbuffer (1G) has been loaded.
CORRECTIONS : Always load the DSP channel1 generator buffer first.
Warning: Ch 1 time frame not set — must do aTIME sweep before FREQ sweeps
NOTE : Error generated by the MLS DSP pro-gram.
CAUSES : Caused by attempting to perform a fre-quency sweep (SOURCE-1 DSP FREQ) withouthaving first done a time sweep (SOURCE-1 DSPTIME) with DSP INPUT channel 1 turned on.
CORRECTIONS : DSP input channel 1 musthave a signal source selected and a time sweep con-ducted to define the portion of the impulse responseto transform into a frequency response.
33-24 Audio Precision System One User's Manual

Warning: Ch1 & Ch2 time frames not set - mustdo a TIME sweep before FREQ sweeps
NOTE : Error generated by the MLS DSP pro-gram.
CAUSES : Caused by attempting to perform a fre-quency sweep (SOURCE-1 DSP FREQ) withouthaving first done a time sweep (SOURCE-1 DSPTIME) with either channel turned on.
CORRECTIONS : One of the DSP input chan-nels must have a signal source selected and a timesweep conducted to define the portion of the im-pulse response to transform into a frequency re-sponse.
Warning: Ch 2 time frame not set — must do aTIME sweep before FREQ sweeps
NOTE : Error generated by the MLS DSP pro-gram.
CAUSES : Caused by attempting to perform a fre-quency sweep (SOURCE-1 DSP FREQ) withouthaving first done a time sweep (SOURCE-1 DSPTIME) with DSP INPUT channel 2 turned on.
CORRECTIONS : DSP input channel 2 musthave a signal source selected and a time sweep con-ducted to define the portion of the impulse responseto transform into a frequency response.
Warning: Frequency correction out of range
NOTE : Error generated by the FASTTRIG DSPprogram.
CAUSES :
1 : Attempting to provide frequency correction onsignals that are beyond 3% of the fundamental fre-quency(s).
2 : If distortion is extreme, the frequency correc-tion algorithm may erroneously select one of the dis-tortion products as the fundamental and provide cor-rection based on that frequency.
CORRECTIONS :
1 : Minimize speed error by e.g. adjusting pitchcontrols on a tape reproducer, adjusting generatorfrequency within 3% of the desired frequency(s)(waveform frequency loaded into the DSP gener-ator).
2 : Correct any problems that cause distortion ofthis magnitude.
Warning: Generator waveform(s) must be loadedbefore acquiring
NOTE : Error generated by the FASTTRIG DSPprogram.
CAUSES : Attempting to acquire data <F9> with-out the FASTEST generator loaded.
CORRECTIONS : Load generator waveforms 1Gand 2G before doing an acquisition.
Warning: Not enough tones in waveform for reli-able triggering
NOTE : Error generated by the FASTTRIG DSPprogram.
CAUSES : Too few sinewave tones in the middleand upper frequency bands (typically 300 Hz to 10kHz).
CORRECTIONS : Use a waveform with suffi-cient tones in the middle and upper frequency bands.
Warning: Waveform load overrun — file islonger than selected buffer
NOTE : Error generated by FFTGEN,FFTSLIDE, MLS, FASTTEST, & FASTTRIG DSPprograms.
CAUSES : The record length specified in thewaveform file header is longer than the length of theselected destination buffer.
CORRECTIONS :
ERROR MESSAGES 33-25

1 : Change the destination buffer size e.g. selectthe appropriate transform length for the selectedtransform waveform.
2 : In a System One + DSP (SYS-2nn), installSystem One retrofit MEM-DSP memory option.This will add additional memory that will allow youto load generator and acquire waveforms created foror acquired with a full memory system.
NOTE : MEM-DSP memory is not upward com-patible and can not be used if a later conversion ismade to System One Dual Domain.
Install the System One retrofit DSP-250 to add in-put/output and memory, upgrading the SYS-2nn toSYS-3nn (System One Dual Domain).
Warning: Waveform load underrun — file isshorter than selected buffer
NOTE : Error generated by FFTGEN,FFTSLIDE, MLS, FASTTEST, & FASTTRIG DSPprograms.
CAUSES :
1 : FFTGEN
1.1 : Attempting to load a waveform into the gen-erator buffer (1G or 2G) that is of a record lengthshorter than 8192 (8k) points.
1.2 : Attempting to load a waveform into the ac-quisition buffer (1 or 2) that is of a record lengthshorter than 16384 points for full memory or 4086points with standard memory.
1.3 : Attempting to load a waveform into thetransform buffer (1T or 2T) that has a different re-cord length than is selected, as defined by the FFTinput data length (TRANSFORM) field.
2 : FFTSLIDE
2.1 : Attempting to load a waveform into the ac-quisition buffer (1 or 2) that is of a record lengthshorter than 30720 points for full memory or 8192points with standard memory.
2.2 : Attempting to load a waveform into thetransform buffer (1T or 2T) that has a different re-cord length than is selected, as defined by the FFTinput data length (TRANSFORM) field.
3 : MLS
3.1 : The record length for the specified impulseresponse waveform file header is shorter than the re-quired length of the acquisition buffer.
NOTE : This can only happen if an attempt ismade to load an impulse that was saved on a SystemOne with standard memory into a system with fullmemory.
4 : FASTTEST
4.1 : Attempting to load a waveform into the gen-erator buffer (1G or 2G) that is of a record lengthshorter than 8192 (8k) points for full memory and2048 (2k) for standard memory.
4.3 : Attempting to load a waveform into the ac-quisition (1 or 2) or transform (1T or 2T) buffer thathas a different record length than is selected, as de-fined by the FFT input data length (TRANSFORM)field.
5 : FASTTRIG
5.1 : Attempting to load a generator waveform(1G, 2G) with a record length other than 256, 512,1024, 2048, 4096, or 8192 points.
5.3 : Attempting to load a waveform into the ac-quisition (1 or 2) or transform (1T or 2T) buffer thatis not twice the record length of the waveformloaded into the generator buffer (1G and 2G)
CORRECTIONS :
1 : FFTGEN
1.1 : Load only 8192 point waveforms into thegenerator buffers for full memory (System One DualDomain and System One + DSP with MEM option),and 2048 point waveforms for standard memory(System One + DSP without MEM option).
33-26 Audio Precision System One User's Manual

1.2 : Load only 16384 point waveforms into theacquisition buffers for full memory and 8192 pointwaveforms for standard memory.
1.3 : Adjust the transform input data length(TRANSFORM) to the record length used when thewaveform was saved.
2 : FFTSLIDE
2.1 : Load only 30720 point waveforms into theacquisition buffers for full memory and 8192 pointwaveforms for standard memory.
2.2 : Adjust the transform input data length(TRANSFORM) to the record length used when thewaveform was saved.
3 : MLS
3.1 : Load an impulse response that was acquiredwith the same memory configuration as System Onecurrently contains.
4 : FASTTEST
4.1 : Load only 8192 point waveforms into thegenerator buffers for full memory and 2048 pointwaveforms for standard memory.
4.2 : Adjust the transform input data length(TRANSFORM) to the record length used when thewaveform was saved.
5 : FASTTRIG
5.1 : 3 : When creating arbitrary waveforms al-ways create a source data file consisting of 256,512, 1024, 2048, 4096, or 8192 HEX data points inthe .WAA file.
5.2 : Load waveforms that are twice the recordlength of the currently loaded generator recordlength.
WAVEFORM BUFFER SPECIFICATION NOTUNDERSTOOD
CAUSES :
1 : A value entered into one of the parametersdesignating the storage location for a waveformloaded via the LOAD WAVEFORM command isnot understood.
CORRECTIONS : Enter only the following val-ues (0, 1, 2, 1T, 2T, 1G, 2G) as the LOAD WAVE-FORM parameter specifications.
WAVEFORM TRANSFER NOT SUPPORTEDBY THIS DSP PROGRAM, OR DSP NOTAVAILABLE
CAUSES :
1 : Attempting to load or save waveform data toor from GENANLR.DSP or the HARMONIC.DSPprograms.
2 : Attempting to load a waveform into the gener-ator buffers for the FFTSLIDE or MLS DSP pro-grams.
3 : Attempting to load a waveform into the trans-form buffers for the MLS DSP program.
4 : Attempting to load waveform data with a com-munication fault or the DSP does not exist.
CORRECTIONS :
1 : Waveform data is not applicable to theGENANLR.DSP or HARMONIC.DSP real time pro-grams.
2 : Waveform data can’t be loaded into the gener-ator buffers for the FFTSLIDE or MLS DSP pro-grams.
3 : Waveform data can’t be loaded into the trans-form buffers for the MLS DSP program.
4 : Restart S1.EXE and the System One hardwareafter correcting any problems with the cable connect-ing the PC to System One.
ERROR MESSAGES 33-27

WRONG NUMBER OF ARGUMENTS FORFUNCTION
CAUSES : A non-numeric value was entered forthe delay time for the UTIL DELAY command.
CORRECTIONS : Enter a decimal value into theUTIL DELAY parameter.
33-28 Audio Precision System One User's Manual

34. FURNISHED DISK FILE DESCRIPTIONS
Software for non-DSP versions of System One isfurnished on four diskettes. DSP versions includeadditional software on several more diskettes as de-scribed in the DSP User’s Manual. The four disk-ettes furnished with standard System One are theS1.EXE diskette, Tests and Procedures diskette,Utilities & Equalization diskette, and PerformanceChecks diskette. This chapter lists the files fur-nished on the first three of these diskettes, alongwith a brief description of each file. The Perform-ance Check files are not described here since theyare all called by performance check procedures, runautomatically with the proper limit and sweep filesattached, and should not be changed in any way.
34.1. S1.EXE version: 2.10 Diskette
S1.EXE System One executable program.
@6064.ADF Supplied for the MICRO-CH optiononly. File used by PS/2 Microchannel Bus referencediskette to configure the computer for System Oneoperation.
34.2. Test and Procedures Diskette
15-CRSTK.TST Test file for worst-case crosstalkversus frequency, tracks 10-24 of 24-track recorderoperating at 30 inches per second, 0 VU. Nestedsweep with frequency as SOURCE-1, SWR-122switcher channel as SOURCE-2.
15-FREQ.TST Test file for frequency response,tracks 10-24 of 24-track recorder operating at 30inches per second, 0 VU. Nested sweep with ampli-tude as SOURCE-1, SWR-122 switcher channel asSOURCE-2.
15-GAPSC.TST Test file for Gap Scatter acrosstracks 10-24 (switcher channels 1-15) of 24-tracktape recorder. Measurement plots phase differenceat 10 kHz of each track versus track 12 (switcherchannel 3), near tape center.
15-TRACK.PRO Procedure to test the frequencyresponse 15-FREQ.TST, distortion versus amplitude15T-MOL3.TST, worst-case crosstalk versus fre-quency 15-CRSTK.TST, and gap scatter 15-GAPSC.TST of a multi-track tape recorder. Sub-procedure for SELECT.PRO procedure.
15T-MOL3.TST Test file for Maximum OutputLevel (MOL), tracks 10-24 of 24-track recorder op-erating at 30 inches per second, 0 VU. Nestedsweep with amplitude as SOURCE-1, SWR-122switcher channel as SOURCE-2.
22K400BW.TST Test file for frequency responseof System One internal 22 kHz high pass and 400Hz low pass filters.
2HD-FREQ.TST Test file for playback frequencyresponse measurements, using either a tape recordedwith 2HD-RCRD.TST or a reference tape.
2HD-PHAS.TST Test file for measuring interchan-nel phase of two-head tape recorders in playbackmode using a pre-recorded tone.
2HD-RCRD.TST Test file to aid in creating a 30step, frequency response test, for two-head tape re-corders. Refer to section 30.2.4.4 for additional in-formation.
2HD-THD.TST Test file for total harmonic distor-tion versus frequency of two head tape players usinga per-recorded tape.
30K100BW.TST Test file for frequency responseof System One internal 30 kHz high pass and 100Hz low pass filters.
34-1

3H-DELAY.TST Test file to help determine theSETTLING DELAY required for three head tape re-corders at various tape speeds. Refer to section30.2.4.2 for operating instructions.
3HD-AZIM.TST Test file for record head azimuthadjustment after the reproduce head has been ad-justed, for three head recorders. Using ALT willprovide a repeating five-frequency log spaced sweepfrom 1 kHz to 15 kHz, plotting interchannel phaseas a function of frequency.
3HD-FREQ.TST Test file for frequency responsetesting of professional three head tape recorders.The test generates the test signal then delays meas-urement via SETTLING DELAY until the tape hasmoved to the playback head. Channel (A) is testedthen channel (B) in STEREO mode.
80K22HBW.TST Test file for frequency responseof System One internal 80 kHz high pass and 22 Hzlow pass filters.
AMP-DEMO.PRO Sub-procedure for SE-LECT.PRO procedure. Demonstration proceduretesting frequency response APL-RESP.OVL, signal-to-noise ratio AMPNOISE.OVL, and distortionAMP-THD.OVL of DUT amplifier.
AMP-RESP.OVL Overlay file used in the AMP-DEMO.PRO procedure, to test amplifier frequencyresponse. Punched-out fields are retained from theprevious test or overlay.
AMP-THD.OVL Overlay file used in the AMP-DEMO.PRO procedure, to test amplifier distortion.Punched-out fields are retained from the previoustest or overlay.
AMP-THD.TST Test file and data of power ampli-fier THD+N versus frequency resulting from opera-tion of AMP-DEMO.PRO procedure.
AMP.TST Test file defining basic starting condi-tions for power amplifier test procedure AMP-DEMO.PRO.
AMPLCMRR.TST Test file for common mode re-jection testing of DUT.
AMPLNOIS.TST Test file for producing spectraldistribution of residual noise to 100 kHz of theDUT, also showing hum from power transformerand noise from computers display.
AMPNOISE.OVL Overlay file used in the AMP-DEMO.PRO procedure, to test amplifier signal-to-noise ratio. Punched-out fields are retained from theprevious test or overlay.
AMPNOISE.TST Test file and data of power am-plifier signal-to-noise ratio resulting from operationof AMP-DEMO.PRO procedure.
AMPRESP.TST Test file and data of power ampli-fier frequency response resulting from operation ofAMP-DEMO.PRO procedure.
AV3HDFRQ.TST Test file for frequency responsetesting of professional three head tape recorders for(A) version hardware. The test generates the testsignal then delays measurement via SETTLING DE-LAY until the tape has moved to the playback head.Channel (A) and (B) are tested simultaneously in 2-CHANNEL mode.
AVCDFRQ1.TST Test file for Compact Disk ste-reo frequency response test for (A) version hard-ware. This test uses an external glide tone, such astrack 65 on the Denon Audio Technical CD test disk38C397147, as the test signal.
AVCDFRQ2.TST Test file for Compact Disk 2-CHANNEL frequency response test for (A) versionhardware. This test uses discreet tones, such astrack 46 through 55 on the Denon Audio TechnicalCD test disk 38C397147, as the test signal.
AZ-REPRO.TST Test file for reproduce head azi-muth adjustment.
A_WEIGHT.TST Test file for acquisition and dis-play of System One’s “A” Weighting filter response.
BARGDEMO.PRO Procedure for an operatorprompted adjustment step, using the mouse or arrowkeys for frequency control. Sub-procedure called bySELECT.PRO procedure.
34-2 Audio Precision System One Operator's Manual

B_USASI.OVL Test overlay file creating pulsedUnited States of America Standards Institute(USASI) noise, that closely simulates long term aver-age spectra of typical audio program material.
CCIF-AM.TST Test file for measuring CCIF dis-tortion versus amplitude.
CCIF-FRQ.TST Test file measures CCIF distor-tion versus Frequency.
CCIRFILT.TST Test file for displaying SystemOne’s CCIR filter response.
CCIR_2K.TST Test file for displaying SystemOne’s CCIR-2 filter response.
CD-DEMO.PRO Demonstration procedure testingcompact disk frequency response CD-RESP.TST,and total harmonic distortion CD-THD.TST. Sub-procedure called by SELECT.PRO procedure.
CD-RESP.TST Test file for compact disk, fre-quency response measurements, using a glide toneincreasing in frequency.
CD-THD.TST Test file for compact disk, total har-monic distortion measurements, using discrete tonesincreasing in frequency.
CDDITHER.TST Test file for spectral analysis of -90 dB dithered track & -90 dB undithered track of aCD player, using a CBS test disk.
CDFREQ2.TST Test file for Compact Disk Stereofrequency response testing. This test uses discretetones, such as track 46 through 55 on the DenonAudio Technical CD test disk 38C397147, as thetest signal.
CDPHASE.TST Test file for Compact Disk fre-quency response and interchannel phase testing.This test uses an external glide tone, such as track65 on the Denon Audio Technical CD test disk38C397147, as the test signal.
CDQUANTZ.TST Test file for measuring thequantization distortion of a compact disk player.
DEFAULT.TST Test file containing the standardpower-up default settings of S1.EXE software.
DIM-AM.TST Test file for measuring dynamic in-termodulation distortion versus amplitude using.
DIM-B.TST Test file for measuring dynamic inter-modulation distortion versus amplitude, using a 14kHz probe tone with the square wave component ofthe signal bandwidth limited to 30 kHz. Recom-mended for FM and TV audio testing because oftheir bandwidth limitations.
DIM100.TST Test file for measuring dynamic in-termodulation distortion versus amplitude, using a15 kHz probe tone with the square wave componentof the signal bandwidth limited to 100 kHz.
DIM30.TST Test file for measuring dynamic inter-modulation distortion versus amplitude, using a 15kHz probe tone with the square wave component ofthe signal bandwidth limited to 30 kHz.
DIN.TST Test file for measuring “SMPTE” inter-modulation distortion versus amplitude, using DIN-recommended frequencies of 250 Hz and 8 kHz.
DIST-PWR.TST Test file for measuring distortionat rated power versus frequency.
DSP-SHOW.PRO Procedure to demonstrate thewaveform and spectral analysis capability of SystemOne. Sub-procedure called by SELECT.PRO proce-dure.
FLTRSHOW.PRO Re-graphs typical frequency re-sponses for System One full bandwidth, 22 Hz to 80kHz bandwidth limiting, 100 Hz to 30 kHz band-width limiting, 400 Hz to 22 kHz bandwidth limit-ing, “CCIR” Weighting, CCIR-2K, and (A) Weight-ing filter selections.
FREQ-CON.TST Test file for frequency responsewhere the output of the DUT must remain at a con-stant output level. A typical application is Proof-of-performance testing of broadcast transmitters and sta-tions.
FURNISHED DISK FILE DESCRIPTIONS 34-3

FREQRESP.TST Test file for frequency responsetest for balanced-input line level devices.
FULLBW.TST Test file for acquisition and dis-play of System One’s frequency response with no in-ternal filters selected.
GAIN.TST Test file for measuring the gain or losson a DUT. The DUT output is REGULATED to 0dBu and the GENERATOR level is inverted and dis-played in tabular format as a gain factor.
I-OPHASE.TST Test file for measuring the phaseshift and frequency response of a device under test(DUT).
LOW-3DB.PRO Procedure to execute LOW-3DB.TST test to determine low frequency -3 dBpoint of an audio DUT. Sub-procedure called bySELECT.PRO procedure.
LOW-3DB.TST Test file to determine the low fre-quency -3 dB point of an audio DUT.
MOL.TST Test file for determining the maximumoutput level for a three head tape recorder, by meas-uring distortion versus amplitude.
NOISEFFT.TST Test file for display only of adual trace spectrum analysis (FFT) of white andpink noise.
PEAKADJ.TST Test file example of the use ofthe mouse or arrow keys to for an example locatethe maximum amplitude of a band-pass filter.
PWR-BAND.TST Test file for measuring powerbandwidth of amplifiers.
RCRDNEST.TST Test file example of a nestedsweep frequency response at four different levels,for a three head tape recorder.
READ-TST.TXT Brief description of Test andProcedures diskette.
RESIDNOI.TST Test file for acquisition and dis-play of System One’s residual noise spectrum at fullbandwidth.
RESIDUAL.TST Test file for display only of spec-trum analysis of the residual distortion of SystemOne’s analog generator and analyzer at 1 kHz.
SCRAPE.TST Test file for measuring scrape flut-ter versus time, using a 12.5 kHz test tone.
SELECT.PRO Provides a menu from which youcan select each demonstration procedure.
SIGNOISE.TST Test file to make signal-to-noiseratio test on stereo or monaural devices.
SMPT-FRQ.TST Test file measures SMPTE inter-modulation distortion versus Frequency.
SMPTE-AM.TST Test file uses the standardSMPTE test conditions of a 60 Hz low frequencytone mixed in a 4:1 amplitude ratio with a 7 kHzhigh frequency tone.
SMPTEFFT.TST Test file for display only ofspectrum analysis of SMPTE-like IMD signal with500 Hz low frequency and 7 kHz high frequency ina 4:1 amplitude ratio.
SMPTEWAV.TST Test file for display only ofSMPTE-like IMD waveform with 500 Hz low fre-quency and 7 kHz high frequency in a 4:1 amplituderatio.
SQUARFFT.TST Test file for display only ofspectrum analysis of 1 kHz 1 Vrms square wave.
SQUARWAV.TST Test file for display only of 1kHz 1 Vrms square wave.
SYS22CK.PRO Basic performance checks of sys-tem amplitude accuracy, ranging, flatness, frequencyaccuracy, residual distortion, noise, and phase accu-racy. Use if the system is configured with dual out-puts and inputs. Sub-procedure for SELECT.PROprocedure.
SYSBPN.LIM Upper compare limit forSYSBPN.TST tests.
SYSBPN.TST Test file for System One residualbandwidth bandpass noise.
34-4 Audio Precision System One Operator's Manual

SYSCAL.TST Test file for System One amplitudeperformance verification.
SYSCALL.LIM Lower compare limit forSYSCAL.TST tests.
SYSCALU.LIM Upper compare limit forSYSCAL.TST tests.
SYSCK.TXT Contains test results forSYSBPN.TST, SYSCAL.TST, SYSCMRR.TST,SYSFLAT.TST, SYSFREQ.TST, SYSHFTHD.TST,SYSPHASE.TST, and SYSTHD.TST tests.
SYSCMRR.LIM Upper compare limit forSYSCMRR.TST tests.
SYSCMRR.TST Test file for System One com-mon mode rejection performance verification.
SYSFL.LIM Lower compare limit for SYS-FREQ.TST tests.
SYSFLAT.TST Test file for System One fre-quency response flatness performance verification.
SYSFLATL.LIM Lower compare limit for SYS-FLAT.TST tests.
SYSFLATU.LIM Upper compare limit for SYS-FLAT.TST tests.
SYSFREQ.TST Test file for System One fre-quency calibration performance verification.
SYSFU.LIM Upper compare limit for SYS-FREQ.TST tests.
SYSHFTHD.LIM Upper compare limit forSYSHFTHD.TST tests.
SYSHFTHD.TST Test file for performance verifi-cation of System One residual distortion at 500 kHzbandwidth. Called by SYS22CK.PRO sub-proce-dure.
SYSPHAL.LIM Lower compare limit forSYSPHASE.TST tests.
SYSPHASE.TST Test file for performance verifi-cation of System One phase measurement capability.Called by SYS22CK.PRO procedure.
SYSPHAU.LIM Upper compare limit forSYSPHASE.TST tests.
SYSTHD.LIM Upper compare limit forSYSTHD.TST tests.
SYSTHD.TST Test file for performance verifica-tion of System One’s residual distortion at 80 kHzbandwidth. Called by SYS22CK.PRO procedure.
TAP-PHAS.TST Test file for measuring interchan-nel phase of three head stereo tape recorders.
TAPE-THD.TST Test file for measuring distortionversus frequency of a three head tape recorder.
THD-AM.TST Test file for measuring total har-monic distortion at a signal frequency of 1 kHz as afunction of amplitude.
THD-FRQ.TST Test file for measuring total har-monic distortion plus noise versus frequency.
THDVSLVL.TST Test file for measuring total har-monic distortion plus noise versus measured level us-ing DATA-2 as the horizontal axis.
UP-3DB.PRO Procedure to execute UP-3DB.TSTtest to determine high frequency -3 dB point of anaudio DUT. Sub-procedure called by SELECT.PROprocedure.
UP-3DB.TST Test file to determine the high fre-quency -3 dB point of an audio DUT.
USASI.OVL Test overlay file creating UnitedStates of America Standards Institute (USASI)noise, that closely simulates long term average spec-tra of typical audio program material.
VIEWALL.PRO Sequentially display all test datacontained in current directory. Use (F10) to pauseor continue procedure execution.
FURNISHED DISK FILE DESCRIPTIONS 34-5

W&F.TST Test file for measuring InternationalElectromechanical Commission (IEC) weightedwow and flutter and speed error versus time, using a3.15 kHz test tape.
34.3. Utilities and EqualizationDiskette
50US-DE.EQ Generator equalization file, for 50microsecond de-emphasis curve.
50US-PRE.EQ Generator equalization file, for 50microsecond pre-emphasis curve.
75US-DE.EQ Generator equalization file, for 75microsecond de-emphasis curve.
75US-PRE.EQ Generator equalization file, for 75microsecond pre-emphasis curve.
EQC.PRO Procedure to normalize the data createdby EQCREATE.BAS to unity gain at a specified fre-quency, and to provide a menu selection to invertthe curve if required.
EQCREATE.BAS Basic program to calculateequalization (EQ) file data.
EQCREATE.BAT Batch file to execute theEQCREATE.BAS basic program, then load SystemOne and run the EQC.PRO procedure.
EQCREATE.DAT Data file for equalization curvevalues created by the EQCREATE.BAS program.
EQCREATE.EQ Equalization file used to presetDATA-1, and SOURCE-1 to appropriate units, sothat the EQCREATQ.DAT data file can be loadedwithout panel unit mismatch errors.
EQCREATE.PRO Procedure to execute theEQCREATE.BAS basic program then normalize thedata created by EQCREATE.BAS to unity gain at aspecified frequency, and to provide a menu selectionto invert the curve if an alternate curve type is re-quired.
EQCREATE.TXT Text file that describes how touse the EQCREATE.BAS basic program to create anew equalization file using a mathematical formula,or to re-make one of the EQ files supplied on theTest and Utilities disk to optimize for speed, accu-racy, or frequency range.
ISO15BND.SWP Sweep source file of center fre-quencies for a 15 band equalizer.
NRSC-DE.EQ Generator equalization file, for aNational Radio Systems Committee (NRSC) de-em-phasis curve. This curve is used to simulate the de-emphasis characteristics of an AM receiver.
NRSC-PRE.EQ Generator equalization file, for aNational Radio Systems Committee (NRSC) pre-em-phasis curve. This curve is used to provide a knowntreble boost to the audio for AM transmitters.
PLOT.EXE Executable program for use as part ofSystem One’s standard software. It drives anyHPGL-compatible plotter and properly-equipped HPLaserJet printers to produce high resolution graphs.
POST.EXE Executable program for use with Ap-ple LaserWriter and other PostScript-compatibleprinters to produce high resolution graphs.
RIAA-DE.EQ Generator equalization file, for a Re-cording Industry Association of America (RIAA) de-emphasis curve. This curve is used to provide aknown low frequency boost for phonograph diskplay back.
RIAA-IEC.EQ Generator equalization file, for aRecording Industry Association of America (RIAA)de-emphasis curve as modified by International Elec-tromechanical Commission (IEC). This curve isused to provide a known treble boost and low fre-quency attenuation for phonograph disk play back.
RIAA-PRE.EQ Generator equalization file, for aRecording Industry Association of America (RIAA)pre-emphasis curve. This curve is used to provide aknown high frequency boost for phonograph disk re-cording.
34-6 Audio Precision System One Operator's Manual

VERSION.TXT Text file that describes the opera-tion of the program VERSION.EXE.
VERSION.EXE Executable program that deter-mines and prints to the standard output the versionof each Audio Precision test or procedure or DSPfile encountered. The file dates and times are alsoprinted.
FURNISHED DISK FILE DESCRIPTIONS 34-7

34-8 Audio Precision System One Operator's Manual

35. INDEX
!
% unit, 20-3%Hz, 8-5%ON unit, 20-2* (asterisk) print-screen, 15-3+ key, 6-4, 8-3, 9-3.ADF file, 3-4/& filename command line option, 28-9/&, /B, /8 options used together, 28-9/- option, 15-6/3 option for HP LaserJet III, 15-7/8 option, 28-6/D# option, 5-7/F command line option, 15-3/F option, 15-3/G option, 15-6/I# option, 28-5/V#, 28-90.7746 Volts reference , 8-2100 Volt operation, 4-1110 baud
timeout value, 22-12120 Volt operation, 4-1150 Ohm system calibration, 8-32-CHANNEL mode, 10-32-sigma, 17-62-wire Ohms, 21-2220 Volt operation, 4-1240 Volt operation, 4-1300 baud
timeout value, 22-124-wire Ohms, 21-250 Hz operation, 4-160 Hz operation, 4-16805, 32-380286, 27-480287 recommendation, 2-18086, 27-48087 recommendation, 2-18088, 27-4
A
A vs B offsetswitcher, 18-8
A weighting filter, 10-7A-to-D conversion, analyzer, 32-3A-to-D converter linearity testing, 21-4A/D converter testing, 19-3Abort procedure, 25-12Absolute noise tests, 31-7Absolute vs relative distortion units, 8-4Ac mains requirements, 4-1Ac voltage setting, DCX-127, 4-1Ac voltage setting, SWR-122, 4-1Accuracy vs reading rate, 10-6Acknowledgement, 22-4Adding to procedures, 25-4Additive amplitude steps, 9-2Address conflict, 3-2Address port, 3-2Adjustment during tests, 14-1Adjustment operations in procedures, 14-5Advance of CD player track, 21-6AES-EBU digital audio format, 19-3, 19-7AES-EBU, status bytes, 19-7Allocation of memory, 28-6Alt F10, 25-13Alt F4, 8-4Alt F6, 13-11Alt F7, 11-11, 24-1, 24-3Alt X, 11-12Alt-F1 function key, 25-12Alt-F8 key, 11-18Amplitude
and frequency sweeps, 11-16generator, 9-2mode, 10-2out of range, 9-2range limitations, 9-3resolution, tone burst, 20-3sweeps, 11-1tone burst, 20-3units, 8-1
Amplitude calibration
35-1

in intermod mode, 16-2noise, 20-5squarewave, 20-5
Amplitude controlgenerator, 32-4
Amplitude measurement hardware requirements,31-1Amplitude resolution
generator, 32-4Amplitude-frequency interactions, 9-7AMPSTEP, 9-2
and bargraph, 14-2units, 9-2
Analog control of generator, 14-1Analog control of generator frequency &litude simultaneously, 14-3Analog dc output voltage, 21-3Analog display of wow and flutter, 17-5Analog displays, 14-1Analysis bandwidth
CCIF IMD, 16-1DIM-TIM IMD, 16-1SMPTE IMD, 16-1
ANALYZER, 10-1Analyzer block diagram, 32-1Analyzer digital conversion technique, 32-3Analyzer equalization, 13-17, 13-24Analyzer filter sweeps, 11-3Analyzer range, 10-9Analyzer Section, 10-1Analyzer Volts, 8-1Anti-alias filter, DSP, 19-6APBASIC, 5-1APLAST$$, 28-4APLAST$$ files, 13-3Appearance
of blanked fields, 25-11APPEND command
DOS, 5-4Append Data, 11-11Append Test, 11-11Append vs Image Store, 11-18Appending to procedures, 25-4Apple LaserWriter output, 15-16APTEMP$$.GL, 15-8, 15-17Arbitrary control of generator in bargraph mode,14-3Arbitrary equalization curves, 23-3 - 23-4Arbitrary sweep steps, 11-4
Arrow key, 6-4control of stimulus, 14-2
Attaching error files, 13-16Attempts, 22-12
number of, 22-13Attenautor
generator, 32-4Audio chain testing via switcher, 18-16Audio link testing, 22-1AUTO
bandpass/bandreject filter frequency control, 10-5Auto algorithm for detector control, 10-6Auto quit at carrier loss , 22-12AUTO Range
analyzer, 10-9AUTO reading rate, analyzer, 10-6AUTO RESPONSE, SWEEP SETTLING, 12-6Auto-answer, 22-8 - 22-9Autodial, 22-8 - 22-9AUTOEXEC.BAT
files, 28-1Automatic advance of CD player track, 21-6Automatic erase, 11-11Automatic erase not functional, 11-11Automatic set-up using environment, 28-11Automating system start-up, 28-1Autoranging
control, 32-1dc voltage, 21-2degrees, 8-6peak sensitive, 10-8, 32-1phase, 10-4vs wow and flutter, 17-2
Auxiliary input, 10-8Averaging noisy signals, 12-3Averaging readings for noise reduction, 12-2AVG detector use, 10-6Avoiding hangups with remote tests, 13-4Azimuth adjustments, 11-3, 31-13
record head, 31-13reproduce head, 31-13
B
Back terminationgenerator, 9-5, 32-4
Balance adjustments, 11-15A-version, 11-15original hardware, 11-15
Balanced output, 9-6
35-2 Audio Precision System One User's Manual

Bandpass filterfrequency control, 10-5in intermod testing, 16-3mode, 10-3options, 10-7selectivity, 10-3sweeps, 11-2 - 11-3
Bandpass noiseequalized, 20-6mode, 20-6
Bandreject filterfrequency control, 10-5mode, 10-3rejection, 10-3sweeps, 11-3
Bandwidthwow and flutter, 17-2
Bandwidth control of frequency counter, 32-1Bandwidth, DSP, 19-6BARGDEMO, 6-2Bargraph
amplitude control, 9-2and AMPSTEP, 14-2and FREQSTEP, 14-2arbitrary control of generator steps, 14-3display in stereo mode, 14-2display of both channels, 11-15, 14-2displays, 14-1fixed phase range, 11-3frequency control, 9-4parameter selection, 14-2peak hold, 14-2printing, 14-5printout, 15-6stimulus control sensitivity, 14-3third measurement parameter, 14-3
BASIC language control of System One, 5-1Batch file
data comm, 22-9for changing subdirectories, 25-16in procedure, 25-15
Batch mode printingplotter or laser printer, 15-13PostScript laser printer, 15-20
Baud rate, 22-11BCD format, digital input, 21-4BCD format, digital output, 21-5Bi-directional printing control, 15-4Blank top line in procedure, 25-5
Blanked fields, 25-10Block diagram
analyzer, 32-1DSP input-output, 19-5
Bootwarm, 28-2
Bootable disk, 5-5Booting the system, 5-6Both outputs loaded, 9-3BPASS noise mode, 20-6Bps unit, 20-2Branching
to another procedure, 25-6upon operator input, 25-6
Branching upon error, 25-6Broadcast station testing, 22-1, 26-1, 31-2Broadcast transmitter testing, 23-1, 26-3, 26-6Buffer size
determining, 28-11Buffer size control, 28-7Buffer swap to disk, 28-9Buffer transfer, 13-11Building up multiple-line graphs, 11-18BUR option hardware, 32-4BUR-GEN
in polarity testing, 10-5Burst
amplitude, 9-7, 20-3spacing, 20-2units, 20-1waveforms, 9-1
Burst hardware, 32-4BURST ON field, 9-7Burst waveform
display via DSP, 19-3Bus mouse and PCI-2, 3-2Bytes reserved for DOS, 28-11Bytes vs points, data editor, 28-7
C
C language control of System One, 5-1Cable transposition testing, 10-5Cables
unbalanced, 9-6, 10-8Calibrating acoustical chambers, 23-1Calibrating frequency, 9-4Calibrating out system flatness variations, 23-5Calibration cycle
manually invoking, 9-4
INDEX 35-3

time, high accuracy mode, 9-4Calling sub-procedures, 13-4, 25-6Capturing continuously-varying data, 12-7Causing procedure to pause until external event,13-19CCIF
imd concepts, 16-1, 31-8imd frequency spacing selection, 9-4
CCIF imd architecture, 32-3CCIF imd signal generation, 32-4CCIR 468-4, 8-1, 10-6CCIR filter, 10-7
socket gain selection, 10-7CD player
quantization distortion, 31-10SETTLING DELAY, 31-11testing across a series of tracks, 31-3testing with glide-tone test discs, 31-3
Centering data between limits, 13-24Cents, 8-5CFL file type, 15-19CFP file, 15-12Changes in source or load impedance, 9-3Changing amplitude in steps, 9-2Changing graph title, 13-16Changing supply voltage connections, 4-1Changing test name, 13-17Channel A/B indicator, 21-7Channel balance adjustments
A-version, 11-15original hardware, 11-15
Channel exchange in stereo mode, 11-12Channel Monitor Output
AUTO vs fixed range, 10-10Channel number selection, 18-7Channel Selection
Input, 10-2Channel-matching adjustments, 11-15Characters
acceptable in file names, 13-6Chart recorder mode, 11-1 - 11-2Clipping
in analyzer with fixed ranges, 10-10Clipping tests, 26-3Clock, digital input, 21-4Cmrr vs reading rate, dc voltage, 21-2Co-processor recommendation, 2-1, 27-4Code, printer, 15-4Color
multiple traces, 11-10Color graph
conventions, 11-6resolution, 11-4
Color of nested sweeps, 11-16Color separation
from dot matrix printer, 15-6Color separations
HP LaserJet, 15-13HPGL plotter, 15-13PostScript laser printer, 15-19
Color vs dataplotter, 15-10
Columnar display, 11-9COM port number, 22-11 - 22-12COM1: and COM2:
setting PCI-2 card for, 3-2Combining command line options, 22-13, 28-4Command line options, 28-2 - 28-3
combining, 22-13data comm, 22-12multiple, 28-4
Command Line Query, 28-10Command menu, 6-1, 13-3COMMAND.COM, 5-6Comments
attached to graph, 15-3in listings, 25-5
Comments printout, 15-3Comments with high-resolution graphs, 15-15Common mode
rejection ratio measurements, 8-3rejection ratio reference, 10-8test configuration, 9-6
Communications portnumber, 22-11
Compact disc playerdistortion testing, 31-10response testing, 31-3tests in stereo, 11-13
Compact disc player testingpreserving reference level from test to test, 25-10
Compatibility, DOS version, 5-5Compatibility, mouse, 3-1Compatibility, short slot, 3-3Complement mode
switcher, 18-8Complex waveform amplitude calibration, 8-1Composite graphs, 11-17
35-4 Audio Precision System One User's Manual

Compressor testing, 11-17Compute
2-sigma, 17-62-Sigma menu command, 13-25Center menu command, 13-24Delta menu command, 13-24Exchange, 11-12Exchange menu command, 13-25Invert menu command, 13-22Linearity menu command, 13-22menu commands, 13-20Normalize, 13-20, 24-3Normalize menu command, 13-20Smooth menu command, 13-22
Computer service bureaucompatible output, 15-20
Computer system requirements, 2-1Computer type vs PCI-1 jumper position, 3-2Conditional
actions in procedures, 13-17branching, 25-6go to, 25-6halt in procedure, 13-19operators, 13-17
CONFIG.SYS, 27-3Configuration file
plotter-laser printer, 15-12PostScript laser printer, 15-19
Configuring panels, 12-2Conflict in procedure version, 25-1Connector pin assignments
digital output ports A,B,C, 21-7Connector pin assignments, digital input-output,21-4Console testing , 18-16Constant amplitude testing, 31-2Constant distortion tests, 26-3Constant modulation percentage, 26-1Constant power, 8-2
output, 26-1testing, 26-3, 31-9
Continuous sweeping signal measurements, 11-19Control
of buffer size, 28-7of VCAs, 21-3signal outputs, 21-6voltage output, 21-3
Control cable installation, 4-1Controlling
blanked field appearance, 25-12output ports from panels, 21-7
Converting pre-emphasis to de-emphasis, 23-4Copy buffer space occupied, 28-11CRCC, 22-3Creating
equalization files, 23-4external sweep source signals, 11-20limits files, 24-1
Crest factor, 10-6, 10-8, 32-1noise, 20-5
Crosspoint switcher, 18-1Crosstalk
function, 11-13measurements, playback only, 11-13mode, 10-3multi-track recorder, 18-16reference, 10-8worst case, 18-16
Crosstalk (TM) data communications software,22-8 - 22-9Crosstalk XVI (TM) data communicationssoftware, 22-9Ctrl F10 keystroke, 25-6Ctrl F3 operation, 26-5Ctrl F9, 11-10Current disk drive, 5-6Current limitations, 9-3Cursor, 6-3
control, with mouse, 29-2graph, 6-3graphic, 11-9movement, 6-4vs high-resolution graphs, 15-6
Cursor movement magnification, 11-9Curve fitting
linearity, 13-22Custom keyboard, 21-5
definition, 13-9function definition, 13-7re-defining, 13-6
Customizing system start-up, 28-1Cut and paste operations, 13-11CYCLES unit, 20-1 - 20-2Cyclic redundancy check code, 22-3Cycling through video attributes, 25-12
INDEX 35-5

D
D-to-A converter static testing, 21-5D/A converter testing, 19-3Daisy-chaining control cable, 4-1Danger in use of Util Out command, 25-14Data acquired pulse, 21-6Data averaging, 12-2Data columns
interchanging, 13-25Data comm
error message, 22-13software, 22-6, 22-8software requirements, 22-8 - 22-9
Data management in tests, 25-15Data offset in stereo mode, 11-12Data packets, 22-3DATA plotting choices, 11-6Data ready, digital input, 21-4DATA SAMPLES error, 12-3DATA SAMPLES on sweep settling panel, 12-2Data storage by individual serial number, 25-16Data word width, 22-11DATA-n units vs ANALYZER panel units, 10-3dB unit, 8-3, 20-3dBm, 8-2
in 150 Ohms, 8-3reference, 8-2, 10-9vs dBu, 8-2
dBr, 10-8(relative dB), 8-3and POST-EQ, 9-3for distortion readings, 10-9reference, 9-3reference setting priorities, 10-9reference, analyzer, 10-8reference, carrying from test to test, 25-10units, distortion, 8-3
dBu, 8-2vs dBm, 8-2
dBV, 8-3Dc output, swept, 21-3Dc voltage
measurements, 21-1 - 21-2output, 21-3plots, 11-7range and resolution, 21-2reading rate, 21-2sweeps, 11-1
DCX-127
functions, 21-1rear panel output ports, 21-7
De- vs pre-emphasis, 23-4De-bugging procedures, 25-13De-emphasis, 23-1, 23-3, 31-3Decades, 8-5Decimal control of digital output ports, 21-7Decimation, DSP, 19-6Decrement amplitude, 9-2Decrement frequency, 9-4Default conditions
user selectable, 28-3Default drive, 5-6Degree units
deg, 8-6deg, deg1, deg3, 10-4deg1, 8-6deg2, 8-6deg3, 8-6
Del key, 6-4, 8-3, 9-3Delay gate, 21-7Delay in dBr REF setting, 10-9Delay time in 3-head tape recorder testing, 12-5Delays in procedures, 13-19Delete buffer, 13-11Deletions from text, 13-11Delimiters in limits files, 24-1Delta %, 8-5Delta Hz, 8-5Delta PPM, 8-5Desktop publishing
encapsulated Postscript files, 15-20PLOT.EXE, 15-12
Detectorrecommendation, 10-6selection, 10-6time constant, switching during sweeps, 12-6type for scrape flutter, 17-2
Determining delay time, 31-4Deviation from perfect linearity, 13-22Device control, 13-18Difference-tone intermod theory, 16-1Differential voltmeter mode, DCX-127, 21-5Digit keypad, 6-3Digital input, 21-3
format, 21-4plots, 11-7reading rate, 21-4
Digital input-output measurements, 19-3
35-6 Audio Precision System One User's Manual

Digital interface cable connections, 4-1Digital output, 21-4
control ports, 21-7sweeps, 11-1
Digital recorderdistortion vs frequency, 19-3
Digital Signal Processor, 19-1, 19-3Digital system tests, 10-7DIM
imd architecture, 32-3imd concepts, 31-8intermod theory, 16-1test signal generation, 32-4
DINimd concepts, 31-7imd test signal generation, 32-4intermod testing, 16-1wow and flutter, 17-1 - 17-2
Direction of external sweep, 11-19Direction of sweeps, 11-3Disabling Image Store for more memory, 28-6Disk access
during limits testing, 27-2in EQSINE mode, 27-2
Disk directory for EQCREATE.BAS, 23-3Disk drive recommendations, 2-1Disk Operating System, 5-5Disk space requirement
temporary graphics file, 15-8, 15-17Disk type
impact on speed, 27-3Diskette copying, 5-5Diskettes
System One software, 5-1Disks
virtual (ram), 27-3Display mode vs graph labeling, 11-7Display None for speed, 27-1Display of exact graphic values via cursor, 11-9Display Table printout, 15-6Displaying
both stereo channels simultaneously, 11-15generator amplitude, 26-6limits while testing, 24-3
Distance in remote controlled systems, 22-1Distortion
at constant power, 31-9dBr measurements, 8-3increase with fixed range, 10-10
tape recorder testing, 31-9testing vs amplitude, 31-8testing vs frequency, 31-8two-head recorder testing, 31-10
Distortion analyzer architecture, 32-3Distortion vs. output level curves, 11-16Dither, 19-7Division marks
horizontal, 11-2vertical, 11-7
Dolby CCIR-ARM, 10-7DOS, 5-5
APPEND command, 5-4bytes reserved for, 28-11commands in procedures, 25-15controlling available memory, 28-6increasing available memory by disabling Image
Store, 28-6menu command, 13-3version compatibility, 5-5
DOS activitiesincreasing available memory by swapping buffers
to disk, 28-9Dot matrix printer
landscape mode, 15-5portrait mode, 15-6
DownloadingDSP programs, 19-5stored waveforms to DSP module, 13-6
Driving all but one channel of switcher, 18-8Driving all channels of switcher, 18-8Dropout level in external sweeps, 12-6DSP, 19-1, 19-3
frequency response, 19-7DSP bandwidth, 19-6DSP FFT, 19-3DSP Panel, 19-6DSP program download, 19-5DSP Rates, 19-6DSP Units, 8-6DSP waveform download, 13-6Dual sensitivity graphs, 11-10Dwell time
external sweep, 11-19
E
Earth connections, 4-1Edit
Data menu command, 13-9
INDEX 35-7

Macro menu command, 13-9menu commands, 13-9Procedure menu command, 13-9
Edit comment buffercontrol of size, 28-7
Edit data buffercontrol of size, 28-7
Edit macro buffercontrol of size, 28-8
Edit procedure buffercontrol of size, 28-7
Editing procedures, 25-3 - 25-4Editor
capability, 13-11control keys, 13-14text, 13-11
Eliminating attached files, 13-17Encapsulated Postscript files, 15-20Enter key equivalent in procedure edit mode, 25-5Environment
using to control start-up, 28-11EPS files, 15-20Epson printer, 15-3EQ file
control of size loaded into memory, 28-7EQBPN noise mode, 20-6EQCREATE, 23-3EQSINE, 23-1Equalization
analyzer, 13-17files, attaching to generator, 13-15files, creating, 13-20, 13-22, 23-4files, direction vs test file direction, 27-2files, disconnecting, 13-17files, inverting, 23-5files, normalizing, 23-4interpolation during, 23-1
Equalization curvesarbitrary, 23-3 - 23-4
Equalized bandpass noise, 20-6Equalized mode selection, 9-1Equalized power amplifiers
testing of, 23-1Equalizer testing, 31-2Equivalent power, 10-6Erase
automatic, 11-11Error
branching upon, 25-6
Error file, 24-3 - 24-4attaching, 13-16disconnecting, 13-17summary, 24-2temporarily disconnecting, 13-16
Error messagedata comm, 22-13
Error printout, 15-6Errors
correcting numeric entry, 6-4Even vs odd order intermod testing, 16-3Examining attached file names, 24-2Example tests, 6-1Expansion slots, 3-3Exponential notation, 6-4Exponential sweep settling, 12-3EXT SOURCE SAMPLES in external sweeps,12-6External amplitude sweeps
function, 11-19External clock for digital input, 21-4External device control, 13-18, 25-14External filters, 10-7External frequency sweep
function, 11-19use of low-pass filter during, 11-19
External source sweeps, 11-1External stereo sweeps, 11-20EXTERnal sweep, 11-19, 12-6
creating test signal sources, 11-20direction, 11-3modes, 11-20preparing test tapes for, 12-5reading rate, 10-6recording test tape for, 23-2sources with reference signal preceding, 11-20sources with voice announcements, 11-20stereo, 11-13sweep-erase-repeat mode , 11-20termination of in procedures, 11-20with continuously-varying analog source, 12-6
F
f(V), 21-2f(W), 21-2F/R, 8-5F1 function key, 25-12F10 function key, 25-12
in time measurements, 11-6
35-8 Audio Precision System One User's Manual

F3 function key, 9-3and POST-EQ, 9-3
F4 function key, 10-8priorities, 10-9
F8 key, 11-18F9 Function key, 11-9Factors affecting sample time during time sweeps,11-6Factors affecting speed, 27-1Failure
data comm, 22-13tag, 24-4to overlay images, 11-18to run procedure, 25-1
FAST frequency mode, 9-4Fast graphs, 15-3FASTEST
and speed, 27-4FBP option bandpass filters, 10-7FFT
spectrum analysis of residual distortion, 19-3Fields
multiple choice, 6-4numeric entry, 6-4
File namesacceptable characters, 13-6
File size, 13-7Filling in forms in procedure, 25-13Filter frequency sweeps, 11-3Filter frequency tuning, 10-5Filter socket #1 gains, 10-7Filter switching during sweeps, 12-6Filters, 10-7
bandpass and bandreject, 10-3, 10-5external, 10-7high frequency, 10-7high-pass, 10-7low frequency, 10-7optional, 10-7weighting, 10-7
Fixed degree unit, 8-6Fixed disk computers, 5-1Fixed phase range, 10-4, 11-3Fixed range
analyzer, 10-9Fixed range, dc voltage, 21-2Fixed response
sweep settling , 12-6Flatness
improving, 23-5Floating mode, generator, 9-7Flow control
procedures, 25-5Flutter
in test tapes, 17-5problems in tape testing, 31-5record-keeping for maintenance, 17-4tests in simultaneous record-playback mode, 17-4
Font selectionPostScript laser printer, 15-19
Footswitch control of System One, 21-5Form creation in procedure, 25-13Form feed, manual, 15-4Format disable, printout, 15-3Format, digital input, 21-4Format, digital output, 21-5Formatting diskettes, 5-6, 28-1Formula-based equalization, 23-3 - 23-4Four wire Ohms, 21-2FREQSTEP, 9-4
and bandpass noise, 20-6and bargraph, 14-2
Frequency and amplitude sweeps, 11-16Frequency control modes, 9-4Frequency control, bandpass noise, 20-6Frequency counter, 10-4
architecture, 32-1bandwidth, 11-19low-pass filtering, 32-1
Frequency counter sensitivity, increasing, 10-4,32-1Frequency counter-input channel relationship, 32-1Frequency direction of .EQ file, 23-2Frequency end points of .EQ file, 23-2FREQUENCY function, analyzer, 10-4Frequency increment and decrement, 9-4Frequency limitation, squarewave, 20-5Frequency measurement
of complex signals, 32-1selective, 10-4, 32-1
Frequency modulationtape and disc, 17-1
Frequency range switching, 32-4Frequency recommendation for scrape flutter,17-1 - 17-2Frequency reference, 10-9
setting, 8-4Frequency response
INDEX 35-9

at constant output amplitude, 11-7concepts, 31-1DSP, 19-7measurements, 8-3reference, 10-8
Frequency restrictionintermod testing, 16-2
Frequency settling time, 9-4Frequency sweeps, 11-1Frequency sweeps of filter, 11-3Frequency vs. reading rate, 10-6Frequency, tone burst, 20-1Frequency-amplitude interactions, 9-7Function
of dc voltage, 21-2of external frequency sweep, 11-19of external level sweep, 11-19of resistance, 21-2
Function key listing, 13-14Function monitor output, 32-3Function selection, 10-2Fuse ratings, 4-1
G
Gain and lossconcepts, 31-6measurements, 8-3reference , 10-8
Gain selection of socket #1, 10-7Gain steps
at Monitor Output, 10-10Gap scatter, 18-16Gate control requirements, 20-4Gated burst, 20-1Gated operation, 20-4Gated signal amplitude, 20-3Gated sweeps, 23-2GDL file, 15-6GDL files
vs graphics cursor, 15-6Gen None display, 11-9Gen None sweeps, 11-2Gen Sync output, 32-5Gen-Mon function with separate generator andanalyzer, 4-1Gen-Monitor cable connection, 10-8Generator
auxiliary outputs, 32-5back termination, 9-5
conditions during sweep, 11-2connector pin assignments, 9-6control via bargraph, 14-2control via mouse, 14-2frequency control, 9-4imd mode selection, 9-1inverse amplitude, 11-7load resistance, 8-2, 9-3monitor, 10-8on-off control, 9-5output current capability, 9-3output impedance, 9-5, 9-7
Generator amplitudecalibration vs dual outputs, 9-3changes with different units, 9-2control, 9-2limits in regulation mode, 26-2resolution, 32-4
Generator circuit discussion, 32-4Generator equalization
attaching file name, 13-15Generator frequency
limits in regulation mode, 26-2Generator imd option, 32-4Generator monitor output, 32-5Generator power amplifier, 32-4Generator synch signals, 32-5Generator-based sweeps, 11-3Glide-tone
compact disc player testing, 31-3signal measurement, 11-19testing, 12-7
Go To command, 13-19Go To Statement, 25-6Go/No-Go testing, 24-1GPIB systems, 25-15Graph
labeling vs display mode, 11-7limits, horizontal, 11-3margins for comments alignment, 13-9re-plotting, 11-10title replacement, 13-16
Graph positionPLOT.EXE, 15-9POST.EXE, 15-17
Graph printoutmultiple per page, 15-3
Graph printout with text, 15-3Graph size
35-10 Audio Precision System One User's Manual

control, 15-4PostScript laser printer, 15-17vs quality, 15-4
Graph with comments, 15-3Graph without grid, 15-6Graphic coordinate match for image store, 11-18Graphic cursor, 6-3, 11-9
vs high-resolution plots, 15-6Graphic printout, 15-1
monochrome vs. color, 11-9Graphic resolution limits, 11-4Graphic retrace without plotting, 11-17Graphics system conflict, 5-7Graphing
dc voltage, 11-7digital input, 11-7limits on screen, 11-11, 24-1, 24-3resistance, 11-7
Graphs, 15-3changing units, 11-10fast printout, 15-3
Grideliminating from graph, 15-6
Ground loop noise, 4-1Ground loops, avoiding, 10-8Ground, protective, 4-1Grounded mode, generator, 9-7
H
Halt procedure, 25-12Hangup in sweep testing, 12-4Hard copy graphs, 15-1Hard disk computers, 5-1Hardware reset, 13-18Head height adjustment, 11-15Header
procedure, 25-1Help
editor keys, 13-14function keys, 13-14overlay keys, 13-14
HELP DSP, 13-14Help menu commands, 13-14Hercules
graphics, 11-4monochrome graph resolution, 11-4
Hexadecimal control of digital output ports, 21-7Hexadecimal entry of digital output word, 21-4Hi Bound, 26-2
High Bandflutter modes, 17-1vs conventional flutter measurements, 17-2
High pass filterswitching during sweeps, 12-6
High sensitivity frequency measurement, 10-4High-resolution graphs, 15-6
vs graphics cursor, 15-6Hingh-accuracy frequency control mode, 9-4Hor-Axis, 11-11Horizontal divisions, 11-2Horizontal limits, 24-1HP LaserJet, 15-3
high resolution output, 15-7HP LaserJet III
comments under graph, 15-15necessary command line option, 15-7
HPGL file, 15-12HPIB systems, 25-15Hum in stereo system testing, 9-6, 10-8
I
I/O address, 3-2IBM PC installation, 3-3IEC
flutter standard, 17-4wow and flutter, 17-1
IEEE-488 systems, 25-15If
#, 13-18Above menu command, 13-18Below menu command, 13-18Error menu command, 13-17 - 13-18menu commands, 13-17Noterror Menu Command, 13-18
If statement, 25-6Illustration
PLOT.EXE, 15-12POST.EXE, 15-19
Image Save, 11-10, 11-17Image Store
control keys, 11-18example, 11-18vs memory size, 28-6
Image Store vs Append, 11-18IMD
architecture, 32-3frequency selection, 16-2generator mode selection, 9-1
INDEX 35-11

modes, 10-3option, generator, 32-4power measurements, 16-4
In-phase vs out-of-phase testing, 10-5Incidental amplitude modulation
measurement of, 16-1Incorporating bargraphs in procedures, 14-5Increasing dc voltmeter resolution, 21-5Increment frequency, 9-4Increment-decrement
switcher channel, 18-8Independent units in stereo mode, 11-12Individual harmonic distortion, 10-7, 31-7Input channel connections to meters, 32-1INPUT MONITOR connector, 32-1INPUT RANGE
how to fix, 10-10Input-output
DSP, 19-5Input-output offset
switcher, 18-8Input-output phase, 10-4Inserting messages to operator, 13-19Insertion switchers
in broadcast testing, 22-1Installation
IBM PC, 3-3Instructions to user on bargraphs, 14-5Insufficient memory error, 6-1Interchanging data columns, 13-25Interface card, 3-1
command line options, 28-5error message, 28-5IBM PS/2, 3-1Microchannel bus, 3-1using software without, 28-5
Interference during testing, 10-8Intermod generator
amplitude calibration, 16-2Intermodulation distortion
available measurement units, 16-2frequency restrictions, 16-2frequency selection, 9-4generator mode selection, 9-1signal amplitude calibration, 8-1swept measurements, 16-4testing standards on diskette, 16-2theory, 16-1units, 8-4
Interpolationduring equalized sweeps, 23-1
Interrupt address conflict, 3-2Interrupting procedures, 25-12Interrupting sweeps, 11-9INTERVAL field, 9-7Interval, tone burst, 20-2Invalid buffer size error message, 28-8INVAMP, 11-7Inverse amplitude of generator, 26-6Inverting data files, 13-22
J
JISwow and flutter, 17-1
Jitter measurementssettling for, 12-3
Jumper position vs computer type, PCI-1, 3-2Jumpers, mouse, 3-2Jumpers, PCI-1 card, 3-2Jumping to another procedure, 25-6Jumping to panel fields, 25-10Jumping within procedures, 13-19, 25-6
K
Kelvin connection, 21-2Keyboard
custom, 13-7definition for production test, 13-9limited-function, 21-5
Keyboard input during procedures, 25-6Keypad
numeric, 6-4Keystroke learning process, 13-19Keystroke sequences for control, 13-7Keystrokes on panel
in procedures, 25-2Kilo prefix, 6-4
L
Labels, 13-25Labels in procedures, 25-6Lamp control, 21-7Landscape mode
dot matrix printer, 15-5Laptop computer, 22-3
operation, 22-5speed of operation, 22-11
35-12 Audio Precision System One User's Manual

Large digits, 14-2Laser Plotter, 15-7Laser Plotter software, 15-15Laser printer output, 15-6Laser printers
Pen width for, 15-12LaserJet, 15-3
high resolution output, 15-7LaserJet III
necessary command line option, 15-7LaserWriter
line style vs data, 15-19output, 15-16
Lead dressterminal strip switcher, 18-5
Learn mode, 25-2Learning macros, 13-10LEVEL function, 10-4
performance limitations, 10-4LIB-BASIC, 5-1LIB-C, 5-1LIB-MIX, 5-1Limit file
control of size loaded into memory, 28-7creation of, 24-1delimiters, 24-1direction vs test file direction, 27-2disconnecting, 13-17table, 24-1 - 24-2
Limit in number of steps, 11-3, 11-10Limited-function keyboard, 21-5
definition, 13-7, 13-9re-defining, 13-6
Limitsfor testing, 24-1horizontal, 24-1single-value, 24-1
Limits, graphing on screen, 11-11, 24-1, 24-3Line frequency compatibility, 4-1Line labels, 13-25
in procedures, 25-6Line style
plotter-laser printers, 15-10PostScript laser printer, 15-18
Line voltage requirements, 4-1Linear algorithm for regulation, 26-2Linear sweeps, 11-3Linearity testing, 13-22Linking sub-procedures, 25-7
Lo Bound , 26-2Load
commands, common features, 13-5Comment menu command, 13-5Data menu command, 13-6EQ menu command, 13-6Limit menu command, 13-5Macro menu command, 13-6menu commands, 13-5Overlay menu command, 13-6Procedure menu command, 13-6Sweep menu command, 13-5Test menu command, 13-5Waveform menu command, 13-6
Loading files from any specified directoryAPPEND command, 5-4
Loading output port control with test, 21-7Loading procedures, 25-1Local operation, 13-4Log divisions
significant figures, 11-7Log graph end points, 11-3Logarithmic steps
manual, 9-2Logarithmic sweeps, 11-3Logic control, 21-7Looping upon error, 25-8Loss measurements, 8-3Loudspeaker response smoothing, 13-22Low frequency filter
switching during sweeps, 12-6Low Lvl field, 9-7Low Lvl of burst, 20-3Low pass filter use in external frequency sweep,11-19Low resistance measurements, 21-2Lower limits
attaching, 13-15
M
Macro preparation, 13-9Macros, 21-5
learning, 13-10Main oscillator, 32-4Main Voltmeter, 10-2Mains voltage setting, DCX-127, 4-1Mains voltage setting, SWR-122, 4-1Making limit files, 24-1Making sweep tests, 11-9
INDEX 35-13

Making test tapes for auto-stop, 11-21Malfunction due to mouse interaction, 3-2Manual position
PostScript laser printer, 15-18Manual positioning of plotter graphs, 15-10Master error file, 24-4, 25-15Matching stereo channel amplitudes, 11-15Math co-processor recommendation, 2-1, 27-4Maximizing number of points, 28-7Maximum algorithm, 26-4Maximum indication
bargraph, 14-2MDAC
generator control, 32-4MDAC testing, 21-5MEASURE, 10-2Measured parameter on horizontal axis , 11-16Measurement of two channels, 10-3Measuring generator amplitude, 10-8Memory
allocation of, 28-6increasing amount for DOS by swapping buffers
to disk, 28-9Memory allowance
for BASIC program, 23-3Memory available for DOS
control of, 28-6Memory buffer size control, 28-7Memory control using environment, 28-11Memory requirements, 2-1, 6-1, 28-6
PLOT.EXE, 15-7POST.EXE, 15-17
Menucommand, 13-3PLOT.EXE, 15-8POST.EXE, 15-17
Menu command, 6-1Menu example in procedure, 25-8Menus within procedures, 25-6Merging data, 11-11Messages to operator, 13-19Micro prefix, 6-4Microchannel bus installation, 3-4Microchannel bus interface card, 3-1Microphone testing, 26-1, 26-3Microprocessor
internal LVF, 32-3Microprocessor types, 27-4Milli prefix, 6-4
Min Lvl in external sweeps, 12-6Minimum acceptable delay, 31-4Minimum algorithm, 26-4Mnemonic codes to jump to panel fields, 25-10MODE command, 22-11
serial plotter control, 15-13Mode, printer (table), 15-4Modems, 22-1, 22-6, 22-8MOL
at multiple frequencies, 11-17curves, 11-16testing, 26-1, 26-3, 31-9
Monitor connections, 32-1Monitor Output
AUTO vs fixed range, 10-10generator, 32-5
Monochrome graph resolution, 11-4Monochrome stored image on color displays,11-18Monotonic sweep tables, 11-5Mouse
compatibility, 3-1compatibility vs PCI-1, 29-1conflict, PCI-2 card, 3-2control of stimulus, 14-2functions, 29-1jumpers, 3-2serial, 29-1serial, with PCI-1 card, 29-1two-dimensional, 14-3usage, 29-2
MOUSE.COM, 5-7, 29-2with serial mouse, 29-1
Move but don’t draw, 11-17Moving data between buffers, 13-11Moving the cursor, 6-1, 6-4Multi-track
example error file, 18-15frequency response, 18-13gap scatter, 18-16recorder crosstalk, 18-16recorder noise, 18-15tape machine switcher example, 18-12tape recorder alignment, 14-2
Multiple choice fields, 6-4Multiple command line options, 22-13, 28-4Multiple graphs on page
plotter or laser printer, 15-10PostScript laser printer, 15-17
35-14 Audio Precision System One User's Manual

Multiple graphs per page, 15-3Multiple sweeps, 11-10Multiple-track CD player testing, 31-3Multiplex stereo testing, 9-5Multiplicative amplitude steps, 9-2Musical tone values, 8-5
N
NABflutter standard, 17-4wow and flutter, 17-1
NamesClear menu command, 13-17Delta menu command, 13-17Err-File menu command, 13-16GEN-EQ menu command, 13-15Lower menu command, 13-15menu commands, 13-14Off menu command, 13-16Program command, 19-5Rename menu command, 13-17Sweep menu command, 13-15Title menu command, 13-16Upper menu command, 13-15
Nano prefix, 6-4Nested sub-procedures, 25-7Nested sweep, 11-16
limitations, 11-17panel setup, 11-16
Nesting switcher scans, 18-10No-display mode, 11-9Noise
amplitude calibration, 20-5bandwidth, white, 20-5crest factor, 20-5generation hardware, 32-5in stereo system testing, 10-8in unbalanced systems, 9-6increase with fixed range, 10-10problems due to computer crt monitor, 30-1reduction by averaging, 12-2 - 12-3rejection, frequency counter, 32-1sweep to detect problem sources, 30-1waveforms, 9-1
Non-conversion between relative and absoluteTHD+N units, 8-4Normal algorithm, 26-3Normal mode rejection vs reading rate, dcvoltage, 21-2
Normalizing data files, 13-20Normalled-through connection, 18-2Notch filter
frequency control , 10-5Notch mode, 10-3Null modem, 22-5Nulling adjustments, 14-1Num Lock key, 6-3 - 6-4Number of data points
maximizing, 28-7Number of points in .EQ file, 23-2Number of steps recommended, 11-4Numeric display of exact graphic values, 11-9Numeric entry fields, 6-4Numeric keypad, 6-4
O
Occupied bandwidth testing in amplitudemodulation broadcast systems, 20-6Octal control of digital output ports, 21-7Octal entry of digital output word, 21-4Octaves, 8-5OFF level, generator, 9-5Off-screen operation of bargraph, 14-2Offset
switcher, 18-8Offsetting
dc measurements, 21-2dc voltage measurements, 21-2resistance measurements, 21-2
Offsetting data for use as limit file, 24-3One-third octave filter, analyzer, 10-3One-third octave frequency steps, 9-4Operator input during procedures, 25-6Operator prompt, 25-12Operator test selection in procedure, 25-8Optimum detector selection, 10-6Optimum sweep direction, 11-3Oscilloscope monitoring, 32-1Output circuitry
generator, 32-4Output configurations, generator, 9-6Output impedance, generator, 9-7Outputs via printer port, 13-18Over-riding page feed after graphic printout, 15-3Over-writing files, 13-6Overall sweep speed, 27-2Overlay files, 25-10Overlay to control output port, 21-7
INDEX 35-15

Overlays, 25-10Overload
with fixed analyzer ranges, 10-10Overload, generator, 9-3
P
P121, P421, 3-2P321, P322, P323, P324, 3-2Packets, 22-3Page feed
from laser printer, 15-10Page feed after graph, 28-10Page Up and Page Down keys, 12-2Panel
exchange via PgUp, 12-2for nested sweep, 11-16menu command, 13-3printout, 15-6return to original default, 12-2selection, 12-2setups in procedures, 25-9
Panel fieldsjumping to, 25-10
Parallel port control, 25-14Parameter passing, 13-6, 13-8, 25-10Parity, 22-11Parts per million, 8-4Pass/Fail testing, 24-1Passed parameters, 13-6Patch point switcher, 18-1 - 18-2
channel selection, 18-7description, 18-2in broadcast testing, 22-1
Path name, 11-5Pause
during sweeps, 11-9during time measurement, 11-6for operator action, 25-12in procedures, 25-12until external event, 13-19
PCI card installation, 3-2PCI-1 card, 3-1PCI-2 card, 3-1PCI-3 card, 3-1PCI-3 card installation, 3-4Peak equivalent sinewave, 10-6
measurements, 16-4Peak hold
bargraph, 14-2
in Peak and Q-Pk mode, 10-6Peak sensitive autoranging, 10-8Peaking adjustments, 14-1Pen plotter output, 15-6Pen vs data
plotter, 15-10Pen width for laser printers, 15-12Performance check, 6-1Phase
input-output, 10-4PHASE function, 10-4Phase inversion
generator, 9-5testing for, 10-5
Phase jitter measurementssettling for, 12-3
Phase meter hardware, 32-1Phase plots during sweeps, 11-3Phase range
fixed, 11-3Phase test for CD player, 31-3Phono equalization, 23-1, 23-3Phototypesetter compatibility, 15-20Pink noise generation hardware, 32-5Pink noise mode, 20-6Pink vs white noise, 20-5Pixel mapping, screen to printer, 15-4Playback-only tape machine
testing, 31-5testing in stereo, 11-13
PLOT, 15-7illustration, 15-12memory requirements, 15-7menu, 15-8position of graph, 15-9
Plot execution, 15-12Plotter
size control of graph, 15-9Plotter in a Cartridge, 15-7Plotter output, 15-6Plotter pen selection, 15-10Plotting
data onto stored image, 11-18dc voltage, 11-7digital input, 11-7generator amplitude, 11-7later, 15-13one variable with two sensitivities, 11-10resistance, 11-7
35-16 Audio Precision System One User's Manual

two measured variables against one another, 11-16vs. measured parameters, 11-16
Points vs bytes, data editor, 28-7Polarity testing, 10-5Polarity units, 8-6Port A,B,C, 21-7Portrait mode
dot matrix, 15-6Portrait vs landscape
dot matrix printer, 15-5Position of graph
POST.EXE, 15-17Position, graph
PLOT.EXE, 15-9POST, 15-16
Illustration, 15-19memory requirements, 15-17menu, 15-17
POST-EQ field, 9-2, 23-1Postscript files
Encapsulated, for import to Ventura, 15-20PostScript laser printer, 15-16
line style vs data, 15-19Power
at constant distortion, 26-1constant, 8-2in intermodulation measurements, 16-4units, 8-4
Power amplifiergenerator, 32-4
Power bandwidth measurements, 26-1, 31-9Power dissipation
input termination resistors, 10-8Power measurement, 10-9
dBm, 8-2Power tests
constant, 31-9PPM unit, 8-4Pre- vs de-emphasis, 23-4Pre-emphasis, 23-1, 23-3, 31-3Prefixes
numeric, 6-4, 9-2Preserving values from test to test, 25-10Principal voltmeter, 10-2Print format over-ride, 15-3Print size vs quality, 15-4Print speed vs quality, 15-4Printer mode table, 15-4Printer options at start-up using environment,
28-11Printer port as output port, 25-14Printing
bargraphs, 14-5, 15-6comments under high-resolution graphs, 15-15error file upon failure, 13-17errors at test conclusion, 13-16in a procedure to HPGL plotter or HP LaserJet,
15-13in a procedure to PostScript laser printers, 15-20the panels, 15-6
Printing upon error, 25-7Printout
size control, 15-4tabular, 15-6
Procedurehalt until external event, 13-19termination of external sweep during, 11-20
Procedure Buffer Empty or Invalid error message,25-1Procedure program flow control, 25-5Procedures
appending to bottom of existing procedure in UtilLearn mode, 25-2
branching, 25-6example, 25-2failure to run, 25-1filling in a form, 25-13generation, 25-2header, 25-1keystrokes on panel, 25-2keystrokes on panel during, 25-9learning keystrokes, 25-2listing with comments, 25-5loading, 25-1looping upon error, 25-8printing upon error, 25-7
Processed signal output connector , 32-3Programming System One via LIB-C orLIB-BASIC, 5-1Prompt message
failure to display due to semi-colon, 25-5on bargraphs, 14-5to operator, 13-19, 25-12
Proof of performanceat constant modulation, 26-1testing, 26-6, 31-2tests, 22-1
Protected fields, 13-6, 13-8, 25-10
INDEX 35-17

PS/2 installation, 3-4PS/2 interface card, 3-1Pseudorandom noise, 20-5
generation hardware, 32-5waveforms, 9-1
Punched-out field, 25-10 - 25-11appearance, 28-9
Push-to-set-0 dB reference, 8-3
Q
Quality vs size, printout, 15-4Quantization distortion, 31-10
above theoretical floor, 8-3, 10-9Quit at carrier loss
automatic, 22-12QUIT menu command, 13-3
R
Ram disk, 27-3Random noise, 20-5
waveforms, 9-1Random noise generation hardware, 32-5Range
analyzer, 10-9AUTO vs fixed, 10-11
Range switchingfrequency, 32-4
Range, dc voltage, 21-2RATE, digital input, 21-4Rate, DSP, 19-6Ratio unit, 8-4Ratio vs absolute units, 10-3RDAT THD+N vs frequency, 19-3Re-plotting graphs, 11-10Re-transmission
attempts, 22-12data comm, 22-4
READING meter rangeanalyzer, 10-9
READING Monitor Output, 32-3AUTO vs fixed range, 10-10
READING RANGEhow to fix, 10-11
Reading rate, 10-6control of analyzer, 10-6dc voltage, 21-2switching during sweeps, 12-6vs accuracy, 10-6
vs resolution, dc voltage, 21-2vs. frequency, 10-6
Reading Voltmeter, 10-2Recommendation for number of steps, 11-4Recommended sweep settling parameters, 12-3Record head azimuth adjustments, 31-13Recording keystrokes, 13-19Recording test tapes, 31-5Reference
phase, 10-4Reference tape testing, 31-5Regulation mode
algorithms, 26-2concept, 26-1panel, 26-2sample test, 31-2, 31-9tolerance, 26-4
Rejection filter, 10-3Relative dB, 8-3, 10-8Relative vs absolute distortion units, 8-4, 11-7Relay control, 21-7Remember the reference, 8-3Remote control
operation, 13-4, 22-1 - 22-2operation, arming, 13-4system architecture, 22-1
REMOTE filesviewing and editing, 22-13
REMOTE operationsequence of actions, 22-7 - 22-8
REMOTE/LOCAL, 22-2Repeated sweeps, 11-11Repeating upon error, 25-8Reproduce head azimuth adjustments, 31-13Reset, 13-18
of bargraph peak hold, 14-2Reset of external devices, 21-6Residual distortion
spectrum analysis, 19-3Resistance measurement, 21-1 - 21-2
low, 21-2Resistance plots, 11-7Resolution
dc voltage, 21-2generator amplitude, 32-4graphic, 11-4increasing (dc voltmeter), 21-5limits, analog control of stimulus, 14-2
RESOLUTION on sweep settling panel, 12-2
35-18 Audio Precision System One User's Manual
Restoring punched-out fields, 25-11Return from sub-procedure, 25-7Return key equivalent in procedure edit mode,25-5Returning from sub-procedures, 13-5Returning from XDOS, 13-3Reverse termination
generator, 32-4RIAA equalization, 23-1, 23-3RMS detector use, 10-6Roundoff in burst units, 20-1RS-232, 22-1
cable for null modem, 22-5mouse, 29-1port number, 22-12port on PCI-2 card, 3-1, 29-1
RS-232 version System One, 22-3Run
Call, 25-6Call menu command, 13-4Exit, 25-6Exit menu command, 13-5Graph menu command, 13-4Local, 22-13Local menu command, 13-4menu commands, 13-4Procedure menu command, 13-4Remote, 22-13Remote menu command, 13-4Slave menu command, 13-4Slave, automatic, 22-12Test menu command, 13-4
Run-up time testing, 21-7Running sweep tests, 11-9
S
S version System One, 22-3S-Pk detector, 10-6, 16-4S1 /F, 28-10S1 /L, 28-4S1.EXE, 5-1Sample rate
digital input, 21-4for noise measurements, 12-6in external sweeps, 12-6
Sample rates, DSP, 19-6Sample times, 11-5Samples for averaging, 12-3Satellite link tests, 12-4
Saturated output level, 26-4Save
commands, common features, 13-6Comment menu command, 13-7Data menu command, 13-7EQ menu command, 13-8Graphic menu command, 13-8Graphics, 15-6Limit menu command, 13-7Macro menu command, 13-7menu commands, 13-6Overlay menu command, 13-8Procedure menu command, 13-7Sweep menu command, 13-7Test menu command, 13-7Waveform menu command, 13-8
Saved Image Not Compatible With GraphicsMode, 11-18Saving configurations
PostScript laser printer, 15-19Saving data
during procedures, 25-15from virtual disks, 27-3
Scalingdc measurements, 21-2dc voltage measurements, 21-2resistance measurements, 21-2
Scanning switchers, 18-9Scientific notation, 6-4Scrape flutter, 17-1
detector type, 17-2secB unit, 20-1 - 20-2Second harmonic distortion, 10-7SELECT.PRO, 6-1Selecting measurements for display, 11-6Selection via mouse, 29-2Selective frequency measurement, 10-4, 32-1Selective voltmeter, 10-3Semi-colon
use of in procedures, 25-5Sensitivity of stimulus control in bargraph mode,14-3Separation reference, 10-8Separations, color
HP LaserJet, 15-13HPGL plotter, 15-13PostScript plotter, 15-19
Sequence of generator configuration changes, 9-8Serial mouse, 29-1
INDEX 35-19

via PCI-2 card, 3-2with PCI-1 card, 29-1
Serial number storage of data, 25-16Serial port, 29-1
enable, PCI-2 card, 3-2number, 22-11 - 22-12
Service bureaucompatible output, 15-20
Set-up, plotter-laser printersaving, 15-12
Setting dBr reference, 8-3Setting frequency reference, 8-4Settling
delay, 12-4delay, minimum, 12-5during time sweeps, 11-6in dBr REF setting, 10-9parameters for system flatness calibration, 23-5time, 12-1
Settling Delay , 12-4SETTLING DELAY in EXTERNal level sweeps,31-11Settling delay output, 21-6Settling on sweep settling panel, 12-2Settling time
frequency, 9-4Setup panel printout, 15-6Shift F9, 11-20Short slot compatibility, 3-3Short-distance remote operation, 22-5Signal processor testing, 11-17Signal to noise ratio
concepts, 31-6measurements, 8-3reference, 10-8test, 31-6
Simplifying system start-up, 28-1Simultaneous display of two channels, 10-3, 11-15Simultaneous record-playback flutter, 17-4Sine burst
amplitude, 9-7units, 8-6
Sine gated mode, 20-4Sine trigger
mode, 20-3polarity, 20-3
Sinewave burst hardware, 32-4Single diskette computers, 5-6Single point measurement, 11-2 - 11-3
Single-value limits, 24-1Size
file, 13-7graph from PostScript laser printer, 15-17high-resolution graphs, 15-9
Size field, digital generator, 19-7Size vs quality, printout, 15-4Size, graph printout, 15-4Smoothing data, 13-22SMPTE
IMD amplitude ratios, 16-1IMD concepts, 31-7IMD low tone selection, 9-4IMD testing, 16-1
SMPTE IMD architecture, 32-3Socket #1 gain selection, 10-7Software, 5-1
compatibility, 5-7SOL testing, 26-1, 26-4Source-2, 11-11Spacing between steps in external sweeps, 12-6SPDIF digital audio format, 19-3, 19-7Specific frequency steps, 11-4Spectral noise distribution
multi-track recorder, 18-15residual noise, 30-1
Spectrum analysis, 11-2of SMPTE IMD, 32-3
Speedand FASTEST, 27-4in EQSINE mode, 27-2of testing, 27-1per step, 27-1remote operation, 22-11sweep, 12-6, 27-2tabular printout in procedures, 15-6vs autorange, 10-10with equalization, 23-2with limits testing, 24-3, 27-2
Split site systemscabling required, 4-1
Split-siteoperation, 22-1sequence of actions, 22-7 - 22-8
Spot measurement, 11-3Squarewave, 9-1
amplitude calibration, 20-5generation hardware, 32-5mode, 20-5
35-20 Audio Precision System One User's Manual

Standardized start-up conditions, 28-3Standardizing data files, 13-20Start-up control using environment, 28-11Starting
external device during time sweep, 21-7System One, 5-6with a procedure running, 28-4with a test loaded, 28-4with last test used, 13-3, 28-4
Status bytes, AES-EBU, 19-7STD.TST file, 28-3Step number recommendations, 11-4Step size, 11-3Steps
maximum number of, 11-3, 11-10Stereo
bargraphs, 14-2channel exchange, 11-12external sweeps, 11-13, 11-20multiplex testing, 9-5preamp switching example, 18-11
Stereo mode, 11-11 - 11-12data display, 11-12
Stereo testsBPBR filter-based, 11-12generator-based, 11-12with switcher scans, 11-12
Stereo units selection, 11-12Stop bits, 22-11Stop procedure, 25-12Stopping external frequency sweeps in procedure,11-20Stored image
vs memory size, 28-6Storing DSP waveforms to disk, 13-8Strobe, digital input, 21-4Style
lines on plotter-laser printer graph, 15-10lines on PostScript laser printer, 15-18
Sub proceduresnesting, 25-7
Sub-procedures, 13-4, 25-6Subdirectories
storing data in, 25-16Subtracting data files, 13-24Subtracting files, 13-17Successive sweeps in stereo mode , 11-12Summary error files, 24-4SWEEP (F9) DEFINITIONS PANEL, 11-1
Sweep filecontrol of size loaded into memory, 28-7
Sweep gate output, 21-7SWEEP SETTLING, 12-1
auto/fixed response, 12-6DELAY, 12-4graphic explanation, 12-3panel, 12-2panel reproduction, 12-2parameters recommended, 12-3TIMEOUT, 12-4
Sweep table filesattaching, 13-15creation of, 11-4disconnecting, 13-17monotonicity requirement, 11-5
Sweep trigger, 21-7Sweep without erasing old data, 11-10Sweep-erase-repeat
mode not functional, 11-11vs memory size, 28-6
Sweeping switchers, 18-9Sweeps
direction in external sweep, 11-3display of distortion units, 11-7DISPLAY selection, 11-7gated, 23-2limit to number of steps, 11-3measurement parameter selection, 11-6multiple, 11-10nesting, 11-16number of steps, 11-3shape, 11-3speed, 11-3start and stop points, 11-3step limitations, nested sweep, 11-17step size, 11-3table-based, 11-4table-based, setup of, 11-5useful graphic limit in number of steps, 11-4vertical axis control, 11-7with external signals, 11-2
Swept dc output, 21-3Swept digital output, 21-5Swept intermod tests, 16-4Swept measurement plotting conventions, 11-6Swept signal measurement, 11-19Switcher
ac voltage setting, 4-1
INDEX 35-21

address limitations, 18-7addressing, 18-7channel selection, 18-8commonalities, 18-1complement mode, 18-8control panel, 18-8input, 18-1maximum channel number, 18-1offset, 18-8output, 18-1patch point, 18-2
SYNC output, 32-5Synch signals available, 32-5Synchronizing
signal outputs, 21-6start of signal to time sweep, 21-7triggered bursts with measurements, 21-6with pseudorandom noise, 12-6
SYS-20 and SYS-02 unitscabling required, 4-1
SYS-200 series, 19-1, 19-3SYS-300 series, 19-1, 19-3SYS22CK.PRO, 6-1System flatness
improving, 23-5System interaction problems due to mouse, 3-2System One software, 5-1System reset, 13-18
T
Tin graphs, 12-4timeout flag, 12-4
Tablesweep, 11-4
TABLE printout, 15-6Tabular display, 11-9Tabular printout, 15-1, 15-6Tape head azimuth adjustments, 31-13Tape MOL testing
at multiple frequencies, 11-17Tape player testing, 31-5Tape recorder
azimuth adjustments, 11-3distortion testing, 31-9response testing, 31-4simultaneous record-playback tests, 12-4testing, 12-5, 31-4, 31-9
Tape speed error, 8-5
Target for bargraph adjustment, 14-2Temporary file
PLOT.EXE, 15-8POST.EXE, 15-17
Terminal strip switcher, 18-5connections, 18-5jumper locations, 18-5
Terminating keystroke recording, 13-19Terminating procedure upon failure, 13-17Termination, input, 10-8Test data management, 25-15Test examples, 6-1Test loading speed, 27-4Test time reduction via FASTEST, 27-4Test without erasing old data, 11-10Testing regulation setup panels, 26-5Testing with analog sweeps, 12-7Testing with limits, 24-3Text editor, 13-11, 13-14Text fonts
POST.EXE, 15-19Text printout below graph, 15-3THD vs THD+N, 31-7THD+N architecture, 32-3THD+N mode, 10-3THD+N readings in dBr units, 10-9Third bargraph, 14-3Third harmonic distortion, 10-7Third octave filter, analyzer, 10-3Third-octave frequency steps, 9-4Three head tape recorder response testing, 31-4Tic mark control, 11-2Tic marks, vertical, 11-7TIM
IMD concepts, 31-8intermod theory, 16-1
Time between burst, 20-2Time chart of wow and flutter, 17-5Time delay
determining, 12-5in procedures, 13-19, 25-13unit tests, 12-4when F4 pressed, 10-9
Time measurement sampling intervals, 11-5Time required to range, 10-10Time sweep, starting external device during, 21-7Time sweeps, settling, 11-6Time-based measurements, 11-1Timeout, 12-4
35-22 Audio Precision System One User's Manual

data comm, 22-4, 22-12flag in data, 12-4flag printout, 15-6for 300 baud, 22-4
TOLERANCE on sweep settling panel, 12-2Tone burst, 9-1
amplitude, 9-7, 20-3amplitude resolution, 20-3control panel, 9-7frequency, 20-1interval, 20-2sweeps, 11-1switching phase, 20-1units, 8-6
Total harmonic distortion vs total harmonicdistortion plus noise, 31-7Transfer between buffers, 13-11Transformer output
generator, 32-4Transient
at Monitor Output connectors, 10-10Transposition of cables
testing for, 10-5Trigger
output, 21-6polarity, 20-3
Trigger delay output, 21-6Triggered burst, 20-1
amplitude, 20-3Triggered sine mode, 20-3Twin-tone intermod theory, 16-1Two’s complement format
digital input, 21-4digital output, 21-5
Two-character codes, 25-10Two-dimensional mouse, 14-3Two-head tape recorder
distortion tests, 31-10testing, 31-5
Two-wire Ohms, 21-2Type faces
POST.EXE, 15-19Type font selection
PostScript laser printer, 15-19Typesetter compatibility, 15-20Typing in filenames during procedure generation,25-2
U
Unbalanced cables, 9-6, 10-8Unbalanced output, 9-6Units
AMPSTEP, 9-2user-assigned, 13-16
Units of measureintermod testing, 16-2
Unmanned station testing, 22-1UNREGULATED flag printout , 15-6Unregulated readings, 26-4Upper limits, attaching, 13-15USASI noise, 20-6User prompts on bargraphs, 14-5User-assigned units, 13-16User-selected default conditions, 28-3User-written programs, 5-1Using the mouse, 29-2Util
Break menu command, 13-19Delay menu command, 13-19End menu command, 13-19Feed, 15-4Goto, 25-6Goto menu command, 13-19Invert, 13-20Learn, 25-2Learn menu command, 13-19Message menu command, 13-19Normalize, 13-20Out menu command, 13-18Out to ports A,B,C, 21-8Prompt menu command, 13-19Restore menu command, 13-18SERIAL-DSP menu command, 13-20Wait menu command, 13-19
Utility menu commands, 13-18
V
V command line option, 25-12VCA testing, 21-3VDISK.SYS, 27-3Ventura Publisher
PLOT.EXE, 15-12POST.EXE, 15-20
Version 1.60 softwaremouse compatibility, 3-2
Vertical division marks, 11-7
INDEX 35-23

Video appearance of punched-out fields, 28-9Video attributes, 25-11Virtual disk, 27-3Voice announcements on reference tapes, 11-20,31-5Voltage ratio unit, 8-4Voltage-controlled amplifier testing, 21-3Voltmeter-input channel relationship, 32-1Volts p-p, 8-1Volts rms, 8-1
W
Warm boot, 28-2Watts, 8-4Watts reference, 10-9Wave analyzer, 10-3Waveform display
burst, via DSP, 19-3Waveform selection, 9-1Weighting filter
wow and flutter, 17-1White noise
bandwidth, 20-5mode, 20-5
White noise generation hardware, 32-5White vs pink noise, 20-5Wide lines
plotter-laser printer, 15-11Wideband flutter, 17-1Worst-case crosstalk, 18-16Wow and flutter
2 sigma, 17-6bandwidth, 17-2displays, 17-5modes, 10-3test frequencies, 17-2theory, 17-1
Wow and flutter architecture, 32-3Writing messages into error files, 13-19Writing to output port during procedures, 21-8
X
X-Y plots, 11-16X/Y unit, 8-4, 20-3XDOS
menu command, 13-3returning from, 13-3
Xerox Ventura Publisher
PLOT.EXE, 15-12POST.EXE, 15-20
XLR hot pin, 9-6
35-24 Audio Precision System One User's Manual